Embed Size (px)
Citation preview
Modelling effects of particle size and pipe gradient on sand transport in multiphase pipes
R. Tebowei, M. Hossain, G. Oluyemi & S. Islam School of Engineering, Robert Gordon University, UK
Abstract
Multiphase flow is important in many industrial processes such as sand transport in multiphase pipeline during petroleum production process. The interactions of sand and liquid exhibit complex flow characteristics including undesired deposition of sand in pipe. This study presents a three-dimensional (3D) computational fluid dynamics (CFD) modelling of horizontal and V-inclined multiphase pipe flow of liquid and sand for predicting sand transport flow regimes and minimum sand transport velocity (MTV) using the two-fluid Eulerian–granular modelling approach. This work presents precisely selected closure models which account for stresses due to kinetic and collisional inter-particle interactions based on the kinetic theory of granular flow and frictional stress due to inter-particle interaction in stationary sand bed regime by the addition of solid friction pressure models. The simulations were performed for particle size ranging from 38 to 255 µm and 0.1 m diameter horizontal and V-inclined pipes in order to investigate the effect of particle size and pipe gradient on sand transport. The present study shows that particle size and pipe gradient have significant effect on liquid turbulence intensity and sand concentration distribution in pipeline. The predicted results show sand accumulates in the dip of the V-pipe which increases with increase in pipe gradient. The sand deposition varies in the V-pipe due to the pipe orientation, with a lower deposition at the pipe outlet when compared with the horizontal pipe flow at the same flow velocity and particle size. The predicted results show good agreement with experimental data obtained from literature for horizontal pipe flow. Keywords: Eulerian–granular model, sand transport flow regime, deposition velocity, turbulence intensity, particle size, sand concentration, V-inclined pipe, pipe dip, stationary sand bed.
WIT Transactions on Engineering Sciences, Vol 89, www.witpress.com, ISSN 1743-3533 (on-line)
© 2015 WIT Press
doi:10.2495/MPF150281
Computational Methods in Multiphase Flow VIII 323
1 Introduction
Advances in offshore technology in petroleum industry have resulted in development of many subsea wells for crude oil and natural gas recovery from subsurface reservoirs [1]. Sand is often produced with the hydrocarbon during production, particular from sandstone reservoirs. A mixture of the produced sand and crude oil is usually transported simultaneously in subsea multiphase flowlines which run along seabed undulating terrain to production platforms for processing [2, 3]. Subsea flowlines often comprise horizontal and V-inclined pipes due to seabed topology and riser connection [4]. The sand in the flow stream may deposit in the pipeline due to complex flow characteristics of the mixture and the effect of the pipe inclination which may cause flow assurance problems such as pipeline blockage, erosion and corrosion induced by stationary sand bed environment, particularly at the pipe dip where pipeline leaks tend to occur [2, 5, 6]. These problems can severely impede production or cause loss of containment from pipeline leaks, and eventually result in economic risks [7]. Therefore, it is important to ensure the multiphase pipeline is operated such that sand deposition is controlled. The possibility of sand depositing in pipeline depends on the mixture flow regimes, which in turn depends on the flow velocity and hydrodynamic interactions of sand and liquid, particle-particle and pipe wall interactions [8]. These interactions may cause sand particles to distribute evenly and move suspended in the carrier liquid as homogeneous flow regime at a sufficiently high flow velocity, segregate in suspension as heterogeneous flow or settle out and deposit on the pipe bottom at a reduced flow velocity leading to formation of moving sand bed or stationary sand bed in different locations in the pipeline due to particle size, sand concentration, fluid properties, gravity effect and pipe orientation [9]. The transition velocity demarcating these flow regimes is an important parameter that should be accurately known to optimize pipeline design [10]. Any transition in these flow regimes may be considered critical, depending on the operation requirements [3]. The definition of critical or minimum transport velocity has been taken as different meanings by different authors [7, 11]. Durand [12] developed an empirical model for solid critical transport velocity and defined critical velocity as the “limit deposit velocity” which corresponds to the appearance of a stationary solid bed deposit on the bottom of a pipe. Oroskar and Turian [13] developed a semi-mechanistic model for solid critical transport velocity based on force balance required for homogeneous suspension of particles with the dissipating energy of turbulence eddies and defined the critical velocity as the “minimum velocity” required to keep all the sand particles in homogeneous suspension. Thomas [14] developed a semi-mechanistic model for critical transport velocity based on force balance and defined critical velocity as the “minimum transport velocity” at which a layer of stationary or sliding particles appears at the bottom of a horizontal pipe. Comparative studies performed by Hill et al. [15] and Soepyan et al. [6] showed that the critical transport velocities predicted by these models and others
WIT Transactions on Engineering Sciences, Vol 89, www.witpress.com, ISSN 1743-3533 (on-line)
© 2015 WIT Press
324 Computational Methods in Multiphase Flow VIII
differ by several orders of magnitude at the same operating condition. One of the reasons attributed for the differences in the values of critical velocity predicted by the models was the unique transport conditions applied in the developed models. The critical velocity definitions of Thomas [14] and Oroskar and Turian [13] have been used in oil and gas industry application [16]. However, Thomas [14] model does not show any dependence on input solid concentration, and it may be vague for numerical modellers to ascertain the condition or velocity at which a layer of stationary solid particle is formed at the bottom of a pipe. Therefore, the definition of critical deposition velocity of Oroskar and Turian [13] is adopted in the analysis of the CFD results in this work for minimum transport velocity for particle suspension and definition of Durand [12] is adopted for minimum transport velocity for stationary sand bed at pipe bottom. All the existing models for solid critical transport velocity are developed based on horizontal, downward and upward inclined pipes, without considering effect of seabed valley on subsea pipeline inclination which creates a V-inclined pipe segment. This pipe segment comprises of downhill, dip and uphill sections. The dip couples the effects of the downhill and uphill sections forming a complex pipe geometry which strongly affects sand transport characteristics differently from those in horizontal, downward and upward inclined pipes [16]. Studies by Al-lababidi et al. [7] and Danielson [2] showed that sand transport velocity and sand hold-up in liquid–sand flow in -1.35o, +5o, +4o, and +1o
inclined pipes are similar to horizontal pipe flow. However, Tippet and Priestman [17] found in their experimental study that V-inclined pipe with small gradient ( 1 6 of a typical representative of gradient on seabed have significant effect on sand mobility in the three sections of the V-pipe. This effect of V-pipe on sand mobility is caused by the secondary flow induced in the flow by the pipe curvature at the dip of the V-pipe [16]. Several studies have been performed by Issa and Kempf [18], Al-Safran et al. [19], and Zheng et al. [20–21] on flow in undulating pipeline with a V-inclined pipe section. However, these studies focused on gas-liquid multiphase flow regime without a sand phase. Investigations on sand transport in V-pipe are limited, particularly for V-pipe with small gradient. The few studies on sand transport in V-pipe performed by Yan et al. [16] and King et al. [22] are experimental; the steepness of the 24o gradient V-pipe considered in the study by Yan et al. [16] does not seem a representative of typical gradient on seabed topology. A critical review of literature has revealed that there is no existing published CFD study on sand transport in V-pipe, particularly for low gradient V-pipe. Therefore, the aim of this work is to use CFD approach to study sand transport in V-pipe in order to predict and improve the understanding of sand transport behaviour and flow regimes in V-inclined pipe of subsea pipeline and other related V-inclined pipe applications. The CFD approach offers the advantage of providing more detailed and comprehensive information that may be difficult to obtain experimentally.
WIT Transactions on Engineering Sciences, Vol 89, www.witpress.com, ISSN 1743-3533 (on-line)
© 2015 WIT Press
Computational Methods in Multiphase Flow VIII 325
2 Mathematical model
The CFD model used in this work is based on Eulerian–granular model which assumes the sand and liquid phase are separate yet they form interpenetrating continua and uses the kinetic theory of granular flow (KTGF) model for the particles interactions. The reason for incorporating the granular model is that it allows for taking collision and friction stresses between particles into account which is very important for modelling stationary sand bed regime. The continuity, momentum and constitutive equations are described below: Continuity equation:
α ρ ∙ α ρ ν 0 (1)
Momentum equation for sand phase: ∂∂t
α ρ ν ∙ α ρ ν ν α ∙ τ̅ α ρ g
∑ K ν ν m ν F F , F , F (2)
where α is the concentration of each phase, ρ is the density, ν is the velocity
vector, g is the acceleration due to gravity, P is the pressure gradient, and τs is the solids stress tensors. The solids stress tensor can be expressed in terms of the
solid pressure,τs, bulk solid viscosity, λs and shear solid viscosity, μs, given as:
τ̅ P λ ∙ µ I µ µ µ ∙ µ I (3)
The solid pressure P is given by Lun et al. [23] as:
P ρ α Θ 2ρ α Θ 1 g , (4)
where Θ is the granular temperature which accounts for the fluctuating kinetic energy of the solid phase. The bulk solid viscosity λ accounts for the resistance of the solid against compression, given by Lun et al. [23] as:
λ α ρ d g , 1Θ
π (5)
where d is the sand particle diameter, is the restitution coefficient for particle collisions, which describes the change of kinetic energy during collision. The value for is specified as 0.9 in this work. The radial distribution function g , accounts for the probability of a particle touching another particle. The radial distribution function model by Lun et al. [23] is used, expressed as:
g , 1 ,
(6)
where, α , is the maximum packing limit for particles, specified as 0.63 in this study for mono-dispersed particles.
WIT Transactions on Engineering Sciences, Vol 89, www.witpress.com, ISSN 1743-3533 (on-line)
© 2015 WIT Press
326 Computational Methods in Multiphase Flow VIII

2.1 Inclusion of friction stress model
The solid shear viscosity µ is modeled by addition of frictional viscosity term to the kinetic and collisional viscosity terms, presented as:
μ μ , μ , μ , (7) where μ , and μ , are kinetic and collisional viscosity respectively. The
added frictional shear stress viscosity μ , accounts for long term particles interaction present at high particle concentration during stationary sand bed regime. The frictional viscosity μ , is incorporated when the sand packing fraction exceeds the friction limit specified as 0.5, at which kinetic theory assumption of instantaneous collision gives way to frictional particle interaction. The contributions of the shear viscosities due to kinetic and collisional interactions of particles to the solid shear viscosity are calculated based on the models by Syamlal and O’Brien [24] and Gidaspow et al. [25], respectively.
μ , 1 1 3 1 α g , (8)
μ , α ρ d g , 1 (9)
and the frictional viscosity, μ , is then related to the solid frictional pressure P using the Schaeffer [26] model, expressed as:
μ , (10)
where ϕ is internal friction angle specified as 300 in this study, Ι is the second invariant of the deviatoric strain rate tensor for solid phase and P is the solid frictional pressure which replaces the kinetic theory solid pressure,P model of Lun et al. [23] when the interaction between particles becomes predominantly of a frictional nature at the specified 0.5 sand friction packing limit. The Johnson and Jackson [27] frictional solid pressure P model is used in this study, given as:
P F ,
, (11)
where coefficientsF 0.1α , n=2 and p=5, α , is the minimum solid volume fraction friction limit specified as 0.5.
2.2 Interphase interaction forces
2.2.1 Drag force The interphase momentum transfer due to drag between the sand and liquid phase is described by the drag force in the momentum equation as:
F K ν ν (12)
where K is the exchange coefficient between solid and liquid phase expressed as:
k C (13)
WIT Transactions on Engineering Sciences, Vol 89, www.witpress.com, ISSN 1743-3533 (on-line)
© 2015 WIT Press
Computational Methods in Multiphase Flow VIII 327
The drag force exchange coefficient k in this study is modelled using Gidaspow et al. model [25] approach, which uses a combination of Ergun model [28] when α 0.2 and Wen and Yu model [29] when α 0.2, expressed as:
k150 1.75
| |ifα 0.2
C α . ifα 0.2 (14)
where C is the drag coefficient expressed as:
C1 0.15 α Re . ifα ∙ Re 1000
0.44ifα ∙ Re 1000 (15)
3 Numerical solution
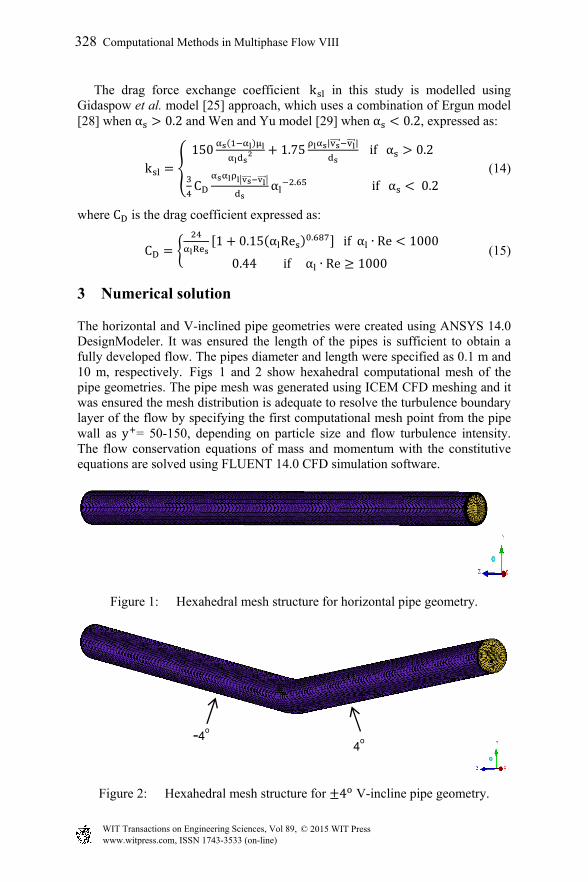
The horizontal and V-inclined pipe geometries were created using ANSYS 14.0 DesignModeler. It was ensured the length of the pipes is sufficient to obtain a fully developed flow. The pipes diameter and length were specified as 0.1 m and 10 m, respectively. Figs 1 and 2 show hexahedral computational mesh of the pipe geometries. The pipe mesh was generated using ICEM CFD meshing and it was ensured the mesh distribution is adequate to resolve the turbulence boundary layer of the flow by specifying the first computational mesh point from the pipe wall as y = 50-150, depending on particle size and flow turbulence intensity. The flow conservation equations of mass and momentum with the constitutive equations are solved using FLUENT 14.0 CFD simulation software.
Figure 1: Hexahedral mesh structure for horizontal pipe geometry.
Figure 2: Hexahedral mesh structure for 4 V-incline pipe geometry.
-4o
4o
WIT Transactions on Engineering Sciences, Vol 89, www.witpress.com, ISSN 1743-3533 (on-line)
© 2015 WIT Press
328 Computational Methods in Multiphase Flow VIII
4 Results and discussion
4.1 Comparison with experimental data
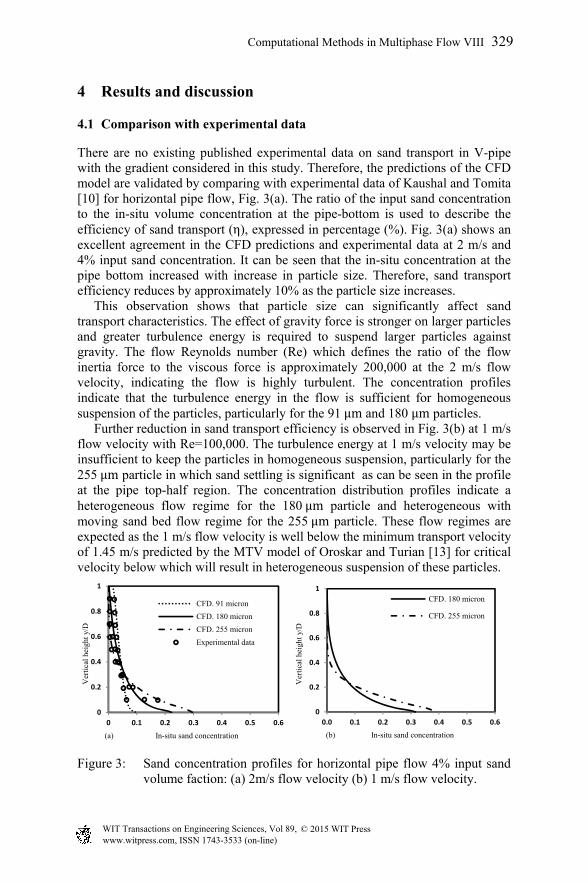
There are no existing published experimental data on sand transport in V-pipe with the gradient considered in this study. Therefore, the predictions of the CFD model are validated by comparing with experimental data of Kaushal and Tomita [10] for horizontal pipe flow, Fig. 3(a). The ratio of the input sand concentration to the in-situ volume concentration at the pipe-bottom is used to describe the efficiency of sand transport (η), expressed in percentage (%). Fig. 3(a) shows an excellent agreement in the CFD predictions and experimental data at 2 m/s and 4% input sand concentration. It can be seen that the in-situ concentration at the pipe bottom increased with increase in particle size. Therefore, sand transport efficiency reduces by approximately 10% as the particle size increases. This observation shows that particle size can significantly affect sand transport characteristics. The effect of gravity force is stronger on larger particles and greater turbulence energy is required to suspend larger particles against gravity. The flow Reynolds number (Re) which defines the ratio of the flow inertia force to the viscous force is approximately 200,000 at the 2 m/s flow velocity, indicating the flow is highly turbulent. The concentration profiles indicate that the turbulence energy in the flow is sufficient for homogeneous suspension of the particles, particularly for the 91μm and 180 μm particles. Further reduction in sand transport efficiency is observed in Fig. 3(b) at 1 m/s flow velocity with Re=100,000. The turbulence energy at 1 m/s velocity may be insufficient to keep the particles in homogeneous suspension, particularly for the 255μm particle in which sand settling is significant as can be seen in the profile at the pipe top-half region. The concentration distribution profiles indicate a heterogeneous flow regime for the 180μm particle and heterogeneous with moving sand bed flow regime for the 255μm particle. These flow regimes are expected as the 1 m/s flow velocity is well below the minimum transport velocity of 1.45 m/s predicted by the MTV model of Oroskar and Turian [13] for critical velocity below which will result in heterogeneous suspension of these particles.
Figure 3: Sand concentration profiles for horizontal pipe flow 4% input sand volume faction: (a) 2m/s flow velocity (b) 1 m/s flow velocity.
0
0.2
0.4
0.6
0.8
1
0 0.1 0.2 0.3 0.4 0.5 0.6
Ver
tica
l hei
ght y
/D
(a) In-situ sand concentration
CFD. 91 micron
CFD. 180 micron
CFD. 255 micron
Experimental data
0
0.2
0.4
0.6
0.8
1
0.0 0.1 0.2 0.3 0.4 0.5 0.6
Ver
tica
l hei
ght y
/D
(b) In-situ sand concentration
CFD. 180 micron
CFD. 255 micron
WIT Transactions on Engineering Sciences, Vol 89, www.witpress.com, ISSN 1743-3533 (on-line)
© 2015 WIT Press
Computational Methods in Multiphase Flow VIII 329
4.2 Nature of sand transport in V-inclined pipe
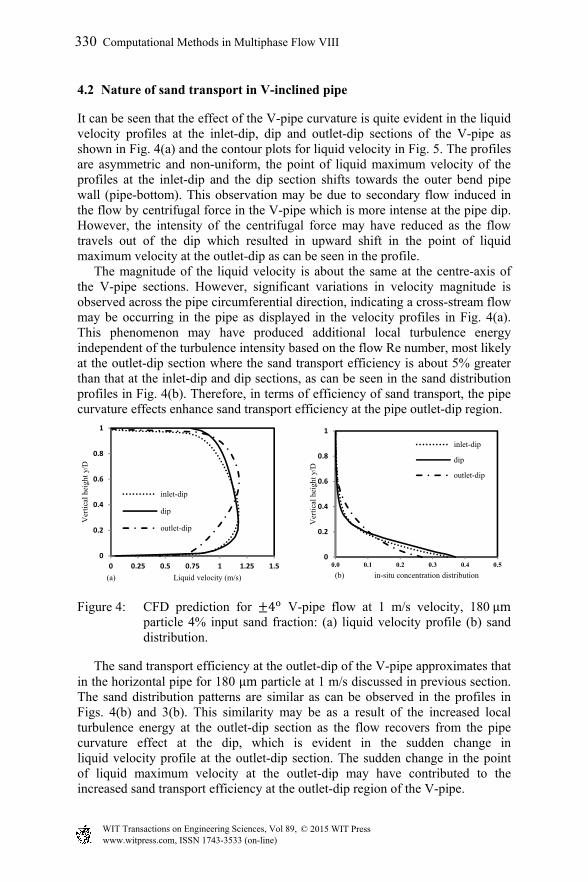
It can be seen that the effect of the V-pipe curvature is quite evident in the liquid velocity profiles at the inlet-dip, dip and outlet-dip sections of the V-pipe as shown in Fig. 4(a) and the contour plots for liquid velocity in Fig. 5. The profiles are asymmetric and non-uniform, the point of liquid maximum velocity of the profiles at the inlet-dip and the dip section shifts towards the outer bend pipe wall (pipe-bottom). This observation may be due to secondary flow induced in the flow by centrifugal force in the V-pipe which is more intense at the pipe dip. However, the intensity of the centrifugal force may have reduced as the flow travels out of the dip which resulted in upward shift in the point of liquid maximum velocity at the outlet-dip as can be seen in the profile. The magnitude of the liquid velocity is about the same at the centre-axis of the V-pipe sections. However, significant variations in velocity magnitude is observed across the pipe circumferential direction, indicating a cross-stream flow may be occurring in the pipe as displayed in the velocity profiles in Fig. 4(a). This phenomenon may have produced additional local turbulence energy independent of the turbulence intensity based on the flow Re number, most likely at the outlet-dip section where the sand transport efficiency is about 5% greater than that at the inlet-dip and dip sections, as can be seen in the sand distribution profiles in Fig. 4(b). Therefore, in terms of efficiency of sand transport, the pipe curvature effects enhance sand transport efficiency at the pipe outlet-dip region.
Figure 4: CFD prediction for 4 V-pipe flow at 1 m/s velocity, 180μm particle 4% input sand fraction: (a) liquid velocity profile (b) sand distribution.
The sand transport efficiency at the outlet-dip of the V-pipe approximates that in the horizontal pipe for 180 μm particle at 1 m/s discussed in previous section. The sand distribution patterns are similar as can be observed in the profiles in Figs. 4(b) and 3(b). This similarity may be as a result of the increased local turbulence energy at the outlet-dip section as the flow recovers from the pipe curvature effect at the dip, which is evident in the sudden change in liquid velocity profile at the outlet-dip section. The sudden change in the point of liquid maximum velocity at the outlet-dip may have contributed to the increased sand transport efficiency at the outlet-dip region of the V-pipe.
0
0.2
0.4
0.6
0.8
1
0 0.25 0.5 0.75 1 1.25 1.5
Ver
tica
l hei
ght y
/D
(a) Liquid velocity (m/s)
inlet-dip
dip
outlet-dip
0
0.2
0.4
0.6
0.8
1
0.0 0.1 0.2 0.3 0.4 0.5
Ver
tica
l hei
ght y
/D
(b) in-situ concentration distribution
inlet-dip
dip
outlet-dip
WIT Transactions on Engineering Sciences, Vol 89, www.witpress.com, ISSN 1743-3533 (on-line)
© 2015 WIT Press
330 Computational Methods in Multiphase Flow VIII
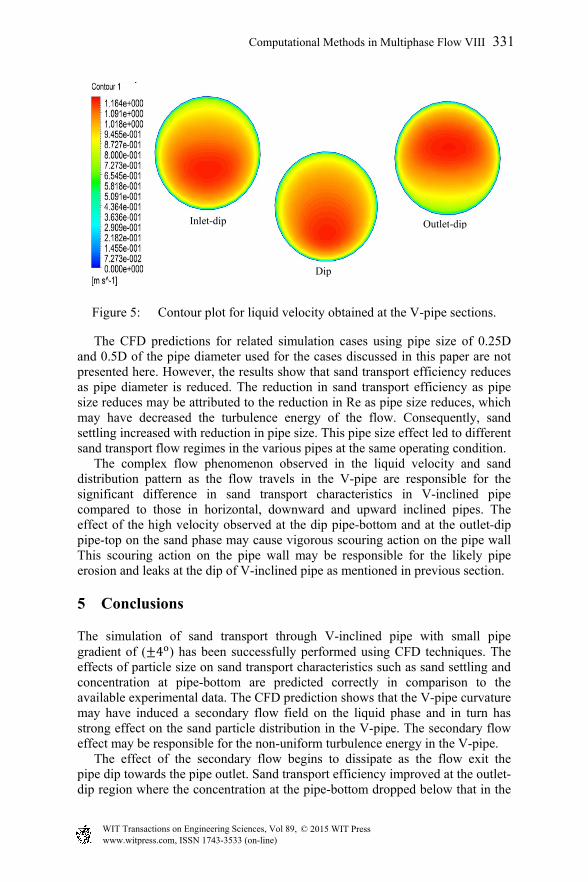
Figure 5: Contour plot for liquid velocity obtained at the V-pipe sections.
The CFD predictions for related simulation cases using pipe size of 0.25D and 0.5D of the pipe diameter used for the cases discussed in this paper are not presented here. However, the results show that sand transport efficiency reduces as pipe diameter is reduced. The reduction in sand transport efficiency as pipe size reduces may be attributed to the reduction in Re as pipe size reduces, which may have decreased the turbulence energy of the flow. Consequently, sand settling increased with reduction in pipe size. This pipe size effect led to different sand transport flow regimes in the various pipes at the same operating condition. The complex flow phenomenon observed in the liquid velocity and sand distribution pattern as the flow travels in the V-pipe are responsible for the significant difference in sand transport characteristics in V-inclined pipe compared to those in horizontal, downward and upward inclined pipes. The effect of the high velocity observed at the dip pipe-bottom and at the outlet-dip pipe-top on the sand phase may cause vigorous scouring action on the pipe wall This scouring action on the pipe wall may be responsible for the likely pipe erosion and leaks at the dip of V-inclined pipe as mentioned in previous section.
5 Conclusions
The simulation of sand transport through V-inclined pipe with small pipe gradient of ( 4 ) has been successfully performed using CFD techniques. The effects of particle size on sand transport characteristics such as sand settling and concentration at pipe-bottom are predicted correctly in comparison to the available experimental data. The CFD prediction shows that the V-pipe curvature may have induced a secondary flow field on the liquid phase and in turn has strong effect on the sand particle distribution in the V-pipe. The secondary flow effect may be responsible for the non-uniform turbulence energy in the V-pipe. The effect of the secondary flow begins to dissipate as the flow exit the pipe dip towards the pipe outlet. Sand transport efficiency improved at the outlet-dip region where the concentration at the pipe-bottom dropped below that in the
Dip
Inlet-dip Outlet-dip
WIT Transactions on Engineering Sciences, Vol 89, www.witpress.com, ISSN 1743-3533 (on-line)
© 2015 WIT Press
Computational Methods in Multiphase Flow VIII 331
dip and inlet-dip, resulting in different sand flow regimes in the entire V-pipe, at the same operating condition. The non-uniform turbulence energy and the variations in sand concentration distribution in the V-pipe indicate the complexity in predicting critical sand transport velocity in V-inclined pipe. Therefore, a more improved MTV model that accounts for the complex flow phenomenon in V-inclined pipe is necessary.
References
[1] Stevenson, P. & Thorpe, R. B., Towards understanding sand transport in oil flowlines. Proc. 9th International Conference on Multiphase Flow, B.H.R. Group, 35, pp. 583–594, 1999.
[2] Danielson, T. J., Sand transport modelling in multiphase pipelines. Offshore Technology Conference, Houston, Texas, 2007.
[3] Salama, M. M., Influence of sand production on design and operations of pipe systems. Corrosion 2000, NACE paper No. 00080, 2000.
[4] Kesana, N. R., Viera, R., McLaury, B. S. & Shiraz, S. A., Experimental study of sand particle concentration profiles in straight and pipe elbow for horizontal multiphase flows. Journal of Energy Resources Technology, Vol. 136, pp. 1–11, 2014.
[5] Choong, K. W., Wen, L. P., Tiong, L. L., Anosike, F., Shoushtari, M. A. & Saaid, I. B. M., A comparative study on sand transport modelling for horizontal multiphase pipeline. Research Journal of Applied Sciences Engineering Technology 7(6), pp. 1017–1024, 2014.
[6] Soepyan, F. B., Cremaschi, S. & Sarica, C., Selection of the optimal critical velocity for sand transport at low concentrations for near-horizontal flow. Offshore Technology Conference, OTC 2307, 2012.
[7] Al-lababidi, S., Yan, W. & Yeung, H., Sand transportation deposition characteristics in multiphase flows in pipelines. Journal of Energy Resource Technology, Vol. 134, pp. 1–13, 2012.
[8] Doan, Q., Ali, F., George, A. E. & Oguztoreli, M., Simulation of sand transport in horizontal well. Society of Petroleum Engineers, SPE 37106, pp. 581–593, 1996.
[9] Oudeman, P., Sand transport and deposition in horizontal multiphase trunklines of subsea satellite developments. Proc. Offshore Technology Conference, pp. 659–667, Houston, Texas, 1992.
[10] Kaushal, D. R. & Tomita, Y., Solids concentration profiles and pressure drop in pipeline flow of multisized particulate slurries. International Journal of Multiphase Flow, Vol. 28, pp. 1697–1717, 2002.
[11] Wasp, E. J., Kenny, J. P., Gandhi, R. L., Flow of homogeneous suspensions (Chapter 6), Solid–liquid flow slurry pipeline transportation, Trans Tech Publications, pp. 85–99, 1977.
[12] Durand, R., Hydraulic transportation of coal and other materials in pipes. Colloq. Of National Coal Board, London, 1952.
WIT Transactions on Engineering Sciences, Vol 89, www.witpress.com, ISSN 1743-3533 (on-line)
© 2015 WIT Press
332 Computational Methods in Multiphase Flow VIII
[13] Oroskar, A. R. & Turian, R. M., The critical velocity in pipeline flow of slurries. The American Institute of Chemical Engineers, 26(4), pp. 550–558, 1980.
[14] Thomas, D. G., Transport characteristics of suspensions: part VI. Minimum transport velocity for large particles in round horizontal pipes. The American Institute of Chemical Engineers Journal, Vol. 8, pp. 373–378, 1962.
[15] Hill, A. L., Arevalo, B., Almutahar, F. M. & McLaury, B. S., Critical liquid velocities for low concentration sand transport. Proc. of the ASME-JSME 2011 Joint Fluids Dynamics Conference, Hamamatsu, Shizuoka, Japan.
[16] Yan, W., Hu, X. & Yeung, H., Experimental study on sand transport characteristics in water and air–water flow in dip pipeline. B.H.R Group Multiphase, 15, 2011.
[17] Tippet, J. R. & Priestman, G. H. Mobility of solids in multiphase undulating pipeline. Proc. 8th International Conference on Multiphase Flow, B.H.R. Group, Vol. 24, pp. 125–132, 1997.
[18] Issa, R. I & Kempf, M. H. W., Simulation of slug flow in horizontal and nearly horizontal pipes with the two-fluid model, International Journal of Multiphase Flow 29. pp. 69–95, 2003.
[19] Al-Safran, E., Sarica, C., Zhang, H. & Brill, J., Investigation of slug flow characteristics in the valley of a hilly-terrain pipeline, International Journal of Multiphase Flow, 31(3), pp. 337–357, 2005.
[20] Zheng, G., Brill, J. & Taitel, Y., Slug flow behaviour in a hilly-terrain pipeline, International Journal of Multiphase Flow, 20, pp. 63–79, 1994.
[21] Zheng, G., Bril, J. & Shoham, O., An experimental study of two-phase slug flow in hilly terrain pipeline, SPE Journal of Production Facilities, 1995.
[22] King, M. J. S., Fairhurst, C. P. & Hill, T. J., Solid transport in multiphase flows – application to high-viscosity systems, Journal of Energy Resources Technology, 123(3) pp. 200–204, 2001.
[23] Lun, C., Savage, S., Jeffrey, D. & Chepurniy, N., Kinetic theories of granular flow: inelastic particles in couette flow and slightly inelastic particles in general flow field. Journal of Fluid Mechanics, Vol. 140, pp. 223–256, 1984.
[24] Syamlal, M. & O’Brien, T. J., Computer simulation of bubbles in a fluidized bed. AIChE Symposium Series, 85, p. 2231, 1989.
[25] Gidaspow, D., Bezburuah, R. & Ding, J., Hydrodynamics of Circulating Fluidized Beds, Kinetic Theory Approach In Fluidization VII. Proceedings of the 7th Engineering Foundation Conference on Fluidization, pp. 75–82, 1992.
[26] Schaeffer, D. G., Instability in the evolution equations describing incompressible granular flow. Journal of Differential Equations, Vol. 66, pp. 19–50, 1987.
WIT Transactions on Engineering Sciences, Vol 89, www.witpress.com, ISSN 1743-3533 (on-line)
© 2015 WIT Press
Computational Methods in Multiphase Flow VIII 333
[27] Johnson, P. C. & Jackson, R., Frictional-Collisional Constitutive Relations for Granular Materials with Application to Plane Shearing. Journal of Fluid Mechanics, Vol. 176, pp. 67–93, 1987.
[28] Ergun, S., Fluid through packed column, Chemical Engineering Progress 48(2), pp. 89–94, 1952.
[29] Wen, C. & Yu, Y. H., Mechanics of fluidization, Chemical Engineering Progress Symposium Series, 62, pp. 100–111, 1966.
WIT Transactions on Engineering Sciences, Vol 89, www.witpress.com, ISSN 1743-3533 (on-line)
© 2015 WIT Press
334 Computational Methods in Multiphase Flow VIII