Embed Size (px)
Citation preview
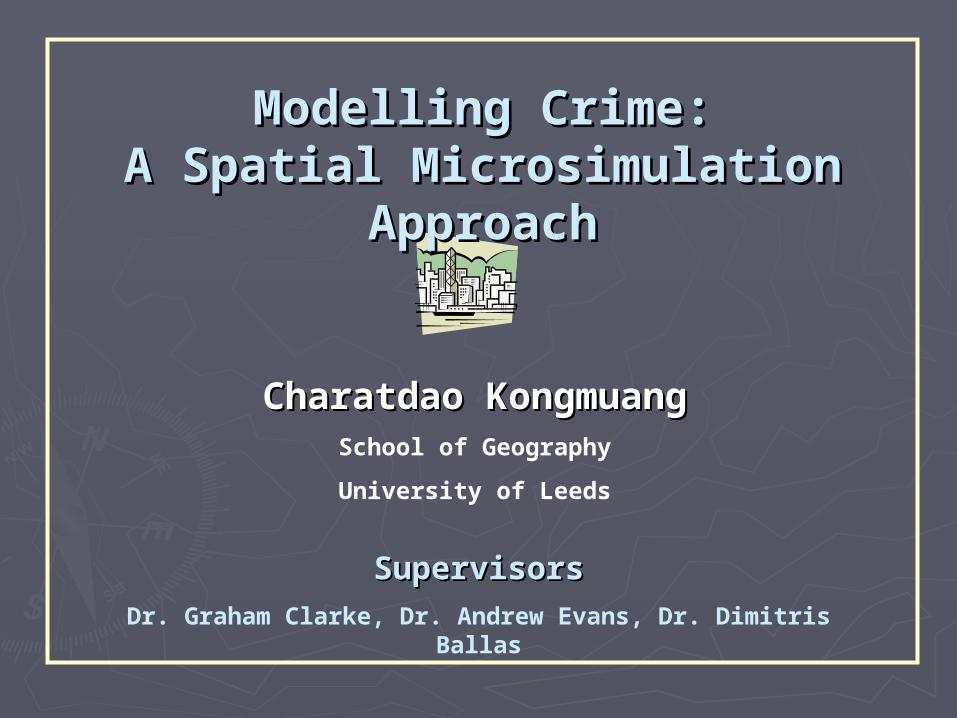
ModellingModelling Crime: Crime:A Spatial Microsimulation A Spatial Microsimulation
ApproachApproach
Charatdao KongmuangCharatdao KongmuangSchool of Geography
University of Leeds
SupervisorsSupervisorsDr. Graham Clarke, Dr. Andrew Evans, Dr. Dimitris Ballas
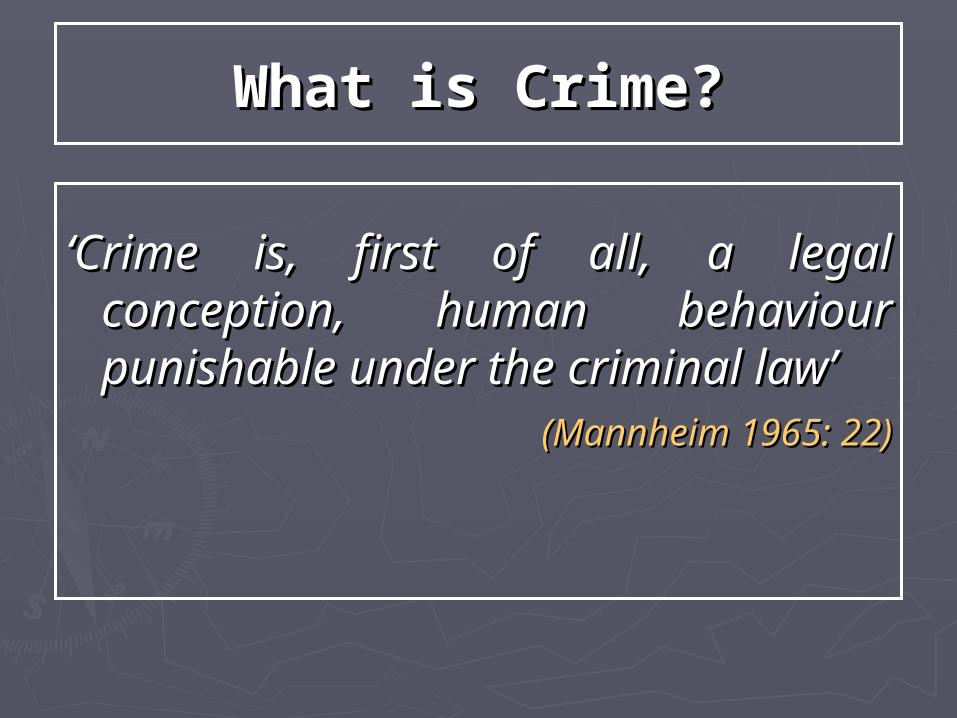
What is Crime?What is Crime?
‘‘Crime is, first of all, a legal conception, Crime is, first of all, a legal conception, human human behaviourbehaviour punishable under the punishable under the criminal law’criminal law’
(Mannheim 1965: 22)(Mannheim 1965: 22)
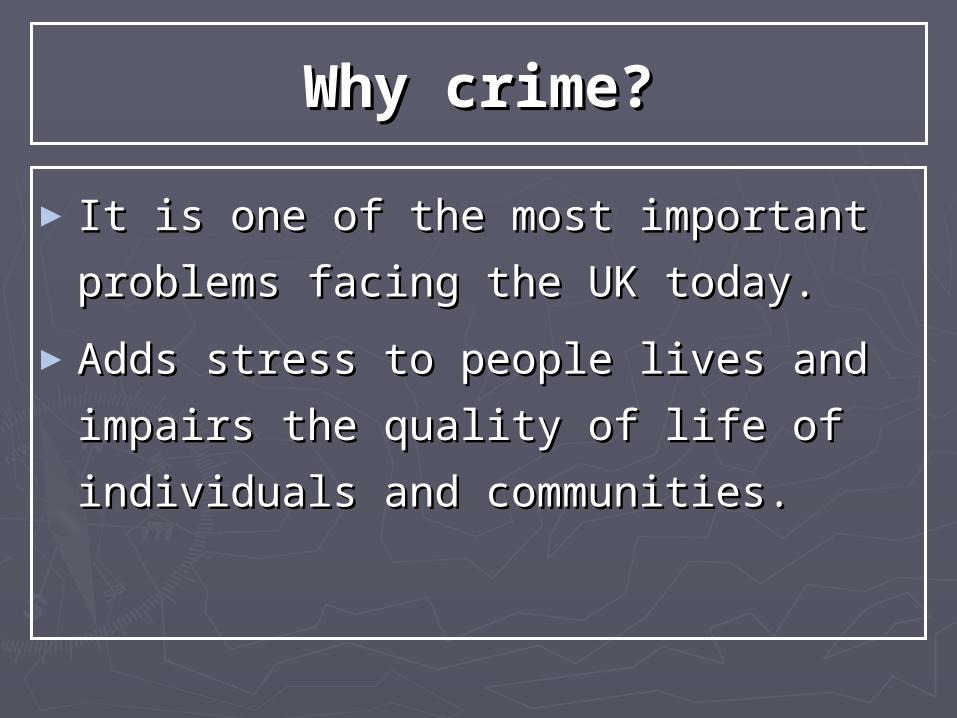
Why crime?Why crime?
► It is one of the most important It is one of the most important
problems facing the UK today. problems facing the UK today.
►Adds stress to people lives and impairs Adds stress to people lives and impairs
the quality of life of individuals and the quality of life of individuals and
communities.communities.
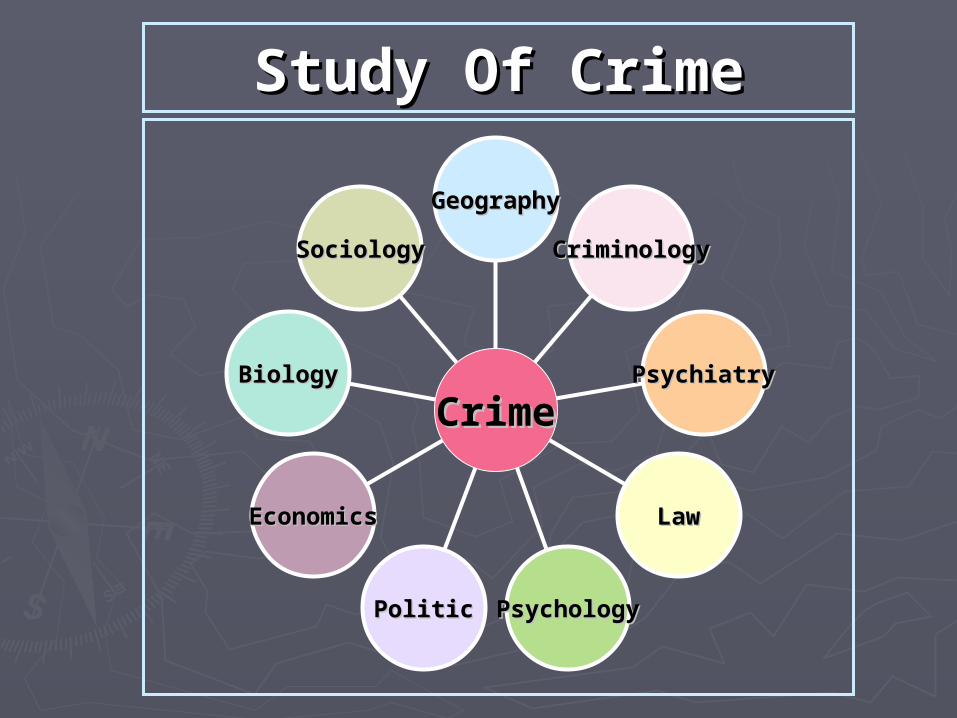
Study Of CrimeStudy Of Crime
SociologySociology
BiologyBiology
EconomicsEconomics
PoliticPolitic PsychologyPsychology
LawLaw
PsychiatryPsychiatry
CriminologyCriminology
GeographyGeography
CrimeCrime
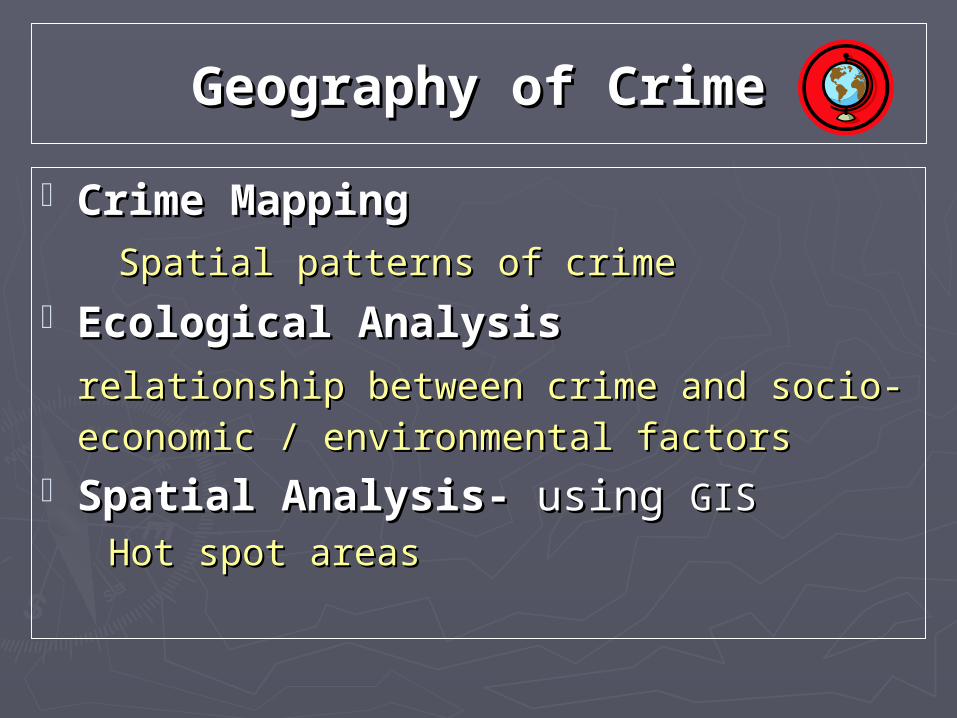
Geography of CrimeGeography of Crime
Crime MappingCrime Mapping
Spatial patterns of crimeSpatial patterns of crime Ecological AnalysisEcological Analysis
relationship between crime and socio-relationship between crime and socio-economic / environmental factorseconomic / environmental factors
Spatial Analysis- Spatial Analysis- using using GISGIS
Hot spot areas Hot spot areas
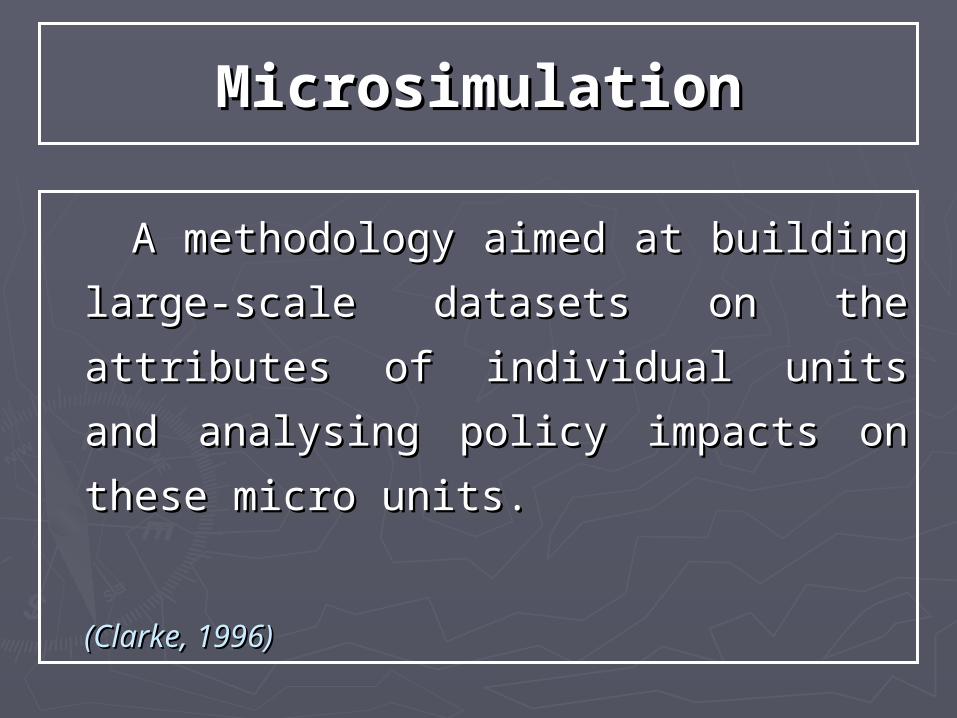
MicrosimulationMicrosimulation
A methodology aimed at building A methodology aimed at building
large-scale datasets on the attributes large-scale datasets on the attributes
of individual units and analysing of individual units and analysing
policy impacts on these micro units. policy impacts on these micro units.
(Clarke, (Clarke, 1996)1996)
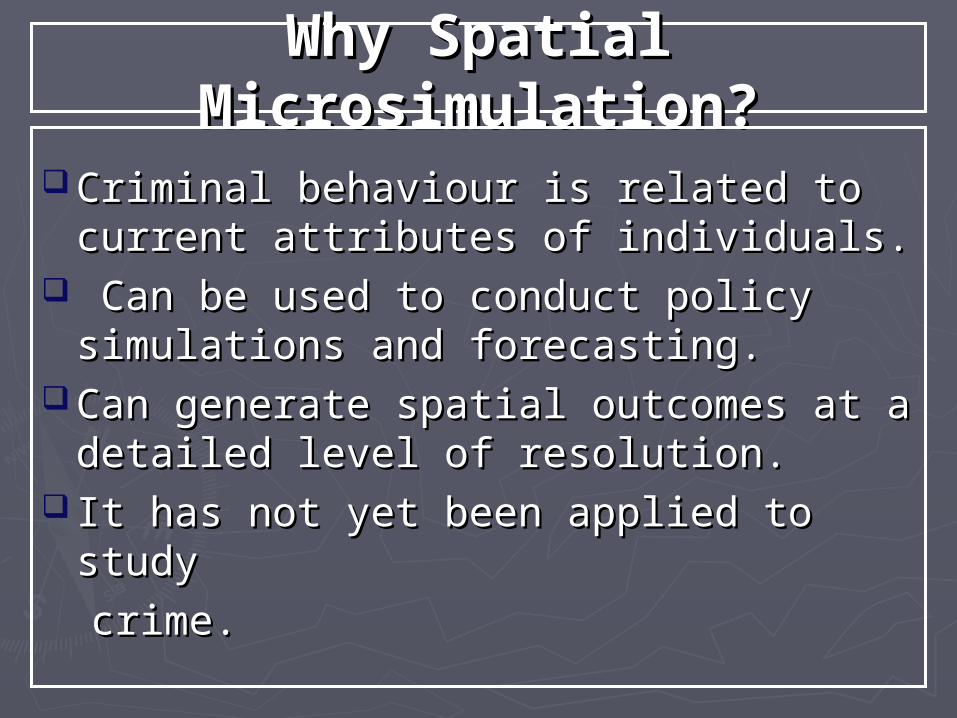
Why Spatial Why Spatial Microsimulation?Microsimulation?
Criminal Criminal behaviourbehaviour is related to is related to current attributes of individuals.current attributes of individuals.
Can be used to conduct policy Can be used to conduct policy simulations and forecasting.simulations and forecasting.
Can generate spatial outcomes at a Can generate spatial outcomes at a detailed level of resolution. detailed level of resolution.
It has not yet been applied to study It has not yet been applied to study
crime.crime.
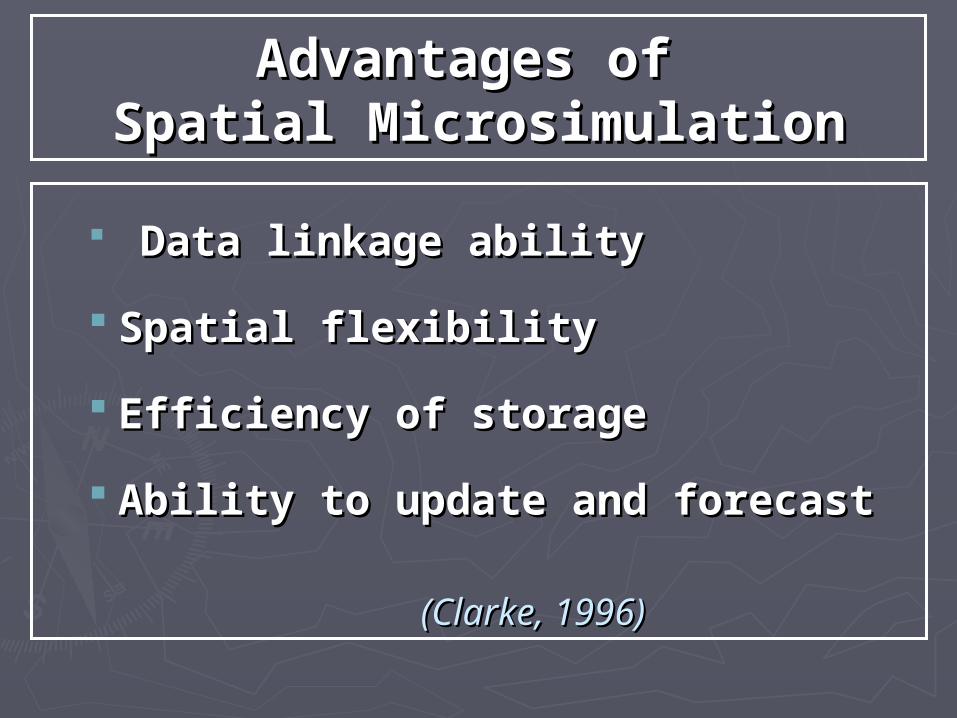
Advantages of Advantages of Spatial MicrosimulationSpatial Microsimulation
Data linkage abilityData linkage ability
Spatial flexibilitySpatial flexibility
Efficiency of storageEfficiency of storage
Ability to update and forecastAbility to update and forecast
(Clarke, (Clarke, 1996)1996)
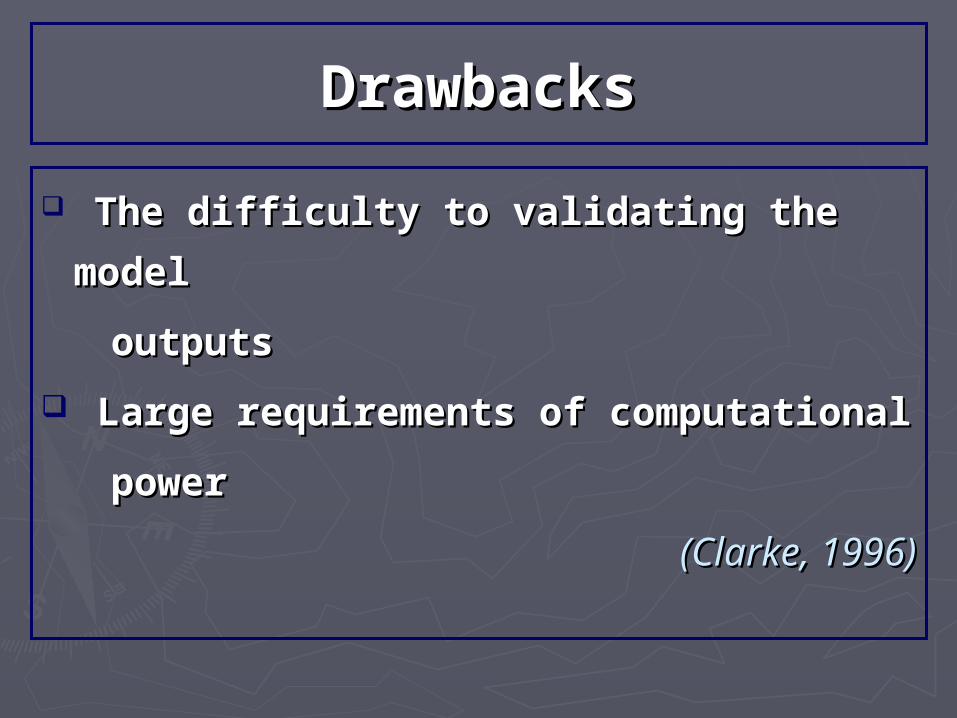
DrawbacksDrawbacks
The difficulty to validating the model The difficulty to validating the model
outputsoutputs
Large requirements of Large requirements of
computational computational
powerpower
(Clarke, 1996)(Clarke, 1996)
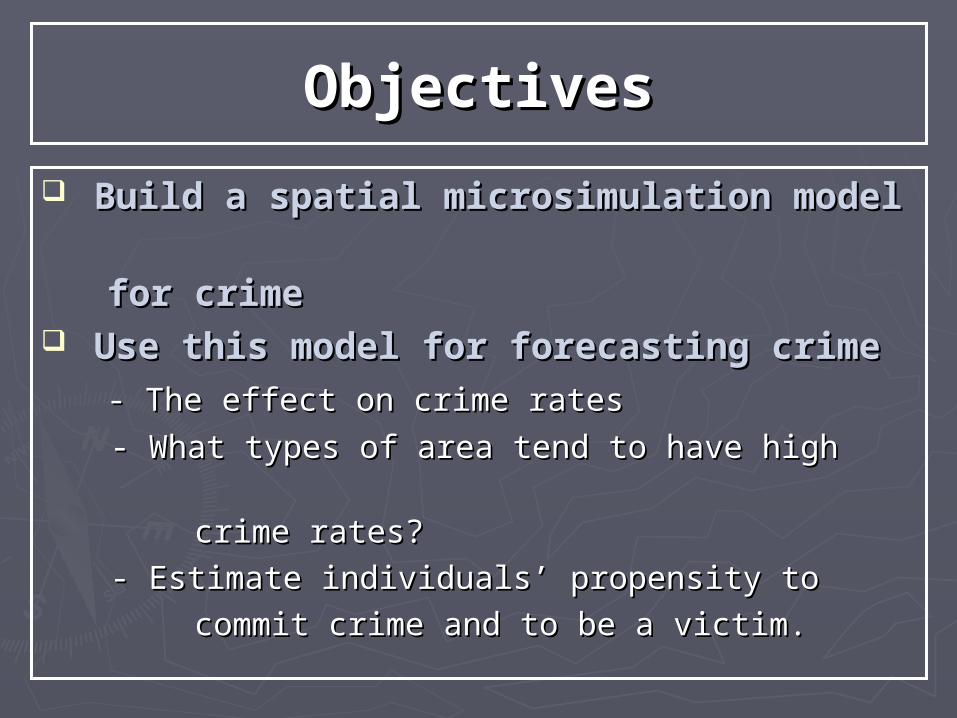
ObjectivesObjectives
Build a spatial microsimulation Build a spatial microsimulation model model
for crime for crime Use this model for forecasting crime Use this model for forecasting crime
- The effect on crime rates - The effect on crime rates
- What types of area tend to have high - What types of area tend to have high
crime rates?crime rates?
- Estimate individuals’ propensity to - Estimate individuals’ propensity to
commit crime and to be a victim.commit crime and to be a victim.
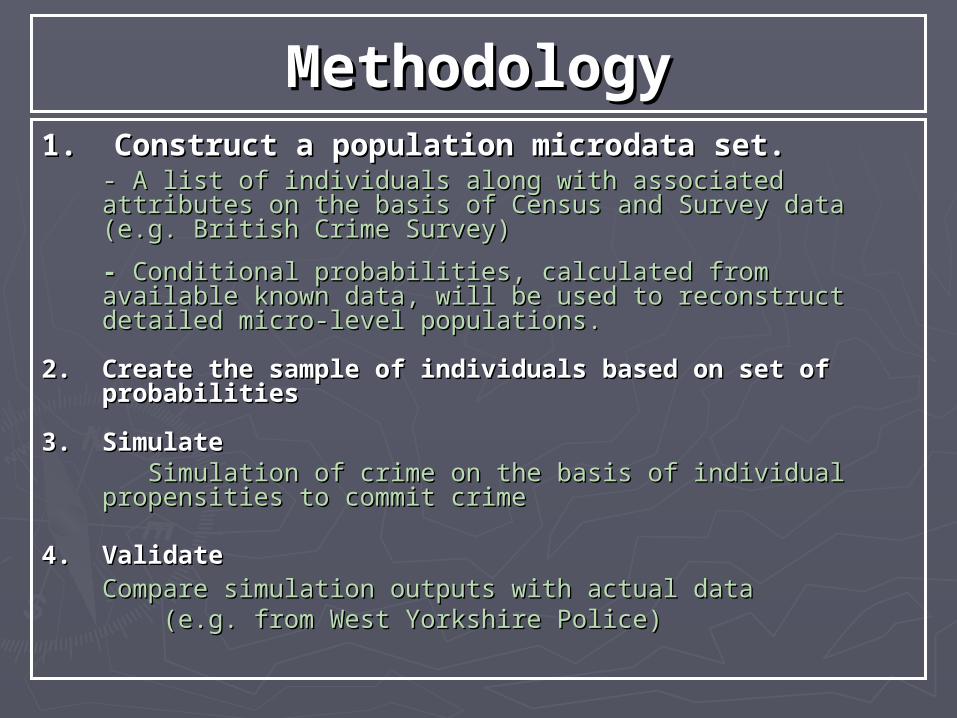
MethodologyMethodology1. Construct a population microdata set.1. Construct a population microdata set.
- A list of individuals along with associated attributes on the - A list of individuals along with associated attributes on the basis of Census and Survey data (e.g. British Crime Survey) basis of Census and Survey data (e.g. British Crime Survey)
- - Conditional probabilities, calculated from available known Conditional probabilities, calculated from available known data, will be used to reconstruct detailed micro-level data, will be used to reconstruct detailed micro-level populations.populations.
2. Create the sample of individuals based on set of 2. Create the sample of individuals based on set of probabilitiesprobabilities
3. Simulate3. Simulate Simulation of crime on the basis of individual propensities to Simulation of crime on the basis of individual propensities to
commit crimecommit crime
4. Validate4. Validate Compare simulation outputs with actual data Compare simulation outputs with actual data
(e.g. from West Yorkshire Police)(e.g. from West Yorkshire Police)
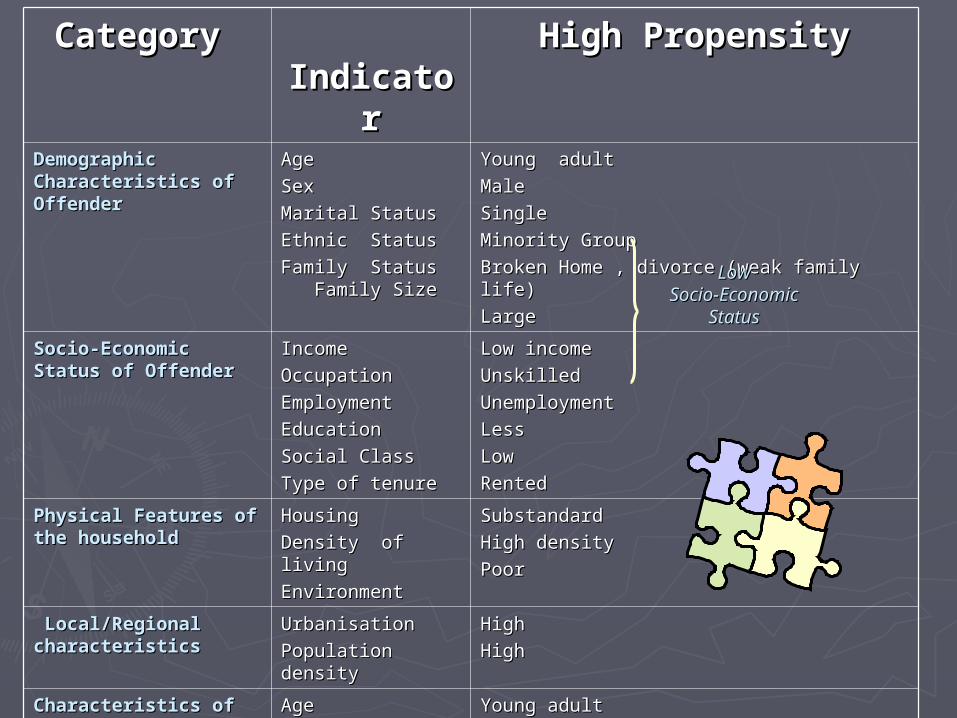
Category Category IndicatorIndicator
High PropensityHigh Propensity
Demographic Demographic Characteristics of Characteristics of OffenderOffender
AgeAge
Sex Sex
Marital Status Marital Status
Ethnic StatusEthnic Status
Family Status Family Status Family SizeFamily Size
Young adultYoung adult
MaleMale
SingleSingle
Minority GroupMinority Group
Broken Home , divorce (weak family life)Broken Home , divorce (weak family life)
LargeLarge
Socio-Economic Socio-Economic Status of OffenderStatus of Offender
Income Income
OccupationOccupation
EmploymentEmployment
Education Education
Social Class Social Class
Type of tenureType of tenure
Low incomeLow income
UnskilledUnskilled
Unemployment Unemployment
LessLess
LowLow
RentedRented
Physical Features of Physical Features of the householdthe household
HousingHousing Density of livingDensity of living
EnvironmentEnvironment
SubstandardSubstandard
High densityHigh density
PoorPoor
Local/Regional Local/Regional characteristicscharacteristics
UrbanisationUrbanisation
Population densityPopulation densityHighHigh
High High
Characteristics of Characteristics of victimvictim
Age Age
SexSex
LifestyleLifestyle
TenureTenure
Young adultYoung adult
MaleMale
Away homeAway home
Council estateCouncil estate
Proximity to Proximity to opportunityopportunity
Neighbourhood Neighbourhood Inner cityInner cityBorder zone located close to disadvantage Border zone located close to disadvantage areasareas
LowLowSocio-Economic Socio-Economic
StatusStatus
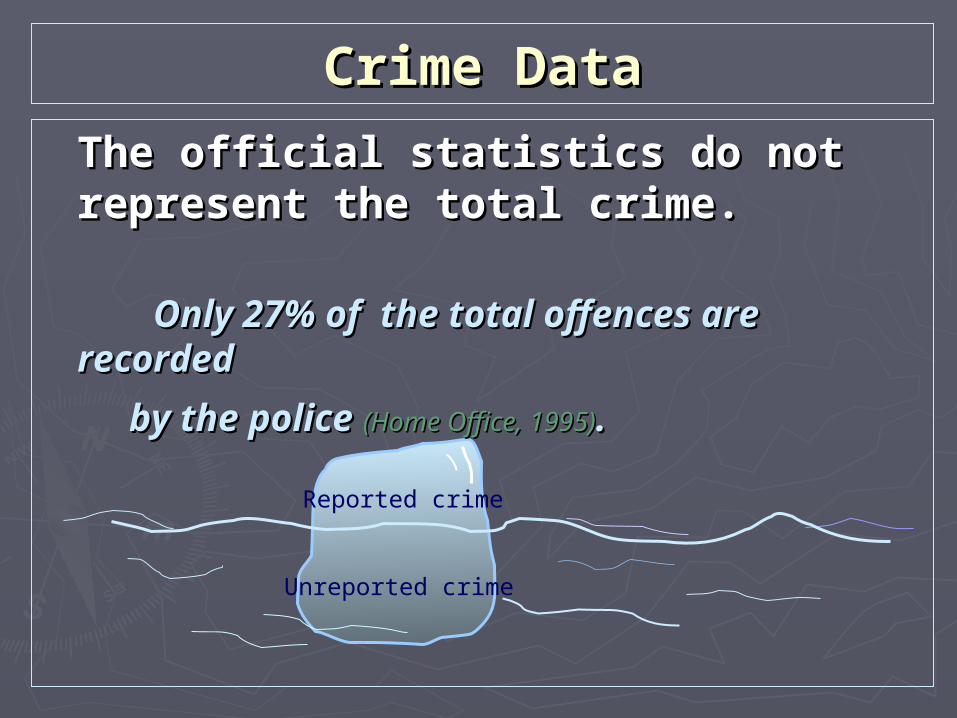
Crime DataCrime Data
The official statistics do not The official statistics do not represent the total crime.represent the total crime.
Only 27% of the total offences are recorded Only 27% of the total offences are recorded
by the police by the police (Home Office, 1995)(Home Office, 1995)..
Reported crime
Unreported crime
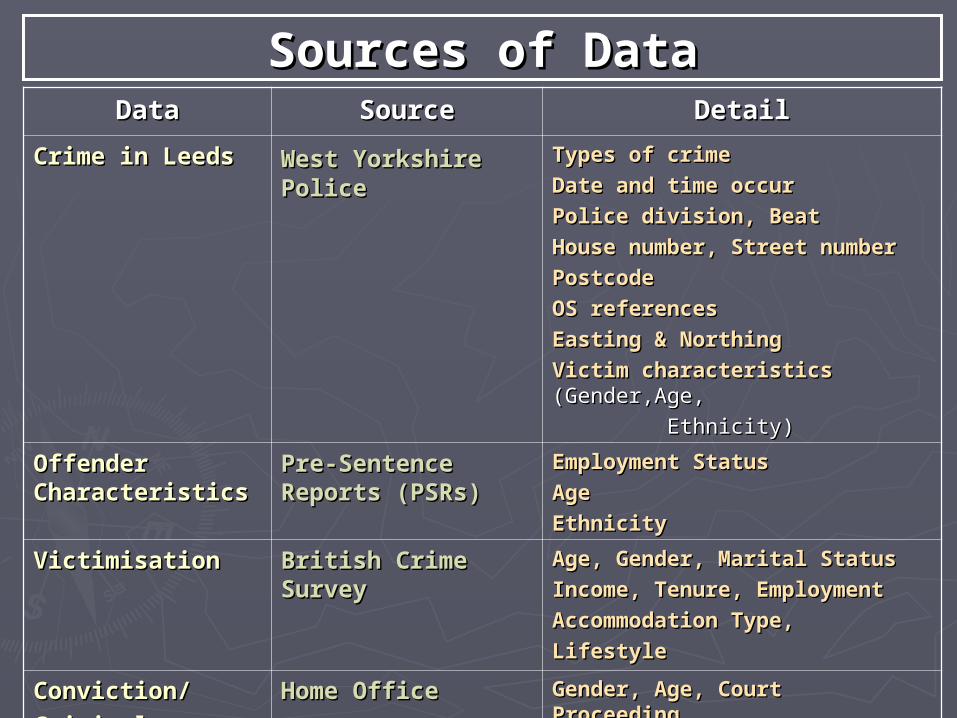
Sources of DataSources of DataDataData SourceSource DetailDetail
Crime in LeedsCrime in Leeds West YorkshireWest Yorkshire Police Police
Types of crimeTypes of crime
Date and time occurDate and time occur
Police division, BeatPolice division, Beat
House number, Street numberHouse number, Street number
PostcodePostcode
OS referencesOS references
Easting & NorthingEasting & Northing
Victim characteristics Victim characteristics (Gender,Age, (Gender,Age,
Ethnicity) Ethnicity)
Offender Offender CharacteristicsCharacteristics
Pre-Sentence Pre-Sentence Reports (PSRs) Reports (PSRs)
Employment StatusEmployment Status
AgeAge
EthnicityEthnicity
VictimisationVictimisation British Crime British Crime SurveySurvey
Age, Gender, Marital StatusAge, Gender, Marital Status
Income, Tenure, EmploymentIncome, Tenure, Employment
Accommodation Type,Accommodation Type,
LifestyleLifestyle
Conviction/Conviction/
Criminal Criminal StatisticsStatistics
Home OfficeHome Office Gender, Age, Court Proceeding, Gender, Age, Court Proceeding,
Sentencing Sentencing
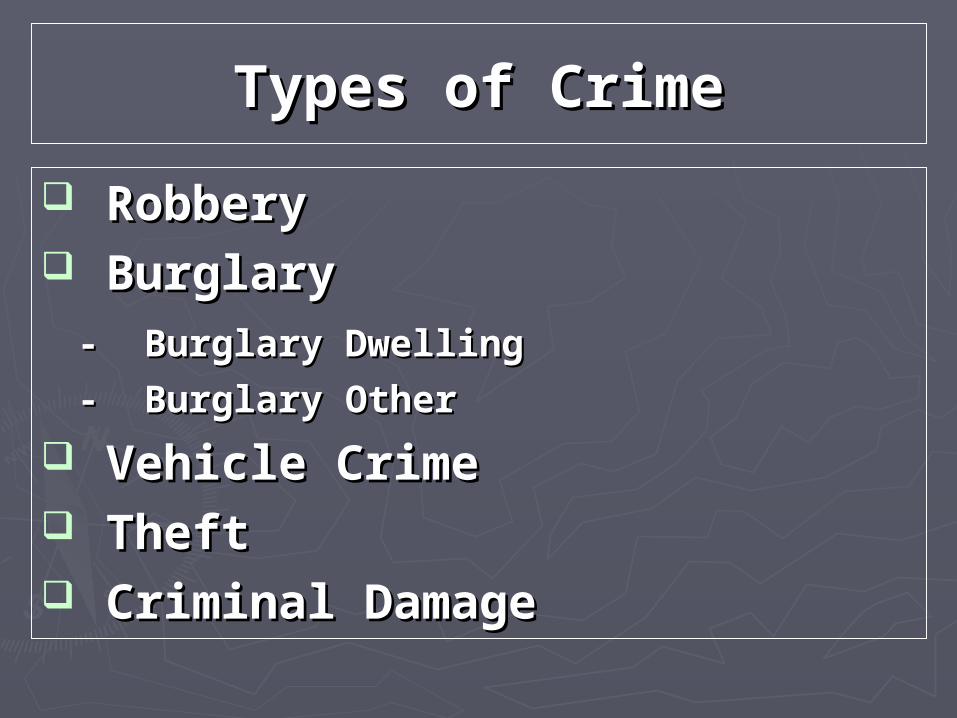
Types of CrimeTypes of Crime
RobberyRobbery BurglaryBurglary
- Burglary Dwelling- Burglary Dwelling
- Burglary Other- Burglary Other
Vehicle Crime Vehicle Crime Theft Theft Criminal DamageCriminal Damage
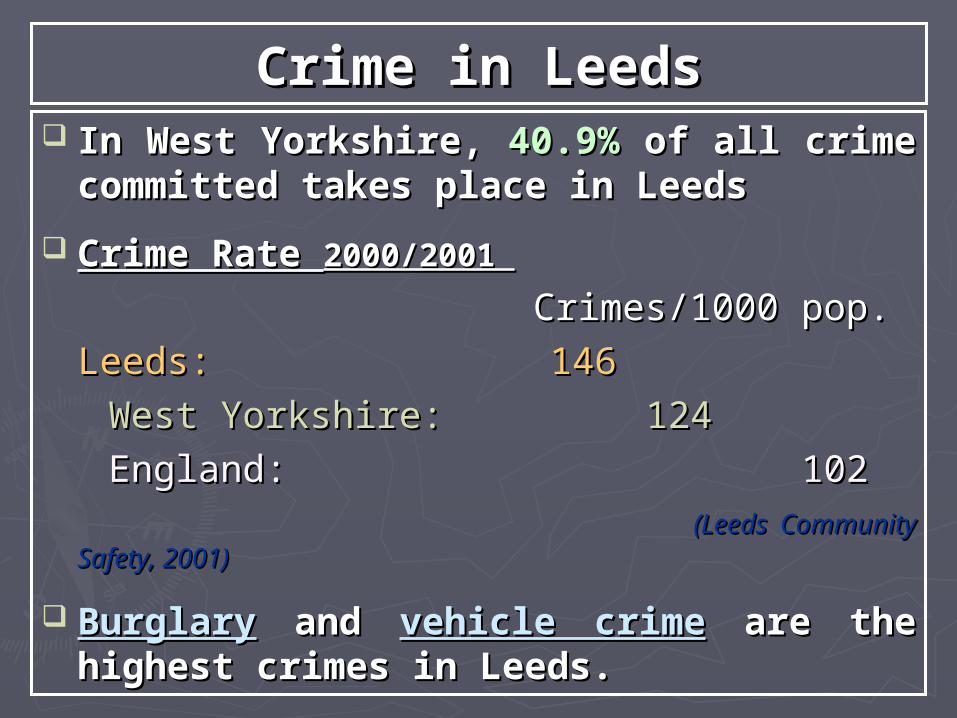
Crime in LeedsCrime in Leeds In West Yorkshire, In West Yorkshire, 40.9%40.9% of all crime of all crime
committed takes place in Leedscommitted takes place in Leeds
Crime Rate Crime Rate 2000/2001 2000/2001
Crimes/1000 pop.Crimes/1000 pop.
Leeds: Leeds: 146 146
West Yorkshire: West Yorkshire: 124 124
England: 102England: 102 (Leeds Community Safety, 2001)(Leeds Community Safety, 2001)
BurglaryBurglary and and vehicle crimevehicle crime are the are the highest crimes in Leeds.highest crimes in Leeds.
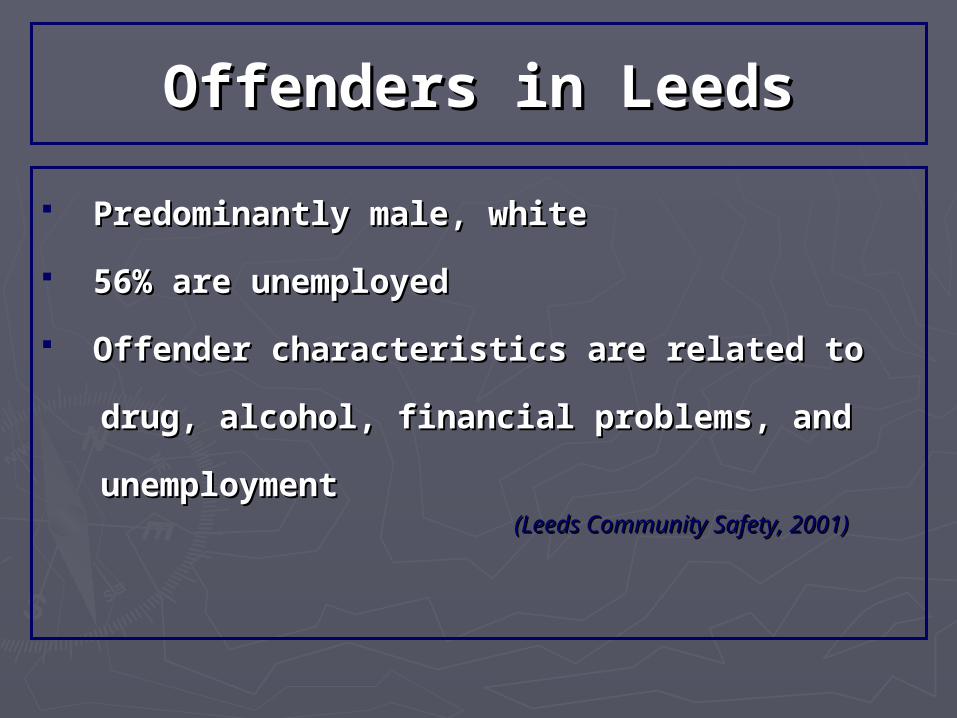
Offenders in LeedsOffenders in Leeds
Predominantly male, whitePredominantly male, white
56% are unemployed56% are unemployed
Offender characteristics are related to Offender characteristics are related to
drug, alcohol, financial problems, and drug, alcohol, financial problems, and
unemploymentunemployment (Leeds Community Safety, 2001)(Leeds Community Safety, 2001)
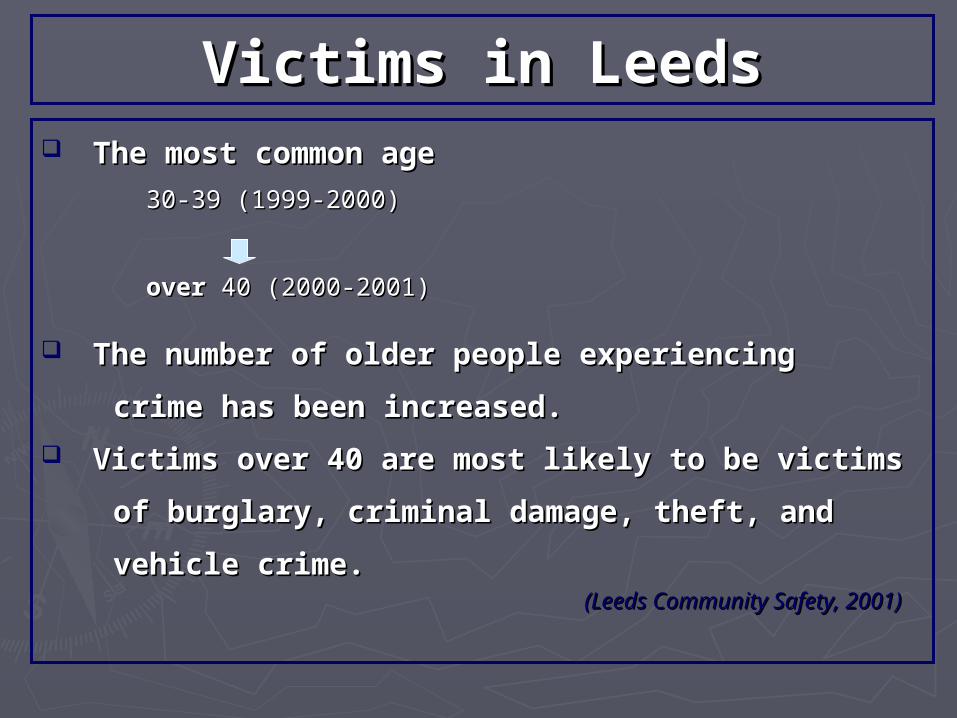
Victims in LeedsVictims in Leeds The most common ageThe most common age
30-39 (1999-2000)30-39 (1999-2000)
over over 40 (2000-2001)40 (2000-2001)
The number of older people experiencing The number of older people experiencing
crime has been increased.crime has been increased.
Victims over 40 are most likely to be victims Victims over 40 are most likely to be victims
of burglary, criminal damage, theft, and of burglary, criminal damage, theft, and
vehicle crime.vehicle crime. (Leeds Community Safety, 2001)(Leeds Community Safety, 2001)
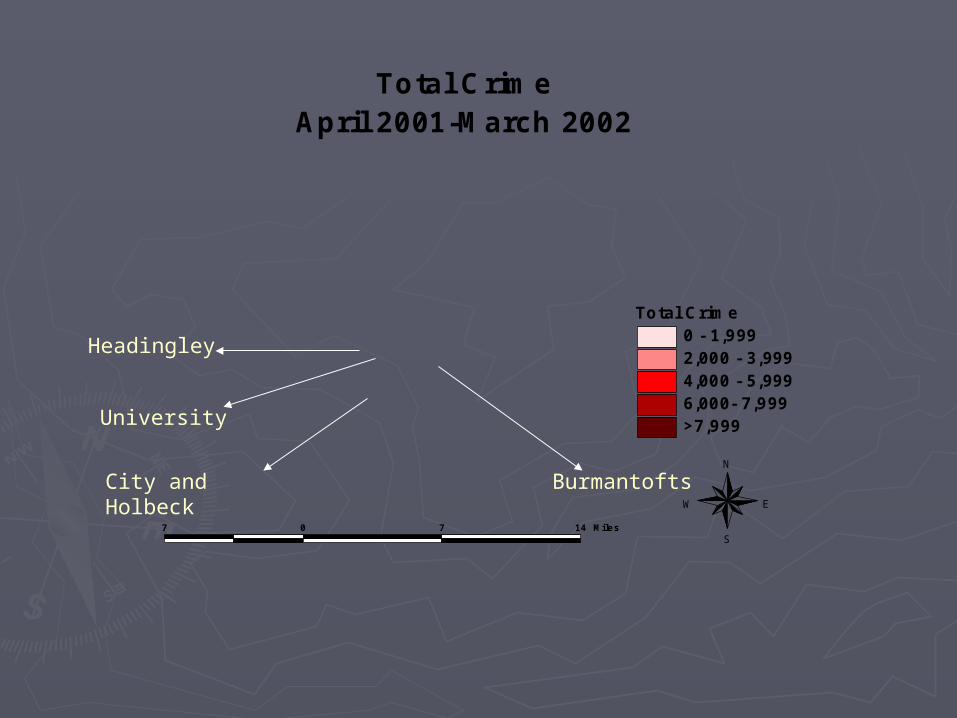
Total Crime0 - 1,9992,000 - 3,9994,000 - 5,9996,000- 7,999>7,999
7 0 7 14 Miles
N
EW
S
Total CrimeApril 2001-March 2002
University
City and Holbeck Burmantofts
Headingley
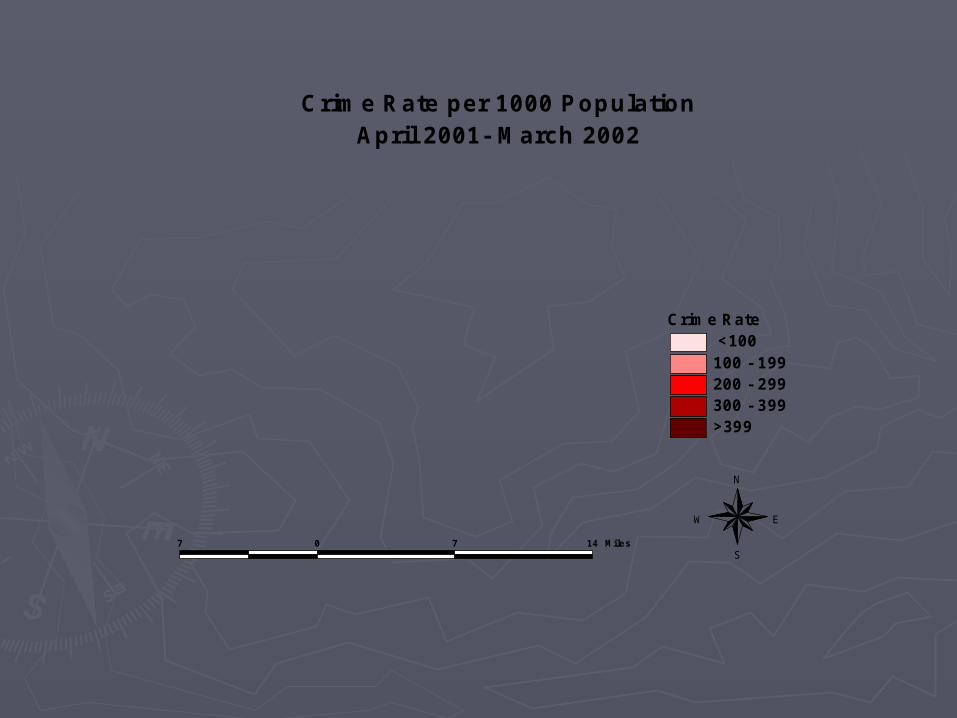
Crime Rate <100100 - 199200 - 299300 - 399>399
7 0 7 14 Miles
N
EW
S
Crime Rate per 1000 PopulationApril 2001- March 2002
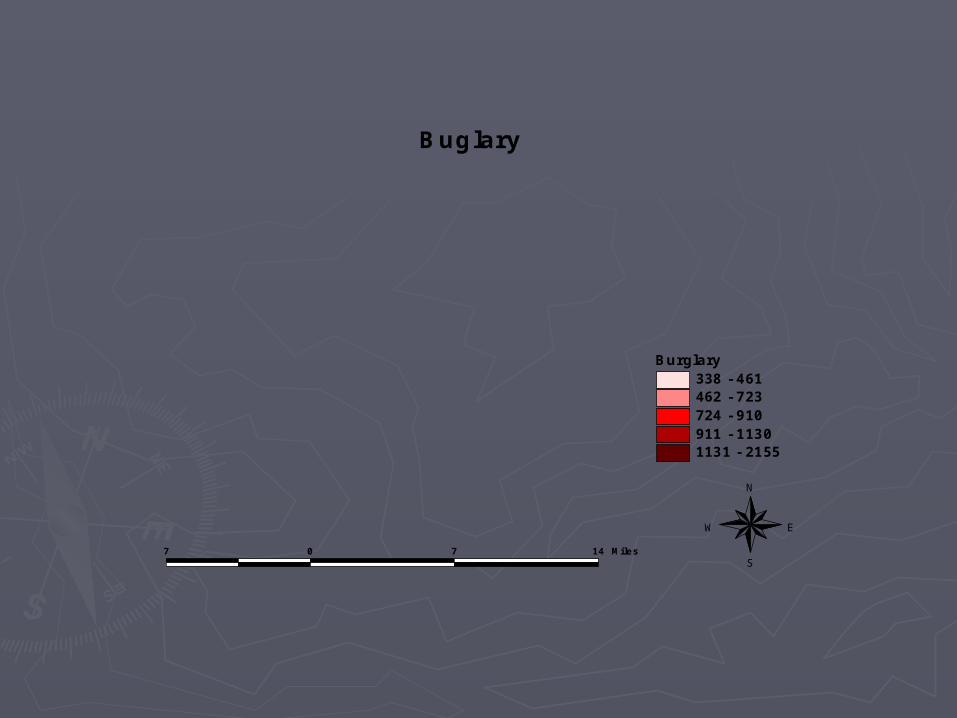
Burglary 338 - 461462 - 723724 - 910911 - 11301131 - 2155
7 0 7 14 Miles
N
EW
S
Buglary
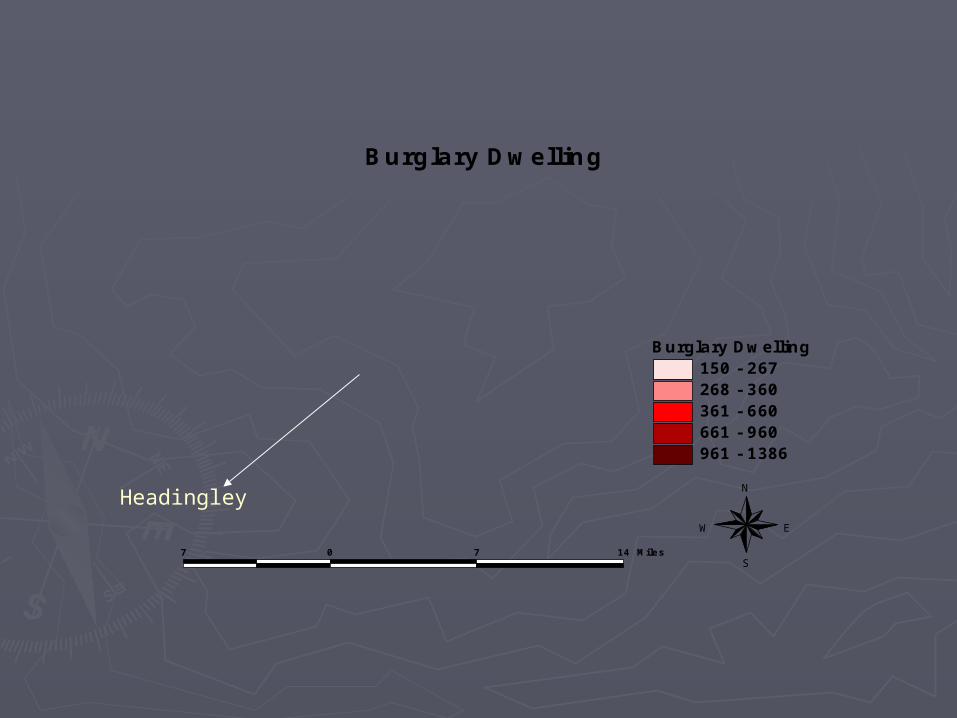
Burglary Dwelling150 - 267268 - 360361 - 660661 - 960961 - 1386
7 0 7 14 Miles
N
EW
S
Burglary Dwelling
Headingley
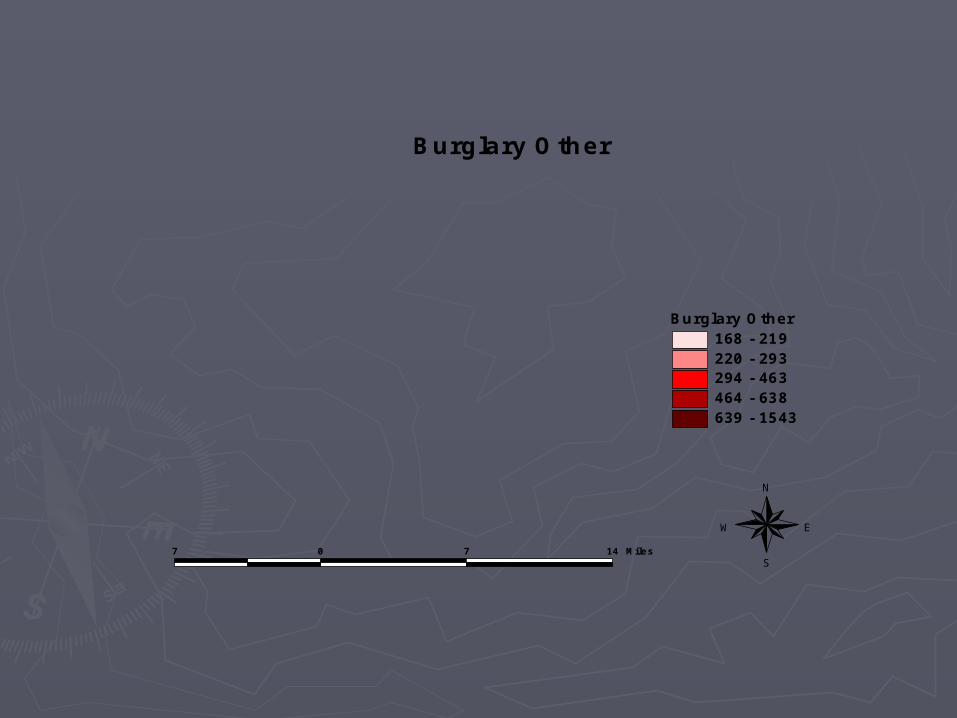
Burglary Other168 - 219220 - 293294 - 463464 - 638639 - 1543
7 0 7 14 Miles
N
EW
S
Burglary Other
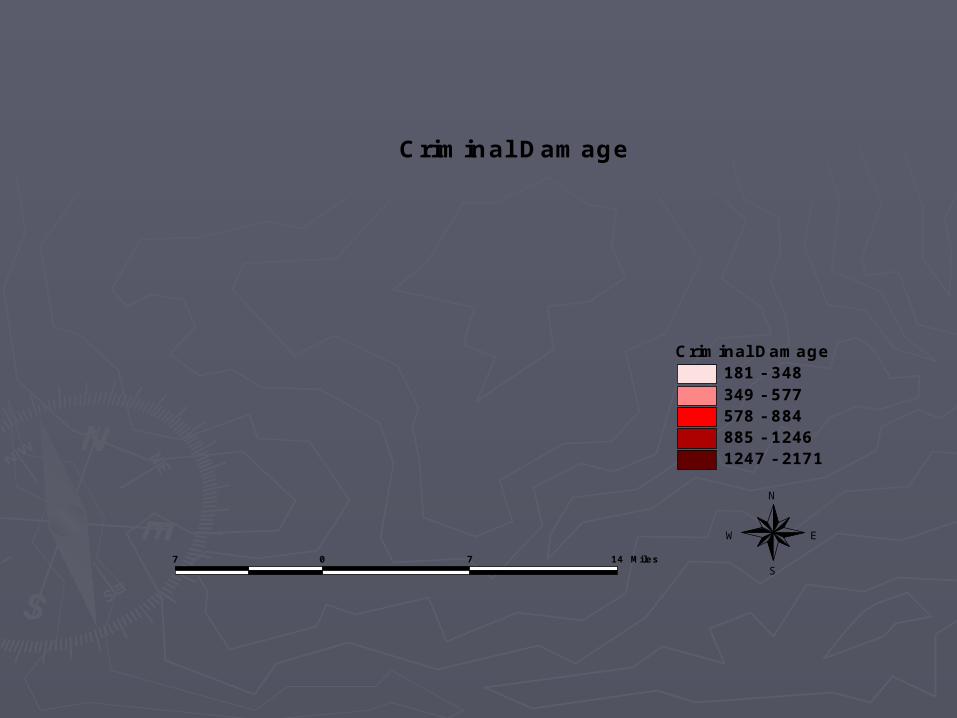
Criminal Damage181 - 348349 - 577578 - 884885 - 12461247 - 2171
7 0 7 14 Miles
N
EW
S
Criminal Damage
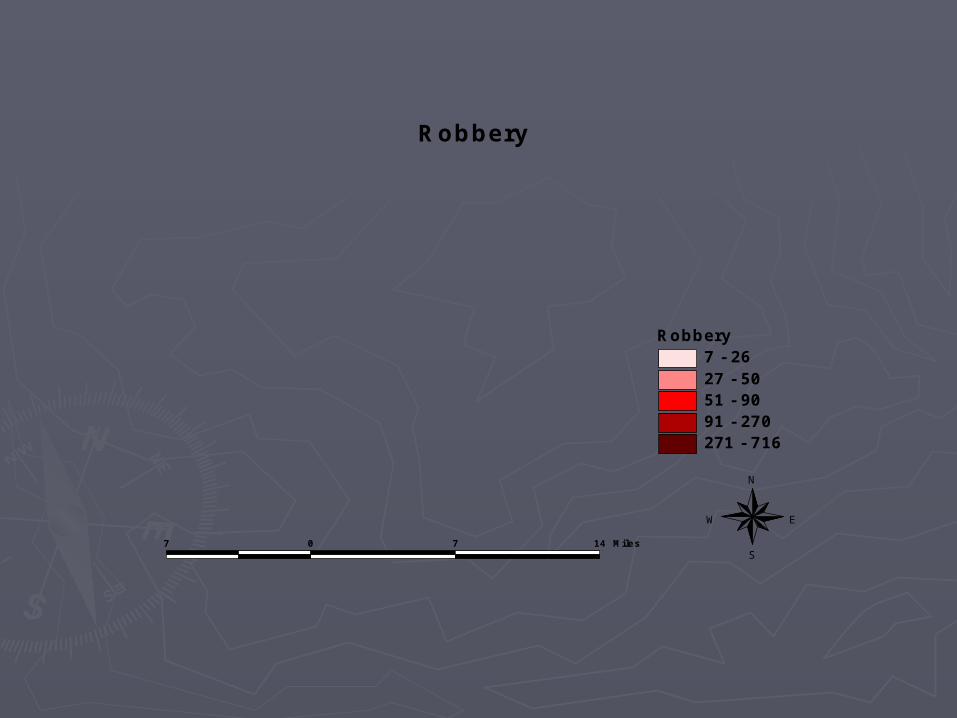
Robbery7 - 2627 - 5051 - 9091 - 270271 - 716
7 0 7 14 Miles
N
EW
S
Robbery
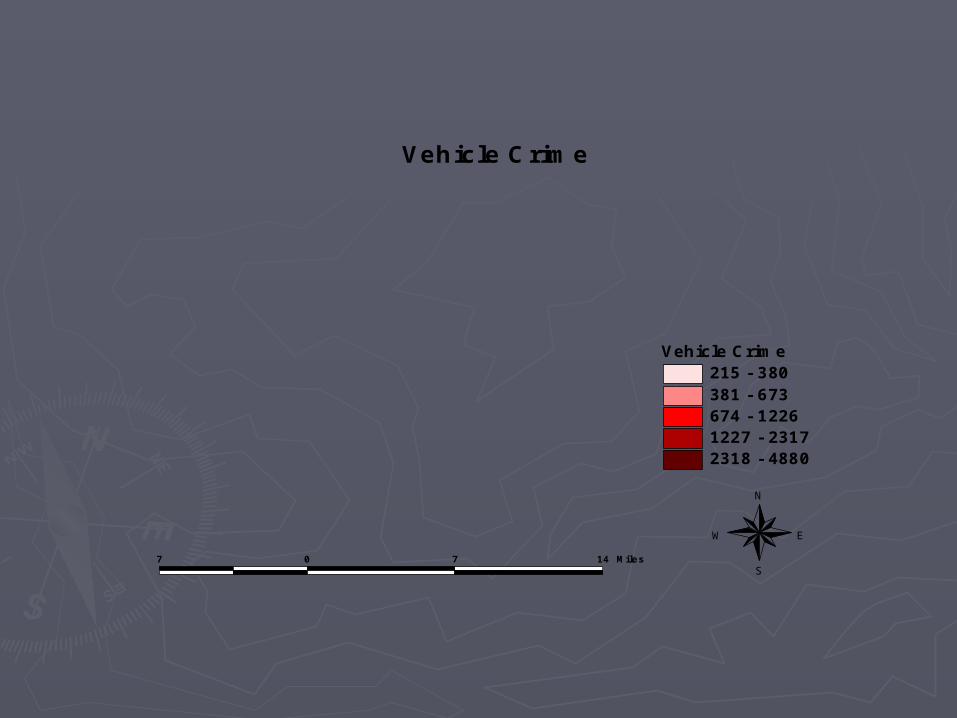
Vehicle Crime215 - 380381 - 673674 - 12261227 - 23172318 - 4880
7 0 7 14 Miles
N
EW
S
Vehicle Crime
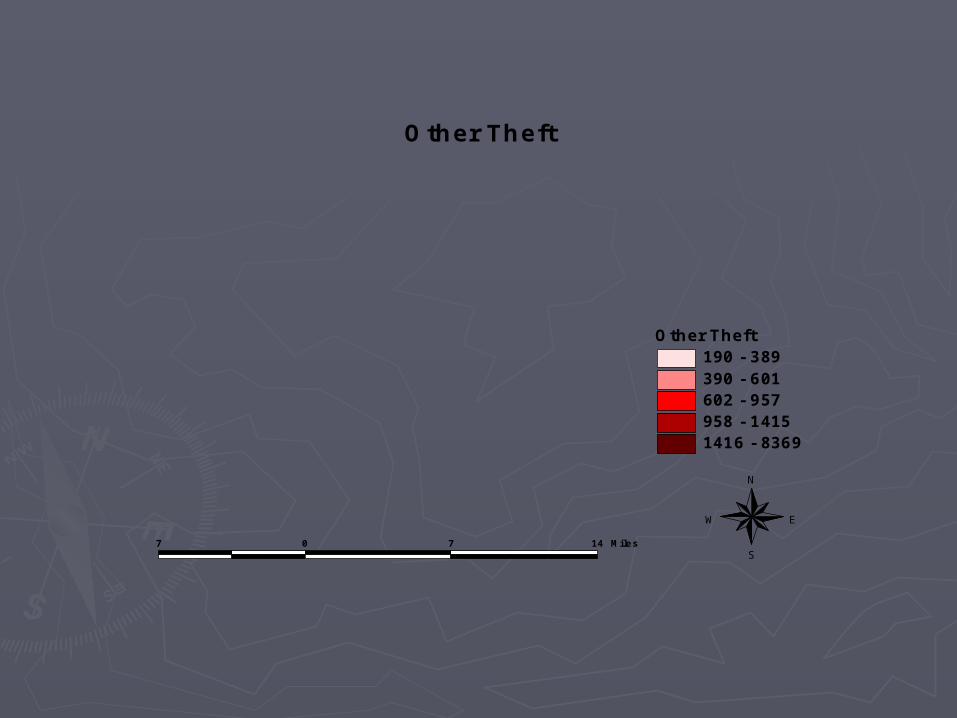
Other Theft190 - 389390 - 601602 - 957958 - 14151416 - 8369
7 0 7 14 Miles
N
EW
S
Other Theft
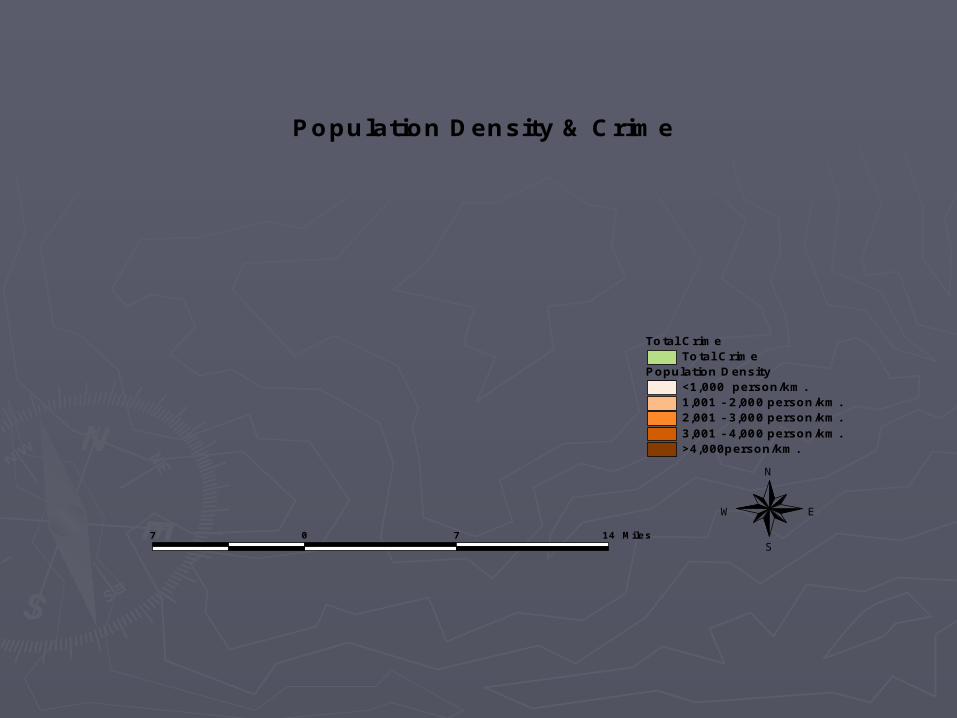
Population Density<1,000 person/km.1,001 - 2,000 person/km.2,001 - 3,000 person/km.3,001 - 4,000 person/km.>4,000person/km.
Total CrimeTotal Crime
7 0 7 14 Miles
N
EW
S
Population Density & Crime
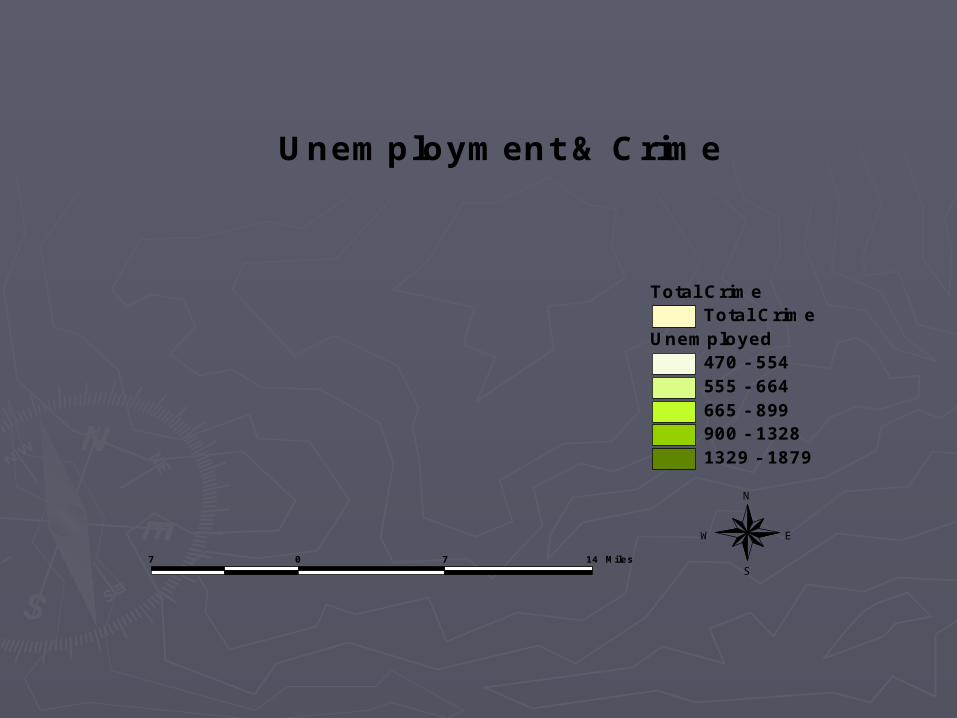
Unemployed470 - 554555 - 664665 - 899900 - 13281329 - 1879
Total CrimeTotal Crime
7 0 7 14 Miles
N
EW
S
Unemployment & Crime
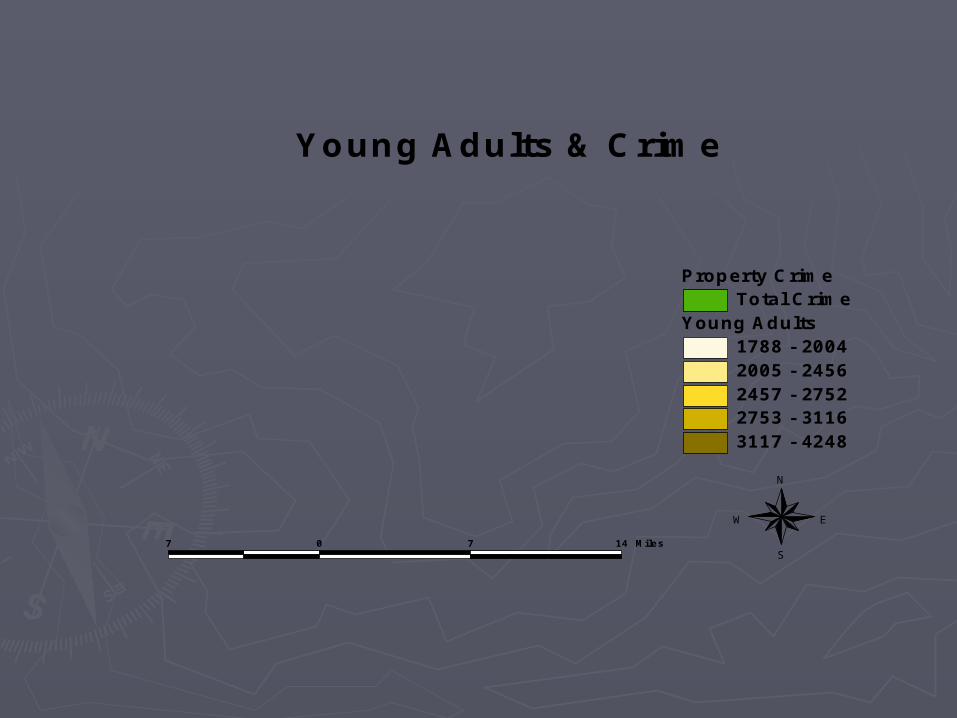
Young Adults1788 - 20042005 - 24562457 - 27522753 - 31163117 - 4248
Property CrimeTotal Crime
7 0 7 14 Miles
N
EW
S
Young Adults & Crime
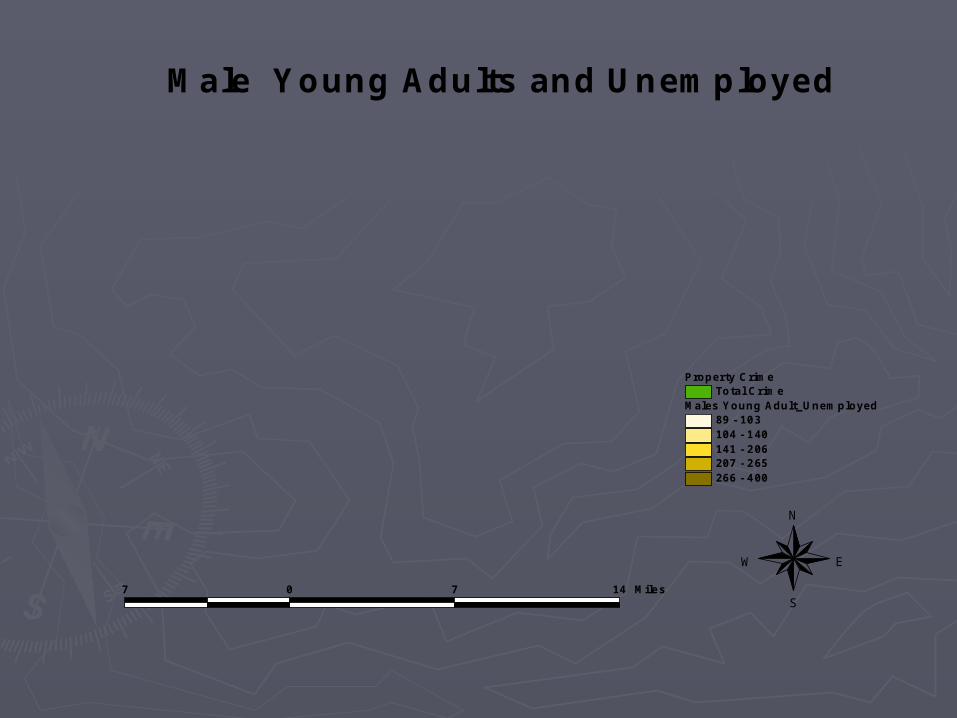
Males Young Adult_Unemployed89 - 103104 - 140141 - 206207 - 265266 - 400
Property CrimeTotal Crime
7 0 7 14 Miles
N
EW
S
Male Young Adults and Unemployed

SawasdeeSawasdee(sa-wat-dee)(sa-wat-dee)
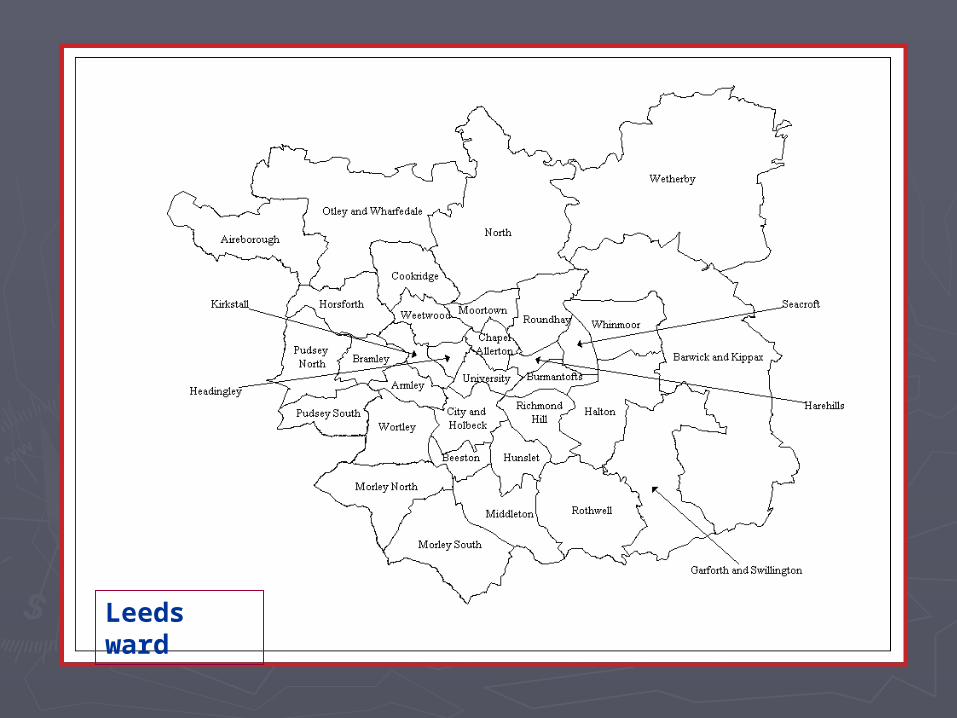
Leeds ward