Embed Size (px)
Citation preview
Hydrobiologia 395/396: 227–237, 1999.D.M. Harper, B. Brierley, A.J.D. Ferguson & G. Phillips (eds), The Ecological Bases for Lake and Reservoir Management.© 1999Kluwer Academic Publishers. Printed in the Netherlands.
227
Modelling catchment-scale nutrient transport to watercourses in the U.K.
Barry Shepherd1, David Harper1 & Andrew Millington2
1Department of Biology,2Department of Geography, University of Leicester, Leicester LE1 7RH
Key words:catchment modelling, hydrology, eutrophication, field survey, remotely sensed data, SWAT, reliabilityestimation, mollifier
Abstract
Water resource managers require catchment-scale nutrient transport models to help in the investigation and controlof diffuse pollution. Many different models exist for water and pollutant movement, causing problems of selectionbecause each model has often been constructed for specific purposes, and the choice of an appropriate one isdifficult: wrongly applied models can lead to unreliable results and misleading information. The selection of amodel for estimating phosphorus loss from a lowland English catchment is described. 14 models, whose underlyingprinciples had been published, were evaluated. ‘SWAT’ was found to be the most suitable. It has several favourablequalities, but also several shortfalls which may impair its predictive ability. Their identification enables the modelcode to be re-written. Reliability estimation is needed to ensure that the ranges of model prediction are known.
Introduction
Eutrophication is a continuous problem for water re-source managers (ICWE, 1992; Harper & Pacini,1995; Tim, 1996b). The most important nutrients ineutrophication are phosphorus, nitrogen and at timessilica (Heathwaite et al., 1990; Harper, 1992). Phos-phorus is more often limiting in freshwater systems,whereas nitrogen is more important in marine systems(Thomann & Mueller, 1987). In the past, nutrientsfrom point source effluents have been the main con-tributors (Harper, 1992). However, even though ter-tiary treatment has become more widespread and de-tergents contain fewer poly-phosphates (McGarrigle,1993), the limnological problem has not diminished.Attention has now switched to diffuse nutrient sourcesfrom intensive agriculture because there is increas-ing evidence of phosphorus runoff, as soil phosphoruscapacity is exceeded (De Willigen et al., 1990; Heath-waite et al., 1990; Burt & Heathwaite, 1993; Morseet al., 1993). The pollutants are of a diffuse, chronicnature, and so the overall impact on a river or lakecan only be evaluated by examination of the wholecatchment over a long period of time. The catchmentsystem includes spatial and temporal variables, and isdifficult if not impossible to describe without models(Styczen & Nielsen, 1989).
Models assist the collation and interpretation ofinformation, upon which decisions can be made forthe management of water resources (Shaw & Falco,1990; He et al., 1993; Tim & Jolly, 1994; Refsgaard& Abbott, 1996; Tim, 1996a). Their applications arediverse (e.g. pesticide movement, hydrograph produc-tion), and used by many disciplines. They provideinexpensive, repetitive and non-invasive questioningabout hypothetical scenarios and can support educa-tion and research into physical processes (Oliver etal., 1990; Shaw & Falco, 1990; Refsgaard et al.,1996; Tim, 1996b). Prediction of the movement ofrunoff through a catchment has been the most funda-mental requirement for water resource management,and has been developed more than other aspects ofwater management. The growing concern about ag-ricultural nutrients entering water bodies and causingdeterioration in water quality, has however resultedin the need for nutrient transport models. Nutrienttransport within a watershed depends almost entirelyupon hydrology. Some nutrient models have been de-scribed as an integral part of a larger modelling system(Nearing et al., 1986; Young, et al., 1989; Thorsenet al., 1996). Hydrological modelling has been moresuccessful than nutrient modelling, and although im-provements are needed in both, the latter still remainsto be adequately validated.
228
Model characteristics
There are several nutrient transport models available(Donigian & Rao, 1990), but it is not clear whetherthey are applicable to any catchment and for any scen-ario. Development of a new model is a complex taskbut often utilises specific databases, or applies to aspecific catchment or operation. Consequently, modelsmay be extremely limited in their use and have theirown assumptions. Most models have therefore beendeveloped but not tested (validated) as fully as theyshould be.
Generally two categories of model are recognised,conceptual and physically-based. Conceptual mod-els are based on experimental observations and donot try to mimic the processes of nutrient trans-port. Physically-based models describe the physical,chemical and biological processes perceived to bethe important ones affecting hydrology and nutrienttransport. However, it is accepted that the distinc-tion between the two is vague and that the modelledprocesses are only concepts of the system.
The distinction between applicability of the modeland reliability of the predictions is important. Almostany complex model can have many of its parametervalues adjusted to obtain a fit between its predicted andobserved values (calibration) (Klemes, 1986; Beven,1996; Fisher et al., 1997). Such adjustments may pro-duce values outside of the known ranges occurring inthe watershed. This may provide reliable results withina range of external variables, but may give a false im-pression of how applicable the perceived processes areto the watershed. Physically-based models are expec-ted to help in understanding the watershed processesand predict the effects of land-use and climate change.This necessarily involves parameter values outsidethose involved with the model’s calibration. If the pro-cesses are not truly applicable, yet are used due to theapparently reliable results, predictions could be veryunreliable. Conversely, careless calibration may maskhow well the algorithms reflect the system processes.Calibration may still be needed but must be carried outwith caution to avoid the above problems. Calibrationof conceptual models is required and is acceptable formanagement purposes provided the limitations are ob-served. Conceptual model output is ‘fitted’ to observedvalues through calibration and therefore relies heavilyon the relationship of the adjusted parameter valuesand the observed values. For this reason they strictlymust not be used when watershed variables fall out-side those within the calibration data set. For example
the U.S. export coefficient model of Beaulac & Reck-how (1982) applied by Johnes (1996) to the U.K., is amodelling system that requires calibration due to theabstracted way in which the data are derived. Exportcoefficients are used to account for the many sourcesof phosphorus within a watershed. These are thenserially adjusted until the predictive output matchesthe measured values at several points within the riveror lake catchment. This system requires calibrationbecause the parameter values are generally not meas-ured in the watershed and it is highly unlikely thatpre-calibrated output would compare well with meas-ured values. This system appears to work well eventhough the export coefficients may not relate to thosemeasured in the U.K. Export coefficient modelling isstrongly dependent on vast amounts of input data asparameters and instream data for calibration. Outputis limited to lumped output and cannot be consideredreliable for changes in environmental variables such asan increase in rainfall.
Reliability estimation
Confidence intervals are seldom reported for predic-tions from large-scale catchment modelling as they arefor simple regression analysis for example. Reliabilityestimation of the predictive output is essential to helpin identifying how well the model performs (Beven,1989, 1993; Beven & Binley, 1992) and how wellthe algorithms apply to the system. There are severalmethods available for assessing predictive reliabilityand model applicability. Two that have been applied toerosion and hydrological models are the GeneralisedLikelihood Uncertainty Estimation (GLUE) (Beven &Binley, 1992) and the mollifier-method (Keyzer &Sonneveld, 1997). Both estimate reliability of predict-ive output, but the mollifier method is also reported toassess error in the input. In order to assess the predict-ive output it needs to be compared with measured data.For the hydrological component, flow would have tobe measured at the outlet of the catchments. The frac-tions of phosphorus considered by the model must bemeasured also. Alternatively, total phosphorus can bemeasured in the river, at the outlet, as a sum of the frac-tions predicted by the model. Instream data need to beintensive enough to ensure that all rainfall events aresampled, and underestimation of flow and phosphorusloading avoided (Burn, 1991). Sub-optimal samplingwill result in comparison of model output with inac-curate data. Flow must be measured constantly and
229
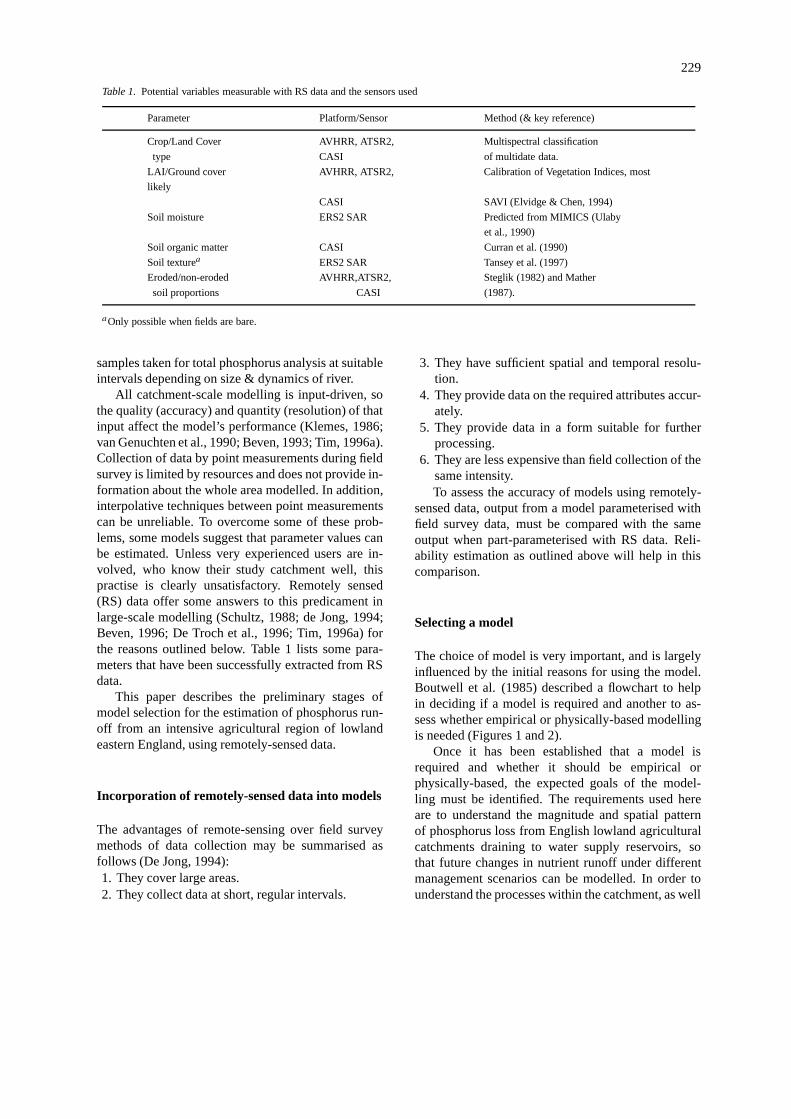
Table 1. Potential variables measurable with RS data and the sensors used
Parameter Platform/Sensor Method (& key reference)
Crop/Land Cover AVHRR, ATSR2, Multispectral classification
type CASI of multidate data.
LAI/Ground cover AVHRR, ATSR2, Calibration of Vegetation Indices, most
likely
CASI SAVI (Elvidge & Chen, 1994)
Soil moisture ERS2 SAR Predicted from MIMICS (Ulaby
et al., 1990)
Soil organic matter CASI Curran et al. (1990)
Soil texturea ERS2 SAR Tansey et al. (1997)
Eroded/non-eroded AVHRR,ATSR2, Steglik (1982) and Mather
soil proportions CASI (1987).
aOnly possible when fields are bare.
samples taken for total phosphorus analysis at suitableintervals depending on size & dynamics of river.
All catchment-scale modelling is input-driven, sothe quality (accuracy) and quantity (resolution) of thatinput affect the model’s performance (Klemes, 1986;van Genuchten et al., 1990; Beven, 1993; Tim, 1996a).Collection of data by point measurements during fieldsurvey is limited by resources and does not provide in-formation about the whole area modelled. In addition,interpolative techniques between point measurementscan be unreliable. To overcome some of these prob-lems, some models suggest that parameter values canbe estimated. Unless very experienced users are in-volved, who know their study catchment well, thispractise is clearly unsatisfactory. Remotely sensed(RS) data offer some answers to this predicament inlarge-scale modelling (Schultz, 1988; de Jong, 1994;Beven, 1996; De Troch et al., 1996; Tim, 1996a) forthe reasons outlined below. Table 1 lists some para-meters that have been successfully extracted from RSdata.
This paper describes the preliminary stages ofmodel selection for the estimation of phosphorus run-off from an intensive agricultural region of lowlandeastern England, using remotely-sensed data.
Incorporation of remotely-sensed data into models
The advantages of remote-sensing over field surveymethods of data collection may be summarised asfollows (De Jong, 1994):1. They cover large areas.2. They collect data at short, regular intervals.
3. They have sufficient spatial and temporal resolu-tion.
4. They provide data on the required attributes accur-ately.
5. They provide data in a form suitable for furtherprocessing.
6. They are less expensive than field collection of thesame intensity.To assess the accuracy of models using remotely-
sensed data, output from a model parameterised withfield survey data, must be compared with the sameoutput when part-parameterised with RS data. Reli-ability estimation as outlined above will help in thiscomparison.
Selecting a model
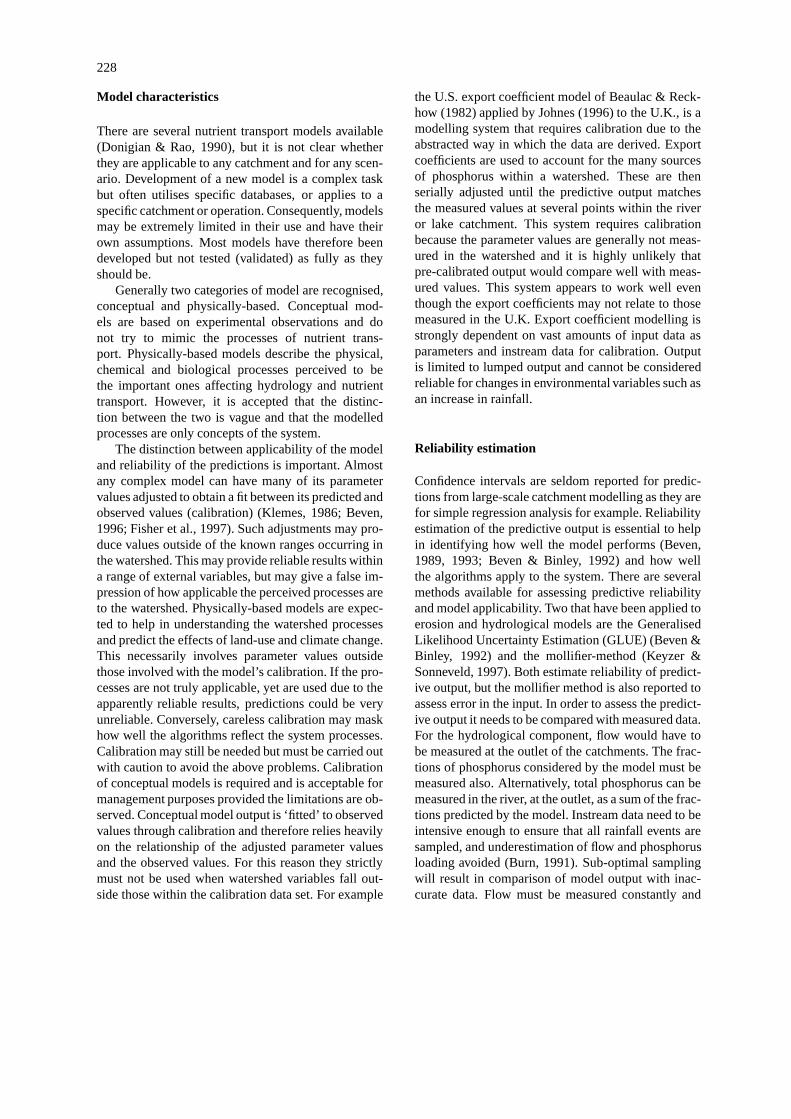
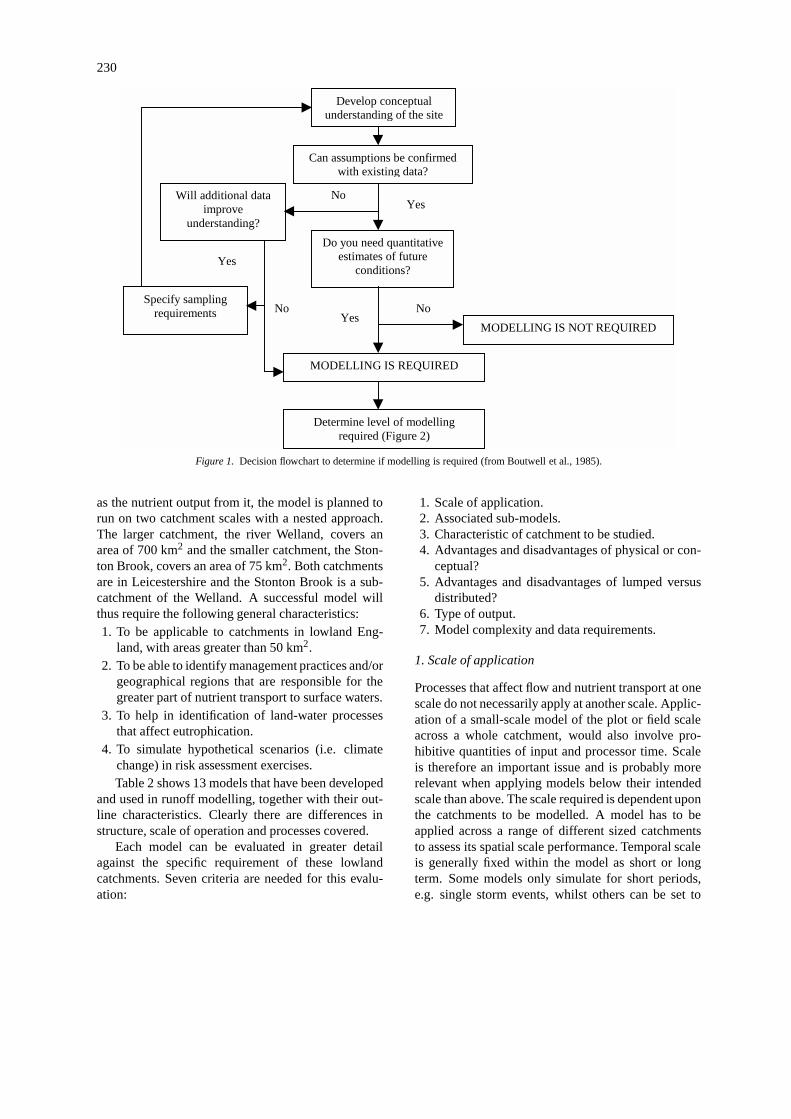
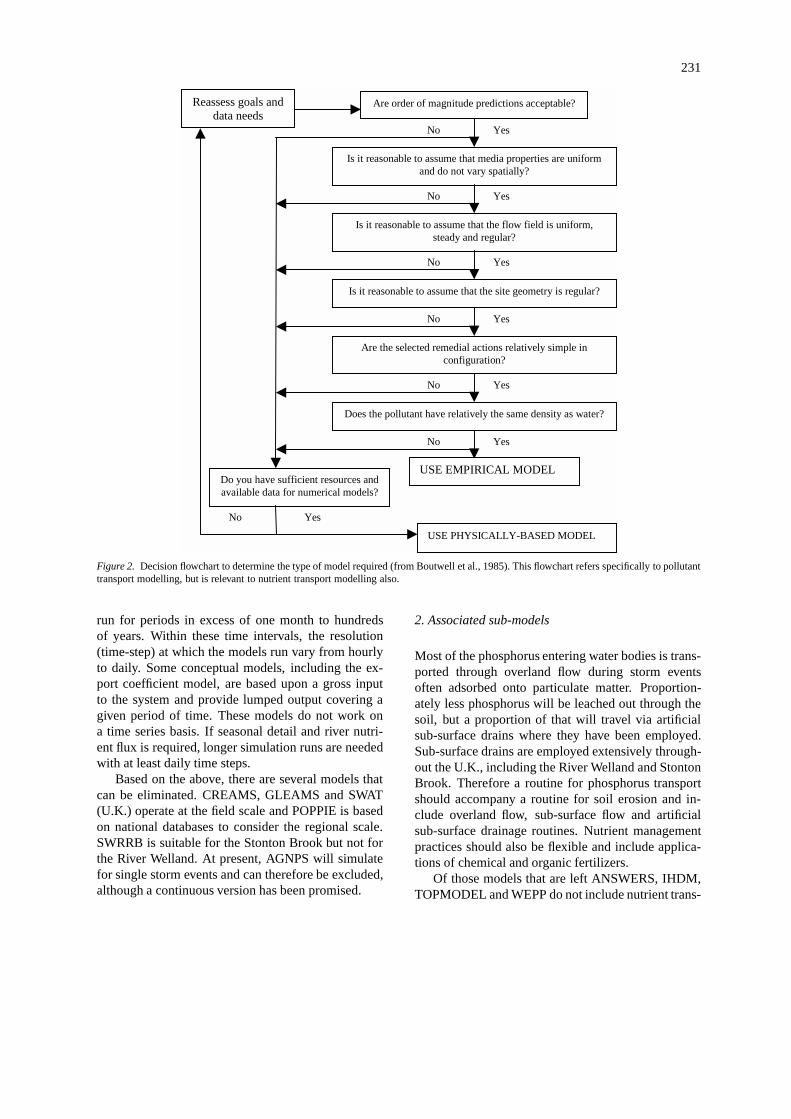
The choice of model is very important, and is largelyinfluenced by the initial reasons for using the model.Boutwell et al. (1985) described a flowchart to helpin deciding if a model is required and another to as-sess whether empirical or physically-based modellingis needed (Figures 1 and 2).
Once it has been established that a model isrequired and whether it should be empirical orphysically-based, the expected goals of the model-ling must be identified. The requirements used hereare to understand the magnitude and spatial patternof phosphorus loss from English lowland agriculturalcatchments draining to water supply reservoirs, sothat future changes in nutrient runoff under differentmanagement scenarios can be modelled. In order tounderstand the processes within the catchment, as well
230
Yes
YesNoNo
Yes
No
Develop conceptualunderstanding of the site
Can assumptions be confirmedwith existing data?
Do you need quantitativeestimates of future
conditions?
MODELLING IS NOT REQUIRED
Specify samplingrequirements
MODELLING IS REQUIRED
Determine level of modellingrequired (Figure 2)
Will additional dataimprove
understanding?
Figure 1. Decision flowchart to determine if modelling is required (from Boutwell et al., 1985).
as the nutrient output from it, the model is planned torun on two catchment scales with a nested approach.The larger catchment, the river Welland, covers anarea of 700 km2 and the smaller catchment, the Ston-ton Brook, covers an area of 75 km2. Both catchmentsare in Leicestershire and the Stonton Brook is a sub-catchment of the Welland. A successful model willthus require the following general characteristics:1. To be applicable to catchments in lowland Eng-
land, with areas greater than 50 km2.2. To be able to identify management practices and/or
geographical regions that are responsible for thegreater part of nutrient transport to surface waters.
3. To help in identification of land-water processesthat affect eutrophication.
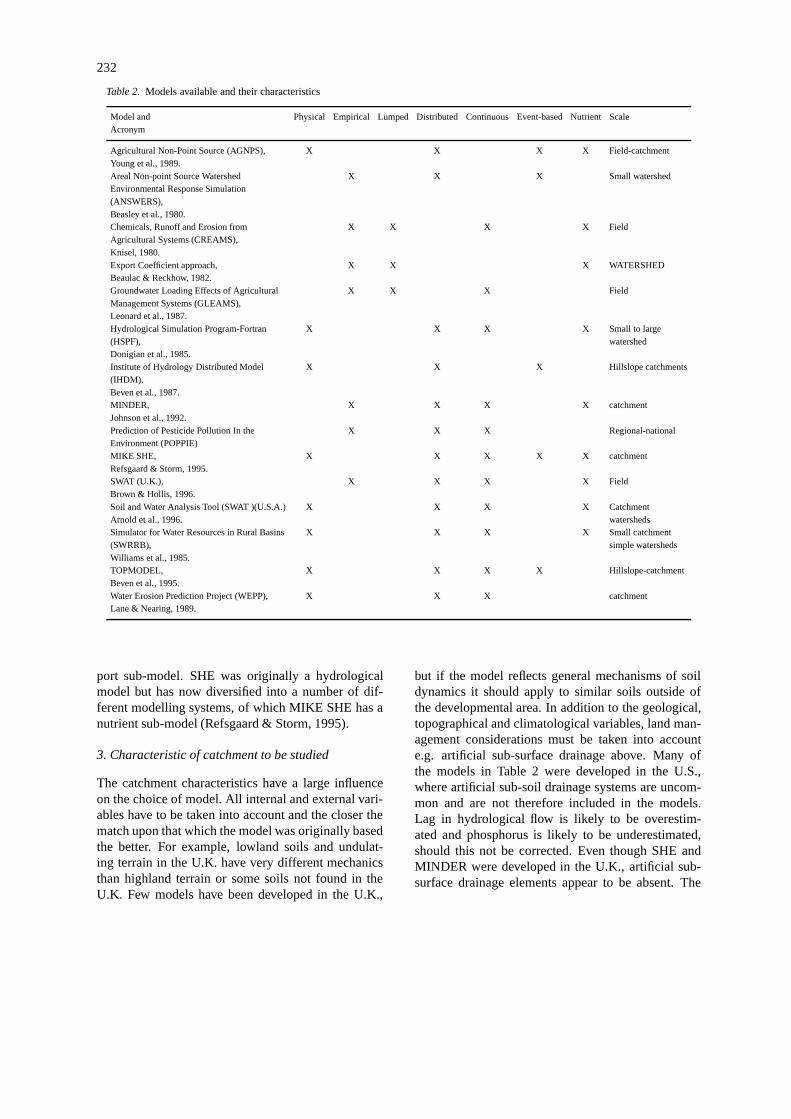
4. To simulate hypothetical scenarios (i.e. climatechange) in risk assessment exercises.Table 2 shows 13 models that have been developed
and used in runoff modelling, together with their out-line characteristics. Clearly there are differences instructure, scale of operation and processes covered.
Each model can be evaluated in greater detailagainst the specific requirement of these lowlandcatchments. Seven criteria are needed for this evalu-ation:
1. Scale of application.2. Associated sub-models.3. Characteristic of catchment to be studied.4. Advantages and disadvantages of physical or con-
ceptual?5. Advantages and disadvantages of lumped versus
distributed?6. Type of output.7. Model complexity and data requirements.
1. Scale of application
Processes that affect flow and nutrient transport at onescale do not necessarily apply at another scale. Applic-ation of a small-scale model of the plot or field scaleacross a whole catchment, would also involve pro-hibitive quantities of input and processor time. Scaleis therefore an important issue and is probably morerelevant when applying models below their intendedscale than above. The scale required is dependent uponthe catchments to be modelled. A model has to beapplied across a range of different sized catchmentsto assess its spatial scale performance. Temporal scaleis generally fixed within the model as short or longterm. Some models only simulate for short periods,e.g. single storm events, whilst others can be set to
231
Yes
Yes
Yes
Yes
Yes
Yes
YesNo
No
No
No
No
No
No
Are order of magnitude predictions acceptable?Reassess goals anddata needs
Is it reasonable to assume that media properties are uniformand do not vary spatially?
Is it reasonable to assume that the flow field is uniform,steady and regular?
Is it reasonable to assume that the site geometry is regular?
Are the selected remedial actions relatively simple inconfiguration?
Does the pollutant have relatively the same density as water?
USE PHYSICALLY-BASED MODEL
Do you have sufficient resources andavailable data for numerical models?
USE EMPIRICAL MODEL
Figure 2. Decision flowchart to determine the type of model required (from Boutwell et al., 1985). This flowchart refers specifically to pollutanttransport modelling, but is relevant to nutrient transport modelling also.
run for periods in excess of one month to hundredsof years. Within these time intervals, the resolution(time-step) at which the models run vary from hourlyto daily. Some conceptual models, including the ex-port coefficient model, are based upon a gross inputto the system and provide lumped output covering agiven period of time. These models do not work ona time series basis. If seasonal detail and river nutri-ent flux is required, longer simulation runs are neededwith at least daily time steps.
Based on the above, there are several models thatcan be eliminated. CREAMS, GLEAMS and SWAT(U.K.) operate at the field scale and POPPIE is basedon national databases to consider the regional scale.SWRRB is suitable for the Stonton Brook but not forthe River Welland. At present, AGNPS will simulatefor single storm events and can therefore be excluded,although a continuous version has been promised.
2. Associated sub-models
Most of the phosphorus entering water bodies is trans-ported through overland flow during storm eventsoften adsorbed onto particulate matter. Proportion-ately less phosphorus will be leached out through thesoil, but a proportion of that will travel via artificialsub-surface drains where they have been employed.Sub-surface drains are employed extensively through-out the U.K., including the River Welland and StontonBrook. Therefore a routine for phosphorus transportshould accompany a routine for soil erosion and in-clude overland flow, sub-surface flow and artificialsub-surface drainage routines. Nutrient managementpractices should also be flexible and include applica-tions of chemical and organic fertilizers.
Of those models that are left ANSWERS, IHDM,TOPMODEL and WEPP do not include nutrient trans-
232
Table 2. Models available and their characteristics
Model and Physical Empirical Lumped Distributed Continuous Event-based Nutrient ScaleAcronym
Agricultural Non-Point Source (AGNPS), X X X X Field-catchmentYoung et al., 1989.Areal Non-point Source Watershed X X X Small watershedEnvironmental Response Simulation(ANSWERS),Beasley et al., 1980.Chemicals, Runoff and Erosion from X X X X FieldAgricultural Systems (CREAMS),Knisel, 1980.Export Coefficient approach, X X X WATERSHEDBeaulac & Reckhow, 1982.Groundwater Loading Effects of Agricultural X X X FieldManagement Systems (GLEAMS),Leonard et al., 1987.Hydrological Simulation Program-Fortran X X X X Small to large(HSPF), watershedDonigian et al., 1985.Institute of Hydrology Distributed Model X X X Hillslope catchments(IHDM),Beven et al., 1987.MINDER, X X X X catchmentJohnson et al., 1992.Prediction of Pesticide Pollution In the X X X Regional-nationalEnvironment (POPPIE)MIKE SHE, X X X X X catchmentRefsgaard & Storm, 1995.SWAT (U.K.), X X X X FieldBrown & Hollis, 1996.Soil and Water Analysis Tool (SWAT )(U.S.A.) X X X X CatchmentArnold et al., 1996. watershedsSimulator for Water Resources in Rural Basins X X X X Small catchment(SWRRB), simple watershedsWilliams et al., 1985.TOPMODEL, X X X X Hillslope-catchmentBeven et al., 1995.Water Erosion Prediction Project (WEPP), X X X catchmentLane & Nearing, 1989.
port sub-model. SHE was originally a hydrologicalmodel but has now diversified into a number of dif-ferent modelling systems, of which MIKE SHE has anutrient sub-model (Refsgaard & Storm, 1995).
3. Characteristic of catchment to be studied
The catchment characteristics have a large influenceon the choice of model. All internal and external vari-ables have to be taken into account and the closer thematch upon that which the model was originally basedthe better. For example, lowland soils and undulat-ing terrain in the U.K. have very different mechanicsthan highland terrain or some soils not found in theU.K. Few models have been developed in the U.K.,
but if the model reflects general mechanisms of soildynamics it should apply to similar soils outside ofthe developmental area. In addition to the geological,topographical and climatological variables, land man-agement considerations must be taken into accounte.g. artificial sub-surface drainage above. Many ofthe models in Table 2 were developed in the U.S.,where artificial sub-soil drainage systems are uncom-mon and are not therefore included in the models.Lag in hydrological flow is likely to be overestim-ated and phosphorus is likely to be underestimated,should this not be corrected. Even though SHE andMINDER were developed in the U.K., artificial sub-surface drainage elements appear to be absent. The
233
U.S. models HSPF and SWAT also do not have com-ponents for artificial sub-surface drainage and is onefactor that will have to be accepted, but consideredcarefully during application.
4. Lumped or distributed?
The catchment is a geographical entity and all datarelating to modelling systems of the type describedin this paper are spatial in nature. Valuable inform-ation is lost if the distributed nature of the collecteddata is lumped together as many simple models do.Lumping the input data and output offers few insightsinto spatial heterogeneity of factors making up ‘nutri-ent hotspots’. If distributed input and output are used,an area within the study catchment can be isolatedfrom the catchment as a whole and simulation runsexecuted. This can examine the effects of scale on themodel. To simplify the mathematics and limit the data,the catchment is generally partitioned into discreteunits (discretization) based on natural boundaries suchas those of sub-catchment hydrological boundaries orartificial units, i.e. a grid. Within these units, dataand output is lumped and routed to adjoining units.However, Fisher et al. (1997) indicated that AGNPSand CREAMS do not exhibit spatial distribution oftheir outputs although it is claimed that they do. Thisis worrying because many of the USDA models (i.e.WEPP and SWAT) are based on similar algorithms. Itis possible however, that this may be an artefact of spa-tial randomisation of variables, rather than a reflectionof their spatial insensitivity. All the remaining modelsare distributed in their algorithm processing. Distrib-uted and quantitative output from models are welldocumented in Abbott & Refsgaard (1996), whichdo offer some spatial information (see Beven, for arationalisation of distributed models).
5. Physical or conceptual?
The flow chart in Figure 2 will indicate whether aphysical or conceptual model is required. In order touse models, to help in understanding the processesaffecting phosphorus transport, it is necessary for themodel to attempt to mimic the processes thought tooccur in the watershed. As outlined above, conceptualmodels do not offer this provision. Physically-basedmodels can give insight into catchment processes,providing the algorithms reflect these processes. Fu-ture land-use change and climate change will includevariables outside those currently measured. Outputfrom conceptual models that include climate change
must be regarded with caution. Physically-based mod-els are the only alternative (Beven, 1992). MINDERand the export coefficient system is based on empiricalrelationships of phosphorus input to measured outputsand is therefore excluded.
6. Type of output
The form of output required can be very important.Several authors note how important stochasticity canbe (Plate & Duckstein, 1990; Vauchad et al., 1990),and is more often associated with large spatial andtemporal scale models (Rose et al., 1990). However,deterministic models can be assessed stochasticallyby performing Monte Carlo analysis (Quinn, pers.comm.) whereby input values are varied sequentiallywithin a given range and output is calculated for eachchange. The result is a clustering of predictions. Themost probable results will be found in the densest areaof the scattergram. Achievement of this is entirelydependent on few parameters or highly accurate meas-urements. Therefore this is not so much a requirementof the model as of the data.
7. Model complexity and data requirements
The simpler a model is the better it is for data col-lection and management. Complex models with manyparameters are more prone to equifinality than mod-els with fewer parameters. WEPP offers methodsof estimating parameters should data be unavailable(WEPP manual). Such techniques may compromisereliability when compared to simpler models where allparameters can be measured. Scale of input will alsoimpact on the performance of the output. The moredata there is available for input the better, hence thereason for utilising RS data. Some field survey datawill always be required and the intensity of samplingwill largely be based on the available resources. Whenthe scale issue is considered and either the model orsampling needs to be investigated across scales, theintensity of field survey data is an important factor toconsider. In the case of assessing the model’s applic-ability across scales, the sampling intensity needs to becomparable between the scales, whereas, if input scaleis to be investigated, the intensity of sampling will dif-fer between scales in order to identify the minimumdata requirements. Scale of the data input is resource-dependent but will decrease in intensity as the numberof parameters requiring measurement increases. SHEhas a very high number of parameters and is gener-ally used via consultancy rather than by individuals
234
(Kilsby, pers. comm.). Additionally, MIKE SHE has ahigh commercial cost. Unfortunately HSPF and SWAThave high numbers of parameters, and will requiremore effort to apply than simpler systems. GeographicInformation Systems (GIS) allow large quantities ofspatial data to be analysed very efficiently (He et al.,1993; Tim & Jolly, 1994; Adamus & Bergman, 1995;Deckers & Te Stroet, 1996; Tim, 1996a). The use ofGIS with the model can therefore overcome some ofthe problems mentioned above. SWAT has been linkedto GIS and also has a good graphical user interface(GUI). HSPF has not been linked to a GIS and re-quires a detailed knowledge of Fortran. This will beacceptable for research but would not be popular forapplication.
Final model selection
SWAT therefore appears to be the most suitable model.A full description of SWAT is contained in Arnold
et al. (1996). SWAT is a logical progression from, andamalgamation of, other hydrology and diffuse pollut-ant models such as CREAMS, GLEAMS and ROTOdeveloped by the United States Department of Agri-culture, Agricultural Research Service (USDA-ARS).The main reasons for development were to model largecatchments for several aspects of land management,such as soil erosion and agricultural pollution. Manythousands of square kilometres can be modelled, andto limit processing time, the catchment is divided intosub-basins. Each sub-basin is then individually dis-cretised in a number of ways depending on extent ofheterogeneity. Parameter values are stored in databasefiles which are opened as needed and then closed toaid in efficient use of computer time. It has a workingGraphical User Interface (GUI) and is available forPC, Solaris and IRIX operating systems. To furtheraid efficient data processing, there is a link programmebetween SWAT and the GRASS GIS. SWAT is a fairlycomplex system and requires evaluation of many para-meters. Notwithstanding the technical and theoreticalproblems associated with this, there are also the re-source requirements for collection of data. Many ofthe parameters used in SWAT are available from ex-isting databases relevant to the U.S. but not the U.K.Digitised soil maps are available, and there are somedata available from Ministry of Agriculture Fisheriesand Food (MAFF) from its Agricultural Census. How-ever, most of the data will have to be pre-processedfor inclusion in SWAT. RS data can be processed in
a form suitable for use in GRASS which should thenbe available to SWAT. It is inevitable that some datawill have to be estimated, but the detrimental effects ofthis can be reduced by identification through sensitiv-ity analysis of the parameters that are most influential(sensitive) in the model. In addition to a hydrolo-gical model, SWAT combines a series of sub-modelsto simulate processes of interest within agriculturalcatchments. These are phosphorus and nitrogen trans-port, soil erosion, pesticide transport, crop growth andlake water quality. Phosphorus is the only sub-routineof interest here but the others will have advantages forwater quality managers.
In the U.S., SWAT has been applied to two wa-tersheds for validation at Riesel, Texas of 17.7 km2,and the Lower Colorado River of 8927 km2 (Arnold etal., 1990). The former was validated against measuredwater and sediment yields and the latter was validatedagainst water yields only. Bingner (1996) also usedSWAT to simulate water yield on the Goodwin Creekwatershed (21.31 km2). The latter study discretisedthe watershed into sub-basins that were assumed tobe homogeneous. Each sub-basin outlet was served bya streamflow-measuring station. Results for hydrolo-gical response were good within each sub-basin forten years’ data using rainfall and flow. This indic-ates that SWAT is spatially sensitive even when usingthe coarsest discretization method (sub-basin). Resultsshow that the data was only reliable with this format ofthe model when comparing the lumped output, ratherthan individual events. It may become more respons-ive to individual rainfall events if grid discretizationwas used together with more measured data from thesub-basins rather than estimates. This amount of in-formation cannot be considered adequate to assess amodel’s validity across a range of catchment types,nor the accuracy of its sub-routines. No informationhas been found regarding its predictive performance ofphosphorus transfer. However, the above studies indic-ate adequate flow predictions on small and large-scalecatchments.
SWAT operates on a daily timestep and is designedto simulate for as many as a hundred years. It willtherefore provide detailed flow and flux charts overalmost any period of simulation, but the study byBingner (1996) may indicate that it is more suited tolonger runs. In order to make an assessment of SWATacross scales in the U.K., two catchments have beenselected on which to apply the model. These catch-ments, detailed above, fall into the category small tomedium which appears to suit SWAT. By using nested
235
catchments the effects of scale and the model’s abilityto process distributed data will be assessed.
Phosphorus transport in SWAT is based initiallyupon its partitioning into soluble and particulatephases. Water flow is divided into overland flowand through-flow using the Soil Conservation Ser-vice (SCS) curve number. Output from these routinesare then used in conjunction to calculate particulatephosphorus via erosion using the Modified UniversalSoil Loss Equation (MUSLE), and soluble phosphorusthrough surface runoff. These are the only routes forphosphorus transport included in SWAT. Phosphorusis also transported through the soil to water bodies andvia soil drains, but is ignored. This is likely to un-derestimate phosphorus, especially if applied in areaswith sub-surface drains. To overcome this problemthe model code must be modified, or as a tempor-ary measure the output adjusted to account for knownphosphorus levels entering water bodies through thesoil and via sub-surface drains.
SWAT was developed for a broad applicationacross much of the U.S. and is based on general prin-ciples such as the water balance equation shown below(from Arnold et al., 1996):
SWt = SW= t
6i=1(Ri −Qi − ETi − Pi −QRi,
where SW is soil water content minus the 15-bar watercontent,t is time in days,R, Q, ET , P andQR aredaily amounts of precipitation, runoff, evapotranspir-ation, percolation and return flow. This physical basisshould allow SWAT to be based on U.K. catchments.There is provision in SWAT to estimate many of theparameter values, based on U.S. measurements, butthis could lead to erroneous results if used in the U.K.A reasonable appraisal can be made of SWAT in theU.K. provided as many of the variables as possible aremeasured rather than estimated.
SWAT claims to be physically-based even thoughsome of the principles are conceptual such as the SCScurve number. In the main however, the routines arebased on current understanding of the catchment pro-cesses. The number of parameters is high and thiscan obscure clarity in understanding the system, andreduces the ability to isolate error. To counter theseproblems sensitivity analysis will ensure that the mostinfluential parameters are identified.
Output from SWAT is distributed and simulationsfor individual areas can be requested rather than justat the catchment outlet. In addition, it uses a continu-ous time scale based on a daily time step. This will
allow flux graphs to be generated for the period ofsimulation.
Although the SCS curve is U.S. based, it hasbeen applied in the U.K. (Morse et al., 1994). TheUSDA-ARS has plans to include the Green and Amptprinciples as an alternative percolation model to theSCS curve (Arnold, pers. comm.). Such an alternat-ive would help for the U.K. scenario. For long termsimulation runs, climate variables can be generated asinput to SWAT, based on geographical co-ordinates. Itis not documented that this system works outside ofthe U.S., but there is an extensive weather data archivein the U.K. from which future climate input can begenerated.
Conclusion
The basic characteristics of catchment-scale nutrienttransport models and the reasons for their use havebeen described. There are many models available andmany are difficult to assess. The choice of modelfor a given scenario is an important one, and canaffect the performance of it in predictive output. How-ever, the choice is not a simple process. A projectin which catchment-scale nutrient transport model-ling is needed is used as an example to outline theselection of a suitable model. From a table of 14 mod-els, three appear suitable in application in a researchsense: HSPF, SHE and SWAT. There are two advant-ages that SWAT has over HSPF; a GIS link and auser-friendly Graphical User Interface. SHE would bethe obvious selection due to its European base, butits complexity and cost are too great for this project.SWAT was selected as the preferred option and a moredetailed appraisal made. SWAT contains all the phys-ical characteristics of the ideal model such as scaleand distributed nature. It has a fully functioning GUIand GIS link, that are advantages in this application.Where it falls short of the project requirements, how-ever, is in the physical processes of hydrology andphosphorus transport. There is no routine for sub-soildrainage which is prevalent in the U.K. Additionally,it is assumed that phosphorus is transported only viaoverland runoff. Whilst it is true that most of the phos-phorus is transported in this fashion, it is not the onlyroute. However, the programming code for this modelis available and could be altered to account for thesetwo factors. This shows that all of the considerationsdiscussed are required to ensure correct applicationof models. Assumptions of the models are not al-
236
ways as obvious as this and they are not normallydocumented in scientific literature. Finally, without re-liability estimation, it is impossible to know how goodthe model’s performance actually is. Although reliab-ility estimation is being used in the stated project toassess the efficacy of RS data, it could equally be usedon its own to assess the normal working performanceof a model.
Acknowledgements
The project is funded as a CASE Ph.D. grantfrom NERC and the EA to Barry Shepherd, Ref.GT22/96/EO/3. The authors are grateful to PeterFisher, Steven Anthony, Paul Quinn & Fraser Gem-mell for their kind guidance on modelling and relatedsubjects, and to Bill Brierley, Nick Haycock & PeterBuckland for their help in this project.
References
Abbot, M. B. & J. C. Refsgaard, 1996. Distributed HydrologicalModelling. Kluwer Academic Publishers, Dortrecht.
Adamus, C. L. & M. J. Bergman, 1995. Estimating nonpoint sourcepollution loads with a GIS screening model. Water ResourcesBulletin 31(4): 647–655.
Arnold, J. G., R. Srinivasan & K. W. King, 1996. SWAT: Soil andWater Assessment Tool. USDA, ARS, Temple, Texas.
Beasley, D. B., L. F. Huggins, & E. J. Monke, 1980. ANSWERS: amodel for watershed planning. Transactions of the ASAE 23(4):938–944.
Beaulac, M. N. & K. M. Reckhow, 1982. An examination of land-use-nutrient export relationships. Water Resources Bulletin 18:1013–1024.
Beven, K. J., 1989. Changing ideas in hydrology – the case ofphysically-based models. Journal of Hydrology 105: 157–172.
Beven, K. J., 1993 Prophecy, reality and uncertainty in distributedhydrological modelling. Advances in Water Resources 16: 41–51.
Beven, K. J., 1996. A discussion of distributed hydrological mod-elling. In M. B. Abbott & J. C. Refsgaard (eds). Distributed Hy-drological Modelling. Kluwer Academic Publishers, Dortrecht.
Beven, K. J. & A. M. Binley, 1992. The future of distributed mod-els: model calibration and predictive uncertainty. HydrologicalProcesses 6: 279–298.
Beven, K. J., A. Calver & E. Morris, 1987. The Institute of Hy-drology Distributed Model. Institute of Hydrology Report 98,Wallingford, U.K.
Beven, K. J., R. Lamb, P. Quinn, R. Romanowicz & J. Freer,1995. TOPMODEL. In V. P. Singh (ed.), Computer Models ofWatershed Hydrology. Water Resources Publications, Colorado,U.S.
Bingner, R. L., 1996. Runoff Simulated from Goodwin Creek Wa-tershed Using SWAT. Transactions of the ASAE 39(1): 85–90.
Boutwell, S. H., S. M. Brown, B. R. Roberts & D. F. At-wood, 1985. Modelling remedial actions at uncontrolled haz-ardous waste sites. Anderson-Nichols and Co., Inc., Palo Alto,
CA., EPA/540/2-85/001. Prepared for Environmental ProtectionAgency, Hazardous Waste Engineering Research Laboratory,Cincinnati, OH.
Burn, D. H., 1991. Water quality sampling for nutrient loading es-timation. In L. C. Wrobel & C. A. Brebbia (eds), Water Pollution:Modelling, Measuring and Prediction. Proceedings of the FirstInternational Conference on Water Pollution. Elsevier AppliedScience, London.
Burt, T. P. & A. L. Heathwaite, 1993. A scale-dependent approach tothe study of nutrient export from basins. Institute of HydrologyReport 120: 82–92.
Curran, P. J., G. M. Foody, K. Y. Kondratyev, V. V. Kozoderov & P.P. Fedchenko, 1990. Remote Sensing of Soils and Vegetation inthe USSR. Taylor and Francis, London.
Deckers, F. & C. B. M. Te Stroet, 1996. Use of GIS and databasewith distributed modelling. In M. B. Abbott & J. C. Refsgaard(eds), Distributed Hydrological Modelling. Kluwer AcademicPublishers, Dortrecht.
de Jong, S. M., 1994. Applications of Reflective Remote Sensingfor Land Degradation Studies in a Mediterranean Environment.Netherlands Geographical Studies 177.
de Troch, F. P., P. A. Troch, Z. Su & D. S. Lin, 1996. Application ofremote sensing for hydrological modelling. In M. B. Abbott & J.C. Refsgaard (eds), Distributed Hydrological Modelling. KluwerAcademic Publishers, Dortrecht.
de Willigen, P., L. Bergström & R. G. Gerritse, 1990. Leachingmodels of the unsaturated zone: their potential use for manage-ment and planning. In D. G. Decoursey (ed.), Proceedings OfAn International Symposium On Water Quality Modelling OfAgricultural Non-Point Source Pollution. Logan, UT ARS-81USDA-ARS, Washington DC, U.S.
Donigian, A. S. & P. S. C. Rao, 1990. Selection, application andvalidation of environmental models. In D. G. Decoursey (ed.),Proceedings International Symposium on Water Quality Mod-elling of Agricultural Non-Point Sources. Logan, UT ARS-81USDA-ARS, Washington D.C.
Elvidge, C. D. & Z. Chen, 1995. Comparison of broad-band andnarrow band red and near-infrared vegetation indices. RemoteSensing of the Environment 54: 38–48.
Elser, J. J., E. R. Marzolf, & C. R. Goldman, 1990. Phosphorusand nitrogen limitation of phytoplankton growth in the fresh-waters of north America: a review and critique of experimentalenrichments. Can. J. Fish. aquat. Sci. 47: 1468–1477.
Fisher, P., R. J. Abrahart, & W. Herbinger, 1997. The sensitivity oftwo distributed non-point source pollution models to the spatialarrangement of the landscape. Hydrological Processes 11: 241–252.
Franks, S. W., K. J. Beven, P. F. Quinn, & I. R. Wright, 1995. On thesensitivity of soil-vegetation atmosphere transfer SVAT schemes:equifinality and the problem of robust calibration. Agriculture,Forestry and Meteorology.
Harper, D. M., 1992. Eutrophication of Freshwaters: PrinciplesProblems and Restoration. Chapman & Hall, London.
Harper, D. M. & N. Pacini, 1995. Eutrophication Control Methodo-logies. National Rivers Authority Peterborough, U.K.
He, C., J. F. Riggs & Y-T. Kang, 1993. Integration of geographicinformation systems and a computer model to evaluate impactsof agricultural runoff on water quality. Water Resources Bulletin29(8): 891–900.
Heathwaite, A. L., T. P. Burt & S. T. Trudgill, 1990. The effect ofland use on nitrogen, phosphorus and suspended sediment deliv-ery to streams in a small catchment in south-west England. In J.B. Thornes (ed.), Vegetation and Erosion. John Wiley and SonsLtd.
237
ICWE, 1992. The Dublin Statement and report of the conference.International Conference on Water and the Environment: Devel-opment issues for the 21st century. 26–31 January 1992, Dublin,Ireland.
Johnes, P. J., 1996. Evaluation and management of the impact ofland use change on the nitrogen and phosphorus load deliveredto surface waters: the export coefficient modelling approach.Journal of Hydrology 183: 323–349.
Keyzer, M. A. & B. G. J. S. Sonneveld, 1997. Using the Mollifier-Method to Characterise data sets and models: the case of theUniversal Soil Loss Equation. Centre for World Food Studies.
Kleme, V., 1986. Dilettatism in Hydrology: Transition or Destiny?Water Resources Research 22: 177S–188S.
Knisel, W. G. (ed.), 1980. CREAMS: A Field Scale Model forChemicals, Runoff, and Erosion from Agricultural Manage-ment Systems. Conservation Research Report, 20, USDA-ARS,Washington DC, U.S.
Lane, L. J. & M. A. Nearing, 1989. USDA–Water Erosion Pre-diction Project: Hillslope profile model documentation. NSERLReport No.2, USDA-ARS, National Soil Erosion ResearchLaboratory, West Lafayette, Indiana 47907.
Leonard, R. A., W. G. Knisel, & D. A. Still, 1987. GLEAMS:Groundwater loading effects of agricultural management sys-tems. Transactions of the ASAE 305: 1403–1418.
Mather, P. M., 1987. Computer Processing of Remotely SensedImages. John Wiley & Sons, Chichester, U.K.
McGarrigle, M. L., 1993. Aspects of river eutrophication in Ireland.Ann. Limnol. 29(3-4). 355–364.
Morse, G., A. Eatherall & A. Jenkins, 1994. Managing agricul-tural pollution using a linked Geographical Information Systemand non-point source pollution model. Journal of the Institute ofWater and Environmental Management 8: 277–286.
Morse, G. K., J. N. Lester & Parry, R. 1993. The Economic andEnvironmental Impact of Phosphorus Removal from Wastewaterin the European Community. Selper Publications.
Nearing, M. A., G. R. Foster, L. J. Lane & S. C. Finkner, 1990.A process-based soil erosion model for USDA – Water ErosionPrediction Project. Transactions of the ASAE 32(5): 1587–1593.
Oliver, G., J. Burt, & R. Solomon, 1990. The use of surface runoffmodels for water quality decisions-a user’s perspective. In D.G. Decoursey (ed.), Proceedings of an International Symposiumon Water Quality Modelling of Agricultural Non-Point SourcePollution. Logan, UT ARS-81 USDA-ARS, Washington DC,U.S.
Plate, E. J. & L. Duckstein, 1990. Stochastic aspects of water qual-ity modelling for nonpoint sources. In D. G. Decoursey (ed.),Proceedings of an International Symposium on Water QualityModelling of Agricultural Non-Point source Pollution. Logan,UT ARS-81 USDA-ARS, Washington DC, U.S.
Quinn, P. F. & K. J. Beven, 1993. Spatial and temporal predictions ofsoil moisture dynamics, runoff, variable source areas and evapo-transpiration for Plynlimon, mid-Wales. Hydrological Processes7: 425–448.
Refsgaard, J. C. & M. B. Abbott, 1996. The role of distributedhydrological modelling in water resources management. In M.B. Abbott, & J. C. Refsgaard, (eds), Distributed HydrologicalModelling. Kluwer Academic Publishers, Dortrecht.
Refsgaard, J. C. & B. Storm, 1995. MIKE SHE. In V. P. Singh, (ed.),Computer Models of Watershed Hydrology. Water ResourcesPublications, Colorado, U.S.
Refsgaard, J. C., B. Storm & M. B. Abbott, 1996. Comment on “A
discussion of distributed hydrological modelling” by K. Beven.In M. B. Abbott & J. C. Refsgaard (eds), Distributed Hydrolo-gical Modelling. Kluwer Academic Publishers, Dortrecht.
Rose, C. W., W. T. Dickinson, H. Ghadiri & S. E. Jøregnsen,1990. Agricultural nonpoint-source runoff and sediment yieldwater quality NPSWQ models: modeller’s perspective. In D.G. Decoursey (ed.), Proceedings of an International Symposiumon Water Quality Modelling of Agricultural Non-Point SourcePollution. Logan, UT ARS-81 USDA-ARS, Washington DC,U.S.
Schultz, G. A., 1988. Remote sensing in hydrology. Journal ofHydrology 100: 239–265.
Shaw, R. R. & J. W. Falco, 1990. A management perspective on wa-ter quality models for agricultural nonpoint sources of pollution.In D. G. Decoursey (ed.). Proceedings of an International Sym-posium on Water Quality Modelling of Agricultural Non-PointSource Pollution. Logan, UT ARS-81 USDA-ARS, WashingtonDC, U.S.
Steglik, O., 1982. A technique for retrieving soil erosion based onremote sensing data. Studies of the Earth from Space 3: 92–95.
Styczen, M. & S. A. Nielsen, 1989. A view of soil erosion theory,process-research and model building: possible interactions andfuture developments. Quaderni Di Scienza Del Suolo 2: 27–45.
Tansey, K. J., A. C. Millington, K. White & A. Battikhi, 1997.Comparison of modelled backscatter response and ERS-1 SARdata for desert surfaces, the eastern Badia of Jordan. Proceed-ings Third ERS Symposium on Space at the Service of ourEnvironment, Florence 1997, ESA SP-414, Vol 1: 21–26.
Thomann & Mueller, 1987.Thorsen, M., J. Feyen & M. Styczen, 1996. Agrochemical model-
ling. In M. B. Abbott & J. C. Refsgaard (eds), Distributed Hy-drological Modelling. Kluwer Academic Publishers, Dortrecht.
Tim, U. S., 1996a Emerging technologies for hydrologic and wa-ter quality modelling research. Transactions of the ASAE 39(2):465–476.
Tim, U. S., 1996b. Coupling vadose zone models with GIS:emerging trends and potential bottlenecks. J. Envir. Qual. 25:535–544.
Tim, U. S. & R. Jolly, 1994. Evaluating agricultural nonpoint-sourcepollution using integrated GIS and hydrological/water qualitymodel. J. Envir. Qual. 231: 25–35.
Ulaby, F. T., K. Sarabandi, K. McDonald, M. Whitt & M. C.Dobson, 1990. Michigan microwave canopy scattering model.International Journal of Remote Sensing 117: 1223–1253.
Vachaud, G., M. Vauclin & T. M. Addiscott, 1990. Solute transportin the vadose zone: a review of models. In D. G. Decoursey (ed.),Proceedings of an International Symposium on Water QualityModelling of Agricultural Non-Point Source Pollution. Logan,UT ARS-81 USDA-ARS, Washington DC, U.S.
van Genuchten, M. T., S. M. Gorelick & W. W-G. Yeh, 1990. Ap-plication of Parameter estimation techniques to solute transportstudies. In D. G. Decoursey (ed.), Proceedings of an Interna-tional Symposium on Water Quality Modelling of AgriculturalNon-Point Source Pollution. Logan, UT ARS-81 USDA-ARS,Washington DC, U.S.
Williams, J. R., A. D. Nicks & J. G. Arnold, 1985, Simulator forWater Resources in Rural Basins. ASCE Journal of HydraulicEngineering 11: 970–986.
Young, R. A., C. A. Onstad, D. D. Bosch & W. P. Anderson,1989. AGNPS: A nonpoint-source pollution model for evaluatingagricultural Watersheds. Journal of Soil and Water Conservation.