Embed Size (px)
Citation preview

1
Modelling and experimental study on -phase depletion behaviour of
HVOF sprayed free-standing CoNiCrAlY coatings during oxidation
H. Chena,
*, G. A. Jacksonb, K. T. Voisey
b and D. G. McCartney
b
aDepartment of Mechanical, Materials and Manufacturing Engineering, Faculty of
Science and Engineering, University of Nottingham Ningbo China, Ningbo 315100,
China
bAdvanced Materials Research Group, Faculty of Engineering, University of
Nottingham, University Park, Nottingham NG7 2RD, UK
Abstract
This paper investigates the β-phase depletion behaviour during oxidation of free-standing
CoNiCrAlY (Co-31.7%Ni-20.8%Cr-8.1%Al-0.5%Y, all in wt%) bond coats prepared by high
velocity oxy-fuel (HVOF) thermal spraying. The microstructure of the coatings was
characterised using scanning electron microscopy with energy dispersive X-ray (EDX)
analysis and electron backscatter diffraction (EBSD). It comprises a two phase structure of
fcc-Ni and bcc -NiAl, with grain sizes varying largely from 0.5 to 2 µm for both phases.
Isothermal oxidation tests of the free-standing coatings were carried out at 1100 C for times
up to 250 h. The phase depletion behaviour at the surface was measured and was also
simulated using Thermo-Calc and DICTRA software. An Al flux function derived from an
oxide growth model was employed as the boundary condition in the diffusion model. The
diffusion calculations were performed using the TTNi7 thermodynamic database together
with the MOB2 mobility database. Reasonable agreement was achieved between the
measured and the predicted element concentration and phase fraction profiles after various

2
time periods. Grain boundary diffusion is likely to be important to element diffusion in this
HVOF sprayed CoNiCrAlY coating due to the sub-micron grains.
Keywords: HVOF spraying; MCrAlY; Oxidation; depletion; Diffusion
*Corresponding Author. Tel.: +86-574-88180946; Fax: +86-574-88187462.
E-mail address: [email protected]

3
1. Introduction
Thermal barrier coatings (TBCs) are widely used to protect high temperature components in
turbine engines from harsh operating environments [1, 2]. TBC systems consist of a ceramic
top coat, a metallic bond coat and a superalloy substrate [3-5]. Additionally, a thermally
grown oxide (TGO) forms at the interface between the top coat and the bond coat during
service at elevated temperature due to the fact that oxygen permeates through the ceramic top
coat and oxidises the bond coat. The durability of the overall TBC system is largely
determined by the microstructural, chemical and mechanical characteristics of the bond coat
[6-8]. Among different types of bond coats, MCrAlY overlay coatings, where M = Co, Ni or a
combination of the two, are of great interest for their excellent oxidation resistance and good
adhesion between the top coat and the superalloy substrate [9-16]. Depending on the
compositions, MCrAlYs generally exhibit a multi-phase structure; e.g. a fcc -Ni matrix and a
bcc -NiAl secondary phase. The -NiAl acts as an aluminium source and promotes the stable
and continuous formation of aluminium oxides, predominantly Al2O3, during oxidation. This
Al2O3 scale, also referred to as the TGO, forms between the top coat and the MCrAlY bond
coat [10, 17-19]. It is widely recognised that the growth of the TGO during service causes
progressive build-up of stress in the system, leading to the spallation of the ceramic top coat
and eventually causing detrimental effects to the turbine engine components [20-22]. The
continuous growth of the TGO due to aluminium diffusion from the MCrAlY bond coat
results in subsequent phase depletion at the oxide/bond coat interface [23-28], causing
mechanical and chemical degradation of the coating. Degradation of the bond coat also occurs
due to interdiffusion of element between the MCrAlY and the superalloy substrate. This is not
considered in the present paper but has been studied by others, e.g. [29-41]. In these research
works, the emphasis has been on substrate/bond coat interdiffusion and specific comparisons
between measured and predicted β-phase depletion at the oxide/bond coat interface have not
been considered. On the other hand, several analytical models concerned with the oxidation of

4
two phase systems in which the secondary phase dissolves during oxidation have been
reported, e.g. [42-48]. In these models, the secondary phase depletion behaviour during
oxidation can generally be represented by the parabolic diffusion law, Eq. (1),
𝑥𝑑~√𝑡 (1)
where 𝑥𝑑 is the width of the second phase depletion zone and 𝑡 is the oxidation time.
Considering the significance of β depletion on the degradation of TBCs, therefore, the aims of
the work reported in this paper were to investigate specifically the kinetics of β depletion at
the oxide surface in free-standing MCrAlY coatings during isothermal oxidation, to develop a
numerical model for phase evolution and element diffusion using the available
thermodynamic and kinetic data of the MCrAlY system, and to study the grain size effect in
these thermally sprayed MCrAlY coatings.
2. Materials and experimental procedure
2.1 Materials preparation, heat treatment and isothermal oxidation
The coatings used for isothermal oxidation experiments were prepared by high velocity oxy-
fuel (HVOF) thermal spraying using powder with a nominal composition of Co-31.7%Ni-
20.8%Cr-8.1Al%-0.5%Y (all in wt%). The powder was obtained from Praxair (commercially
available as CO-210-24) and had a size range -45+20 m. The coatings were deposited onto
800-grit ground mild steel substrates with dimensions 60 25 1.8 mm using a Met Jet III
liquid fuel HVOF gun. The details of the spraying process are given in reference [49].
Coatings were sprayed to a thickness of approximately 0.5 mm and were then debonded from
the ground substrate by bending around a mandrel. Two surface conditions were used in the
experiments on the debonded free-standing CoNiCrAlY coatings: (I) an as-sprayed rough
surface (surface roughness, Ra = 6.1 ± 0.5 m) and (II) a polished surface (Ra = 0.2 ± 0.1 m).
5
An initial vacuum heat treatment (HT) was given to the debonded coatings prior to oxidation.
Coatings were heat treated in a vacuum with a nominal pressure of 6.0 10-3
mbar at 1100 C
for 2 h followed by air cooling to replicate the initial heat treatment given to the bond coat
material in conventional TBC manufacture. Previous work has demonstrated that the initial
heat treatment has the effect of reducing any coating porosity to a minimal level [49] and
allows the β phase to coarsen and precipitate [50]. For isothermal oxidation experiments, heat
treated samples were exposed to laboratory air in a Carbolite furnace at 1100 C for 50 h, 75 h,
100 h and 250 h followed by natural air cooling.
2.2 Material characterisation
For microstructural observations, samples were mounted in a conductive resin and
successively ground and polished to a 1 m surface finish. The microstructures of coating
cross-sections before and after isothermal oxidation were examined in a FEI XL 30 scanning
electron microscope (SEM) operated at 20 kV. Backscattered electron (BSE) imaging was
used to form images and semi-quantitative energy dispersive X-ray (EDX) analysis was also
utilised to obtain element profile measurements and phase identification through chemical
analysis. Image analysis software, ImageJ [51], was used to measure the width of the
depletion zone and β-phase volume fractions. SEM-based electron backscatter diffraction
(EBSD) was carried out to investigate the grain morphology of coating cross-sections using a
Zeiss 1530 VP field emission gun scanning electron microscope (Carl Zeiss, Inc, Mape,
Grove, MN) with an EDAX Pegasus combined electron backscatter diffraction system
(EDAX, Mahwah, NJ, USA). For EBSD analysis, a further stage of chemical/mechanical
polishing using colloidal silica was required after the standard grinding and polishing
procedure to achieve reduced surface deformation. The EBSD patterns were recorded at an
acceleration voltage of 20 kV with a beam current of 26 nA at a specimen tilt angle of 70.

6
EBSD maps were collected with a step size of 0.1 m and areas of 50 m 50 m. The
EBSD data acquisition and processing were performed using the EDAX OIM5 software suite.
3. Modelling procedure
3.1 Model description
The initial composition is taken to be Co-31.7Ni-20.8Cr-8.1Al (all in wt%). The small
amount (~0.5 wt%) of Y actually present in the alloy is neglected and remaining elements are
scaled accordingly. The alloy is assumed to be at thermodynamic equilibrium initially and the
temperature is set to be 1100 °C. The free-standing coating is held at this temperature for
different periods of time and Al2O3 growth, taken to be planar, occurs on both surfaces
according to a kinetic law (described later in section 3.2). At any time, t, the microstructure
during oxidation is shown by the schematic cross-section of Fig. 1. In this system, the Al2O3
scale grows at the oxide/coating interface and is in contact with a single γ-Ni phase region
known as the β depletion zone whilst the interior of the sample comprises a two phase (γ + β)
region as predicted by thermodynamic equilibrium for the alloy composition. During
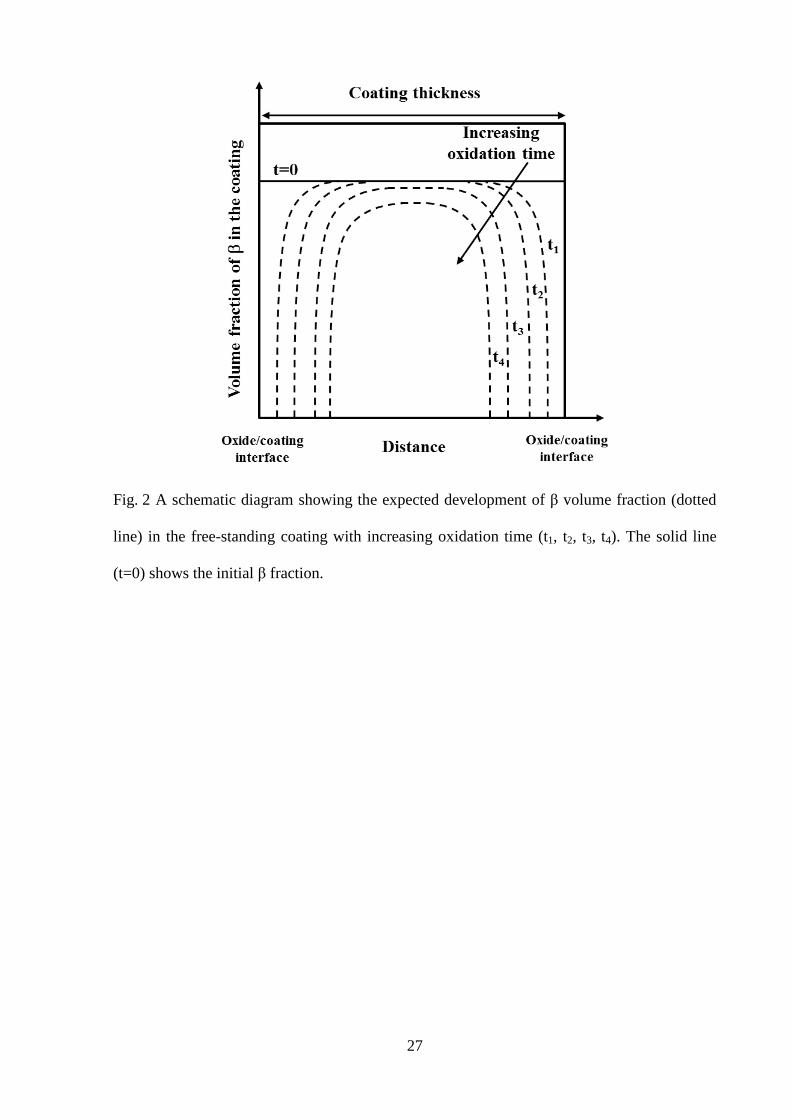
oxidation, the β phase volume fraction is expected to vary as shown schematically in Fig. 2,
where the β phase depletes as the Al2O3 forms and eventually the fraction of β in the γ+β
region decreases.
3.2 Oxidation model
The β depletion model assumes that growth of Al2O3 scale requires a flux of aluminium from
the coating. Owing to the approximately planar nature of this free-standing coating system,
the whole system can be approached by a one-dimensional model. In this study, the oxidation
model reported by Meier et al. [34] for a Ni-Co-Cr based bond coat was employed, in which
they proposed a simplified power law oxide growth model as expressed in Eq. (2),

7
𝛿(𝜇𝑚) = {𝑒𝑥𝑝 [𝑄 (1
𝑇0−
1
𝑇)] 𝑡}
𝑛
(2)
where 𝑄 = 𝐻/𝑅, 𝐻 is the activation energy in J/mol, 𝑅 is the gas constant in J/(molK).
𝑇0 is a temperature constant in K, 𝑇 is the oxidation temperature in K, 𝑡 is the oxidation time
in seconds and 𝑛 is a constant. By the combination of the above parameters, oxide growth
thickness can be obtained in m. 𝑄, 𝑇0 and 𝑛 were found by Meier et al. to be 27777.4 K,
2423.7 K and 0.332 respectively by fitting this oxide growth behaviour between
1038~1149 ºC to experimental data [34]. Taking a differential of Eq. (2) with respect to time,
the oxide growth rate can be obtained as Eq. (3).
�̇�(𝜇𝑚 𝑠)⁄ = 𝑛 {𝑒𝑥𝑝 [𝑄 (1
𝑇0−
1
𝑇)] 𝑡}
𝑛−1
(3)
Following the approach implemented by Nesbitt et al. [30], the Al flux, 𝐽𝐴𝑙 , at the
oxide/coating interface can be determined by Eq. (4), which is used as the boundary condition
in the DICTRA diffusion model in the following section,
𝐽𝐴𝑙 = �̇� ∙ 𝜌𝑜𝑥 ∙ 𝑟 (4)
where �̇� is the oxide growth rate, 𝜌𝑜𝑥 is the density of the oxide, taken as the density of Al2O3
in this study (3950 kg/m3), 𝑟 is the ratio of the atomic weight of Al to Al2O3. Oxidation will
cause the material surface to recede due to the continuous loss of elements in the material.
However, according to the nature of the alumina growth [52], the surface recession is very
small, this has also been demonstrated by Nesbitt et al. [30]. Thus in the current work, surface
recession is neglected.
3.3 Diffusion modelling
Initial phase fraction calculations were carried out using Thermo-Calc [53] and diffusion
modelling was performed using finite difference software DICTRA from Thermocalc-AB
8
[54]. The diffusion modelling is based on Fick’s first law, Eq. (5), and Fick’s second law,
Eq. (6),
𝐽𝑘 = −𝐷𝑘 ∙𝜕𝐶𝑘
𝜕𝑥 (5)
𝜕𝐶𝑘
𝜕𝑡=
𝜕
𝜕𝑥(−𝐽𝑘) =
𝜕
𝜕𝑥(𝐷𝑘 ∙
𝜕𝐶𝑘
𝜕𝑥) (6)
where, 𝐽𝑘 is the interdiffusion flux of element 𝑘, 𝐶𝑘 is the concentration of 𝑘 and 𝐷𝑘 is the
interdiffusion coefficient of element 𝑘. DICTRA alternatively uses the chemical potentials
and mobility of the individual elements to extend Fick’s first law, which can be expressed as
Eq. (7),
𝐽𝑘 = − ∑ 𝐿𝑘𝑖′
𝑛
𝑖=1
∙ ∑𝜕𝜇𝑖
𝜕𝐶𝑗
𝑛
𝑗=1
∙𝜕𝐶𝑗
𝜕𝑥 (7)
where 𝜇𝑖 are the chemical potentials of elements and 𝜕𝜇𝑖 𝜕𝐶𝑗⁄ are purely thermodynamic
quantities. The term 𝐿𝑘𝑖′ can be considered as the proportionality factor which depends on the
mobility of the individual elements. Therefore, by combining Eq. (6) and (7), numerical
solutions can be achieved through finite difference methods if thermodynamic data and
mobility data are available. More details about DICTRA software are given in reference [54].
In this study, thermodynamic data were obtained from the nickel superalloy database, TTNi7,
supplied by Thermotech [55] and mobility data were obtained from the kinetic mobility
database, MOB2, supplied by Thermo-Calc.
3.3.1 Initial conditions
Considering the symmetry boundary of the coating oxidation system shown in Fig. 2, the
width of the model is set to 250 µm, i.e. half the thickness of the debonded coating. The
schematic diagram of the model is shown in Fig. 3, where the boundary condition at the
oxide/coating interface is the Al flux and the other side of the model is set as a closed system

9
with zero flux boundary. In the majority of the calculations, a grid was used where, in the first
50 m from the oxide/coating interface, the grid spacing is kept at 0.2 m and then in the
remaining 200 µm the grid spacing is set to 2 m. The elements considered are Al, Ni, Co,
and Cr and the phases considered are -fcc and -NiAl, where -NiAl phase is defined as a
dispersed phase of equilibrium composition.
Since the coatings received an initial heat treatment at 1100 °C for 2 h, an initial oxide,
associated with an initial β depletion zone, formed at the coating surface. By assuming this
initial oxide is in the form of Al2O3 and assuming the Al used to form this initial Al2O3 layer
is all sourced from the β phase, the corresponding initial β depletion zone can be estimated
with respect to the initial oxide thickness through a mass balance conversion. This is
summarised in Table 1 for three different assumed initial oxide thicknesses. In this study, an
initial oxide of 1 µm associated with a 5.6 µm initial β depletion zone was selected to account
for the initial experimentally observed β depletion zone of about 5 µm formed after the initial
heat treatment at 1100 ºC for 2 h. The initial element concentration profiles are given as step
profiles where the element composition in the initial β depletion zone is taken as the γ phase
composition, calculated from Thermo-Calc (Table 2) at 1100 ºC, and the composition in the
γ+β region is taken as the initial alloy composition (Co-31.7%Ni-20.8Cr-8.1%Al-0.5%Y, all
in wt%) by normalising the elements to 100% excluding Y. This initial step profile is shown
in Fig. 4. The effects of different initial oxide thicknesses on the growth of β depletion zone
are investigated and discussed in Section 5.2.
3.3.2 Boundary conditions
As described earlier, an Al flux function (Eq. (4)) derived from the oxide growth model
(Eq. (2)) was obtained. To avoid an infinite Al flux at the beginning of the diffusion
calculations, it was assumed that 1 m Al2O3 had already formed before the diffusion

10
calculation started. This was to account for the initial β depletion zone of about 5 µm which
formed after the initial heat treatment at 1100 ºC for 2 h. Thus the initial aluminium flux is
taken as the flux value after 1 µm oxide has formed, where t1 is the time for the oxide to reach
1 μm. t1 can be obtained from Eq. (2), for 1 μm oxide, t
1 = 6441s. Subsequently the flux of Al,
JAl, follows Eq. (4) in the diffusion calculations.
3.3.3 Labyrinth factor
The standard DICTRA model considers diffusion only in the matrix while the secondary
phases like -NiAl are held as non-diffusional phases [54]. Diffusion through the dispersed
phase (the β phase in the present model) is neglected, but its effect on diffusion in the matrix
by reducing the area available for diffusion (i.e. blocking the diffusion paths) is incorporated
via a labyrinth factor which depends on the volume fraction and geometry of the precipitates.
The β-NiAl phase is defined as a dispersed phase that acts as point sinks or sources, the
fractions of which grow or shrink depending on the simulated composition at each location.
This impeding effect of dispersed phases on diffusion is accommodated by a so-called
labyrinth factor, represented as a function of the volume fraction of the dispersed phases.
Following a similar approach used by Hashin and Shtrikman [56], Gomez-Acebo et al. [57]
proposed the upper and lower bounds for effective diffusivity in a two-phase material, can be
given as,
𝐷𝑒𝑓𝑓𝑢𝑝𝑝𝑒𝑟
= 𝐷𝛾 +𝑓𝛽
1 (𝐷𝛽 − 𝐷𝛾)⁄ + 𝑓𝛾/(3𝐷𝛾) (8)
𝐷𝑒𝑓𝑓𝑙𝑜𝑤𝑒𝑟 = 𝐷𝛽 +
𝑓𝛾
1 (𝐷𝛾 − 𝐷𝛽)⁄ + 𝑓𝛽/(3𝐷𝛽) (9)

11
where, 𝐷𝛽 and 𝐷𝛾 are the diffusivities for and respectively. Taking the diffusion data from
the work reported by Karunaratne et al. [33], 𝐷𝛽 ≈ 0.1𝐷𝛾, the above bounds can be rewritten
as:
𝐷𝑒𝑓𝑓
𝑢𝑝𝑝𝑒𝑟= 𝐷𝛾 ∙ (1 +
3 − 3𝑓𝛾
𝑓𝛾 −103
) (10)
𝐷𝑒𝑓𝑓𝑙𝑜𝑤𝑒𝑟 = 𝐷𝛾 ∙ (0.1 +
0.9𝑓𝛾
4 − 3𝑓𝛾) (11)
The terms in brackets are the labyrinth factor. In this study, the upper bound was used in the
DICTRA calculations. It has to be emphasised that this may not be the upper bound for
diffusion in the actual system, but only as a first approximation. After the above conditions
were set, diffusion calculations were performed at 1100 ºC for 250 h at a time step of 1000 s
using a fully implicit solution method.
4. Results
4.1 Microstructural analysis
Typical SEM micrographs of the HVOF sprayed CoNiCrAlY bond coat after heat treatment
are shown in Fig. 5, where Fig. 5(a&b) are the coating with a rough surface and a polished
surface respectively. It can be seen an initial alumina layer and an initial β depletion zone
have developed at the coating surface. This initial β depletion zone is an average of ~5 µm.
Fig. 5(c) shows a dual phase structure of the CoNiCrAlY bond coat, in which the brighter
phase is the fcc γ matrix and the darker phase is the bcc secondary phase. Oxide stringers
that formed due to HVOF spraying can also be found in the coating as shown in Fig. 5(c). The
volume fraction of the β phase is 30% ± 2% as measured by image analysis. A plot of phase
mass fraction versus temperature obtained from Thermo-Calc is presented in Fig. 6 using the
TTNi7 thermodynamic database. It can be seen that the expected constitution at 1100 ºC is

12
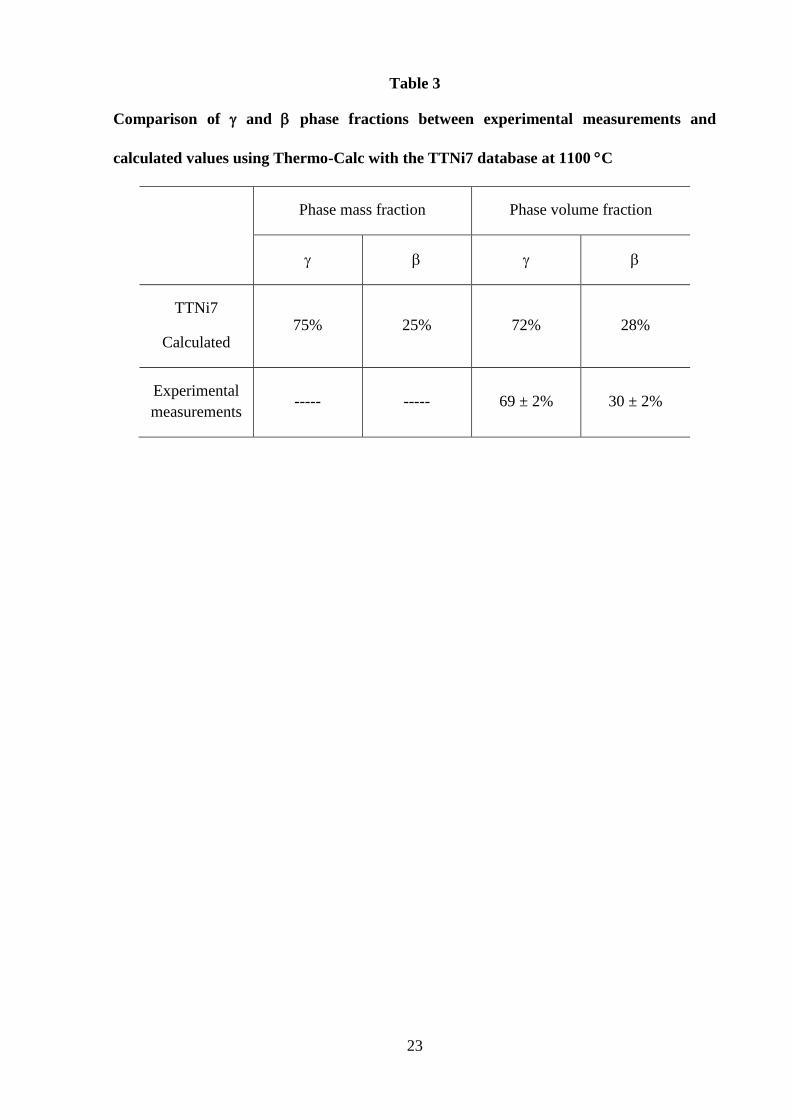
γ+β. The mass fractions of the γ and phase obtained from Thermo-Calc are converted to
volume fraction using an approach stated in reference [7] and these agree well with
experimentally measured volume fractions, as summarised in Table 3 assuming phase
equilibrium at 1100 ºC. The composition of each phase was measured by EDX and
summarised in Table 2. It can be seen that the experimentally measured phase compositions
generally agree with those obtained from the TTNi7 database at 1100 ºC. It is worth noting
that the measured Ni and Cr contents in the γ phase are larger than the calculated contents
whilst Co is slightly lower compared to the value from the database. The inverse pole figure
map and phase distribution map derived from EBSD data are shown in Fig. 7(a) and Fig. 7(b)
respectively. These figures reveal that the -phase dimensions are typically 0.8~2 m and
appear to be largely monocrystalline. The phase is clearly polycrystalline with
approximately equiaxed grains that exhibit a wide range of grain diameters typically from 2
m to 500 nm or less. Many of the grains are twinned but there is no evidence for preferred
orientation in either or phases.
4.2 depletion during isothermal oxidation
After isothermal oxidation at 1100 ºC, an alumina scale has formed on the coating surface,
resulting in the β depletion zone formation, typically shown in Fig. 8. The β depletion zone
grows progressively with the oxidation time. The β depletion zone measurements were carried
out from the edges of β phase particles to the coating surface and are plotted in Fig. 9,
including the initial β depletion zone after heat treatment. It can be seen that the β depletion
zone at the rough surface is about 2 times larger than that at the polished surface. An EBSD
map of the microstructure in the region of the β depletion zone after 250 h oxidation is shown
in Fig. 10. It can be seen that both the γ and β grains have coarsened due to annealing at
1100 ºC (compare with Fig. 7). The γ phase remains twinned with polycrystalline equiaxed
grains and no preferred orientation has developed for either phase.

13
4.3 Modelling results
Fig. 11 shows the phase fraction evolution obtained from DICTRA calculations for periods of
50 h, 75 h, 100 h and 250 h at 1100 ºC. The initial β depletion zone, which resulted from the
initial step element profile defined previously in Fig. 4, is also included in this figure. It can
be seen that the β phase depletes from the surface as time increases. Typical element
composition profiles after 100 h simulation are shown in Fig. 12. It can be seen that the Al
content is about 4.8 wt% at the oxide/coating interface. Concentrations of the other elements
change as a result of diffusion which is driven by the chemical potential gradients in the alloy.
Since the Al loss is crucial to the β depletion, Al concentrations in the coating over different
time periods are plotted in Fig. 13. It can be observed that the Al content in the β depletion
zone is calculated to be ~4.8 wt%, and increases to an average of 8.1 wt% in the γ+β region
for times up to 100 h. For 250 h, the Al content in the γ+β region decreases below 8.1 wt%
due to the continuous loss of Al causing the overall β fraction in the γ+β region to decrease
slightly. It is worth noting that the Al concentration gradient in the β depletion zone is shallow
but the mobility of the Al is high.
The element composition profile after 250 h oxidation at 1100 ºC determined by EDX
analysis is compared to the modelling results in Fig. 14. Although larger β depletion is
predicted in the modelling data, the element concentrations are in good agreement with the
model predictions. It can be seen that the measured Al concentration in the depletion zone
fluctuate between 4.6~4.8 wt%. Ni and Cr have a slightly larger concentration while Co
shows a smaller concentration compared to the model predictions. Since the Al loss is
determined by the Al flux (which is derived from the oxide growth model, Eq. (2)), the actual
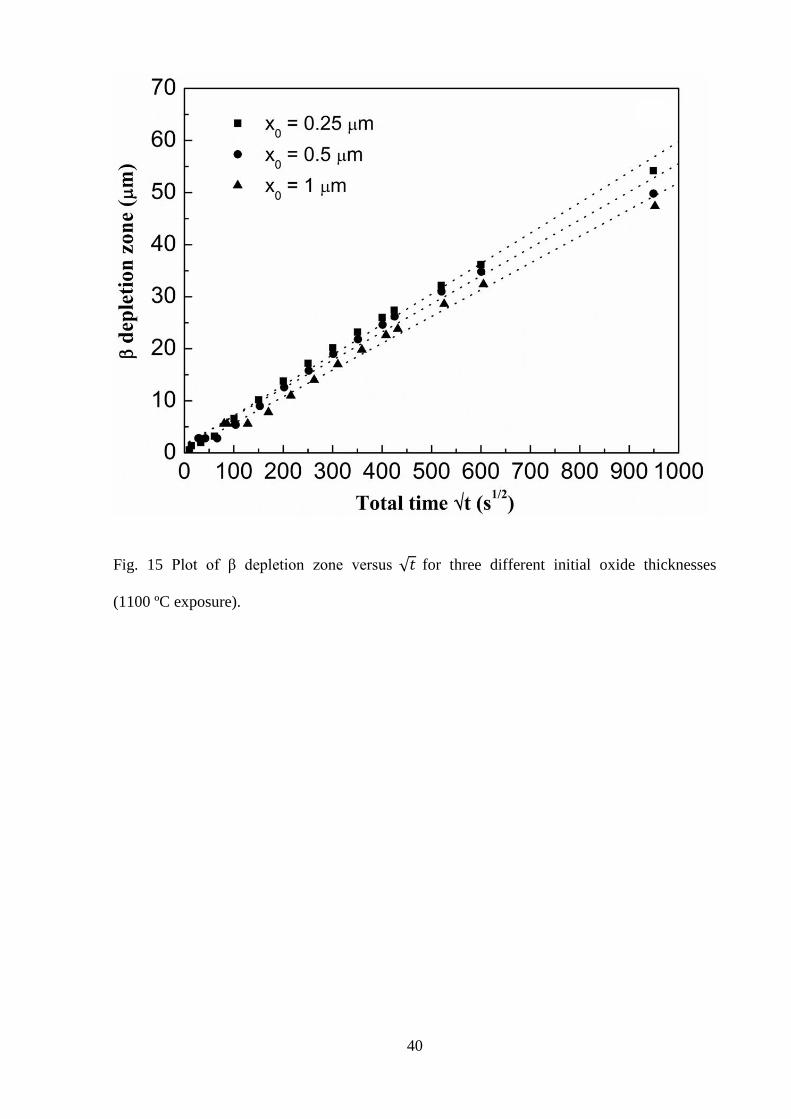
value of Al flux is closely related to the assumed initial oxide thickness. Thus, the β depletion
zone develops at different rates according to this assumption in Fig. 15. Since the oxide

14
growth model is based on a power law with a growth exponent of 0.332, the β depletion may
not strictly exhibit the parabolic oxidation but in this case it is nearly parabolic, as shown in
Fig. 15.
5. Discussion
5.1 Surface roughness
The β depletion zone can be employed to help interpret the oxidation behaviour of
CoNiCrAlY coatings in an indirect way. Since the oxide layer may spall off during oxidation
or sample preparation, β depletion can be a representative way to interpret oxidation. It is
shown in Fig. 9 that the depletion zone in samples with a rough oxidising surface is greater
than in samples with a polished surface. The larger surface contact area will result in a greater
Al flow and lead to more severe β depletion, especially in those regions that are convex.
Consequently, larger β depletion zones are formed at a rough surface compared to a polished
surface. This agrees with other work reported in the literature [12, 19, 58]. It has also been
reported that surface roughness can affect the yttrium distribution by forming yttrium
aluminides in concave regions of the coating [59], but this has not been observed in this study.
5.2 Effects of initial oxide thickness
In TBC applications, pre-heat treatment is frequently utilised to produce a thin alumina scale
on the bond coat surface. It is widely believed that this pre-existing alumina scale can
stimulate further alumina growth. To model this condition, an initial oxide associated with an
initial β depletion zone was assumed. Since the Al flux is derived from the oxide growth
model, it will be infinite at the boundary unless a finite initial oxide thickness is applied. As a
result of the presence of the initial oxide, the Al flux has a finite starting value, depending on
the thickness assumed. When the diffusion calculation starts, for a 1 µm initial oxide
thickness, compared to the other two conditions, the initial Al flux is one order of magnitude

15
smaller. Therefore, in Fig. 15, the β depletion rate for an initial 1 µm oxide is slower. Since
the β phase is defined as a dispersed phase in the DICTRA model, the β-phase fraction
decreases to supply the Al to the oxide. The continuous loss of Al causes the β phase to
deplete progressively. For a thinner initial oxide thickness with higher Al flux, the β depletion
occurs more rapidly. In Fig. 15, it can also be seen that with different initial oxide thicknesses,
β depletion still exhibits nearly parabolic growth behaviour.
5.3 Comparison between modelling and experimental results
Since Meier’s model [34] for oxide growth was developed for a rough surface, the
comparison between the EDX composition measurements and modelling results is carried out
for the rough surface samples in Fig. 14. The offsets of Co, Ni and Cr in Fig. 14 may be
attributed to the intrinsic compositional difference between the measured and calculated phase
compositions. It is indicated in Table 2 that the measured Ni and Cr contents are larger than
the calculated contents in the γ phase whilst Co is lower. In DICTRA diffusion calculations,
the main driving force for the element concentration evolution is due to the chemical potential
difference of each element and it partially depends on the concentration of other elements.
Since Al flux is the only boundary condition in this model, changes in the concentration of Co,
Ni and Cr are only driven by the chemical potential of each element. As such, a new element
profile is developed after Al flux is applied. Therefore, the pre-existing discrepancy between
the calculated and measured phase compositions could still be retained. Some offsets of the
element profiles are observed, nevertheless they show reasonably satisfying agreement. It is
also worth noting that, in reality, the oxidation is a very complicated process, involving the
formation and spallation different oxides, such as spinel oxides ((Ni,Co)(Al,Cr)2O4). This
may create further discrepancy between the experimental measurements and the modelling
predictions.

16
The experimentally measured β depletion zone thickness at the rough surface of the free-
standing CoNiCrAlY coating is compared to the modelling results as plotted in Fig. 16. The
modelling predictions that assume a 1 µm initial oxide thickness are used to compare with
experimental β depletion measurements as this initial oxide thickness is typical of what is
found experimentally. It can be seen that the predicted β depletion zone widths are slightly
larger than the measured ones. This might be attributed to several factors. Firstly, the
impeding effects from the dispersed β phase may not be properly accounted for by the
labyrinth factor in the DICTRA software, in which case the effective diffusivity within the γ
matrix is too high. This could result in larger β depletion zone width in the calculations.
Secondly, the oxide growth model has already been demonstrated to have a significant effect
on the β depletion calculations since the boundary condition, Al flux, is based on the oxide
growth model. It is indicated in Eq. (2) that the Al flux is very large at the beginning of
oxidation, which agrees well with the classic oxidation modelling where the initial flux at the
boundary is nearly infinite [60]. Though the assumed β depletion zone is similar to that
formed after the initial heat treatment, the resultant Al flux after an initial oxide has been
applied may still be too large. But it is worth noting that modelling data in Fig. 16 show a
good fit with the parabolic diffusion law, as described in Eq. (1).
5.4 Element diffusion mechanism
It can be seen in Fig. 14 that the Al concentration gradient in the β depletion zone is very
shallow. This concentration gradient of Al in the depletion zone is determined by two factors
namely the chemical potential gradient and the mobility or diffusion coefficient of Al. In
modelling, using DICTRA as well as other relevant work published in the literature, diffusion
is only considered to be lattice diffusion. However, in the case of a very fine grain structure,
as is shown to exist in Fig. 7, grain boundary diffusion may have also contributed.

17
In a fine grained material, the grain boundary area is much greater than the cross-sectional
area. Therefore, atoms, such as Al, diffusing along the grain boundaries will be able to diffuse
much faster than atoms diffusing through the lattice. In other words, the grain boundary offers
an easy element diffusion path, which eventually affects the apparent diffusion coefficient as
expressed in Eq. (12) [61],
𝐷𝑎𝑝𝑝 = 𝐷𝑙 + 𝐷𝑏 ∙ (∆ 𝑑⁄ ) (12)
where 𝐷𝑙 is the lattice diffusion coefficient and 𝐷𝑏 is the grain boundary coefficient, ∆ is the
width of the grain boundary, normally taken as 0.5 nm, and 𝑑 is the grain size, taken as 1 m
in our case. The activation energy for diffusion along the grain boundary (𝑄𝑏) is lower than
that for lattice diffusion (𝑄𝑙) and it is generally found in fcc metals that 𝑄𝑏 0.5 𝑄𝑙. Taking
the diffusion data from the work reported by Karunaratne et al. [33], by applying the
parameter in Eq. (12), the apparent diffusion coefficient can be obtained as shown in Fig. 17
as a function of temperature. It can be seen that at 1100 C, both lattice diffusion and grain
boundary diffusion contribute to the apparent diffusion coefficient due to a very fine grain
size. The apparent diffusion coefficient for Al is larger than the lattice diffusion coefficient.
However, the experimentally measured β depletion zone widths are smaller than the model
predictions in Fig. 16 and so it is possible that the Al flux derived from the oxide growth
model is too large and leads to more severe depletion in the diffusion calculations. Similar
observations have been found in work reported by Karunaratne et al. [33] in that the β
depletes at a faster rate in their model compared to their experimental β depletion. Future
work is required to develop a more suitable oxide growth model and account for the grain
boundary diffusion for specific CoNiCrAlY coatings to produce more reliable predictions.
6. Conclusions

18
Microstructural characterisation reveals a very fine grain structure in the HVOF
sprayed CoNiCrAlY bond coat, with a twinned grain structure at a grain size varying
largely between 0.5 m and a monocrystalline structure of phase with a grain size
of about 0.8 m
It is found that a rough oxidising surface results in a larger depletion zone compared
to a polished smooth surface due to a larger surface area of the rough surface.
A numerical model employing the Thermo-Calc and DICTRA software gives
reasonably good agreement with the experimental observations in both depletion
zone growth and element concentration profiles by using an Al flux function as the
boundary condition. It is assumed that a 1 m oxide has already formed after the
initial heat treatment. The Al flux function is derived from the oxide growth equation
of Meier et al. [34].
Further work on improving the oxide growth model and effective diffusion
coefficients within the MCrAlY will be necessary to improve agreement between
model predictions and experimental measurements.
7. Acknowledgements
The authors would like to take this opportunity to thank Prof. John Nicholls from Cranfield
University for helpful discussions.
8. References
[1] G.W. Goward, Surf. Coat. Technol., 108–109 (1998) 73-79.
[2] J.R. Nicholls, JOM, 52 (2000) 28-35.
[3] J.R. Nicholls, K.J. Lawson, D.S. Rickerby, P. Morrell, AGARD Report 823 “Thermal
Barrier Coatings” (1998).
[4] A.G. Evans, D.R. Mumm, J.W. Hutchinson, G.H. Meier, F.S. Pettit, Prog. Mater Sci.,
46 (2001) 505-553.
[5] D. Stöver, C. Funke, J. Mater. Process. Technol., 92-93 (1999) 195-202.
[6] H. Chen, T.H. Hyde, K.T. Voisey, D.G. McCartney, Mater. Sci. Eng., A, 585 (2013)
205-213.

19
[7] H. Chen, Ph.D Thesis, Department of Mechanical, Materials and Manufacturing
Engineering, University of Nottingham, (2015).
[8] H. Chen, T.H. Hyde, K.T. Voisey, D.G. McCartney, Proc IMechE Part L: J Materials:
Design and Application, DOI 10.1177/1464420715622495 (2016).
[9] W. Quaddakers, A. Tyagi, D. Clemens, R. Anton, L. Singheiser, Elevated temperature
coatings: Science and technology III, (1999) 119-130.
[10] J. Toscano, R. Vaen, A. Gil, M. Subanovic, D. Naumenko, L. Singheiser, W.J.
Quadakkers, Surf. Coat. Technol., 201 (2006) 3906-3910.
[11] R.D. Jackson, Ph.D thesis, University of Birmingham, University of Birmingham,
(2010).
[12] A. Gil, V. Shemet, R. Vassen, M. Subanovic, J. Toscano, D. Naumenko, L. Singheiser,
W.J. Quadakkers, Surf. Coat. Technol., 201 (2006) 3824-3828.
[13] S. Saeidi, K.T. Voisey, D.G. McCartney, J. Therm. Spray Technol., 18 (2009) 209-
216.
[14] C.S. Richard, G. Béranger, J. Lu, J.F. Flavenot, Surf. Coat. Technol., 82 (1996) 99-
109.
[15] M. Okazaki, S. Yamagishi, Y. Yamazaki, K. Ogawa, H. Waki, M. Arai, Int. J. Fatigue,
53 (2013) 33-39.
[16] H. Chen, D.G. McCartney, K.T. Voisey, Mater. High Temp., 32 (2015) 215-220.
[17] W. Brandl, D. Toma, H. Grabke, Surf. Coat. Technol., 108 (1998) 10-15.
[18] P. Puetz, X. Huang, R.S. Lima, Q. Yang, L. Zhao, Surf. Coat. Technol., 205 (2010)
647-657.
[19] J. Toscano, D. Naumenko, A. Gil, L. Singheiser, W.J. Quadakkers, Mater. Corros., 59
(2008) 501-507.
[20] E.A.G. Shillington, D.R. Clarke, Acta Mater., 47 (1999) 1297-1305.
[21] Y.H. Sohn, J.H. Kim, E.H. Jordan, M. Gell, Surf. Coat. Technol., 146-147 (2001) 70-
78.
[22] P. Niranatlumpong, C.B. Ponton, H.E. Evans, Oxid. Met., 53 (2000) 241-258.
[23] P. Poza, P.S. Grant, Surf. Coat. Technol., 201 (2006) 2887-2896.
[24] D. Naumenko, V. Shemet, L. Singheiser, W. Quadakkers, J. Mater. Sci., 44 (2009)
1687-1703.
[25] T. Koomparkping, S. Damrongrat, P. Niranatlumpong, J. Therm. Spray Technol., 14
(2005) 264-267.
[26] P. Fox, G.J. Tatlock, Mater. Sci. Technol., 5 (1989) 816-827.
[27] N. Czech, F. Schmitz, W. Stamm, Surf. Coat. Technol., 68-69 (1994) 17-21.
[28] N. Czech, F. Schmitz, W. Stamm, Surf. Coat. Technol., 76-77 (1995) 28-33.
[29] C.E. Lowell, C.A. Barrett, R.W. Palmer, J.V. Auping, H.B. Probst, Oxid. Met., 36
(1991) 81-112.
[30] J.A. Nesbitt, Technical Report No. NASA/TM-2000-209271, (2000).
[31] E. Lee, D. Chartier, R. Biederman, R. Sisson, Surf. Coat. Technol., 32 (1987) 19-39.
[32] D.R.G. Achar, R. Munoz-Arroyo, L. Singheiser, W.J. Quadakkers, Surf. Coat.
Technol., 187 (2004) 272-283.
[33] M.S.A. Karunaratne, S.L. Ogden, S.D. Kenny, R.C. Thomson, Mater. Sci. Technol.,
25 (2009) 287-299.
[34] S.M. Meier, D.M. Nissley, K.D. Sheffler, Technical Report NASA Contractor Report
18911/NAS3-23944, (1991).
[35] R. Pillai, W.G. Sloof, A. Chyrkin, L. Singheiser, W.J. Quadakkers, Mater. High Temp.,
32 (2015) 57-67.
[36] K. Yuan, R. Eriksson, R. Lin Peng, X.-H. Li, S. Johansson, Y.-D. Wang, Surf. Coat.
Technol., 232 (2013) 204-215.
[37] R. Eriksson, K. Yuan, X.-H. Li, R. Lin Peng, Surf. Coat. Technol., 253 (2014) 27-37.
[38] K. Yuan, R. Lin Peng, X.-H. Li, S. Johansson, Y.-D. Wang, Surf. Coat. Technol., 261
(2015) 86-101.
[39] M.S.A. Karunaratne, I. Di Martino, S.L. Ogden, D.L. Oates, R.C. Thomson,
Metallurgical and Materials Transactions A, 43 (2011) 774-788.
[40] K. Yuan, R. Eriksson, R. Lin Peng, X.-H. Li, S. Johansson, Y.-D. Wang, Surf. Coat.
Technol., 254 (2014) 79-96.
[41] R. Eriksson, K. Yuan, X.-H. Li, R. Lin Peng, Surf. Coat. Technol., 253 (2014) 27-37.
[42] D. Whittle, D. Evans, D. Scully, G. Wood, Acta Metall., 15 (1967) 1421-1430.

20
[43] T. Hodgkiess, G.C. Wood, D.P. Whittle, B.D. Bastow, Oxid. Met., 12 (1978) 439-449.
[44] G. Wang, B. Gleeson, D.L. Douglass, Oxid. Met., 35 (1991) 317-332.
[45] F.H. Stott, Rep. Prog. Phys., 50 (1987) 861.
[46] G. Wahl, Thin Solid Films, 107 (1983) 417-426.
[47] P. Carter, B. Gleeson, D. Young, Acta Mater., 44 (1996) 4033-4038.
[48] F. Gesmundo, B. Gleeson, Oxid. Met., 44 (1995) 211-237.
[49] S. Saeidi, K.T. Voisey, D.G. McCartney, J. Therm. Spray Technol., 20 (2011) 1-13.
[50] L. Russo, M. Dorfman, Thermal Spraying: Current status and future trends., Osaka,
Japan, (1995) 681-686.
[51] R. Syed, N. Sobh, U. Ravaioli, G. Popescu, M. Mohamed, imageJ, 2009.
[52] L. Lelait, S. Alpérine, R. Mévrel, J. Mater. Sci., 27 (1992) 5-12.
[53] J. Andersson, T. Helander, L. Höglund, P. Shi, B. Sundman, Calphad, 26 (2002)
273-312.
[54] A. Borgenstam, L. Höglund, J. Ågren, A. Engström, J. Phase Equilib., 21 (2000) 269-
280.
[55] N. Saunders, Superalloys 1996. TMS, Warrendale, PA, 115 (1996).
[56] Z. Hashin, S. Shtrikman, J. Appl. Phys., 33 (1962) 3125-3131.
[57] T. Gómez-Acebo, B. Navarcorena, F. Castro, J Phs Eqil and Diff, 25 (2004) 237-251.
[58] D. Seo, K. Ogawa, T. Shoji, S. Murata, J. Therm. Spray Technol., 17 (2008) 136-
143.
[59] A. Gil, D. Naumenko, R. Vassen, J. Toscano, M. Subanovic, L. Singheiser, W.J.
Quadakkers, Surf. Coat. Technol., 204 (2009) 531-538.
[60] C. Wagner, J. Electrochem. Soc., 99 (1952) 369-380.
[61] D.A. Porter, K.E. Easterling, Phase transformations in metals and alloys, CRC press,
London, 1992.

21
Table 1
Relationship between initial assumed oxide thickness, the time for the corresponding
oxide to grow, the resultant initial β depletion zone, and the initial Al flux at each initial
oxide thickness.
Initial oxide
thickness (μm)
Time for the
initial oxide to
grow (s)
Initial β depletion
zone (μm)
Initial Al flux
(mol/(m2s))
0.25 100 1.4 6.46 x 10⁻⁵
0.5 800 2.8 1.61 x 10⁻⁵
1 6441 5.6 4.00 x 10⁻⁶

22
Table 2
Comparison of and phase compositions of CoNiCrAlY (Co-31.7Ni-20.8Cr-8.1Al-0.5Y,
all in wt%, neglecting Y) calculated from Thermo-Calc using the TTNi7 database at
1100 C and experimentally measured by EDX following the initial vacuum heat
treatment for 2 h at 1100 ºC.
Element
phase phase
wt% at% wt% at%
Calculated
TTNi7
(at 1100 ºC)
Co 43.0 39.4 28.6 23.2
Ni 27.4 25.2 44.8 36.6
Cr 24.9 25.9 8.4 7.7
Al 4.8 9.5 18.3 32.4
Experimental
EDX results
Co 41.1 ± 0.5 38.0 ± 0.5 24.6 ± 0.5 20.0 ± 0.5
Ni 29.2 ± 0.5 27.1 ± 0.4 48.2 ± 1.2 39.3 ± 0.9
Cr 25.8 ± 0.2 27.0 ± 0.3 8.7 ± 1.1 8.0 ± 1.1
Al 3.8 ± 0.2 7.8 ± 0.4 18.5 ± 0.4 32.8 ± 0.6
23
Table 3
Comparison of and phase fractions between experimental measurements and
calculated values using Thermo-Calc with the TTNi7 database at 1100 C
Phase mass fraction Phase volume fraction
TTNi7
Calculated 75% 25% 72% 28%
Experimental
measurements ----- ----- 69 ± 2% 30 ± 2%

26
FIGURES
Fig. 1 A schematic cross section of a free-standing MCrAlY coating showing the
development of β depletion zone during oxidation.
27
Fig. 2 A schematic diagram showing the expected development of β volume fraction (dotted
line) in the free-standing coating with increasing oxidation time (t1, t2, t3, t4). The solid line
(t=0) shows the initial β fraction.

28
Fig. 3 A diagram showing schematically the variation of Al concentration against distance
with an Al flux, JAl, in the coating towards the oxide/coating interface to meet the oxygen flux,
Jox, to form the Al2O3 scale, and the formation of a β depletion zone.

29
Fig. 4 Plot of the initial element profile when an initial oxide thickness of 1 µm is assumed.
The initial β depletion zone is 5.6 µm. The composition in the β depletion zone is referred as
the γ phase composition and the composition in the γ+β region is referred as the initial alloy
composition.

30
Fig. 5 BSE micrographs of the HVOF sprayed CoNiCrAlY bond coat following vacuum heat
treatment: (a) rough surface; (b) polished surface; (c) general microstructure of the coating
showing the γ+β structure with some oxide stringers embedded in the coating.

31
Fig. 6 Phase mass fraction map of CoNiCrAlY (Co-31.7Ni-20.8Cr-8.1Al-0.5Y, all in wt%,
neglecting Y) obtained from Thermo-Calc using TTNi7 database.

32
Fig. 7 EBSD map showing the grain structure of the CoNiCrAlY coating: (a) inverse pole
figure map showing the grain orientations; (b) corresponding phase map indicating the
individual and grains ( in green and in red). (For interpretation of the references to
colour in this figure legend, the reader is referred to the web version of this article.)

33
Fig. 8 Oxidation and depletion of the CoNiCrAlY coating after oxidation for 250 h at
1100 ºC: (a) rough oxidising surface; (b) polished oxidising surface.

34
Fig. 9 β depletion zone measurements of free-standing CoNiCrAlY coating with rough and
polished surfaces after oxidation at 1100 ºC for 50, 75, 100 and 250 h. The initial β depletion
zone formed after the initial heat treatment at 1100 ºC for 2 h is also included. Error bars
represent the standard deviation of measurements.

35
Fig. 10 EBSD mapping showing an increase of the γ grain size in the β depletion zone at the
rough surface of the CoNiCrAlY coating after oxidation for 250 h at 1100 ºC: (a) inverse pole
figure map showing the grain orientations; (b) corresponding phase map indicating the
individual and grains ( in green and in red). (For interpretation of the references to
colour in this figure legend, the reader is referred to the web version of this article.)

36
Fig. 11 Plots of phase mass fraction versus distance from the surface obtained from DICTRA
calculation. Data are plotted for 4 different oxidation times.

37
Fig. 12 Plots of element concentration versus distance from the oxidising surface after 100 h
diffusion calculations. The β depletion zone extends up to ~35 µm into the sample. In the two-
phase region, compositions are the average of the two phases.

38
Fig. 13 Plot of Al concentration versus distance for different times at 1100 ºC, showing the Al
content near the oxide/coating interface is close to 4.8 wt%.

39
Fig. 14 Comparison of experimentally measured elemental profiles and modelling results at
1100 ºC for 250 h, the solid lines are the modelling results and the dotted-symbol lines are the
EDX measurements.
40
Fig. 15 Plot of β depletion zone versus √𝑡 for three different initial oxide thicknesses
(1100 ºC exposure).

41
Fig. 16 Plots of β depletion zone thickness versus √𝑡 from experimental measurements and
predicted from the DICTRA model. An initial oxide thickness of 1 µm is assumed and the
temperature is 1100 ºC

42
Fig. 17 Plot of log D versus 1/T for the lattice diffusion coefficient [33] and grain boundary
diffusion coefficient (Eq. 12).
![A multicomponent diffusion model for prediction of ... · ware package DICTRA [3] takes multicomponent diffusion into account but it deals with oxidation in a limited manner, and](https://img.pdfslide.us/doc/110x75/5bf02a7409d3f2e5048c117f/a-multicomponent-diffusion-model-for-prediction-of-ware-package-dictra-3.jpg)