Embed Size (px)
Citation preview
AGMEMOD ConsortiumEditors: Lubica Bartova, Thomas Fellmann and Robert M'barek
EUR 23833 EN/1 - 2009
Modelling and Analysis of theEuropean Milk and Dairy Market
The mission of the IPTS is to provide customer-driven support to the EU policy-making process by researching science-based responses to policy challenges that have both a socio-economic and a scientific or technological dimension. European Commission Joint Research Centre Institute for Prospective Technological Studies Contact information Address: Edificio Expo. c/ Inca Garcilaso, 3. E-41092 Seville (Spain) E-mail: [email protected] Tel.: +34 954488318 Fax: +34 954488300 http://ipts.jrc.ec.europa.eu http://www.jrc.ec.europa.eu Legal Notice Neither the European Commission nor any person acting on behalf of the Commission is responsible for the use which might be made of this publication.
Europe Direct is a service to help you find answers to your questions about the European Union
Freephone number (*):
00 800 6 7 8 9 10 11
(*) Certain mobile telephone operators do not allow access to 00 800 numbers or these calls may be billed.
A great deal of additional information on the European Union is available on the Internet. It can be accessed through the Europa server http://europa.eu/ JRC 50915 EUR 23833 EN/1 ISBN 978-92-79-12487-7 ISSN 1018-5593 DOI 10.2791/10843 Luxembourg: Office for Official Publications of the European Communities © European Communities, 2009 Reproduction is authorised provided the source is acknowledged
Modelling and Analysis of the European Milk and Dairy Market
AGMEMOD Consortium Editors: Lubica Bartova, Thomas Fellmann and Robert M'barek
i
Foreword
The study "Modelling and Analysis of the European Milk and Dairy Market" was carried out from October 2007 until July 2008 by the AGMEMOD (AGricultural MEmber states MODelling) Consortium under the management of the Agricultural Economics Research Institute (LEI, the Netherlands), in cooperation with the European Commission's Joint Research Centre - Institute for Prospective Technological Studies (JRC-IPTS, Spain).
This report provides an in-depth model based quantitative assessment of possible implications of an EU dairy policy reform and other policy adjustments on the milk and dairy market as well as on other agricultural markets in the EU-27, EU-15, EU-12, the individual Member States (MS) and their regional groupings.1
The AGMEMOD model used in this study is an econometric, dynamic, partial equilibrium, multi-country, multi-market model for EU agriculture at the EU and MS level. The AGMEMOD model Version 2.0 includes a detailed sub-model for the dairy sector. Milk quotas are implemented in the model at the MS level and other policy instruments such as direct payments, intervention supports and trade policies are also considered2.
By the time this study has been elaborated, the milk market has shown a high dynamic, with relatively high milk prices in the year 2007 declining since spring 2008. This decline in milk prices could not be entirely incorporated in the modelling due to its unforeseen magnitude. In November 2008 the EU agriculture ministers reached a political agreement on the CAP Health Check, following the Commission’s originally proposed 1% milk quota increase every year between 2009 and 2013. This increase is anticipated in the scenarios Milk 1 and Milk 3 of the study.
We acknowledge the work undertaken by the AGMEMOD Consortium country teams and by Myrna van Leeuwen, LEI, the Netherlands, the study co-ordinator.
1 Detailed projection results are available in a complementary JRC Technical Note related to this report:
Bartova, L., T. Fellmann and R. M'barek (Eds.) (2009): "Modelling and Analysis of the European Milk and Dairy Market - Detailed Projection Results". EUR 23833 EN/2 (http://ipts.jrc.ec.europa.eu/publications).
2 Detailed documentation on the AGMEMOD modelling approach, along with the outcome of the JRC-ITPS study "Impact analysis of CAP reform on the main agricultural commodities" is published in five JRC Scientific and Technical Reports. EUR 22940 EN/1-5. (http://ipts.jrc.ec.europa.eu/publications).
ii
Executive Summary The EU dairy market is regulated by the Common Market Organisation (CMO) for milk and milk products, of which the milk quota regime is one of the most noticeable elements. Originally introduced as a temporary measure, the quota system has persisted since 1984. However, in the context of the CAP Health Check the European Commission made clear its intention not to extend the dairy quota regime beyond 2015.
This report provides an in-depth model based quantitative assessment of possible implications of a dairy policy reform on the agricultural sector in the EU, with an explicit focus on the milk and dairy market. The objectives of the study are threefold:
• to assess the implications of changing policy and market conditions for EU agriculture, with special emphasis on milk quota phasing-out and export subsidy removal, by using a modelling tool that allows for regional and sectoral differentiations;
• to carry out policy relevant scenarios reflecting the impacts of different forms of deregulation (e.g. quota abolition and expanded quotas), the changes in quota and price levels; and
• to analyse the implications of policy reform scenarios and to draw appropriate policy recommendations.
For the quantitative approach the AGMEMOD (AGricultural MEmber states MODelling) model Version 2.0 has been applied.
Specification of the model The AGMEMOD model is an econometric, dynamic, partial equilibrium, multi-country, multi-market model for EU agriculture at the MS level. Based on a set of commodity specific model templates, country specific models are developed to reflect the details of agriculture at MS level and at the same time allow for their combination in an EU model. The close adherence to templates assures the analytical consistency across the country models, which is essential for the aggregation towards an EU level and in addition also facilitates the comparison of the impact of a policy change across different MS.
The AGMEMOD model Version 2.0 includes a detailed sub-model for the EU dairy sector. Milk quotas are implemented in the model at the MS level and a detailed set of other agricultural policy instruments such as direct payments, intervention supports and trade policies are also considered.
The milk and dairy market in the AGMEMOD model is represented by raw milk (cow milk and other milk); milk fat and milk protein use; whole milk; drinking milk; cream and other fresh products; butter; cheese; skimmed milk powder (SMP); whole milk powder (WMP) and aggregated other dairy products.
Production, domestic use, stocks, exports, imports and prices are projected and simulated for each commodity. Furthermore, interactions with other agricultural sectors are captured by linkages to the beef and crop sectors, e.g. by the supply of calves for beef production and feed demand for SMP and grain and oilseed based animal feeds.
Estimates for milk quota rents (marginal costs) obtained from other studies are adopted and modified in accordance with expected changes in costs, proxies for technological changes and expert judgement in cases where it has been deemed that estimated rents may be questionable. Such instances could appear, e.g. where the administrative system governing milk quota in a MS may have restricted production regionally, or where there is strong justification to believe
Executive Summary
iii
that the milk quota has hindered technological progress or greater specialisation in dairy production.
Projections and simulations Based on the AGMEMOD bottom-up approach, this study is able to capture the diversity of European agriculture and its regional variations, i.e. results of the quantitative analyses cover:
• the individual MS;
• EU-15 as a whole (15 MS before May 2004);
• EU-12 as a whole (12 MS of May 2004 and January 2007 enlargements; Cyprus and Malta not included);
• EU-27 as a whole (27 MS from January 2007; Cyprus and Malta not included);
• Nordic Group (SE, FI, LV, LT, EE), Western Group (FR, BE, NL, DK, UK, IE), Central and Eastern Group (DE, PL, CZ, SK, HU), East Alpine and Balkan Group (AT, SI, RO, BG) and South Group (PT, ES, GR, IT).
Projections are generated from year 2006 to 2020 with the underlying quantitative and qualitative assumptions on macroeconomic and other variables reported.
In the simulation, policy scenarios comprise changes in the following policy instruments:
• Phasing-out and elimination of milk quotas;
• Reduction of export support (WTO subsidised export limitations);
• Reduction of the intervention price for butter and SMP.
Baseline and scenario description The baseline reflects agreed agricultural policy at the time that the analysis was completed in May 2008. It includes the Luxembourg Agreement of 2003 and the 2008/09 quota expansion package agreed in March 2008. In view of the elevated price of cereals, the suspension of the set-aside regime agreed in 2007 is carried forward through the projection period by 2020.
Four scenarios are considered which involve an increase and elimination of milk quotas:
Scenario Milk 1: expansion of the quota by 1% per year from 2009/10 to 2013/14, quota elimination in 2015;
Scenario Milk 2: expansion of the quota by 2% per year from 2009/10 to 2013/14, quota elimination in 2015;
Scenario Milk 3: as Milk 1, plus intervention price of butter is reduced by -2% per year, starting in 2009;
Scenario Milk 4: as Milk 2, plus intervention prices for butter and SMP are reduced by -2% per year, plus additional cuts of the subsidised dairy export limits by -5% per year, all reductions starting in 2009.
Baseline and scenario results The results described in this report are based on several explicit or implicit assumptions. Deviations from these assumptions may also alter the outcomes of the model simulations presented here.
Executive Summary
iv
Baseline
• EU dairy commodity and milk prices decline from the elevated levels of 2007 over the period 2008 and 2009. However, the medium term trend is for prices to be maintained at a level above those observed in the earlier part of this decade. Since EU production is virtually unchanged due to the existence of milk quotas and consumption is increasing, the amount of dairy product available for export declines.
• The strong internal demand for cheese brings about increases in cheese production, while production of butter and SMP decreases.
• As milk yields increase by about 1% per year, there is an offsetting reduction in the number of dairy cows. This implies that the contribution of the dairy sector towards EU beef output declines over time.
Scenarios The changes that take place under the scenarios are described in percentage change relative to the baseline results.
• External factors relating to global supply and demand for dairy products (as reflected in the baseline) are a more important determinant of the future level of EU dairy product prices, milk prices and dairy production than are the changes in the milk quota regime which are examined.
• The change in product mix observed in the baseline can also be observed under the scenarios, but in addition some of the additional milk that is produced is channelled to all the major products.
• The outcome under the milk quota expansion/elimination scenarios leads to conclusions which are broadly the same for the scenarios Milk 1 and Milk 2. EU dairy production increases by 2015 relative to the baseline by about 4% and there is a 5% reduction in the EU milk price as a result. This outcome is the sum of both increases and decreases in individual MS level milk production. Beyond 2015 there is more or less a stabilisation of production in most of the MS. Due to the further policy interventions in the second set of scenarios (Milk 3 and Milk 4) the outcome especially concerning prices is more marked.
• EU MS can be categorised in accordance with the extent of the observed production increases (decreases). Grass based dairy producers, with high initial quota rents, are best placed to expand milk production under quota expansion and elimination. High feed prices drive rents to zero relatively quickly in MS with low initial rents and where grain feeding is the dominant production system. Few countries exploit the full extent of the quota increase available to them in the phasing out period, suggesting that the quota expansion allowed under the Milk 1 and Milk 3 scenarios is sufficient for most MS and a “hard landing” at EU level is avoided. A few MS continue to increase milk production once quotas are removed even under the Milk 2 and Milk 4 scenarios. This gives merit to consider larger quota increases for these MS, particularly given that their contribution to overall EU milk production is small. Such specific quota increases would avoid large production increases at the point where milk quotas are removed, which could otherwise have negative consequences for the sector in these MS over the short term.
• The consequences of milk quota removal for other agricultural sectors are minimal. While there are projected to be more dairy cows (than in the baseline), this is offset by a reduction in the number of beef cows, so the net change in the total number of cattle is small relative to the baseline. Hence the consequences of the scenarios for the derived demand for feed are insignificant.
v
Table of Contents
Foreword .................................................................................................................................... i Executive Summary ................................................................................................................. ii Table of Contents ..................................................................................................................... v List of Tables...........................................................................................................................vii List of Figures ........................................................................................................................... x Abbreviations.........................................................................................................................xiii AGMEMOD Consortium ...................................................................................................... xv
1 Introduction ...................................................................................................................... 1 1.1 Background............................................................................................................................ 1 1.2 Objectives and scope of the study.......................................................................................... 1
2 Overview of the EU dairy sector..................................................................................... 3 2.1 Milk supply and structure of EU dairy farming ..................................................................... 3 2.2 Milk prices ............................................................................................................................. 6 2.3 Milk processing and consumption ....................................................................................... 10 2.4 Dairy exports........................................................................................................................ 13
3 Development of the EU dairy policy............................................................................. 14 3.1 Domestic support measures ................................................................................................. 14 3.2 Trade measures .................................................................................................................... 17 3.3 Expected developments ....................................................................................................... 18
4 Methodology of the quantitative approach.................................................................. 21 4.1 AGMEMOD model ............................................................................................................. 21 4.2 Implementation of the milk policy in AGMEMOD............................................................. 22 4.3 Data sources ......................................................................................................................... 27
5 Description of the assumptions and scenarios ............................................................. 28 5.1 Macroeconomic assumptions............................................................................................... 28 5.2 Assumptions on agricultural and trade policies ................................................................... 37 5.3 Description of baseline and scenarios.................................................................................. 38 5.4 Qualification of the approach............................................................................................... 39
6 Results of the quantitative approach............................................................................ 41 6.1 Baseline results .................................................................................................................... 41 6.2 Scenario results .................................................................................................................... 47
7 Conclusions ..................................................................................................................... 59
8 References ....................................................................................................................... 61
Table of Contents
vi
Annexe A: Overview on approaches to model milk quota abolition ................................. 65 Annexe A 1: CGE models................................................................................................................. 66 Annexe A 2: PE models .................................................................................................................... 66 Annexe A 3: Production and farm based models.............................................................................. 68 Annexe A 4: Synthetic production functions .................................................................................... 70
Annexe B: AGMEMOD Mnemonics .................................................................................... 77
Annexe C: AGMEMOD commodity model structure ........................................................ 78 Annexe C 1: AGMEMOD commodity linkages............................................................................... 82 Annexe C 2: Endogenous world prices............................................................................................. 83
Annexe D: Dairy flow diagrams............................................................................................ 88
Annexe E: The dairy sector in EU MS ................................................................................. 91
Annexe F: Projections for milk and dairy product markets in EU MS, 2000 -2020...... 116
Annexe G: Projections for milk and dairy product markets in EU MS (% change versus baseline in 2020)................................................................. 181
vii
List of Tables
Table 2-1: Number of dairy cows in each herd size category in EU MS in 2005 .................. 5
Table 3-1: EU milk quotas 2004/05 to 2008/09 (in 1 000 t)................................................. 15
Table 3-2: Milk price support to producer prices through intervention ............................... 16
Table 3-3: Most Favoured National tariff quotas of the EU dairy sector ............................. 18
Table 4-1: Supply elasticity (index) in respect to milk price/cost ratio, 2000...................... 25
Table 4-2: Milk quota rents (as % of the producer milk price) in 2000 ............................... 26
Table 6-1: Regional changes in EU milk production in 2020 compared to baseline in 2020 under each scenario.................................................................. 53
Table A 1: Average milk production costs on EU-15 specialised dairy farms (TF41)......... 71
Table A 2: Estimated marginal costs of milk production, Euro/tonne.................................. 75
Table A 3: Marginal costs of milk production in the EDIM model (€/kg) ........................... 76
Table B 1: AGMEMOD commodity mnemonics in dairy model......................................... 77
Table B 2: AGMEMOD activities mnemonics in the dairy model....................................... 77
Table C 1: EU Country coverage in AGMEMOD database ................................................. 87
Table F 1: Dairy baseline projections for Austria, 2000-2020 ........................................... 117
Table F 2: Dairy scenario projections for Austria, % change relative to baseline in 2020................................................................................................. 118
Table F 3: Dairy baseline projections for Belgium, 2000-2020 ......................................... 119
Table F 4: Dairy scenario projections for Belgium, % change relative to baseline in 2020................................................................................................. 120
Table F 5: Dairy baseline projections for Denmark, 2000-2020 ........................................ 121
Table F 6: Dairy scenario projections for Denmark, % change relative to baseline in 2020................................................................................................. 122
Table F 7: Dairy baseline projections for Finland, 2000-2020........................................... 123
Table F 8: Dairy scenario projections for Finland, % change relative to baseline in 2020................................................................................................. 124
Table F 9: Dairy baseline projections for France, 2000-2020 ............................................ 125
Table F 10: Dairy scenario projections for France, % change relative to baseline in 2020................................................................................................. 126
Table F 11: Dairy baseline projections for Germany, 2000-2020 ........................................ 127
Table F 12: Dairy scenario projections for Germany, % change relative to baseline in 2020................................................................................................. 128
Table F 13: Dairy baseline projections for Greece, 2000-2020............................................ 129
Table F 14: Dairy scenario projections for Greece, % change relative to baseline in 2020................................................................................................. 130
Table F 15: Dairy baseline projections for Ireland, 2000-2020............................................ 131
List of Tables
viii
Table F 16: Dairy scenario projections for Ireland, % change relative to baseline in 2020................................................................................................. 132
Table F 17: Dairy baseline projections for Italy, 2000-2020................................................ 133
Table F 18: Dairy scenario projections for Italy, % change relative to baseline in 2020..... 134
Table F 19: Dairy baseline projections for Portugal, 2000-2020 ......................................... 135
Table F 20: Dairy scenario projections for Portugal, % change relative to baseline in 2020................................................................................................. 136
Table F 21: Dairy baseline projections for Spain, 2000-2020.............................................. 137
Table F 22: Dairy scenario projections for Spain, % change relative to baseline in 2020... 138
Table F 23: Dairy baseline projections for Sweden, 2000-2020 .......................................... 139
Table F 24: Dairy scenario projections for Sweden, % change relative to baseline in 2020................................................................................................. 140
Table F 25: Dairy baseline projections for the Netherlands, 2000-2020.............................. 141
Table F 26: Dairy scenario projections for the Netherlands, % change relative to baseline in 2020................................................................................................. 142
Table F 27: Dairy baseline projections for UK, 2000-2020 ................................................. 143
Table F 28: Dairy scenario projections for the UK, % change relative to baseline in 2020................................................................................................. 144
Table F 29: Dairy baseline projections for EU-15, 2000-2020 ............................................ 145
Table F 30: Dairy scenario projections for EU-15, % change relative to baseline in 2020................................................................................................. 146
Table F 31: Dairy baseline projections for Bulgaria, 2000-2020 ......................................... 147
Table F 32: Dairy scenario projections for Bulgaria, % change relative to baseline in 2020................................................................................................. 148
Table F 33: Dairy baseline projections for the Czech Republic, 2000-2020........................ 149
Table F 34: Dairy scenario projections for the Czech Republic, % change relative to baseline in 2020................................................................................................. 150
Table F 35: Dairy baseline projections for Estonia, 2000-2020........................................... 151
Table F 36: Dairy scenario projections for Estonia, % change relative to baseline in 2020................................................................................................. 152
Table F 37: Dairy baseline projections for Hungary, 2000-2020......................................... 153
Table F 38: Dairy scenario projections for Hungary, % change relative to baseline in 2020................................................................................................. 154
Table F 39: Dairy baseline projections for Lithuania, 2000-2020........................................ 155
Table F 40: Dairy scenario projections for Lithuania, % change relative to baseline in 2020................................................................................................. 156
Table F 41: Dairy baseline projections for Latvia, 2000-2020............................................. 157
Table F 42: Dairy scenario projections for Latvia, % change relative to baseline in 2020.. 158
Table F 43: Dairy baseline projections for Poland, 2000-2020............................................ 159
List of Tables
ix
Table F 44: Dairy scenario projections for Poland, % change relative to baseline in 2020................................................................................................. 160
Table F 45: Dairy baseline projections for Romania, 2000-2020 ........................................ 161
Table F 46: Dairy scenario projections for Romania, % change relative to baseline in 2020................................................................................................. 162
Table F 47: Dairy baseline projections for the Slovak Republic, 2000-2020 ...................... 163
Table F 48: Dairy scenario projections for the Slovak Republic, % change relative to baseline in 2020................................................................................................. 164
Table F 49: Dairy baseline projections for Slovenia, 2000-2020......................................... 165
Table F 50: Dairy scenario projections for Slovenia, % change relative to baseline in 2020................................................................................................. 166
Table F 51: Dairy baseline projections for EU-12, 2000-2020 ............................................ 167
Table F 52: Dairy scenario projections for EU-12, % change relative to baseline in 2020................................................................................................. 168
Table F 53: Dairy baseline projections for the EU-27, 2000-2020 ...................................... 169
Table F 54: Dairy scenario projections for the EU-27, % change relative to baseline in 2020................................................................................................. 170
Table F 55: Dairy baseline projections for the Nordic group, 2000-2020........................... 171
Table F 56: Dairy scenario projections for the Nordic Group, % change relative to baseline in 2020................................................................................................. 172
Table F 57: Dairy baseline projections for the Western group, 2000-2020 ......................... 173
Table F 58: Dairy scenario projections for the Western Group, % change relative to baseline in 2020................................................................................................. 174
Table F 59: Dairy baseline projections for the Mid-East group, 2000-2020........................ 175
Table F 60: Dairy scenario projections for the Mid-East, % change relative to baseline in 2020................................................................................................. 176
Table F 61: Dairy baseline projections for the Alpine-Balkan, 2000-2020 ......................... 177
Table F 62: Dairy scenario projections for the Alpine-Balkan, % change relative to baseline in 2020................................................................................................. 178
Table F 63: Dairy baseline projections for the South Group, 2000-2020 ............................ 179
Table F 64: Dairy scenario projections for the South Group, % change relative to baseline in 2020................................................................................................. 180
x
List of Figures
Figure 2-1: Annual EU dairy cows' productivity ..................................................................... 4
Figure 2-2: Change in the number of dairy cows herds in EU MS from 1996 to 2006........... 4
Figure 2-3: EU milk production, deliveries and dairy cow herd, 1991 – 2007........................ 6
Figure 2-4: EU MS average milk price and milk over- and undersupply................................ 7
Figure 2-5: Production, consumption and prices of dairy products in the EU....................... 11
Figure 2-6: Exports and export subsidies for dairy products in the EU, 1995-2007 ............. 13
Figure 5-1: Macroeconomic data of the MS used in AGMEMOD........................................ 28
Figure 5-2: Macroeconomic projections for EU MS groupings ............................................ 32
Figure 5-3: US dollar/Euro exchange rate - actual and projected values............................... 32
Figure 5-4: Grains world prices (US $/tonne)........................................................................ 34
Figure 5-5: Oilseeds world prices (US $/tonne) .................................................................... 34
Figure 5-6: Meat world prices (US $/100 kg)........................................................................ 35
Figure 5-7: Dairy commodity world prices (US $/tonne)...................................................... 35
Figure 5-8: FOB Northern Europe Dairy Commodity Price Projections (US$/tonne).......... 36
Figure 6-1: EU 27 dairy production and consumption, baseline ........................................... 44
Figure 6-2: EU dairy prices in key countries, baseline (Euro/100kg).................................... 45
Figure 6-3: Projected milk prices in selected EU MS, baseline............................................. 46
Figure 6-4: EU cereals price projections, baseline................................................................. 46
Figure 6-5: Change in EU milk production and price under scenario Milk 1........................ 49
Figure 6-6: Change in EU milk production and price under scenario Milk 2........................ 50
Figure 6-7: Change in EU milk production and price under scenario Milk 3........................ 51
Figure 6-8: Change in EU milk production and price under scenario Milk 4........................ 52
Figure 6-9: Milk production in Milk 1 and Milk 2 scenarios in selected EU MS ................. 53
Figure 6-10: EU milk product production (2000 = 100) in baseline and scenarios................. 57
Figure 6-11: EU dairy cow numbers in baseline and scenarios ............................................... 58
Figure 6-12: EU beef cow numbers in baseline and scenarios ................................................ 58
Figure A 1: EU MS milk production returns and margins (based on FADN data, 2003) ...... 72
Figure A 2: Milk production costs of specialised IFCN dairy farms, by herd size, 2004 ...... 73
Figure A 3: Average production costs of milk on the EDF farms, by herd size, 2005 .......... 73
Figure C 1: AGMEMOD commodity model structure........................................................... 78
Figure C 2: Linkage between commodity markets in AGMEMOD ...................................... 82
Figure C 3: EU and ROW markets in AGMEMOD - exogenous world prices ..................... 84
Figure C 4: EU and ROW markets in AGMEMOD– endogenous world prices.................... 85
Figure C 5: Butter price transmission in AGMEMOD – endogenous world prices .............. 86

List of Figures
xi
Figure D 1: Whole milk balance............................................................................................. 88
Figure D 2: Fat and protein approach ..................................................................................... 89
Figure D 3: Whole and skimmed milk approach.................................................................... 90
Figure E 1: Production of dairy products in Austria (1 000 tonnes) ...................................... 91
Figure E 2: Dairy products consumption in Austria (1 000 tonnes) ...................................... 91
Figure E 3: Production of dairy products in Belgium and Luxembourg (1 000 tonnes)........ 92
Figure E 4: Dairy products consumption in Belgium and Luxembourg (1 000 tonnes) ........ 92
Figure E 5: Production of dairy products in Bulgaria (1 000 tonnes) .................................... 93
Figure E 6: Dairy products consumption in Bulgaria (1 000 tonnes) .................................... 93
Figure E 7: Production of dairy products in the Czech Republic (1 000 tonnes) .................. 94
Figure E 8: Dairy products consumption in the Czech Republic (1 000 tonnes)................... 94
Figure E 9: Production of dairy products in Denmark (1 000 tonnes)................................... 95
Figure E 10: Dairy products consumption in Denmark (1 000 tonnes) ................................... 96
Figure E 11: Dairy products net export in Denmark (1 000 tonnes)........................................ 96
Figure E 12: Milk production in Estonia (1 000 tonnes).......................................................... 97
Figure E 13: Number of cows in Estonia (1 000 heads) .......................................................... 97
Figure E 14: Yield per cow in Estonia (kg/cow/year).............................................................. 98
Figure E 15: Production of dairy cow milk in Finland (1 000 tonnes) .................................... 99
Figure E 16: Production of dairy products in France (1 000 tonnes) ....................................... 99
Figure E 17: Dairy products consumption in France (1 000 tonnes) ....................................... 99
Figure E 18: Production of dairy products in Germany (index 100 = 1980) ......................... 100
Figure E 19: Dairy products consumption in Germany (index 100 = 1980).......................... 101
Figure E 20: Production of dairy products in Hungary (1 000 tonnes).................................. 101
Figure E 21: Dairy products consumption in Hungary (1 000 tonnes) .................................. 101
Figure E 22: Production of dairy products in Ireland (index 100 = 1980)............................. 102
Figure E 23: Dairy products consumption in Ireland (index 100 = 1980) ............................. 103
Figure E 24: Production of dairy products in Italy (1 000 tonnes) ........................................ 103
Figure E 25: Dairy products consumption in Italy (1 000 tonnes)......................................... 104
Figure E 26: Production of dairy products in Latvia (1 000 tonnes)...................................... 104
Figure E 27: Dairy products consumption in Latvia (1 000 tonnes) ...................................... 105
Figure E 28: Production of dairy products in Lithuania (1 000 tonnes) ................................ 106
Figure E 29: Dairy products consumption in Lithuania (1 000 tonnes)................................. 106
Figure E 30: Dairy products net export in Lithuania (1 000 tonnes) ..................................... 106
Figure E 31: Production and consumption of dairy products in Poland (1 000 tonnes) ........ 107
Figure E 32: Production of dairy products in Portugal (1 000 tonnes) .................................. 107
Figure E 33: Dairy products consumption in Portugal (1 000 tonnes)................................... 108
List of Figures
xii
Figure E 34: Production of dairy products Romania (1 000 tonnes) ..................................... 108
Figure E 35: Dairy products consumption in Romania (1 000 tonnes).................................. 109
Figure E 36: Production of dairy products in Slovakia (1 000 tonnes).................................. 109
Figure E 37: Dairy products consumption in Slovakia (1 000 tonnes) .................................. 110
Figure E 38: Production of dairy products in Slovenia (1 000 tonnes).................................. 110
Figure E 39: Dairy products consumption in Slovenia (1 000 tonnes) .................................. 111
Figure E 40: Net exports of dairy products in Slovenia (1 000 tonnes)................................. 111
Figure E 41: Dairy production in Spain (1 000 tonnes) ......................................................... 112
Figure E 42: Dairy products domestic use in Spain (1 000 tonnes) ....................................... 112
Figure E 43: Production of dairy products in Sweden (1 000 tonnes) ................................... 113
Figure E 44: Dairy products consumption in Sweden (1 000 tonnes) ................................... 113
Figure E 45: Production of dairy products in the Netherlands (1 000 tonnes)....................... 114
Figure E 46: Dairy products consumption in the Netherlands (1 000 tonnes) ....................... 114
Figure E 47: Dairy products net exports in the Netherlands (1 000 tonnes) .......................... 114
Figure E 48: Production of dairy products in the UK (1 000 tonnes) .................................... 115
Figure E 49: Dairy products consumption in the UK (1 000 tonnes) .................................... 115
Figure G 1: EU-15 MS Milk Output in 2020 under Scenario Milk 1................................... 181
Figure G 2: EU-12 MS Milk Output in 2020 under Scenario Milk 1................................... 182
Figure G 3: EU-15 MS Milk Output in 2020 under Scenario Milk 2................................... 183
Figure G 4: EU-12 MS Milk Output in 2020 under Scenario Milk 2................................... 184
Figure G 5: EU-15 MS Milk Output in 2020 under Scenario Milk 3................................... 185
Figure G 6: EU-12 MS Milk Output in 2020 under Scenario Milk 3................................... 186
Figure G 7: EU-15 MS Milk Output in 2020 under Scenario Milk 4................................... 187
Figure G 8: EU-12 MS Milk Output in 2020 under Scenario Milk 4................................... 188
xiii
List of Abbreviations
ACP Africa, Caribbean, and Pacific
AGMEMOD AGricultural MEmber states MODelling
AGMEMOD2020 The EU 6th Framework Programme project
CAP Common Agricultural Policy
CGE Computable General Equilibrium
CMO Common Market Organisation
EBA Everything but Arms
EDF European Dairy Farmers
EU European Union
EU-12 12 EU Member States of 2004 and 2007 enlargements; Cyprus and Malta not included
EU-15 15 EU Member States before the 2004 enlargement
EU-25 25 EU Member States after the 2004 enlargement; Cyprus and Malta not included
EU-27 27 EU Member States after the 2007 enlargement; Cyprus and Malta not included
FADN Farm Accountancy Data Network
FAPRI Food and Agricultural Policy Research Institute
FAO Food and Agriculture Organization of the United Nations
FFF Flexible Functional Form
GDP Gross Domestic Product
GSP Generalised System of Preferences
HC Health Check
IFCN International Farm Comparison Network
LA Luxembourg Agreement 2003
LDC Least Developed Countries
MFN Most Favourite Nation
MS Member States
MTR Mid-Term Review
OECD Organisation for Economic Co-operation and Development
PE Partial Equilibrium
ROW Rest of the World
RTA Regional Trade Agreement
SAPS Single Area Payment Scheme
SFP Single Farm Payment
List of Abbreviations
xiv
SMP Skimmed Milk Powder
SPS Single Payment Scheme
SUR Seemingly Unrelated Regression
SXL Subsidized export limit
TRQ Tariff Rate Quota
USDA United States Department of Agriculture
WMP Whole Milk Powder
xv
AGMEMOD Consortium Partners involved in this study
Agricultural Economics Research Institute (LEI), The Hague, The Netherlands Myrna van Leeuwen Andrzej Tabeau www.lei.wur.nl/UK/
Johann Heinrich von Thünen-Institut (vTI), Braunschweig, Germany Petra Salamon Michael Heiden Oliver von Ledebur www.vti.bund.de
Centre of Agricultural Economics, INRA-ESR, Rennes, France Frédéric Chantreuil www.inra.fr/
Teagasc-Rural Economy Research Centre (RERC), Athenry, Co. Galway, Ireland Trevor Donnellan Kevin Hanrahan www.teagasc.ie
Latvian State Institute of Agrarian Economics (LSIAE), Riga, Latvia Guna Salputra www.lvaei.lv
University of Ljubljana, Biotechnical Faculty (LJUB), Ljubljana, Slovenia Emil Erjavec Stane Kavcic Darja Regoršek www.bf.uni-lj.si/zootehnika/o-oddelku/katedre-in-druge-org-enote/za-agrarno-ekonomiko-politiko-in-pravo.html
1
1 Introduction
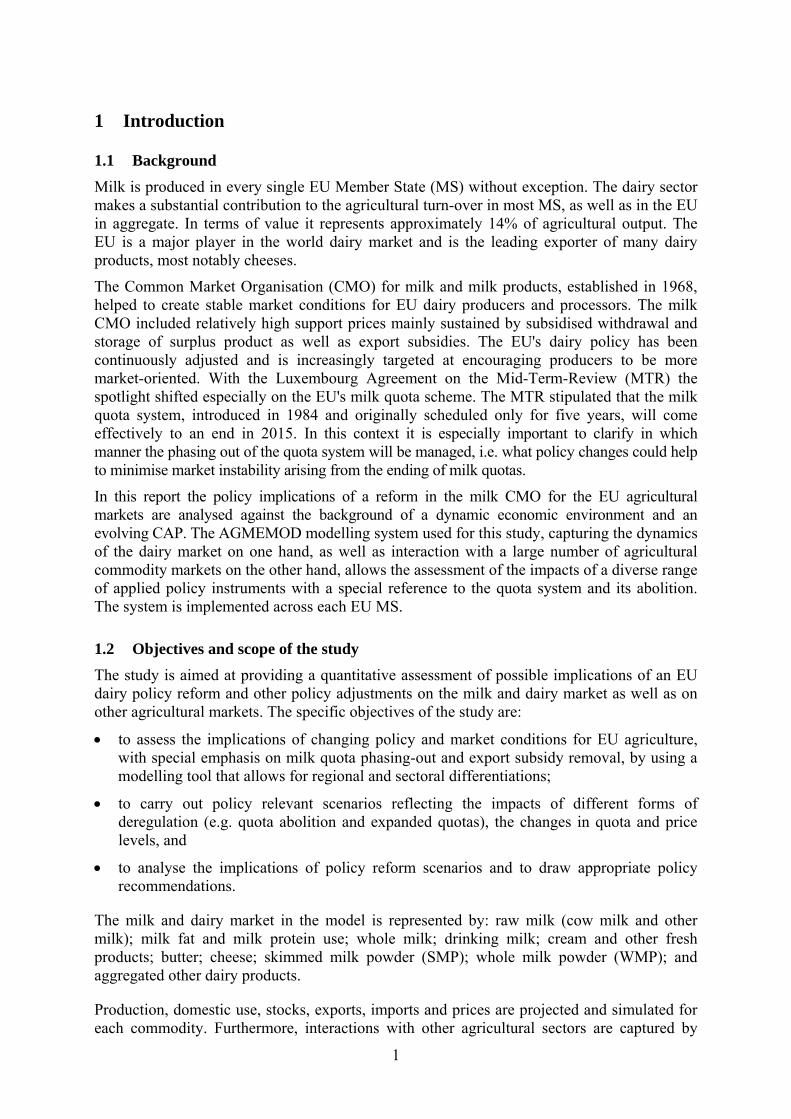
1.1 Background Milk is produced in every single EU Member State (MS) without exception. The dairy sector makes a substantial contribution to the agricultural turn-over in most MS, as well as in the EU in aggregate. In terms of value it represents approximately 14% of agricultural output. The EU is a major player in the world dairy market and is the leading exporter of many dairy products, most notably cheeses.
The Common Market Organisation (CMO) for milk and milk products, established in 1968, helped to create stable market conditions for EU dairy producers and processors. The milk CMO included relatively high support prices mainly sustained by subsidised withdrawal and storage of surplus product as well as export subsidies. The EU's dairy policy has been continuously adjusted and is increasingly targeted at encouraging producers to be more market-oriented. With the Luxembourg Agreement on the Mid-Term-Review (MTR) the spotlight shifted especially on the EU's milk quota scheme. The MTR stipulated that the milk quota system, introduced in 1984 and originally scheduled only for five years, will come effectively to an end in 2015. In this context it is especially important to clarify in which manner the phasing out of the quota system will be managed, i.e. what policy changes could help to minimise market instability arising from the ending of milk quotas.
In this report the policy implications of a reform in the milk CMO for the EU agricultural markets are analysed against the background of a dynamic economic environment and an evolving CAP. The AGMEMOD modelling system used for this study, capturing the dynamics of the dairy market on one hand, as well as interaction with a large number of agricultural commodity markets on the other hand, allows the assessment of the impacts of a diverse range of applied policy instruments with a special reference to the quota system and its abolition. The system is implemented across each EU MS.
1.2 Objectives and scope of the study The study is aimed at providing a quantitative assessment of possible implications of an EU dairy policy reform and other policy adjustments on the milk and dairy market as well as on other agricultural markets. The specific objectives of the study are:
• to assess the implications of changing policy and market conditions for EU agriculture, with special emphasis on milk quota phasing-out and export subsidy removal, by using a modelling tool that allows for regional and sectoral differentiations;
• to carry out policy relevant scenarios reflecting the impacts of different forms of deregulation (e.g. quota abolition and expanded quotas), the changes in quota and price levels, and
• to analyse the implications of policy reform scenarios and to draw appropriate policy recommendations.
The milk and dairy market in the model is represented by: raw milk (cow milk and other milk); milk fat and milk protein use; whole milk; drinking milk; cream and other fresh products; butter; cheese; skimmed milk powder (SMP); whole milk powder (WMP); and aggregated other dairy products.
Production, domestic use, stocks, exports, imports and prices are projected and simulated for each commodity. Furthermore, interactions with other agricultural sectors are captured by
Introduction
2
linkages to the beef and crop sectors, e.g. by the supply of calves for beef production and feed demand for SMP and grain and oilseed based animal feeds. Thus, apart from the dairy sector, results for the following other sectors are available: • the cereal sector with soft wheat, durum wheat, barley, maize, rye, other grains; • the oilseed sector with rapeseed, sunflower seed, soybeans, derived vegetables oils and
meals; and • the livestock sector with beef and veal, pork, poultry, sheep and goats.
In order to capture the diversity of European agriculture, projections and simulations results of the study cover: • the individual MS; • EU-15 as a whole (15 MS before May 2004); • EU-12 as a whole (12 new MS from May 2004 and January 2007 enlargements; Cyprus
and Malta not included); • EU-27 as a whole (27 MS from January 2007; Cyprus and Malta not included); • Nordic Group (SE, FI, LV, LT, EE), Western Group (FR, BE, NL, DK, UK, IE), Middle
and Eastern Group (DE, PL, CZ, SK, HU), East Alpine and Balkan Group (AT, SI, RO, BG) and South Group (PT, ES, GR, IT).
Projections are generated from year 2006 to 2020 with the underlying quantitative and qualitative assumptions on macroeconomic and other variables reported.
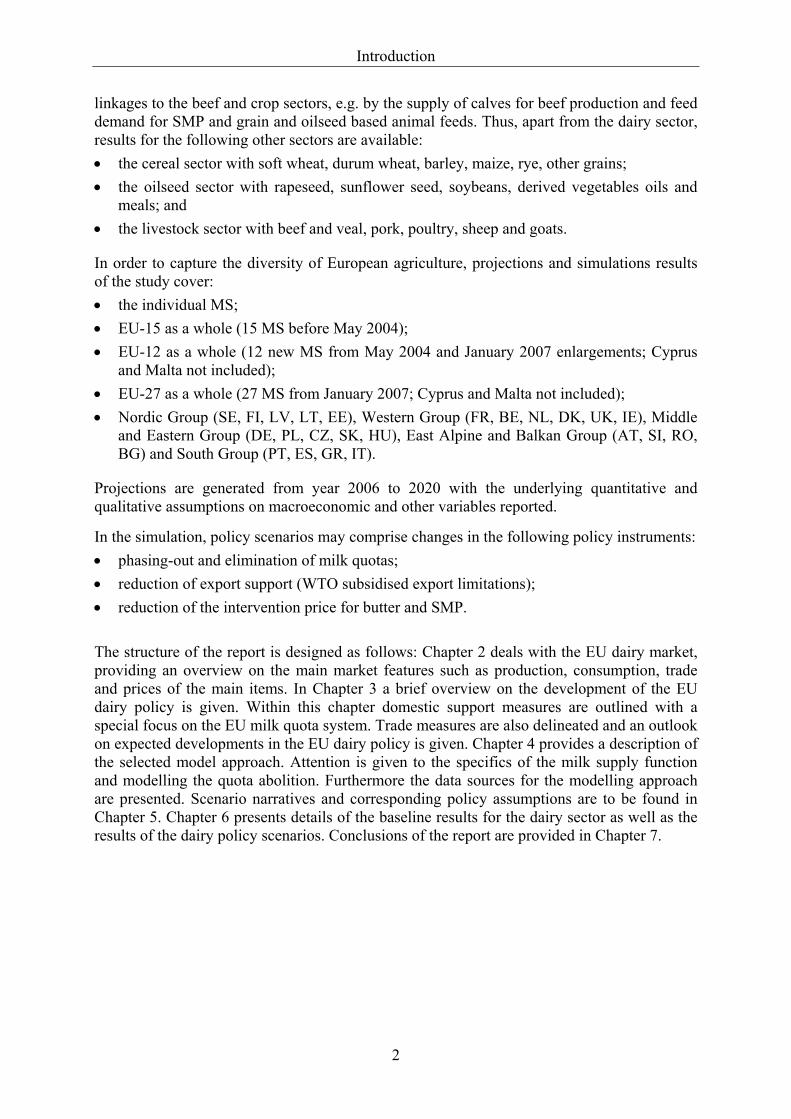
In the simulation, policy scenarios may comprise changes in the following policy instruments: • phasing-out and elimination of milk quotas; • reduction of export support (WTO subsidised export limitations); • reduction of the intervention price for butter and SMP. The structure of the report is designed as follows: Chapter 2 deals with the EU dairy market, providing an overview on the main market features such as production, consumption, trade and prices of the main items. In Chapter 3 a brief overview on the development of the EU dairy policy is given. Within this chapter domestic support measures are outlined with a special focus on the EU milk quota system. Trade measures are also delineated and an outlook on expected developments in the EU dairy policy is given. Chapter 4 provides a description of the selected model approach. Attention is given to the specifics of the milk supply function and modelling the quota abolition. Furthermore the data sources for the modelling approach are presented. Scenario narratives and corresponding policy assumptions are to be found in Chapter 5. Chapter 6 presents details of the baseline results for the dairy sector as well as the results of the dairy policy scenarios. Conclusions of the report are provided in Chapter 7.
3
2 Overview of the EU dairy sector The EU dairy sector is important to the EU in a variety of ways. Most notably, milk is produced in every single EU MS without exception, and milk is the number one single product sector in terms of value of agricultural output. Furthermore the EU is a major player in the world dairy market and is a leading exporter of many dairy products. In order to give an overview on the EU dairy sector in this chapter, the milk supply and the structure of EU dairy farming are described in section 2.1, followed by an outline of milk prices in chapter 2.2. Milk processing and consumption are framed in chapter 2.3 and chapter 2.4 summarises the EU's role in the world dairy trade.
2.1 Milk supply and structure of EU dairy farming Within the agricultural sector, milk is one of the main commodities produced in the EU. Milk production takes place in all EU MS and at EU level it represented a share of about 14% of total agricultural production in 2004, amounting to a value of more than EUR 43 billion at the farm gate level (European Commission, 2007a). Further milk processing is based on 150 million t of raw milk produced in the EU-27 in 2006 (ZMP, 2007). Across the different EU MS the dairy sector varies considerably in size and agricultural importance, reflecting climatic and other agricultural factors in the region concerned. Thus, the principal milk producing countries tend to be found in the more temperate regions in northern and central Europe. Within the EU, Germany has the highest level of milk production at about 28 million t followed by France and the United Kingdom (UK) with a production of 24 million t and 14.4 million t in 2006, respectively (EUROSTAT, 2007). Among the EU-12, Poland comes first with nearly 12 million t, which places it fourth in the total EU ranking (Salamon et al., 2007).
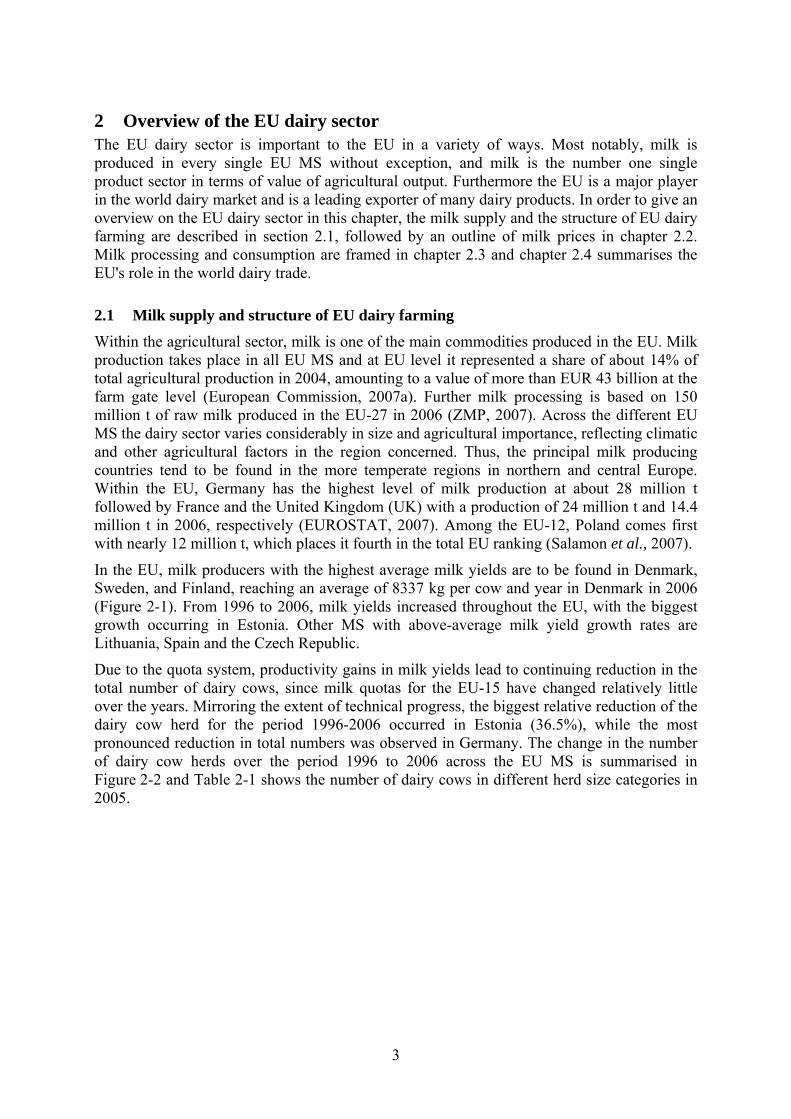
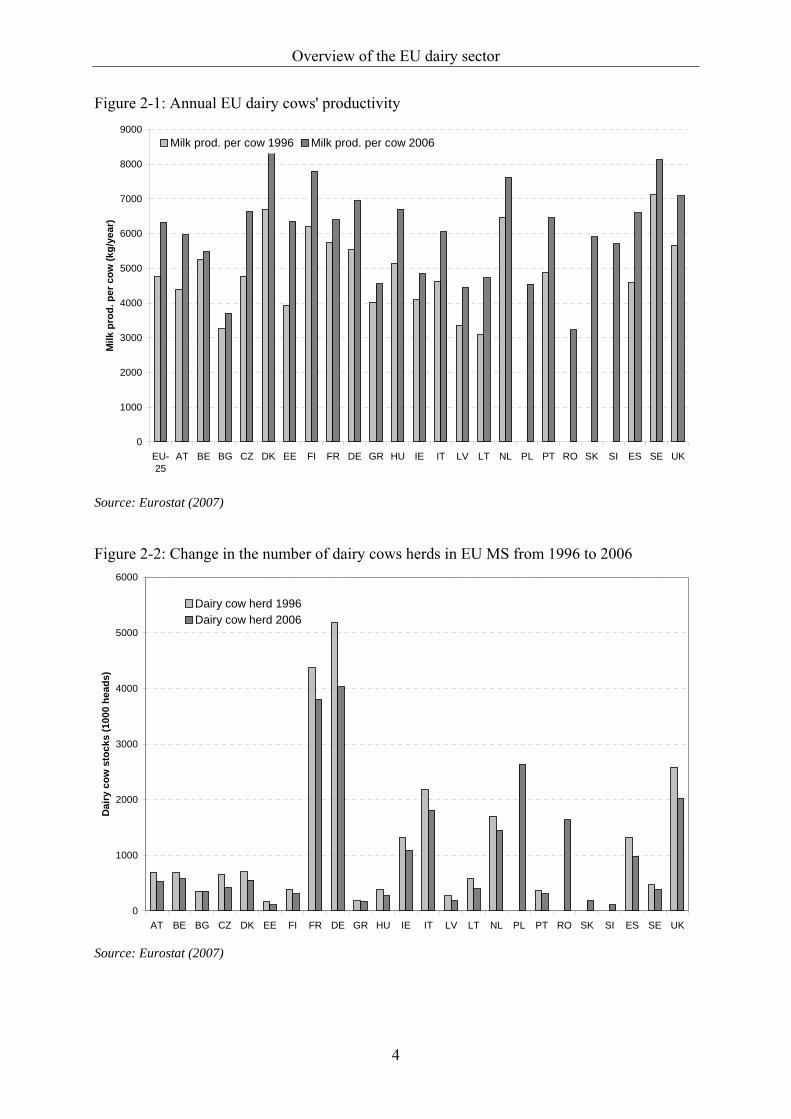
In the EU, milk producers with the highest average milk yields are to be found in Denmark, Sweden, and Finland, reaching an average of 8337 kg per cow and year in Denmark in 2006 (Figure 2-1). From 1996 to 2006, milk yields increased throughout the EU, with the biggest growth occurring in Estonia. Other MS with above-average milk yield growth rates are Lithuania, Spain and the Czech Republic.
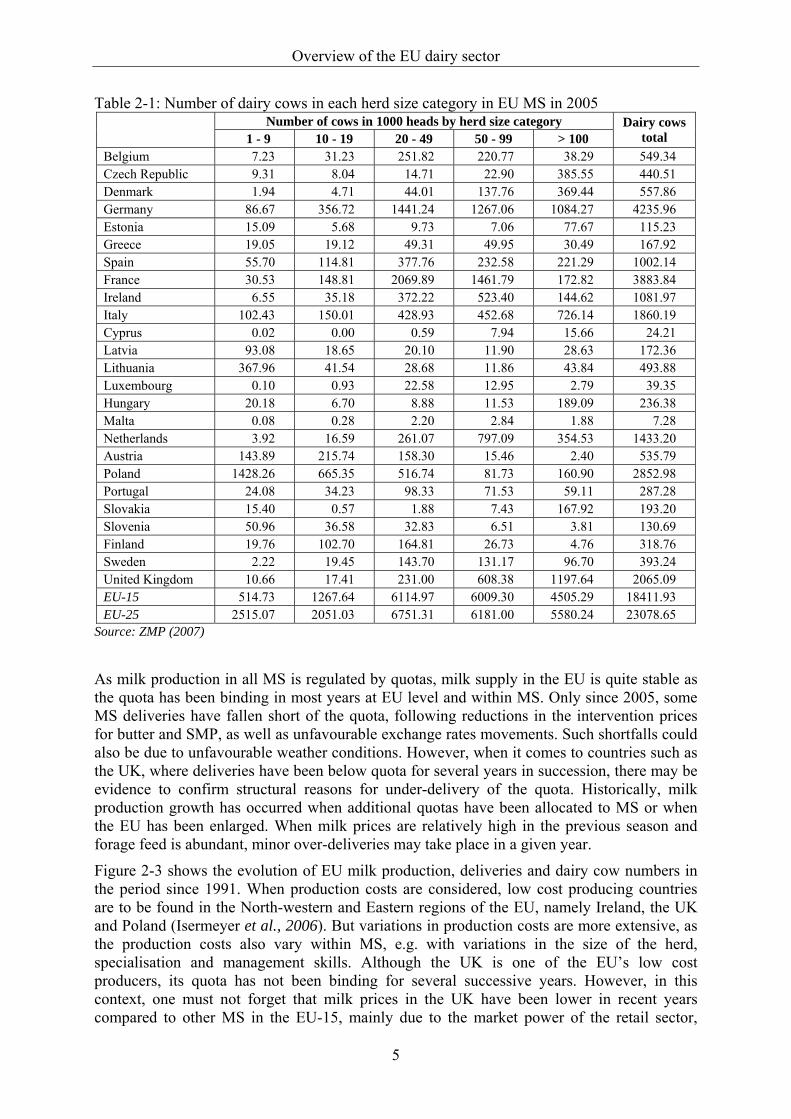
Due to the quota system, productivity gains in milk yields lead to continuing reduction in the total number of dairy cows, since milk quotas for the EU-15 have changed relatively little over the years. Mirroring the extent of technical progress, the biggest relative reduction of the dairy cow herd for the period 1996-2006 occurred in Estonia (36.5%), while the most pronounced reduction in total numbers was observed in Germany. The change in the number of dairy cow herds over the period 1996 to 2006 across the EU MS is summarised in Figure 2-2 and Table 2-1 shows the number of dairy cows in different herd size categories in 2005.
Overview of the EU dairy sector
4
Figure 2-1: Annual EU dairy cows' productivity
0
1000
2000
3000
4000
5000
6000
7000
8000
9000
EU-25
AT BE BG CZ DK EE FI FR DE GR HU IE IT LV LT NL PL PT RO SK SI ES SE UK
Milk
pro
d. p
er c
ow (k
g/ye
ar)
Milk prod. per cow 1996 Milk prod. per cow 2006
Source: Eurostat (2007)
Figure 2-2: Change in the number of dairy cows herds in EU MS from 1996 to 2006
0
1000
2000
3000
4000
5000
6000
AT BE BG CZ DK EE FI FR DE GR HU IE IT LV LT NL PL PT RO SK SI ES SE UK
Dai
ry c
ow s
tock
s (1
000
head
s)
Dairy cow herd 1996Dairy cow herd 2006
Source: Eurostat (2007)
Overview of the EU dairy sector
5
Table 2-1: Number of dairy cows in each herd size category in EU MS in 2005 Number of cows in 1000 heads by herd size category
1 - 9 10 - 19 20 - 49 50 - 99 > 100 Dairy cows
total Belgium 7.23 31.23 251.82 220.77 38.29 549.34 Czech Republic 9.31 8.04 14.71 22.90 385.55 440.51 Denmark 1.94 4.71 44.01 137.76 369.44 557.86 Germany 86.67 356.72 1441.24 1267.06 1084.27 4235.96 Estonia 15.09 5.68 9.73 7.06 77.67 115.23 Greece 19.05 19.12 49.31 49.95 30.49 167.92 Spain 55.70 114.81 377.76 232.58 221.29 1002.14 France 30.53 148.81 2069.89 1461.79 172.82 3883.84 Ireland 6.55 35.18 372.22 523.40 144.62 1081.97 Italy 102.43 150.01 428.93 452.68 726.14 1860.19 Cyprus 0.02 0.00 0.59 7.94 15.66 24.21 Latvia 93.08 18.65 20.10 11.90 28.63 172.36 Lithuania 367.96 41.54 28.68 11.86 43.84 493.88 Luxembourg 0.10 0.93 22.58 12.95 2.79 39.35 Hungary 20.18 6.70 8.88 11.53 189.09 236.38 Malta 0.08 0.28 2.20 2.84 1.88 7.28 Netherlands 3.92 16.59 261.07 797.09 354.53 1433.20 Austria 143.89 215.74 158.30 15.46 2.40 535.79 Poland 1428.26 665.35 516.74 81.73 160.90 2852.98 Portugal 24.08 34.23 98.33 71.53 59.11 287.28 Slovakia 15.40 0.57 1.88 7.43 167.92 193.20 Slovenia 50.96 36.58 32.83 6.51 3.81 130.69 Finland 19.76 102.70 164.81 26.73 4.76 318.76 Sweden 2.22 19.45 143.70 131.17 96.70 393.24 United Kingdom 10.66 17.41 231.00 608.38 1197.64 2065.09 EU-15 514.73 1267.64 6114.97 6009.30 4505.29 18411.93 EU-25 2515.07 2051.03 6751.31 6181.00 5580.24 23078.65
Source: ZMP (2007) As milk production in all MS is regulated by quotas, milk supply in the EU is quite stable as the quota has been binding in most years at EU level and within MS. Only since 2005, some MS deliveries have fallen short of the quota, following reductions in the intervention prices for butter and SMP, as well as unfavourable exchange rates movements. Such shortfalls could also be due to unfavourable weather conditions. However, when it comes to countries such as the UK, where deliveries have been below quota for several years in succession, there may be evidence to confirm structural reasons for under-delivery of the quota. Historically, milk production growth has occurred when additional quotas have been allocated to MS or when the EU has been enlarged. When milk prices are relatively high in the previous season and forage feed is abundant, minor over-deliveries may take place in a given year.
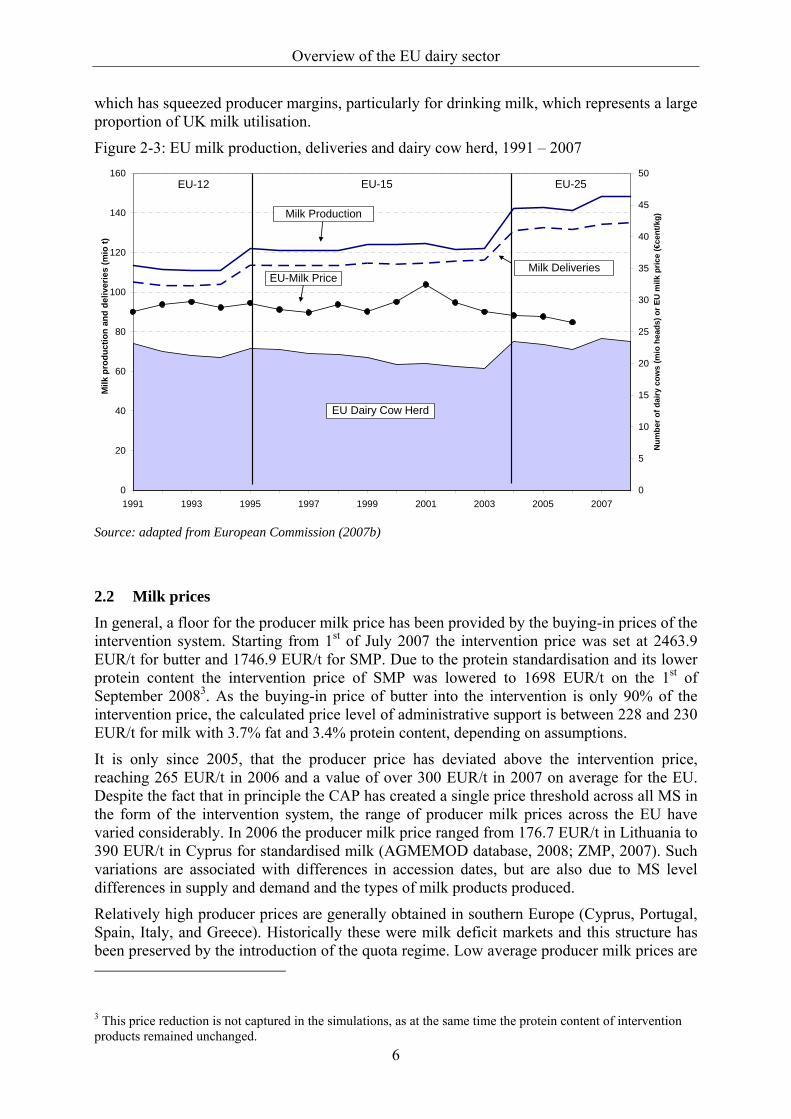
Figure 2-3 shows the evolution of EU milk production, deliveries and dairy cow numbers in the period since 1991. When production costs are considered, low cost producing countries are to be found in the North-western and Eastern regions of the EU, namely Ireland, the UK and Poland (Isermeyer et al., 2006). But variations in production costs are more extensive, as the production costs also vary within MS, e.g. with variations in the size of the herd, specialisation and management skills. Although the UK is one of the EU’s low cost producers, its quota has not been binding for several successive years. However, in this context, one must not forget that milk prices in the UK have been lower in recent years compared to other MS in the EU-15, mainly due to the market power of the retail sector,
Overview of the EU dairy sector
6
which has squeezed producer margins, particularly for drinking milk, which represents a large proportion of UK milk utilisation.
Figure 2-3: EU milk production, deliveries and dairy cow herd, 1991 – 2007
0
20
40
60
80
100
120
140
160
1991 1993 1995 1997 1999 2001 2003 2005 2007
Milk
pro
duct
ion
and
deliv
erie
s (m
io t)
0
5
10
15
20
25
30
35
40
45
50
Num
ber o
f dai
ry c
ows
(mio
hea
ds) o
r EU
milk
pric
e (€
cent
/kg)
EU-12 EU-15 EU-25
Milk Production
Milk Deliveries
EU Dairy Cow Herd
EU-Milk Price
Source: adapted from European Commission (2007b)
2.2 Milk prices In general, a floor for the producer milk price has been provided by the buying-in prices of the intervention system. Starting from 1st of July 2007 the intervention price was set at 2463.9 EUR/t for butter and 1746.9 EUR/t for SMP. Due to the protein standardisation and its lower protein content the intervention price of SMP was lowered to 1698 EUR/t on the 1st of September 20083. As the buying-in price of butter into the intervention is only 90% of the intervention price, the calculated price level of administrative support is between 228 and 230 EUR/t for milk with 3.7% fat and 3.4% protein content, depending on assumptions.
It is only since 2005, that the producer price has deviated above the intervention price, reaching 265 EUR/t in 2006 and a value of over 300 EUR/t in 2007 on average for the EU. Despite the fact that in principle the CAP has created a single price threshold across all MS in the form of the intervention system, the range of producer milk prices across the EU have varied considerably. In 2006 the producer milk price ranged from 176.7 EUR/t in Lithuania to 390 EUR/t in Cyprus for standardised milk (AGMEMOD database, 2008; ZMP, 2007). Such variations are associated with differences in accession dates, but are also due to MS level differences in supply and demand and the types of milk products produced.
Relatively high producer prices are generally obtained in southern Europe (Cyprus, Portugal, Spain, Italy, and Greece). Historically these were milk deficit markets and this structure has been preserved by the introduction of the quota regime. Low average producer milk prices are
3 This price reduction is not captured in the simulations, as at the same time the protein content of intervention products remained unchanged.
Overview of the EU dairy sector
7
especially marked in the Baltic States, Poland and Hungary as well as in the UK and Ireland. With the exception of the UK these are generally surplus markets.
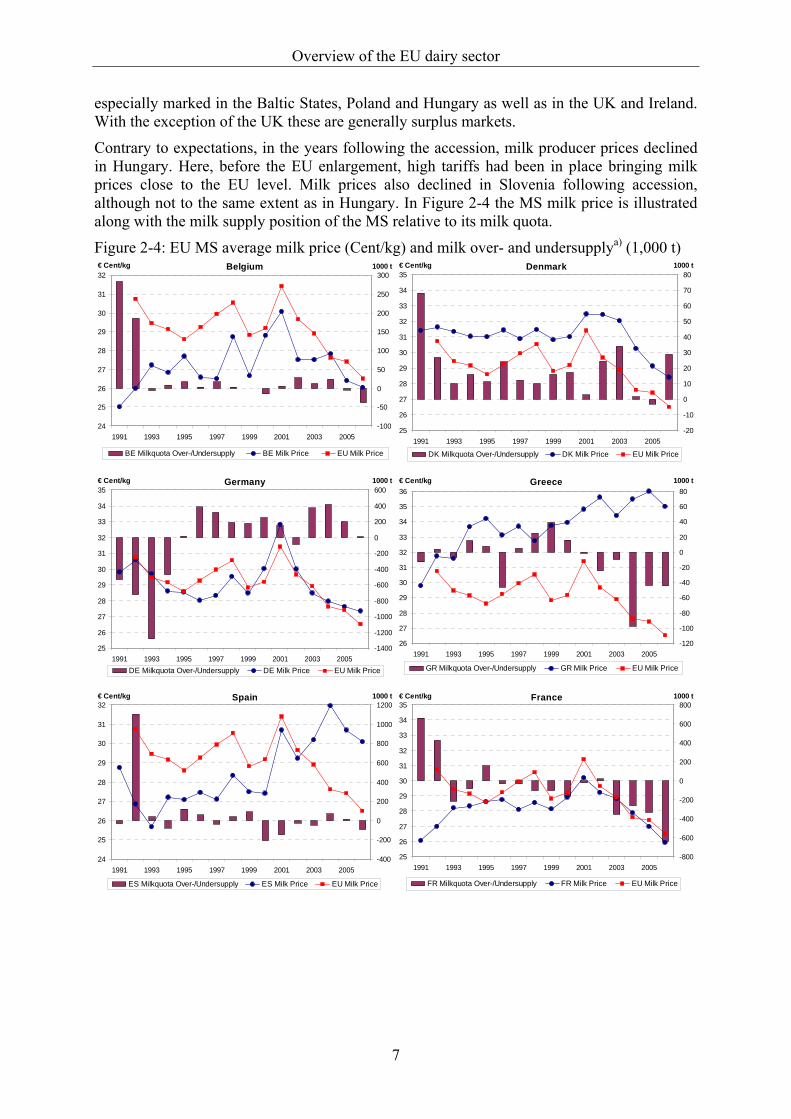
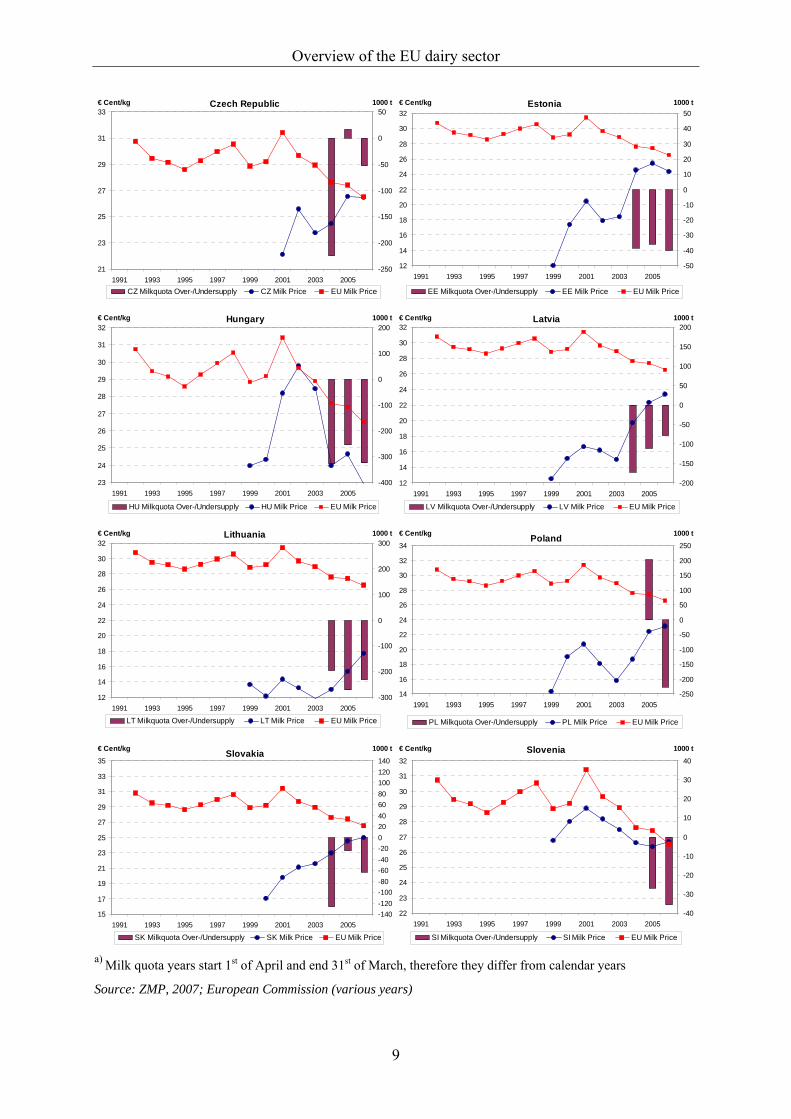
Contrary to expectations, in the years following the accession, milk producer prices declined in Hungary. Here, before the EU enlargement, high tariffs had been in place bringing milk prices close to the EU level. Milk prices also declined in Slovenia following accession, although not to the same extent as in Hungary. In Figure 2-4 the MS milk price is illustrated along with the milk supply position of the MS relative to its milk quota.
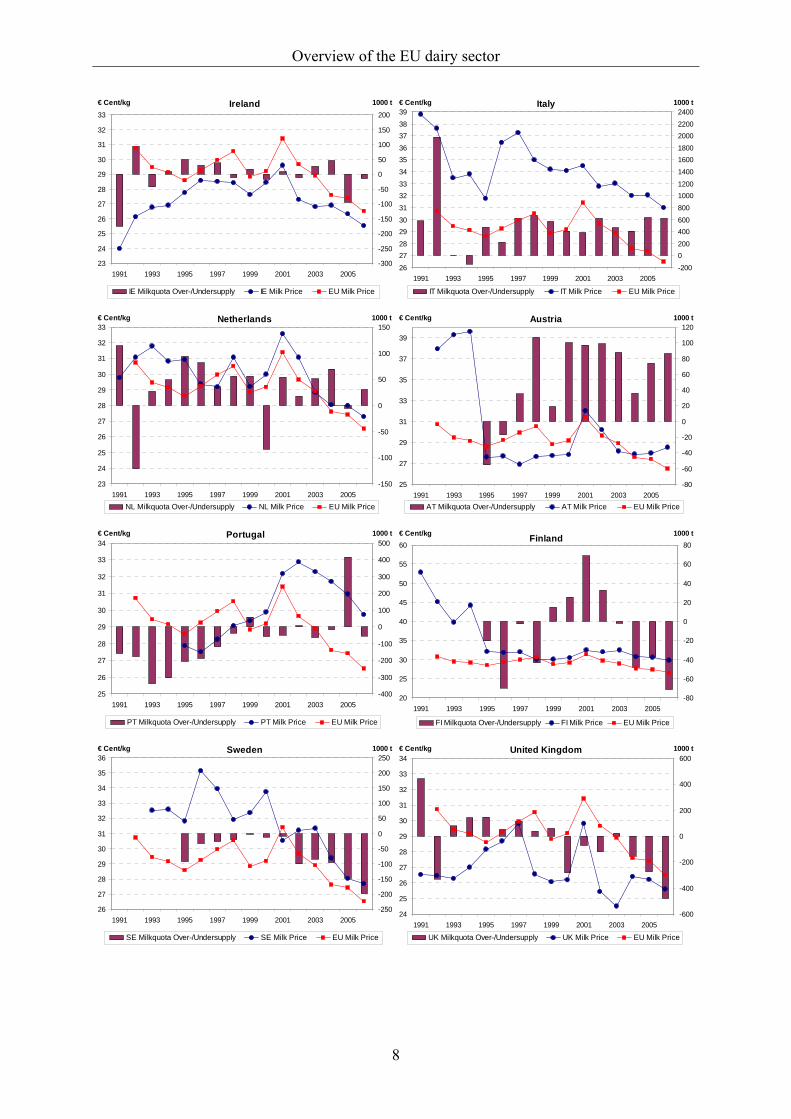
Figure 2-4: EU MS average milk price (Cent/kg) and milk over- and undersupplya) (1,000 t) Belgium
24
25
26
27
28
29
30
31
32
1991 1993 1995 1997 1999 2001 2003 2005
€ Cent/kg
-100
-50
0
50
100
150
200
250
3001000 t
BE Milkquota Over-/Undersupply BE Milk Price EU Milk Price
Denmark
25
26
27
28
29
30
31
32
33
34
35
1991 1993 1995 1997 1999 2001 2003 2005
€ Cent/kg
-20
-10
0
10
20
30
40
50
60
70
801000 t
DK Milkquota Over-/Undersupply DK Milk Price EU Milk Price Germany
25
26
27
28
29
30
31
32
33
34
35
1991 1993 1995 1997 1999 2001 2003 2005
€ Cent/kg
-1400
-1200
-1000
-800
-600
-400
-200
0
200
400
6001000 t
DE Milkquota Over-/Undersupply DE Milk Price EU Milk Price
Greece
26
27
28
29
30
31
32
33
34
35
36
1991 1993 1995 1997 1999 2001 2003 2005
€ Cent/kg
-120
-100
-80
-60
-40
-20
0
20
40
60
801000 t
GR Milkquota Over-/Undersupply GR Milk Price EU Milk Price Spain
24
25
26
27
28
29
30
31
32
1991 1993 1995 1997 1999 2001 2003 2005
€ Cent/kg
-400
-200
0
200
400
600
800
1000
12001000 t
ES Milkquota Over-/Undersupply ES Milk Price EU Milk Price
France
25
26
27
28
29
30
31
32
33
34
35
1991 1993 1995 1997 1999 2001 2003 2005
€ Cent/kg
-800
-600
-400
-200
0
200
400
600
8001000 t
FR Milkquota Over-/Undersupply FR Milk Price EU Milk Price
Overview of the EU dairy sector
8
Ireland
23
24
25
26
27
28
29
30
31
32
33
1991 1993 1995 1997 1999 2001 2003 2005
€ Cent/kg
-300
-250
-200
-150
-100
-50
0
50
100
150
200
1000 t
IE Milkquota Over-/Undersupply IE Milk Price EU Milk Price
Italy
26
2728
2930
313233
343536373839
1991 1993 1995 1997 1999 2001 2003 2005
€ Cent/kg
-200
0200
400600
80010001200
140016001800200022002400
1000 t
IT Milkquota Over-/Undersupply IT Milk Price EU Milk Price Netherlands
23
24
25
26
27
28
29
30
31
32
33
1991 1993 1995 1997 1999 2001 2003 2005
€ Cent/kg
-150
-100
-50
0
50
100
1501000 t
NL Milkquota Over-/Undersupply NL Milk Price EU Milk Price
Austria
25
27
29
31
33
35
37
39
1991 1993 1995 1997 1999 2001 2003 2005
€ Cent/kg
-80
-60
-40
-20
0
20
40
60
80
100
1201000 t
AT Milkquota Over-/Undersupply AT Milk Price EU Milk Price Portugal
25
26
27
28
29
30
31
32
33
34
1991 1993 1995 1997 1999 2001 2003 2005
€ Cent/kg
-400
-300
-200
-100
0
100
200
300
400
5001000 t
PT Milkquota Over-/Undersupply PT Milk Price EU Milk Price
Finland
20
25
30
35
40
45
50
55
60
1991 1993 1995 1997 1999 2001 2003 2005
€ Cent/kg
-80
-60
-40
-20
0
20
40
60
801000 t
FI Milkquota Over-/Undersupply FI Milk Price EU Milk Price Sweden
26
27
28
29
30
31
32
33
34
35
36
1991 1993 1995 1997 1999 2001 2003 2005
€ Cent/kg
-250
-200
-150
-100
-50
0
50
100
150
200
2501000 t
SE Milkquota Over-/Undersupply SE Milk Price EU Milk Price
United Kingdom
24
25
26
27
28
29
30
31
32
33
34
1991 1993 1995 1997 1999 2001 2003 2005
€ Cent/kg
-600
-400
-200
0
200
400
6001000 t
UK Milkquota Over-/Undersupply UK Milk Price EU Milk Price
Overview of the EU dairy sector
9
Czech Republic
21
23
25
27
29
31
33
1991 1993 1995 1997 1999 2001 2003 2005
€ Cent/kg
-250
-200
-150
-100
-50
0
501000 t
CZ Milkquota Over-/Undersupply CZ Milk Price EU Milk Price
Estonia
12
14
16
18
20
22
24
26
28
30
32
1991 1993 1995 1997 1999 2001 2003 2005
€ Cent/kg
-50
-40
-30
-20
-10
0
10
20
30
40
501000 t
EE Milkquota Over-/Undersupply EE Milk Price EU Milk Price Hungary
23
24
25
26
27
28
29
30
31
32
1991 1993 1995 1997 1999 2001 2003 2005
€ Cent/kg
-400
-300
-200
-100
0
100
2001000 t
HU Milkquota Over-/Undersupply HU Milk Price EU Milk Price
Latvia
12
14
16
18
20
22
24
26
28
30
32
1991 1993 1995 1997 1999 2001 2003 2005
€ Cent/kg
-200
-150
-100
-50
0
50
100
150
2001000 t
LV Milkquota Over-/Undersupply LV Milk Price EU Milk Price Lithuania
12
14
16
18
20
22
24
26
28
30
32
1991 1993 1995 1997 1999 2001 2003 2005
€ Cent/kg
-300
-200
-100
0
100
200
3001000 t
LT Milkquota Over-/Undersupply LT Milk Price EU Milk Price
Poland
14
16
18
20
22
24
26
28
30
32
34
1991 1993 1995 1997 1999 2001 2003 2005
€ Cent/kg
-250
-200
-150
-100
-50
0
50
100
150
200
250
1000 t
PL Milkquota Over-/Undersupply PL Milk Price EU Milk Price Slovakia
15
17
19
21
23
25
27
29
31
33
35
1991 1993 1995 1997 1999 2001 2003 2005
€ Cent/kg
-140-120-100-80-60-40-20020406080100120140
1000 t
SK Milkquota Over-/Undersupply SK Milk Price EU Milk Price
Slovenia
22
23
24
25
26
27
28
29
30
31
32
1991 1993 1995 1997 1999 2001 2003 2005
€ Cent/kg
-40
-30
-20
-10
0
10
20
30
40
1000 t
SI Milkquota Over-/Undersupply SI Milk Price EU Milk Price a) Milk quota years start 1st of April and end 31st of March, therefore they differ from calendar years
Source: ZMP, 2007; European Commission (various years)
Overview of the EU dairy sector
10
In general, the EU-15 has experienced reductions in the producer milk prices, while the EU-12 has seen increases in production and processing costs. These changes have had impacts on the actual level of milk production. Hence, the production potential at a given price level differs across the EU. While some countries are unable to fill the milk quotas at a particular price level, the quota remains binding for other countries (e.g. Austria, Luxembourg, Ireland, Cyprus, Netherlands, Denmark, Germany, Italy, and Poland). Therefore, changes in the economic environment reflected in the raw milk price may also affect production costs and therefore the quota rents, as well as the possibility for national quotas to be filled. Projections for the dairy sector are available from various research agencies, which assume that milk quotas continue to remain fixed over the future projection period. According to these projections, the EU-27 share of world dairy commodity markets will be further reduced. This is in line with the decrease in the exportable surplus of the EU-27, following the projected increase in domestic consumption and the limited volume of milk available for processing, due to the existence of the EU milk quota system. Such a development would increase the milk quota rents and bind the quota while differences at MS level as elaborated earlier shall persist.
2.3 Milk processing and consumption In 2006 about 90% or 132 million t of the total milk production was delivered for processing (ZMP, 2007), where the raw milk was mostly transformed into food products. To a lesser degree, feed and pharmaceutical products both for direct consumption and for further processing, are manufactured. Dairy processing comprises about 15% of the turnover for the total food and drink industry in the EU-27. While in the EU-15 deliveries to the dairy industry are a relatively uniform and high percentage of the total production, in the EU-12, in particular in Poland, Bulgaria and Romania as well as in the Baltic States, the share of milk produced that is delivered for manufacturing is considerably lower. Semi-subsistence farming, on-farm consumption, and sales of raw milk, still play an important, but declining, role in these EU-12. Hence, in many EU-12 actual production levels exceed deliveries by a considerable amount.
Variations in the producer prices are transmitted and magnified in wholesale and consumer prices, and these variations are largely due to quality and product portfolio. In the past, drinking milk processing and the manufacturing of intervention products had absorbed a considerable share of deliveries. Reduced market support from the CAP induced a reallocation of raw milk usage towards products where consumer demand was increasing, such as cheese or other fresh dairy products. These products have exhibited remarkable growth rates in the last 10 years.
Upper limits to annual subsidised export volumes and expenditure outlays from the EU, as agreed under WTO, were also a driving factor in determining milk product processing decisions. Thus, the dairy product mix was characterised by a continued increase in the production of cheese, cream and fresh milk products, with the exception of drinking milk. As the raw milk supply was quite stable, the amounts used for other categories declined in particular for SMP and butter. Domestic consumption of WMP was reflected to a lower degree in the manufacturing figures, as EU WMP production is driven more by international export prospects and export refunds.
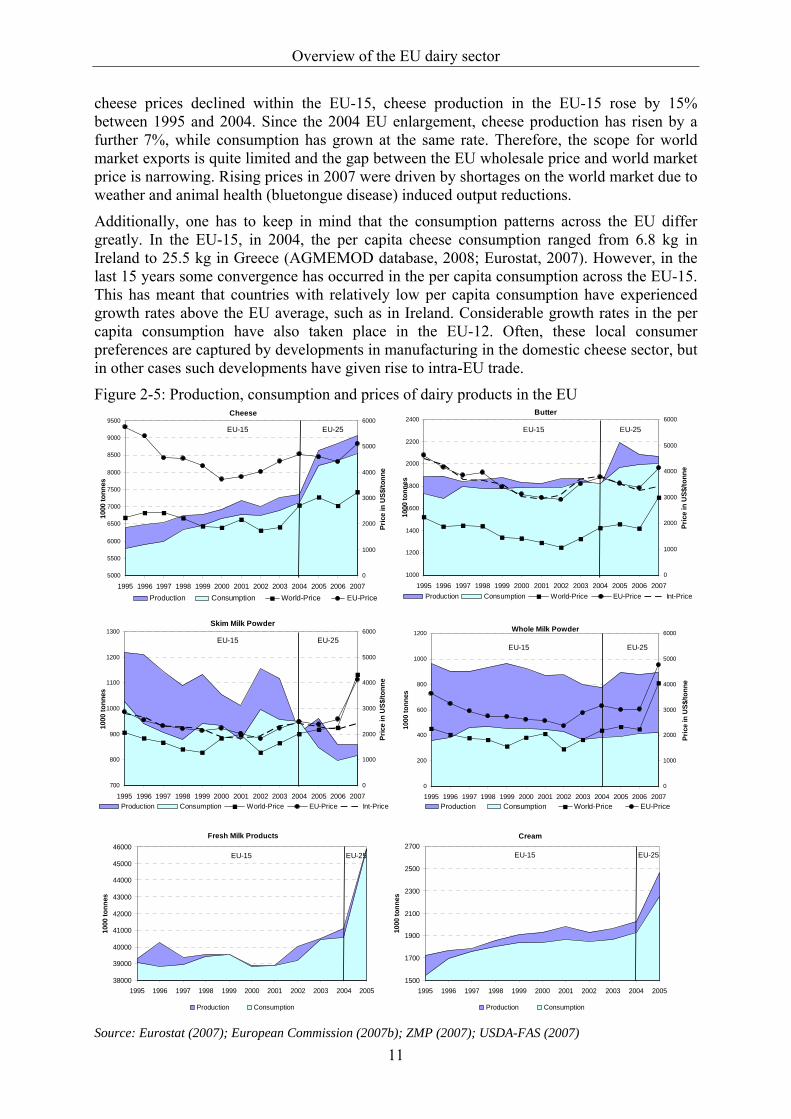
In the cheese sector, expansion was fuelled by a 23% increase in cheese demand over the regarded period, driven by relatively low prices and changing consumer eating habits. Although cheese demand itself was strong, cuts in intervention prices, as well as limitations on sales into intervention, induced price declines to lower levels. However, the drop in cheese prices was not as pronounced as for the prices of the intervention products. Thus, even though
Overview of the EU dairy sector
11
cheese prices declined within the EU-15, cheese production in the EU-15 rose by 15% between 1995 and 2004. Since the 2004 EU enlargement, cheese production has risen by a further 7%, while consumption has grown at the same rate. Therefore, the scope for world market exports is quite limited and the gap between the EU wholesale price and world market price is narrowing. Rising prices in 2007 were driven by shortages on the world market due to weather and animal health (bluetongue disease) induced output reductions.
Additionally, one has to keep in mind that the consumption patterns across the EU differ greatly. In the EU-15, in 2004, the per capita cheese consumption ranged from 6.8 kg in Ireland to 25.5 kg in Greece (AGMEMOD database, 2008; Eurostat, 2007). However, in the last 15 years some convergence has occurred in the per capita consumption across the EU-15. This has meant that countries with relatively low per capita consumption have experienced growth rates above the EU average, such as in Ireland. Considerable growth rates in the per capita consumption have also taken place in the EU-12. Often, these local consumer preferences are captured by developments in manufacturing in the domestic cheese sector, but in other cases such developments have given rise to intra-EU trade.
Figure 2-5: Production, consumption and prices of dairy products in the EU Cheese
5000
5500
6000
6500
7000
7500
8000
8500
9000
9500
1995 1996 1997 1998 1999 2000 2001 2002 2003 2004 2005 2006 2007
1000
tonn
es
0
1000
2000
3000
4000
5000
6000
Pric
e in
US$
/tonn
e
Production Consumption World-Price EU-Price
EU-15 EU-25
Butter
1000
1200
1400
1600
1800
2000
2200
2400
1995 1996 1997 1998 1999 2000 2001 2002 2003 2004 2005 2006 2007
1000
tonn
es
0
1000
2000
3000
4000
5000
6000
Pric
e in
US$
/tonn
e
Production Consumption World-Price EU-Price Int-Price
EU-15 EU-25
Skim Milk Powder
700
800
900
1000
1100
1200
1300
1995 1996 1997 1998 1999 2000 2001 2002 2003 2004 2005 2006 2007
1000
tonn
es
0
1000
2000
3000
4000
5000
6000
Pric
e in
US$
/tonn
e
Production Consumption World-Price EU-Price Int-Price
EU-25EU-15
Whole Milk Powder
0
200
400
600
800
1000
1200
1995 1996 1997 1998 1999 2000 2001 2002 2003 2004 2005 2006 2007
1000
tonn
es
0
1000
2000
3000
4000
5000
6000
Pric
e in
US$
/tonn
e
Production Consumption World-Price EU-Price
EU-15 EU-25
Fresh Milk Products
38000
39000
40000
41000
42000
43000
44000
45000
46000
1995 1996 1997 1998 1999 2000 2001 2002 2003 2004 2005
1000
tonn
es
Production Consumption
EU-15 EU-25
Cream
1500
1700
1900
2100
2300
2500
2700
1995 1996 1997 1998 1999 2000 2001 2002 2003 2004 2005
1000
tonn
es
Production Consumption
EU-15 EU-25
Source: Eurostat (2007); European Commission (2007b); ZMP (2007); USDA-FAS (2007)
Overview of the EU dairy sector
12
The increase in cheese production has reduced the amount of protein available for the manufacturing of SMP within the EU. Additionally, lowered processing aid as well as reduced intervention prices, and a declining calf population contributed to a fall in production of more than 25% between 1995 and 2004. Although domestic demand was sluggish at the same time, the more pronounced reduction in manufacturing narrowed the scope for net-exports. For a short time, the EU became a net importer of SMP, but the accession of the Central and Eastern European countries into the EU in 2004 increased SMP net-exports once more. Since then, the SMP production level has fallen another 11% and consumption has dropped a further 3%. At the same time, due to the limited supply on the world and EU market, the domestic SMP price in the EU rose by 65%, while the world market price rose by 115%. Thus, the EU SMP market price moved upward from the EU intervention price (Int-Price in Figure 2-5) level, even though the intervention price was cut in the period after the 2004 EU enlargement. In 2007 rising world market prices reduced the gap between both prices till the world market price finally topped the EU price (see Figure 2-5). But one has to keep in mind, that there are variations in SMP quality (food versus feed) as well as in transaction costs. As a consequence there have been higher variations in the production of SMP in some MS.
Quite similar, but less pronounced, was the development of the EU WMP market, however, this market is driven to a greater extent by the world market situation and export refunds. Within the EU-15 the domestic consumption of WMP increased by 9% in the period from 1995 to 2004, while the production level dropped by almost 20%. The fall in production was induced by a steady decline in world market prices of about -13% until 2002. However, WMP market prices within the EU fell only by 4%, as the net export potential was slightly lowered and a greater portion of total production was absorbed on the EU market. Again the 2004 EU enlargement increased the surplus of WMP in the EU-25. Production of WMP has increases by 15% since 2004, while consumption rose by just 8% over the same period. As with other dairy products, WMP prices have also increased sharply in recent years: from 2004 the WMP market price in the EU has risen by 35%, whereas the world market price has jumped by 85%, thus, partly closing the gap between EU internal WMP prices and world WMP prices. In contrast to most other dairy products, manufacturing of WMP is largely concentrated in just a number of MS, with the highest levels of production occurring in France, Germany, and the Netherlands. Significant amounts are also produced in Denmark, the United Kingdom, Belgium/Luxembourg, and Poland, while in other MS production is quite small.
In the period between 1995 and 2004, the situation on the butter market in the EU-15 could be described as rather flat due to the cuts in the intervention prices. The production level dropped slightly by 4% and consumption increased at approximately 5% during this period, leaving nearly no room for export growth. In the same period the market price fell by 10%. The accession of the EU-12 led to an increase in production, consumption and net exports in absolute terms, but since then production levels in the EU-25 have dropped by 5%. In the EU-25, consumption of butter increased only by 1% between 2004 and 2007. Since the 2004 enlargement, right through to the present, the EU butter price was affected by the global dairy market situation, just as with all other dairy products. The price in the EU for butter rose by 9% compared to 2004, while the international price increased by more than 64%.
Butter is a commodity which is produced in nearly all MS. France and Germany are the biggest producers within the EU, but both countries are net importers of butter. The biggest net exporter in the EU is Ireland, followed by Belgium/Luxembourg and some Scandinavian countries. Spain and Portugal also produce a butter surplus, partly attributable to the low level of domestic consumption. Consumption varies considerably between MS. For example, in 2004 the per capita consumption of butter ranged between 0.8 kg in Greece and 7.9 kg in
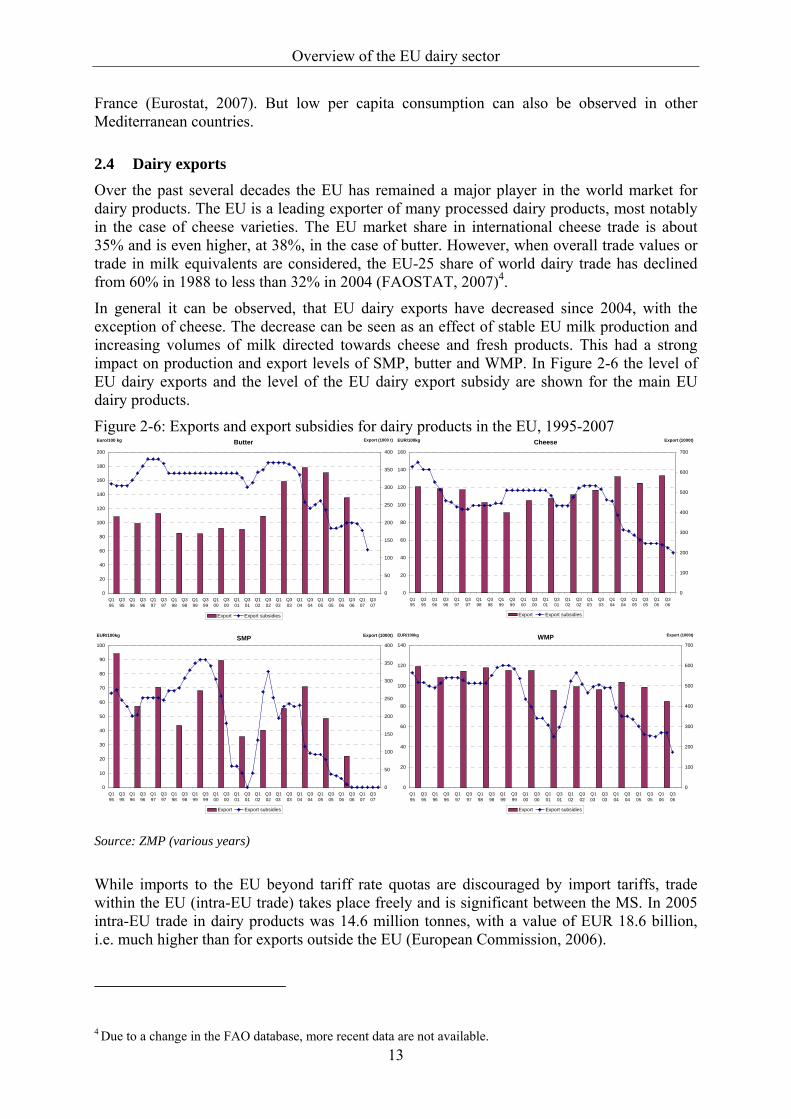
Overview of the EU dairy sector
13
France (Eurostat, 2007). But low per capita consumption can also be observed in other Mediterranean countries.
2.4 Dairy exports Over the past several decades the EU has remained a major player in the world market for dairy products. The EU is a leading exporter of many processed dairy products, most notably in the case of cheese varieties. The EU market share in international cheese trade is about 35% and is even higher, at 38%, in the case of butter. However, when overall trade values or trade in milk equivalents are considered, the EU-25 share of world dairy trade has declined from 60% in 1988 to less than 32% in 2004 (FAOSTAT, 2007)4.
In general it can be observed, that EU dairy exports have decreased since 2004, with the exception of cheese. The decrease can be seen as an effect of stable EU milk production and increasing volumes of milk directed towards cheese and fresh products. This had a strong impact on production and export levels of SMP, butter and WMP. In Figure 2-6 the level of EU dairy exports and the level of the EU dairy export subsidy are shown for the main EU dairy products.
Figure 2-6: Exports and export subsidies for dairy products in the EU, 1995-2007 Butter
0
20
40
60
80
100
120
140
160
180
200
Q195
Q395
Q196
Q396
Q197
Q397
Q198
Q398
Q199
Q399
Q100
Q300
Q101
Q301
Q102
Q302
Q103
Q303
Q104
Q304
Q105
Q305
Q106
Q306
Q107
Q307
Euro/100 kg
0
50
100
150
200
250
300
350
400
Export (1000 t)
Export Export subsidies
Cheese
0
20
40
60
80
100
120
140
160
Q195
Q395
Q196
Q396
Q197
Q397
Q198
Q398
Q199
Q399
Q100
Q300
Q101
Q301
Q102
Q302
Q103
Q303
Q104
Q304
Q105
Q305
Q106
Q306
EUR/100kg
0
100
200
300
400
500
600
700
Export (1000t)
Export Export subsidies SMP
0
10
20
30
40
50
60
70
80
90
100
Q195
Q395
Q196
Q396
Q197
Q397
Q198
Q398
Q199
Q399
Q100
Q300
Q101
Q301
Q102
Q302
Q103
Q303
Q104
Q304
Q105
Q305
Q106
Q306
Q107
Q307
EUR/100kg
0
50
100
150
200
250
300
350
400
Export (1000t)
Export Export subsidies
WMP
0
20
40
60
80
100
120
140
Q195
Q395
Q196
Q396
Q197
Q397
Q198
Q398
Q199
Q399
Q100
Q300
Q101
Q301
Q102
Q302
Q103
Q303
Q104
Q304
Q105
Q305
Q106
Q306
EUR/100kg
0
100
200
300
400
500
600
700
Export (1000t)
Export Export subsidies
Source: ZMP (various years)
While imports to the EU beyond tariff rate quotas are discouraged by import tariffs, trade within the EU (intra-EU trade) takes place freely and is significant between the MS. In 2005 intra-EU trade in dairy products was 14.6 million tonnes, with a value of EUR 18.6 billion, i.e. much higher than for exports outside the EU (European Commission, 2006).
4 Due to a change in the FAO database, more recent data are not available.
14
3 Development of the EU dairy policy Developments in the dairy sector have to be seen in the context of the evolving nature of dairy policy and trade policy. Although Agenda 2000 and more particularly the MTR have brought about a considerable decline in the support to the dairy sector, existing CAP instruments such as milk quotas, super levies, intervention prices, processing aids, export subsidies and import tariffs still affect the supply and demand for milk and milk products. In order to give an overview on the development of the EU dairy policy, section 3.1 outlines the domestic support measures with a special focus on the EU milk quota system. Trade measures are delineated in section 3.2 and an outlook on expected developments of the EU dairy policy is given in section 3.3.
3.1 Domestic support measures EU milk production increased steadily in the 1970s and 1980s due to the price support policy within the Common Market Organisation (CMO) in Milk and Milk Products. By the late 1970s milk production outstripped overall milk consumption and lead to rapidly rising expenditures for the stocking of butter and SMP. In order to limit public expenditure on the sector, to control milk production, and to stabilise milk prices and the agricultural income of milk producers, EU MS agreed to impose milk quotas by the milk marketing year 1984/85. The quota was made effective by the imposition of a fine (superlevy) for milk output exceeding a guaranteed quantity (reference quantity or quota).
Originally scheduled for just five years, steps were then taken to extend the milk quota system until 1992. The Reform of the CAP in 1992 (MacSharry Reform) led to a further prolongation of the quota system until 2000, at which point, as part of Agenda 2000, the system was further extended until 2008. Finally with the MTR, MS approved in 2003, another extension of the quota regime until 2015. The extension under the MTR is notable since, in contrast to previous situations, MS must actively advocate a prolongation of the quota regime beyond 2015, otherwise it will lapse and milk quotas will cease to present a restriction on production.
The milk quota year starts on 1 April and ends on 31 March the following year. If national quantities are exceeded, a levy will be charged to milk producers for the excess of deliveries. Originally fixed as a percentage of the target price, super levy rates are now specified for each respective quota year. Processors collect the levy from individual producers who have over-delivered, but only, if the national reference quantity is exceeded. Under-deliveries by producers not meeting their individual quota may be subtracted proportionally. Currently the fat content is fixed for individual reference quantities at the 2003-04 quota year. If the individual’s actual milk fat content exceeds its fat reference level, the amount of milk delivered will be multiplied by 0.18% per 0.1g milk fat/kg in excess of the reference fat level or reduced if the fat is less than the reference level (the so called butterfat adjusted volume).
Since the milk quota regime was introduced, it has become a scarce production factor limiting, on the one hand, production and the scope for EU exports, but on the other hand stabilising the producer prices of raw milk. The quota regime allows milk prices to rise above the equilibrium price level of an unregulated market, where prices would otherwise equate with the marginal cost of production. In this way, quota rents are generated. As long as quota rents are positive and the quota quantities are filled, the quota regime is binding. Other things being equal, technical progress in dairy production would lower production costs and lead to an increase in the quota rents over time. On the other hand, declining levels of support or increases in the milk quota may reduce market milk prices, while inflation in production cost items, such as feed grains, may increase costs and hence rents may decrease over time. When
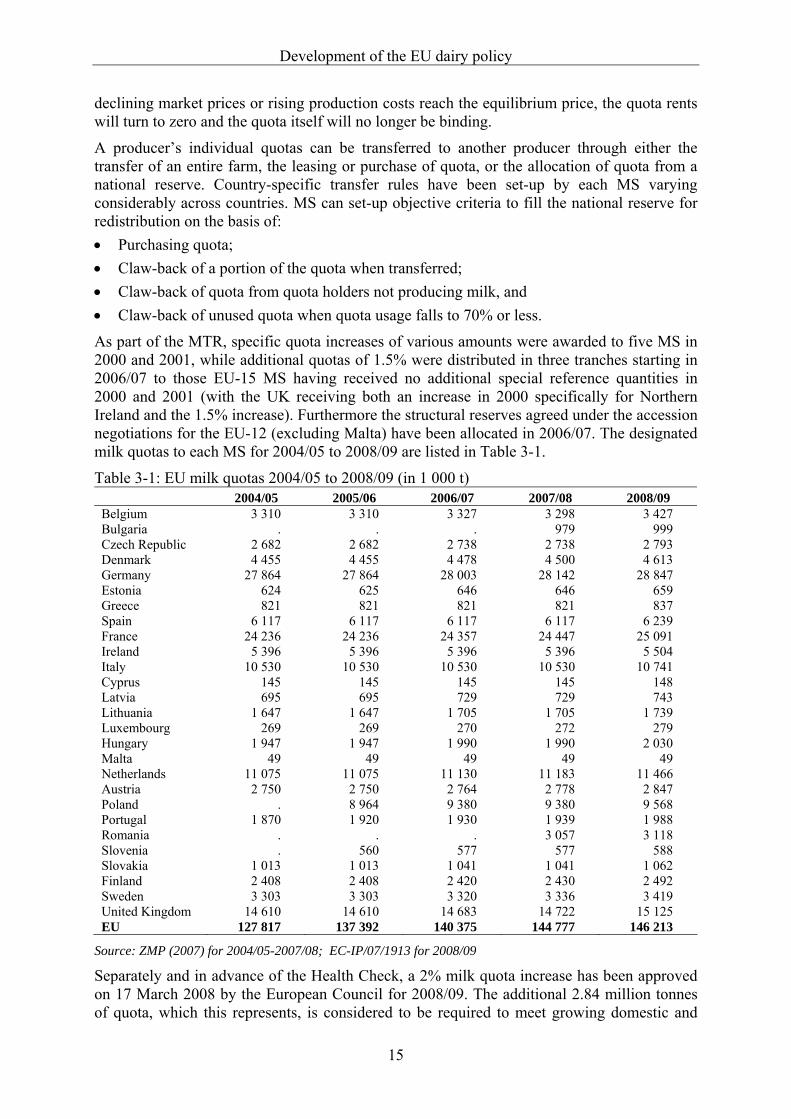
Development of the EU dairy policy
15
declining market prices or rising production costs reach the equilibrium price, the quota rents will turn to zero and the quota itself will no longer be binding.
A producer’s individual quotas can be transferred to another producer through either the transfer of an entire farm, the leasing or purchase of quota, or the allocation of quota from a national reserve. Country-specific transfer rules have been set-up by each MS varying considerably across countries. MS can set-up objective criteria to fill the national reserve for redistribution on the basis of: • Purchasing quota; • Claw-back of a portion of the quota when transferred; • Claw-back of quota from quota holders not producing milk, and • Claw-back of unused quota when quota usage falls to 70% or less.
As part of the MTR, specific quota increases of various amounts were awarded to five MS in 2000 and 2001, while additional quotas of 1.5% were distributed in three tranches starting in 2006/07 to those EU-15 MS having received no additional special reference quantities in 2000 and 2001 (with the UK receiving both an increase in 2000 specifically for Northern Ireland and the 1.5% increase). Furthermore the structural reserves agreed under the accession negotiations for the EU-12 (excluding Malta) have been allocated in 2006/07. The designated milk quotas to each MS for 2004/05 to 2008/09 are listed in Table 3-1.
Table 3-1: EU milk quotas 2004/05 to 2008/09 (in 1 000 t) 2004/05 2005/06 2006/07 2007/08 2008/09 Belgium 3 310 3 310 3 327 3 298 3 427 Bulgaria . . . 979 999 Czech Republic 2 682 2 682 2 738 2 738 2 793 Denmark 4 455 4 455 4 478 4 500 4 613 Germany 27 864 27 864 28 003 28 142 28 847 Estonia 624 625 646 646 659 Greece 821 821 821 821 837 Spain 6 117 6 117 6 117 6 117 6 239 France 24 236 24 236 24 357 24 447 25 091 Ireland 5 396 5 396 5 396 5 396 5 504 Italy 10 530 10 530 10 530 10 530 10 741 Cyprus 145 145 145 145 148 Latvia 695 695 729 729 743 Lithuania 1 647 1 647 1 705 1 705 1 739 Luxembourg 269 269 270 272 279 Hungary 1 947 1 947 1 990 1 990 2 030 Malta 49 49 49 49 49 Netherlands 11 075 11 075 11 130 11 183 11 466 Austria 2 750 2 750 2 764 2 778 2 847 Poland . 8 964 9 380 9 380 9 568 Portugal 1 870 1 920 1 930 1 939 1 988 Romania . . . 3 057 3 118 Slovenia . 560 577 577 588 Slovakia 1 013 1 013 1 041 1 041 1 062 Finland 2 408 2 408 2 420 2 430 2 492 Sweden 3 303 3 303 3 320 3 336 3 419 United Kingdom 14 610 14 610 14 683 14 722 15 125 EU 127 817 137 392 140 375 144 777 146 213
Source: ZMP (2007) for 2004/05-2007/08; EC-IP/07/1913 for 2008/09
Separately and in advance of the Health Check, a 2% milk quota increase has been approved on 17 March 2008 by the European Council for 2008/09. The additional 2.84 million tonnes of quota, which this represents, is considered to be required to meet growing domestic and
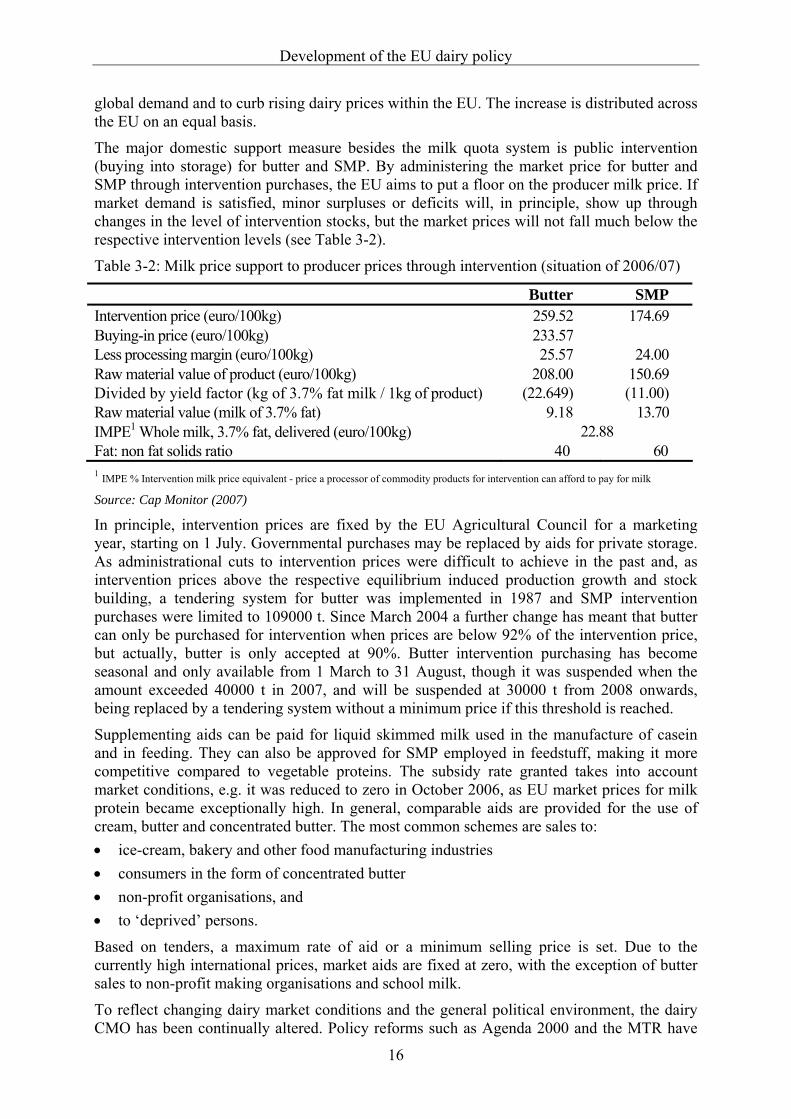
Development of the EU dairy policy
16
global demand and to curb rising dairy prices within the EU. The increase is distributed across the EU on an equal basis.
The major domestic support measure besides the milk quota system is public intervention (buying into storage) for butter and SMP. By administering the market price for butter and SMP through intervention purchases, the EU aims to put a floor on the producer milk price. If market demand is satisfied, minor surpluses or deficits will, in principle, show up through changes in the level of intervention stocks, but the market prices will not fall much below the respective intervention levels (see Table 3-2).
Table 3-2: Milk price support to producer prices through intervention (situation of 2006/07)
Butter SMP Intervention price (euro/100kg) 259.52 174.69 Buying-in price (euro/100kg) 233.57 Less processing margin (euro/100kg) 25.57 24.00 Raw material value of product (euro/100kg) 208.00 150.69 Divided by yield factor (kg of 3.7% fat milk / 1kg of product) (22.649) (11.00) Raw material value (milk of 3.7% fat) 9.18 13.70 IMPE1 Whole milk, 3.7% fat, delivered (euro/100kg) 22.88 Fat: non fat solids ratio 40 60 1 IMPE % Intervention milk price equivalent - price a processor of commodity products for intervention can afford to pay for milk
Source: Cap Monitor (2007)
In principle, intervention prices are fixed by the EU Agricultural Council for a marketing year, starting on 1 July. Governmental purchases may be replaced by aids for private storage. As administrational cuts to intervention prices were difficult to achieve in the past and, as intervention prices above the respective equilibrium induced production growth and stock building, a tendering system for butter was implemented in 1987 and SMP intervention purchases were limited to 109000 t. Since March 2004 a further change has meant that butter can only be purchased for intervention when prices are below 92% of the intervention price, but actually, butter is only accepted at 90%. Butter intervention purchasing has become seasonal and only available from 1 March to 31 August, though it was suspended when the amount exceeded 40000 t in 2007, and will be suspended at 30000 t from 2008 onwards, being replaced by a tendering system without a minimum price if this threshold is reached.
Supplementing aids can be paid for liquid skimmed milk used in the manufacture of casein and in feeding. They can also be approved for SMP employed in feedstuff, making it more competitive compared to vegetable proteins. The subsidy rate granted takes into account market conditions, e.g. it was reduced to zero in October 2006, as EU market prices for milk protein became exceptionally high. In general, comparable aids are provided for the use of cream, butter and concentrated butter. The most common schemes are sales to: • ice-cream, bakery and other food manufacturing industries • consumers in the form of concentrated butter • non-profit organisations, and • to ‘deprived’ persons.
Based on tenders, a maximum rate of aid or a minimum selling price is set. Due to the currently high international prices, market aids are fixed at zero, with the exception of butter sales to non-profit making organisations and school milk.
To reflect changing dairy market conditions and the general political environment, the dairy CMO has been continually altered. Policy reforms such as Agenda 2000 and the MTR have
Development of the EU dairy policy
17
brought about a considerable decline in the market price support for the dairy sector. By way of partly compensating for cuts in intervention prices, direct payments (the so-called dairy premium) were introduced in 2005, which were subsequently incorporated into the Single Payment Scheme (SPS).
The dairy premium introduced as an additional compensation, amounting to 24.49 EUR/t from 2006, can be supplemented by an increasing national top-up to a maximum of 11.01 EUR/t. In the EU-15, the dairy premium had to be integrated in the SPS by 2007 at the latest. The EU-12 may only gradually introduce the direct payments starting with 25% of the full payment level in the first year of introduction and ending with 100% in 2013. However, they are allowed to provide national top-ups of 30%, which will have to be successively reduced to zero. Regarding the implementation, most of the MS of the EU-12 opted to use the SAPS reflecting flat area payments. But this regime, according to the pre-Health-Check regulations, will have to be replaced by a regionalised SPS, at the latest, by the end of 2010.
Some further simplifications concerning the general market organisation have been introduced in 2007 in the so called 'mini milk package', dealing with the standardisation of the protein content in preserved milk (together with a reduction of the intervention price for SMP), simplifications to the Council Regulation (EC) 1255/1999 (e.g. elimination of aids for private storage, removal of the butter intervention trigger mechanism) and liberalisation of the drinking milk market by allowing marketing of milk with fat contents outside of the current three categories.
3.2 Trade measures Historically dairy prices within the EU were higher than those internationally and usually more stable than those on the world market. Surplus EU dairy production generally was exported in considerable volumes to lower price third country markets with the aid of export subsidies.
Dairy products are generally consumed in the market in which they are produced and the extent of international trade in dairy products is limited, representing just 7% of global dairy production in milk equivalent terms. Up to the year 2003, EU dairy production and exports had a major influence on the world price in the relatively small world market for dairy commodities. Since then, rapidly growing international demand and a slow down in production growth in other key export countries, have somewhat altered this picture. In particular since 2005, slower growth in exports and rising demand for imports on world markets have led to an undersupply of dairy products on international markets and hence to rising international dairy commodity prices.
One of the consequences of the current shortage of dairy products on international markets has been that the negative effects of the MTR support price reductions have been more than counterbalanced, and so EU producer milk prices have increased, rather than decreased, since 2007. Much of the EU’s dairy support measures, like processing aids and export refunds, have been suspended completely in 2007.
When considering trade measures, one has to keep in mind that the EU forms a Single Market, hence, all border measures are removed between the MS. However import tariffs are imposed on third country imports and are bound by the WTO Uruguay Agreement. In the dairy sector, specific tariffs or combinations of ad valorem and specific tariffs are applied in most cases, although many trading partners of the EU benefit from special import arrangements, whereby imports can come in at lower tariffs. These import arrangements are known as Tariff Rate Quotas (TRQ) and while some TRQ are specific to particular exporting countries, others are open to all countries under the most-favoured nations (MFN) treatment of the WTO. Selected key tariffs of the MFN treatment are listed in Table 3-3. There are some
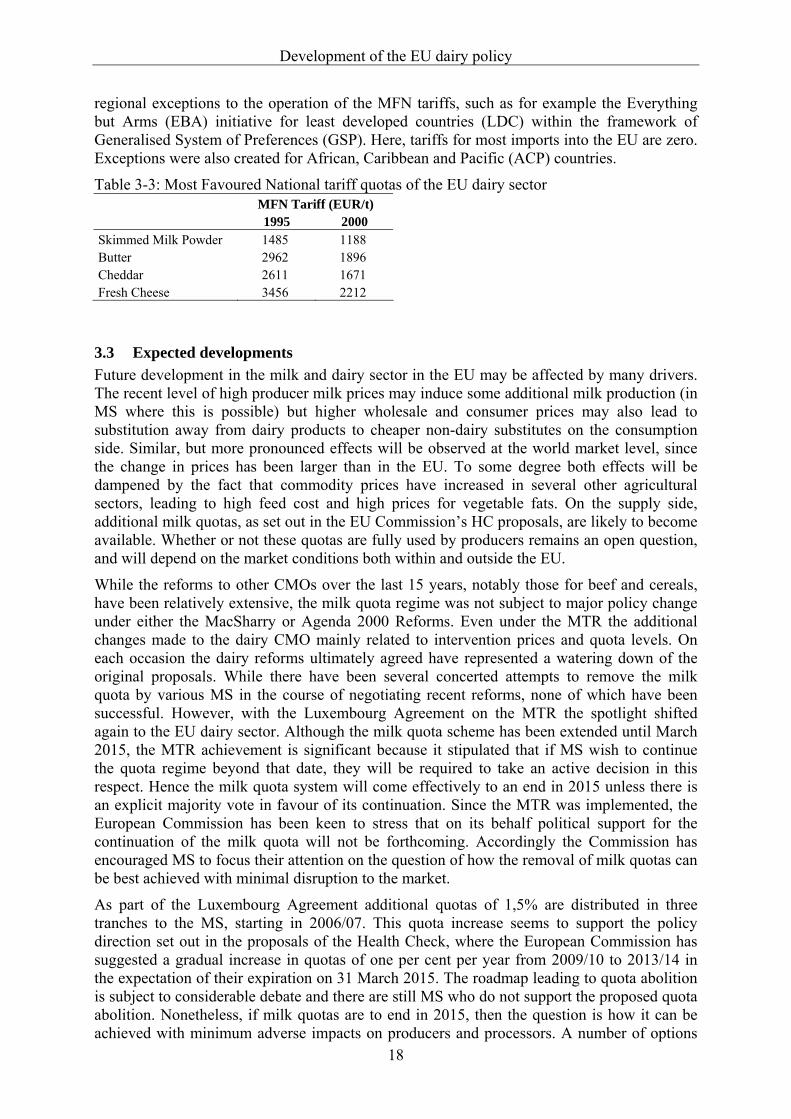
Development of the EU dairy policy
18
regional exceptions to the operation of the MFN tariffs, such as for example the Everything but Arms (EBA) initiative for least developed countries (LDC) within the framework of Generalised System of Preferences (GSP). Here, tariffs for most imports into the EU are zero. Exceptions were also created for African, Caribbean and Pacific (ACP) countries.
Table 3-3: Most Favoured National tariff quotas of the EU dairy sector MFN Tariff (EUR/t) 1995 2000 Skimmed Milk Powder 1485 1188 Butter 2962 1896 Cheddar 2611 1671 Fresh Cheese 3456 2212
3.3 Expected developments Future development in the milk and dairy sector in the EU may be affected by many drivers. The recent level of high producer milk prices may induce some additional milk production (in MS where this is possible) but higher wholesale and consumer prices may also lead to substitution away from dairy products to cheaper non-dairy substitutes on the consumption side. Similar, but more pronounced effects will be observed at the world market level, since the change in prices has been larger than in the EU. To some degree both effects will be dampened by the fact that commodity prices have increased in several other agricultural sectors, leading to high feed cost and high prices for vegetable fats. On the supply side, additional milk quotas, as set out in the EU Commission’s HC proposals, are likely to become available. Whether or not these quotas are fully used by producers remains an open question, and will depend on the market conditions both within and outside the EU.
While the reforms to other CMOs over the last 15 years, notably those for beef and cereals, have been relatively extensive, the milk quota regime was not subject to major policy change under either the MacSharry or Agenda 2000 Reforms. Even under the MTR the additional changes made to the dairy CMO mainly related to intervention prices and quota levels. On each occasion the dairy reforms ultimately agreed have represented a watering down of the original proposals. While there have been several concerted attempts to remove the milk quota by various MS in the course of negotiating recent reforms, none of which have been successful. However, with the Luxembourg Agreement on the MTR the spotlight shifted again to the EU dairy sector. Although the milk quota scheme has been extended until March 2015, the MTR achievement is significant because it stipulated that if MS wish to continue the quota regime beyond that date, they will be required to take an active decision in this respect. Hence the milk quota system will come effectively to an end in 2015 unless there is an explicit majority vote in favour of its continuation. Since the MTR was implemented, the European Commission has been keen to stress that on its behalf political support for the continuation of the milk quota will not be forthcoming. Accordingly the Commission has encouraged MS to focus their attention on the question of how the removal of milk quotas can be best achieved with minimal disruption to the market.
As part of the Luxembourg Agreement additional quotas of 1,5% are distributed in three tranches to the MS, starting in 2006/07. This quota increase seems to support the policy direction set out in the proposals of the Health Check, where the European Commission has suggested a gradual increase in quotas of one per cent per year from 2009/10 to 2013/14 in the expectation of their expiration on 31 March 2015. The roadmap leading to quota abolition is subject to considerable debate and there are still MS who do not support the proposed quota abolition. Nonetheless, if milk quotas are to end in 2015, then the question is how it can be achieved with minimum adverse impacts on producers and processors. A number of options
Development of the EU dairy policy
19
exist. The most likely means of reform will be a gradual quota expansion as suggested in the Health Check proposals, which may be accompanied by other measures such as a further reform of the intervention system. These are seen as the most reliable means towards achieving the so called soft-landing for the dairy sector post quota. Other options are seen as less attractive for a variety of reasons. For example, overnight elimination could involve rapid change and would not allow producers and processors sufficient time to adjust. Quota trading between MS might face legal impediments. A reduction in the rate of superlevy would impact to the greatest extent on the most efficient producers in that they would be penalised less due to their efficiency, while less efficient producers (with lower quota rents) would not benefit.
The rapid change in international dairy supply and demand over 2006 and 2007 brought about an unanticipated sharp rise in prices on world and EU markets. Some of the factors associated with this price increase were temporary in nature, such as reduced level of production in Australia and the EU due to unfavourable weather conditions. However, other factors, in particular, economic growth in regions of the world with a deficit in milk production, are not temporary. Accordingly, global production is likely to grow at a lower rate than global consumption. These factors suggest that the trend for international dairy prices over the next decade will be at a level considerably above that achieved over the previous 10 years. This sudden up swing in market prices has placed even more focus on the EU milk quota system as it is increasingly seen as a constraint on expansion opportunities rather than a mechanism to support farm incomes.
The interruption to the global growth in supplies of dairy products to the world markets should recede and dairy product production should return to more normal growth rates, over the next year or two. With the high price environment of 2007, an expansion in milk quota would not bring about additional expenses to the EU budget. Since, in theory, it would bring about lower prices, quota expansion would benefit consumers. Furthermore it is argued that quota expansion would allow export opportunities to be exploited by the EU. These opportunities are currently being lost due to the decline in EU self-sufficiency (however still positive) in dairy products.
Quota expansion is also expected to ease the transition to a no quota environment by allowing processors and producers adjust their output (upward or downward) in a relatively planned fashion and prevent large sudden changes in prices.
Additionally, since it would reduce the gap between EU and world prices, quota expansion would allow the EU dairy sector to more easily absorb the impact of trade liberalisation under a future WTO agreement. Even though the ongoing WTO Doha Development Agenda (DDA) negotiations have not yet reached an agreement, it is possible that a conclusion will have been reached by 2015 when the EU milk quota regime is slated to expire. Such a WTO agreement will likely comprise: • reductions in the ‘Aggregate Measure of Support’(AMS); • elimination of export subsidies; • increased market access through large reductions in import tariffs, with the possibility of
smaller reductions, but increased Tariff Rate Quotas, if any dairy products are declared as being sensitive.
A possible WTO agreement on market access and sensitive products will be challenging, so a focal point for the EU is the existing conditional EU offer of elimination of export refunds. These refunds are regularly adjusted to reflect world and EU market conditions e.g. in 2007, due to high international prices, their value has been set to zero. However, a recovery of milk production in the southern hemisphere, as well as growth elsewhere can create pressure on the world market prices and at some point there can be a need for re-establishing refunds. Under
Development of the EU dairy policy
20
such circumstances, a total and irrevocable elimination of export subsidies in the case of dairy products (as a consequence of a WTO agreement) may generate additional producer price pressures within the EU and its MS. Also, it may lead to declining quota rents and eventually to non-binding quotas in most MS, which, for practical purposes, would cause an earlier phasing-out of the quota regime.
Taking all the outlined developments into account, it seems that an end of the EU milk quota system is inevitable and the manner in which the phasing-out will be managed becomes a central issue. The necessary policy changes should aim to minimise market instability arising from the ending of the milk quota regime. As already pointed out, the simplification of the CMO for milk and dairy products and the changing economic environment are expected to have strong impacts not only on the milk and dairy market. Against the background of a dynamic economic environment and an ever changing CAP, the ex-ante policy implications for the EU agricultural markets need to be analysed.
21
4 Methodology of the quantitative approach This chapter outlines the methodology of the quantitative approach used for the analysis. To achieve the objectives of this study, the AGMEMOD modelling tool has been extended and upgraded to cater for the needs of a detailed dairy policy reform analysis. A brief introduction to the AGMEMOD model is given in section 4.1. Section 4.2 delineates how the milk policy is implemented in the new version of the model and section 4.3 describes the data sources.
4.1 AGMEMOD model AGMEMOD is an econometric, dynamic, partial equilibrium, multi-country, multi-market model. Based on a set of commodity specific model templates, country specific models were developed in order to reflect the details of EU agriculture at MS level and at the same time allow for their combination in an EU model. The close adherence to templates assures the analytical consistency across the country models, which is essential for the aggregation towards an EU level and in addition also facilitates the comparison of the impact of a policy change across different MS.
AGMEMOD model Version 1.0 has already been used to conduct limited policy assessments for the dairy sector (Salamon, 2006; Salamon et al., 2006). In this analysis AGMEMOD model Version 2.0 has been applied. Version 2.0 is an EU combined model that comprises the EU-27 Member States5 and the computerized tool for solving this model can be characterised by:
- transparent and harmonised input–model–output structure; - consistent use of mnemonics, data and assumptions across countries; - memory efficient use of variables; - ease of extension to new commodities; - ease of extension to new countries.
Each MS model within the AGMEMOD model Version 2.0 captures the detailed sub-model for the milk and dairy product market. Milk quotas are implemented in the model at the MS level and other policy instruments such as direct payments, intervention supports and trade policies are also considered. The AGMEMOD dairy sub-model is amended in order to simulate the dairy market development over the quota expansion and quota-free periods. New features of the enhanced model in Version 2.0:
- the interaction of the EU dairy market and the world market: world prices are endogenized for cheese and SMP;
- the milk and dairy product sectors are revised and changed, and the milk supply function is extended to represent the dairy sector with and without a milk quota regime.
In section 4.2 the new milk production function implemented is described. A description of the AGMEMOD model Version 2.0 model structure is available in Annexe C and Annexe B explains the data mnemonics used in the model.
5 Cyprus and Malta have not been included.
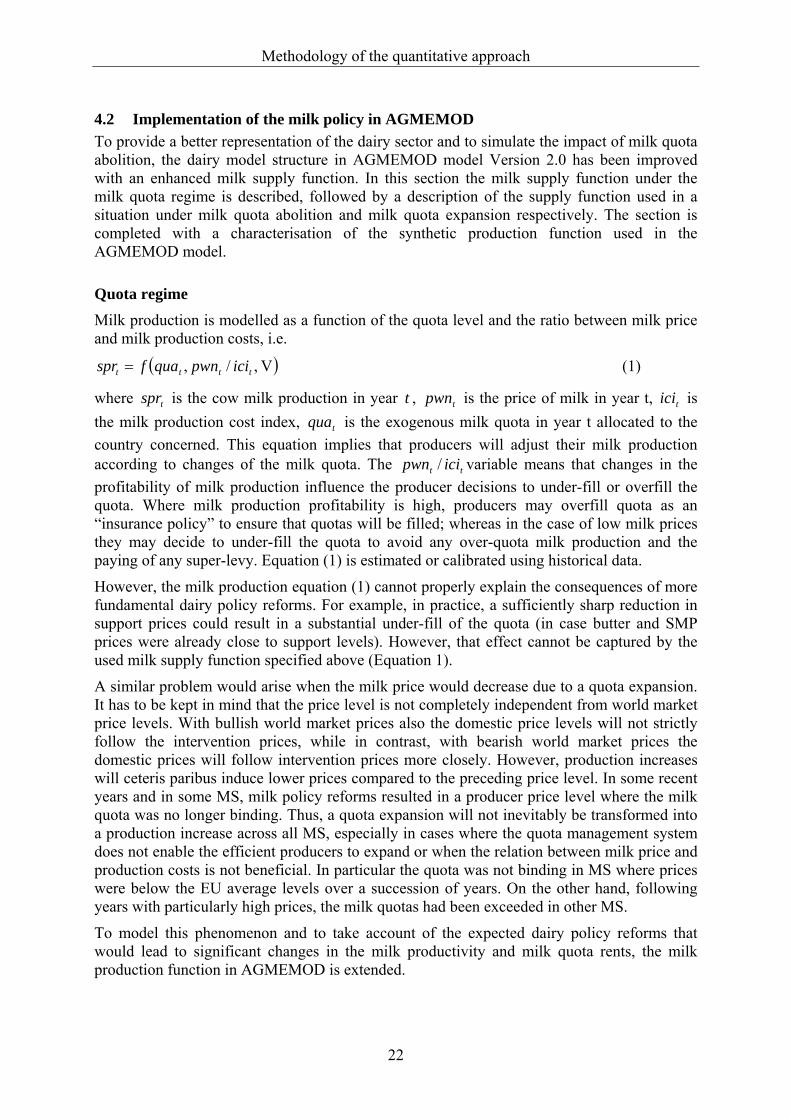
Methodology of the quantitative approach
22
4.2 Implementation of the milk policy in AGMEMOD To provide a better representation of the dairy sector and to simulate the impact of milk quota abolition, the dairy model structure in AGMEMOD model Version 2.0 has been improved with an enhanced milk supply function. In this section the milk supply function under the milk quota regime is described, followed by a description of the supply function used in a situation under milk quota abolition and milk quota expansion respectively. The section is completed with a characterisation of the synthetic production function used in the AGMEMOD model.
Quota regime Milk production is modelled as a function of the quota level and the ratio between milk price and milk production costs, i.e.
( )V ,/, tttt icipwnquafspr = (1)
where tspr is the cow milk production in year t , tpwn is the price of milk in year t, tici is the milk production cost index, tqua is the exogenous milk quota in year t allocated to the country concerned. This equation implies that producers will adjust their milk production according to changes of the milk quota. The tt icipwn / variable means that changes in the profitability of milk production influence the producer decisions to under-fill or overfill the quota. Where milk production profitability is high, producers may overfill quota as an “insurance policy” to ensure that quotas will be filled; whereas in the case of low milk prices they may decide to under-fill the quota to avoid any over-quota milk production and the paying of any super-levy. Equation (1) is estimated or calibrated using historical data.
However, the milk production equation (1) cannot properly explain the consequences of more fundamental dairy policy reforms. For example, in practice, a sufficiently sharp reduction in support prices could result in a substantial under-fill of the quota (in case butter and SMP prices were already close to support levels). However, that effect cannot be captured by the used milk supply function specified above (Equation 1).
A similar problem would arise when the milk price would decrease due to a quota expansion. It has to be kept in mind that the price level is not completely independent from world market price levels. With bullish world market prices also the domestic price levels will not strictly follow the intervention prices, while in contrast, with bearish world market prices the domestic prices will follow intervention prices more closely. However, production increases will ceteris paribus induce lower prices compared to the preceding price level. In some recent years and in some MS, milk policy reforms resulted in a producer price level where the milk quota was no longer binding. Thus, a quota expansion will not inevitably be transformed into a production increase across all MS, especially in cases where the quota management system does not enable the efficient producers to expand or when the relation between milk price and production costs is not beneficial. In particular the quota was not binding in MS where prices were below the EU average levels over a succession of years. On the other hand, following years with particularly high prices, the milk quotas had been exceeded in other MS.
To model this phenomenon and to take account of the expected dairy policy reforms that would lead to significant changes in the milk productivity and milk quota rents, the milk production function in AGMEMOD is extended.
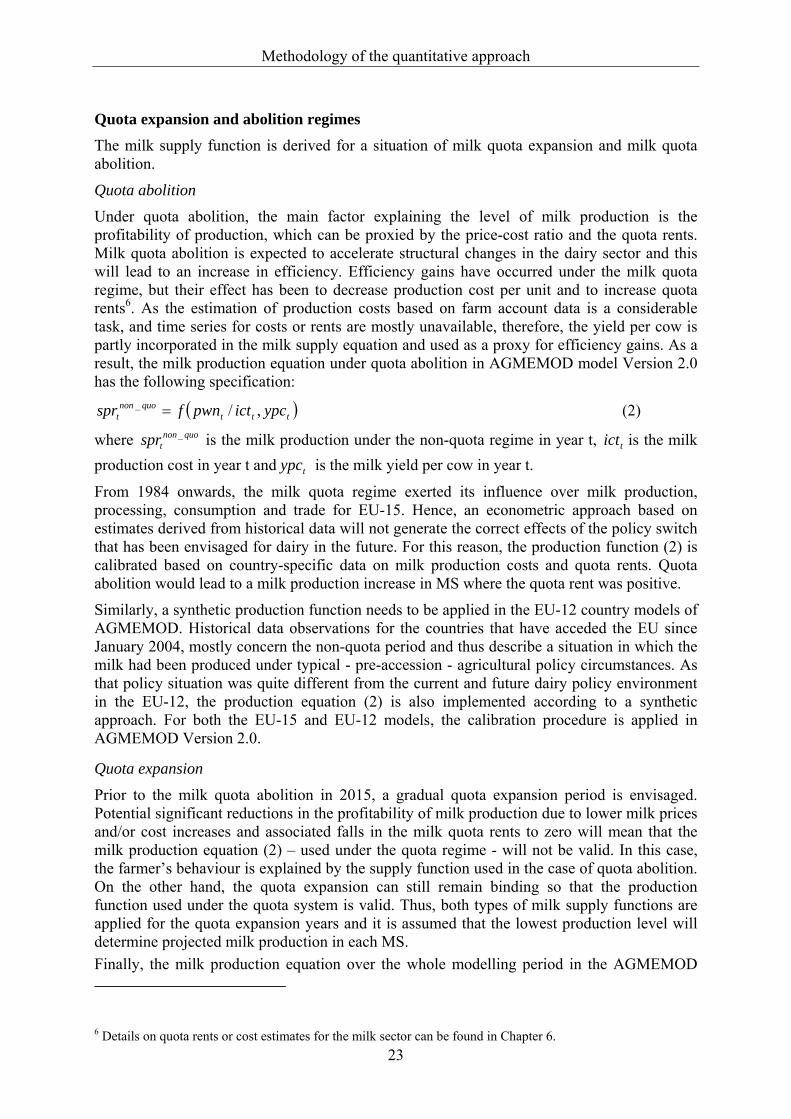
Methodology of the quantitative approach
23
Quota expansion and abolition regimes The milk supply function is derived for a situation of milk quota expansion and milk quota abolition.
Quota abolition
Under quota abolition, the main factor explaining the level of milk production is the profitability of production, which can be proxied by the price-cost ratio and the quota rents. Milk quota abolition is expected to accelerate structural changes in the dairy sector and this will lead to an increase in efficiency. Efficiency gains have occurred under the milk quota regime, but their effect has been to decrease production cost per unit and to increase quota rents6. As the estimation of production costs based on farm account data is a considerable task, and time series for costs or rents are mostly unavailable, therefore, the yield per cow is partly incorporated in the milk supply equation and used as a proxy for efficiency gains. As a result, the milk production equation under quota abolition in AGMEMOD model Version 2.0 has the following specification:
( )tttquonon
t ypcictpwnfspr ,/_ = (2)
where quonontspr _ is the milk production under the non-quota regime in year t, tict is the milk
production cost in year t and typc is the milk yield per cow in year t.
From 1984 onwards, the milk quota regime exerted its influence over milk production, processing, consumption and trade for EU-15. Hence, an econometric approach based on estimates derived from historical data will not generate the correct effects of the policy switch that has been envisaged for dairy in the future. For this reason, the production function (2) is calibrated based on country-specific data on milk production costs and quota rents. Quota abolition would lead to a milk production increase in MS where the quota rent was positive.
Similarly, a synthetic production function needs to be applied in the EU-12 country models of AGMEMOD. Historical data observations for the countries that have acceded the EU since January 2004, mostly concern the non-quota period and thus describe a situation in which the milk had been produced under typical - pre-accession - agricultural policy circumstances. As that policy situation was quite different from the current and future dairy policy environment in the EU-12, the production equation (2) is also implemented according to a synthetic approach. For both the EU-15 and EU-12 models, the calibration procedure is applied in AGMEMOD Version 2.0.
Quota expansion
Prior to the milk quota abolition in 2015, a gradual quota expansion period is envisaged. Potential significant reductions in the profitability of milk production due to lower milk prices and/or cost increases and associated falls in the milk quota rents to zero will mean that the milk production equation (2) – used under the quota regime - will not be valid. In this case, the farmer’s behaviour is explained by the supply function used in the case of quota abolition. On the other hand, the quota expansion can still remain binding so that the production function used under the quota system is valid. Thus, both types of milk supply functions are applied for the quota expansion years and it is assumed that the lowest production level will determine projected milk production in each MS. Finally, the milk production equation over the whole modelling period in the AGMEMOD
6 Details on quota rents or cost estimates for the milk sector can be found in Chapter 6.
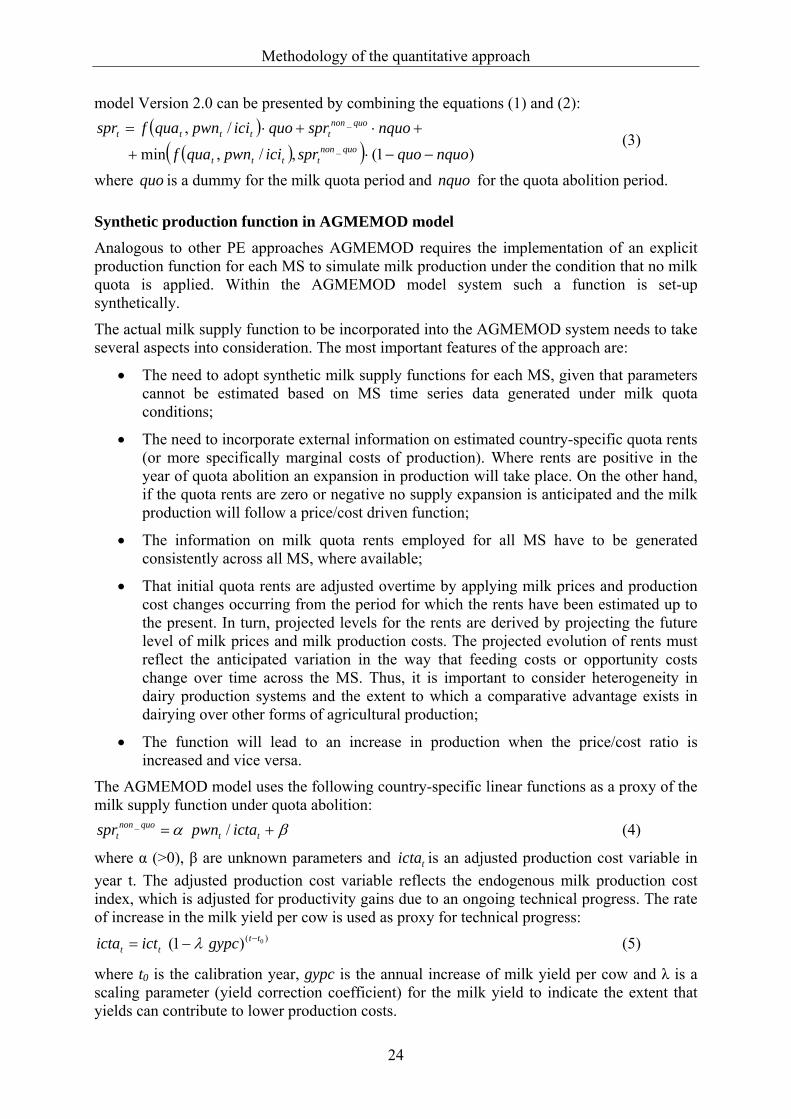
Methodology of the quantitative approach
24
model Version 2.0 can be presented by combining the equations (1) and (2): ( )
( )( ) )1(,/,min
/,_
_
nquoquospricipwnquaf
nquosprquoicipwnquafsprquonon
tttt
quononttttt
−−⋅+
+⋅+⋅= (3)
where quo is a dummy for the milk quota period and nquo for the quota abolition period.
Synthetic production function in AGMEMOD model Analogous to other PE approaches AGMEMOD requires the implementation of an explicit production function for each MS to simulate milk production under the condition that no milk quota is applied. Within the AGMEMOD model system such a function is set-up synthetically.
The actual milk supply function to be incorporated into the AGMEMOD system needs to take several aspects into consideration. The most important features of the approach are:
• The need to adopt synthetic milk supply functions for each MS, given that parameters cannot be estimated based on MS time series data generated under milk quota conditions;
• The need to incorporate external information on estimated country-specific quota rents (or more specifically marginal costs of production). Where rents are positive in the year of quota abolition an expansion in production will take place. On the other hand, if the quota rents are zero or negative no supply expansion is anticipated and the milk production will follow a price/cost driven function;
• The information on milk quota rents employed for all MS have to be generated consistently across all MS, where available;
• That initial quota rents are adjusted overtime by applying milk prices and production cost changes occurring from the period for which the rents have been estimated up to the present. In turn, projected levels for the rents are derived by projecting the future level of milk prices and milk production costs. The projected evolution of rents must reflect the anticipated variation in the way that feeding costs or opportunity costs change over time across the MS. Thus, it is important to consider heterogeneity in dairy production systems and the extent to which a comparative advantage exists in dairying over other forms of agricultural production;
• The function will lead to an increase in production when the price/cost ratio is increased and vice versa.
The AGMEMOD model uses the following country-specific linear functions as a proxy of the milk supply function under quota abolition:
βα += ttquonon
t ictapwnspr /_ (4)
where α (>0), β are unknown parameters and ticta is an adjusted production cost variable in year t. The adjusted production cost variable reflects the endogenous milk production cost index, which is adjusted for productivity gains due to an ongoing technical progress. The rate of increase in the milk yield per cow is used as proxy for technical progress:
)( 0)1( tttt gypcicticta −−= λ (5)
where t0 is the calibration year, gypc is the annual increase of milk yield per cow and λ is a scaling parameter (yield correction coefficient) for the milk yield to indicate the extent that yields can contribute to lower production costs.
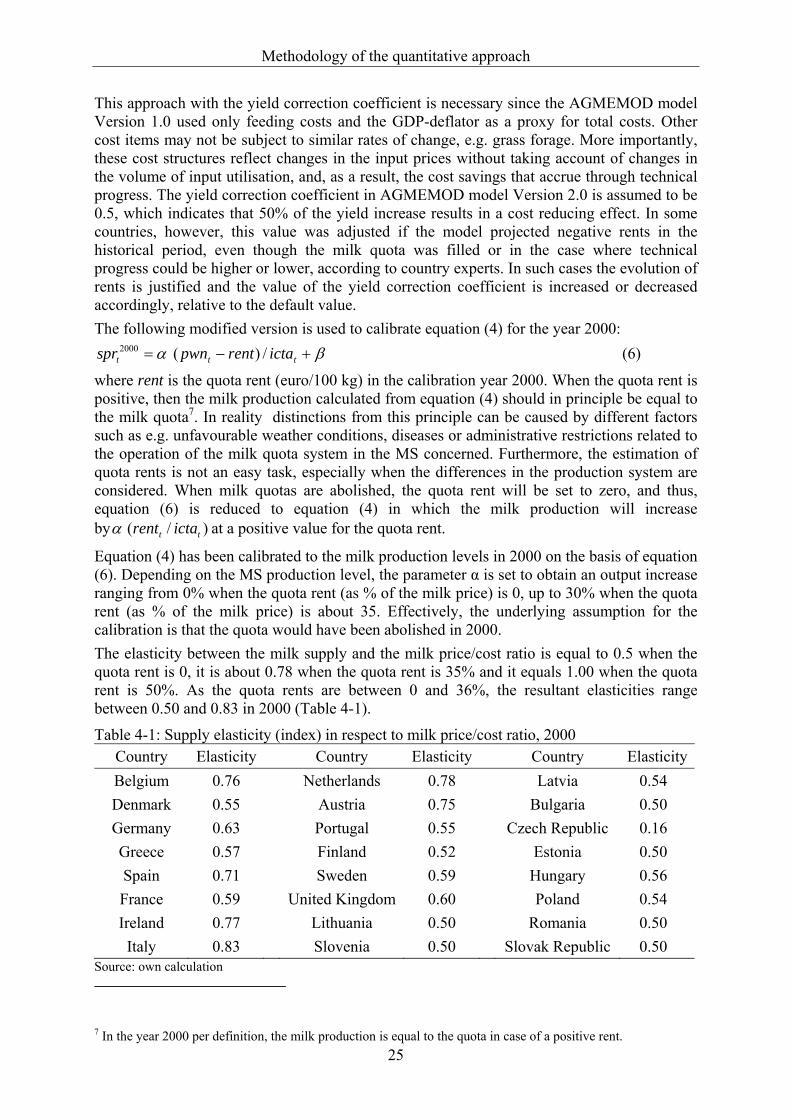
Methodology of the quantitative approach
25
This approach with the yield correction coefficient is necessary since the AGMEMOD model Version 1.0 used only feeding costs and the GDP-deflator as a proxy for total costs. Other cost items may not be subject to similar rates of change, e.g. grass forage. More importantly, these cost structures reflect changes in the input prices without taking account of changes in the volume of input utilisation, and, as a result, the cost savings that accrue through technical progress. The yield correction coefficient in AGMEMOD model Version 2.0 is assumed to be 0.5, which indicates that 50% of the yield increase results in a cost reducing effect. In some countries, however, this value was adjusted if the model projected negative rents in the historical period, even though the milk quota was filled or in the case where technical progress could be higher or lower, according to country experts. In such cases the evolution of rents is justified and the value of the yield correction coefficient is increased or decreased accordingly, relative to the default value. The following modified version is used to calibrate equation (4) for the year 2000:
βα +−= ttt ictarentpwnspr /)(2000 (6)
where rent is the quota rent (euro/100 kg) in the calibration year 2000. When the quota rent is positive, then the milk production calculated from equation (4) should in principle be equal to the milk quota7. In reality distinctions from this principle can be caused by different factors such as e.g. unfavourable weather conditions, diseases or administrative restrictions related to the operation of the milk quota system in the MS concerned. Furthermore, the estimation of quota rents is not an easy task, especially when the differences in the production system are considered. When milk quotas are abolished, the quota rent will be set to zero, and thus, equation (6) is reduced to equation (4) in which the milk production will increase by )/( tt ictarentα at a positive value for the quota rent.
Equation (4) has been calibrated to the milk production levels in 2000 on the basis of equation (6). Depending on the MS production level, the parameter α is set to obtain an output increase ranging from 0% when the quota rent (as % of the milk price) is 0, up to 30% when the quota rent (as % of the milk price) is about 35. Effectively, the underlying assumption for the calibration is that the quota would have been abolished in 2000. The elasticity between the milk supply and the milk price/cost ratio is equal to 0.5 when the quota rent is 0, it is about 0.78 when the quota rent is 35% and it equals 1.00 when the quota rent is 50%. As the quota rents are between 0 and 36%, the resultant elasticities range between 0.50 and 0.83 in 2000 (Table 4-1).
Table 4-1: Supply elasticity (index) in respect to milk price/cost ratio, 2000 Country Elasticity Country Elasticity Country ElasticityBelgium 0.76 Netherlands 0.78 Latvia 0.54 Denmark 0.55 Austria 0.75 Bulgaria 0.50 Germany 0.63 Portugal 0.55 Czech Republic 0.16 Greece 0.57 Finland 0.52 Estonia 0.50 Spain 0.71 Sweden 0.59 Hungary 0.56 France 0.59 United Kingdom 0.60 Poland 0.54 Ireland 0.77 Lithuania 0.50 Romania 0.50 Italy 0.83 Slovenia 0.50 Slovak Republic 0.50
Source: own calculation
7 In the year 2000 per definition, the milk production is equal to the quota in case of a positive rent.
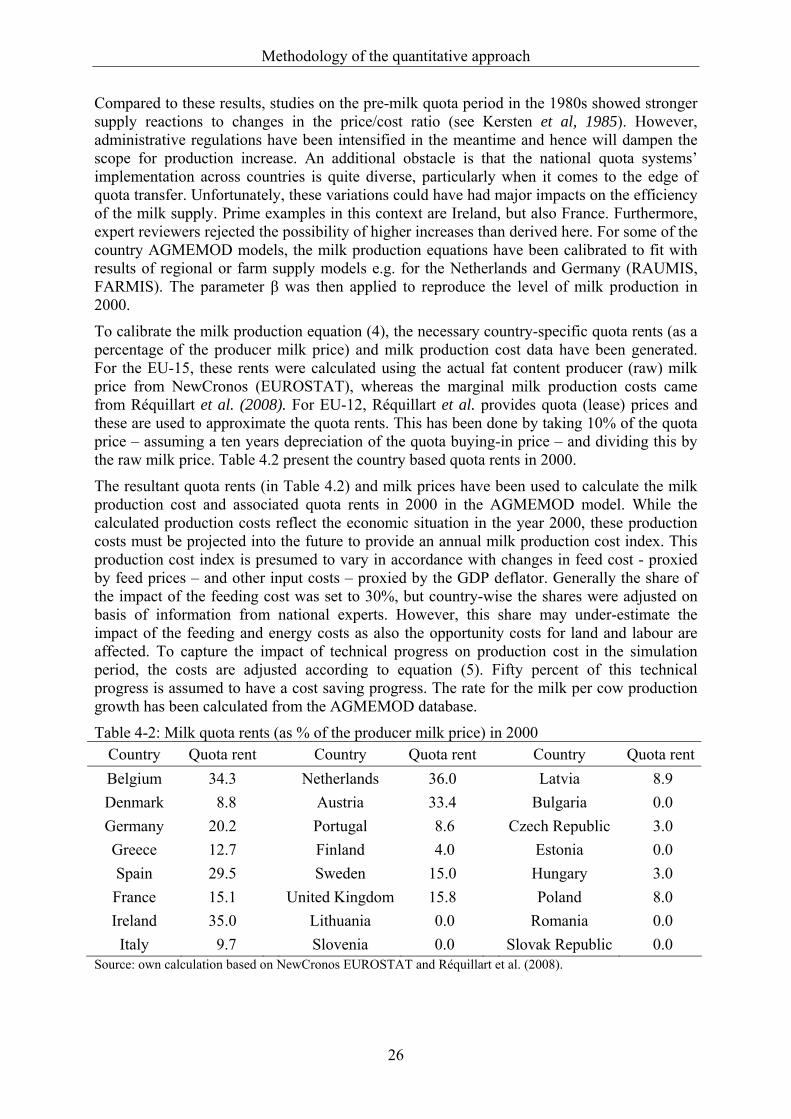
Methodology of the quantitative approach
26
Compared to these results, studies on the pre-milk quota period in the 1980s showed stronger supply reactions to changes in the price/cost ratio (see Kersten et al, 1985). However, administrative regulations have been intensified in the meantime and hence will dampen the scope for production increase. An additional obstacle is that the national quota systems’ implementation across countries is quite diverse, particularly when it comes to the edge of quota transfer. Unfortunately, these variations could have had major impacts on the efficiency of the milk supply. Prime examples in this context are Ireland, but also France. Furthermore, expert reviewers rejected the possibility of higher increases than derived here. For some of the country AGMEMOD models, the milk production equations have been calibrated to fit with results of regional or farm supply models e.g. for the Netherlands and Germany (RAUMIS, FARMIS). The parameter β was then applied to reproduce the level of milk production in 2000.
To calibrate the milk production equation (4), the necessary country-specific quota rents (as a percentage of the producer milk price) and milk production cost data have been generated. For the EU-15, these rents were calculated using the actual fat content producer (raw) milk price from NewCronos (EUROSTAT), whereas the marginal milk production costs came from Réquillart et al. (2008). For EU-12, Réquillart et al. provides quota (lease) prices and these are used to approximate the quota rents. This has been done by taking 10% of the quota price – assuming a ten years depreciation of the quota buying-in price – and dividing this by the raw milk price. Table 4.2 present the country based quota rents in 2000.
The resultant quota rents (in Table 4.2) and milk prices have been used to calculate the milk production cost and associated quota rents in 2000 in the AGMEMOD model. While the calculated production costs reflect the economic situation in the year 2000, these production costs must be projected into the future to provide an annual milk production cost index. This production cost index is presumed to vary in accordance with changes in feed cost - proxied by feed prices – and other input costs – proxied by the GDP deflator. Generally the share of the impact of the feeding cost was set to 30%, but country-wise the shares were adjusted on basis of information from national experts. However, this share may under-estimate the impact of the feeding and energy costs as also the opportunity costs for land and labour are affected. To capture the impact of technical progress on production cost in the simulation period, the costs are adjusted according to equation (5). Fifty percent of this technical progress is assumed to have a cost saving progress. The rate for the milk per cow production growth has been calculated from the AGMEMOD database.
Table 4-2: Milk quota rents (as % of the producer milk price) in 2000 Country Quota rent Country Quota rent Country Quota rentBelgium 34.3 Netherlands 36.0 Latvia 8.9 Denmark 8.8 Austria 33.4 Bulgaria 0.0 Germany 20.2 Portugal 8.6 Czech Republic 3.0 Greece 12.7 Finland 4.0 Estonia 0.0 Spain 29.5 Sweden 15.0 Hungary 3.0 France 15.1 United Kingdom 15.8 Poland 8.0 Ireland 35.0 Lithuania 0.0 Romania 0.0 Italy 9.7 Slovenia 0.0 Slovak Republic 0.0
Source: own calculation based on NewCronos EUROSTAT and Réquillart et al. (2008).
Methodology of the quantitative approach
27
4.3 Data sources Each country model is based on an aligned database of annual time series of agricultural commodity supply as well as of market balance sheets and price data related to the respective commodities modelled. Originally, the sample covered a period from 1970 to 2000. In 2006 the data has been extended to the latest available year, which, depending on the country concerned, ranges from 2002 up to 2005.
Data for each country and the aggregates for the EU (Chantreuil and Levert, 2007) are to be found on the AGMEMOD website (http://www.agmemod.org). Based on these data a short overview of historical MS level dairy market developments is provided in Annexe E. Data constantly subject to being up-dated, will always be accommodated within the latest version of the combined model.
The AGMEMOD model database is composed in part of balance sheets for all commodities, generally detailing opening stocks, production, imports, human food consumption, feed use, processing and industrial use, exports, and ending stocks. Eurostat sources such as AgrIS (Agricultural Information System) and NewCronos are used wherever possible. In addition, these data are relevant and meaningful to end users, as they are widely used and referenced by policy makers and agricultural stakeholders. Ideally, all data would be drawn from the same database. In practice, however, databases may be incomplete or inconsistent or may show different numbers for the same variables in a given year or they may include definitions which are unclear. Gaps range from the absence of a data point in a series to the total absence of data for the series in one or more countries. Where there are such gaps, comparable data from other international sources like FAO or USDA, and in particular, national sources are derived. Failing these options, interpolations based on statistical techniques or expert judgements are used. Adjustments are made to ensure that for all commodity markets and for all years of the sample time period the market the supply and use balance holds. Due to the procedure applied, the different datasets, and more so the aggregates may differ from numbers published and used by other institutions.
Eurostat data, as well as data from other databases, are subject to frequent revisions. These revisions might not only affect the previous year’s observation but may also extend over longer period such as a decade. Thus, a limited number of the most relevant equations, e.g. milk production, yield, and key prices8 are re-estimated.
The results obtained by this econometrically estimated partial equilibrium model, relies on detailed historical policy data. A dataset capturing the evolution of CAP policy instruments in the period 1970 to 2004 contains data on variables such as direct payment instruments and support prices associated with the commodity market organisations that collectively make up the CAP. In first instance, this EU policy dataset is used for the estimation of the MS level models, but in particular it is required for the simulations.
Another key dataset in the model covers macroeconomic data which was required for the empirical estimation of the country model equations and for the simulations in the projection period. Historical data on macroeconomic variables like inflation, per capita economic growth, and currency exchange rates have been assembled. These macroeconomic variables as well as, in particular, their respective projections are described in more detail in the subsequent chapter.
8 For each modelled commodity a key price is defined as a commodity price at the most important commodity market in the EU.
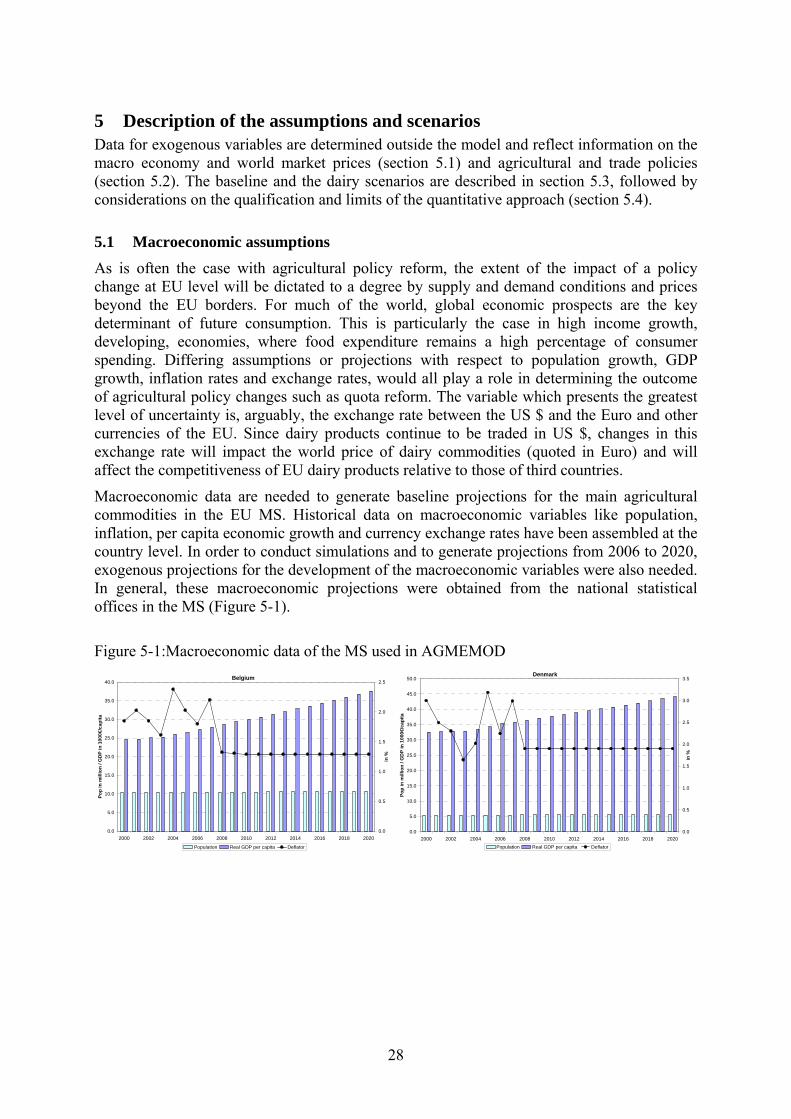
28
5 Description of the assumptions and scenarios Data for exogenous variables are determined outside the model and reflect information on the macro economy and world market prices (section 5.1) and agricultural and trade policies (section 5.2). The baseline and the dairy scenarios are described in section 5.3, followed by considerations on the qualification and limits of the quantitative approach (section 5.4).
5.1 Macroeconomic assumptions As is often the case with agricultural policy reform, the extent of the impact of a policy change at EU level will be dictated to a degree by supply and demand conditions and prices beyond the EU borders. For much of the world, global economic prospects are the key determinant of future consumption. This is particularly the case in high income growth, developing, economies, where food expenditure remains a high percentage of consumer spending. Differing assumptions or projections with respect to population growth, GDP growth, inflation rates and exchange rates, would all play a role in determining the outcome of agricultural policy changes such as quota reform. The variable which presents the greatest level of uncertainty is, arguably, the exchange rate between the US $ and the Euro and other currencies of the EU. Since dairy products continue to be traded in US $, changes in this exchange rate will impact the world price of dairy commodities (quoted in Euro) and will affect the competitiveness of EU dairy products relative to those of third countries.
Macroeconomic data are needed to generate baseline projections for the main agricultural commodities in the EU MS. Historical data on macroeconomic variables like population, inflation, per capita economic growth and currency exchange rates have been assembled at the country level. In order to conduct simulations and to generate projections from 2006 to 2020, exogenous projections for the development of the macroeconomic variables were also needed. In general, these macroeconomic projections were obtained from the national statistical offices in the MS (Figure 5-1).
Figure 5-1:Macroeconomic data of the MS used in AGMEMOD
Belgium
0.0
5.0
10.0
15.0
20.0
25.0
30.0
35.0
40.0
2000 2002 2004 2006 2008 2010 2012 2014 2016 2018 2020
Pop
in m
illio
n / G
DP
in 1
000€
/cap
ita
0.0
0.5
1.0
1.5
2.0
2.5
in %
Population Real GDP per capita Deflator
Denmark
0.0
5.0
10.0
15.0
20.0
25.0
30.0
35.0
40.0
45.0
50.0
2000 2002 2004 2006 2008 2010 2012 2014 2016 2018 2020
Pop
in m
illio
n / G
DP
in 1
000€
/cap
ita
0.0
0.5
1.0
1.5
2.0
2.5
3.0
3.5
in %
Population Real GDP per capita Deflator
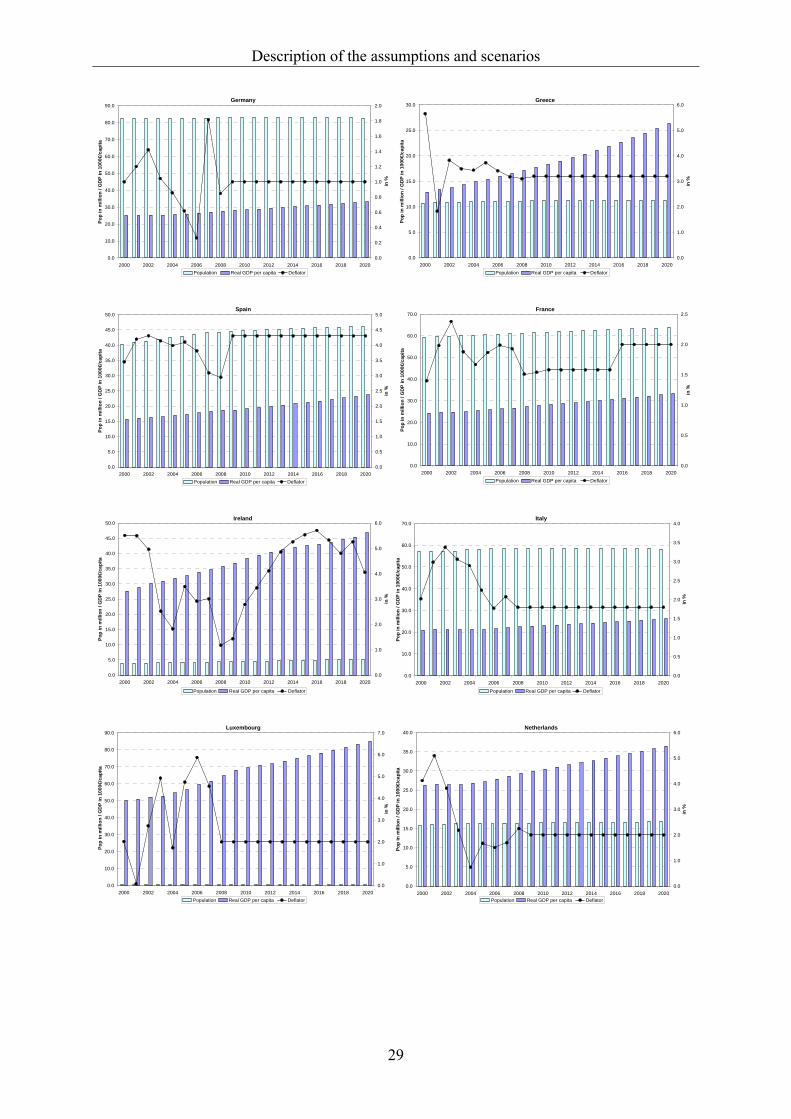
Description of the assumptions and scenarios
29
Germany
0.0
10.0
20.0
30.0
40.0
50.0
60.0
70.0
80.0
90.0
2000 2002 2004 2006 2008 2010 2012 2014 2016 2018 2020
Pop
in m
illio
n / G
DP
in 1
000€
/cap
ita
0.0
0.2
0.4
0.6
0.8
1.0
1.2
1.4
1.6
1.8
2.0
in %
Population Real GDP per capita Deflator
Greece
0.0
5.0
10.0
15.0
20.0
25.0
30.0
2000 2002 2004 2006 2008 2010 2012 2014 2016 2018 2020
Pop
in m
illio
n / G
DP
in 1
000€
/cap
ita
0.0
1.0
2.0
3.0
4.0
5.0
6.0
in %
Population Real GDP per capita Deflator
Spain
0.0
5.0
10.0
15.0
20.0
25.0
30.0
35.0
40.0
45.0
50.0
2000 2002 2004 2006 2008 2010 2012 2014 2016 2018 2020
Pop
in m
illio
n / G
DP
in 1
000€
/cap
ita
0.0
0.5
1.0
1.5
2.0
2.5
3.0
3.5
4.0
4.5
5.0
in %
Population Real GDP per capita Deflator
France
0.0
10.0
20.0
30.0
40.0
50.0
60.0
70.0
2000 2002 2004 2006 2008 2010 2012 2014 2016 2018 2020
Pop
in m
illio
n / G
DP
in 1
000€
/cap
ita
0.0
0.5
1.0
1.5
2.0
2.5
in %
Population Real GDP per capita Deflator
Ireland
0.0
5.0
10.0
15.0
20.0
25.0
30.0
35.0
40.0
45.0
50.0
2000 2002 2004 2006 2008 2010 2012 2014 2016 2018 2020
Pop
in m
illio
n / G
DP
in 1
000€
/cap
ita
0.0
1.0
2.0
3.0
4.0
5.0
6.0
in %
Population Real GDP per capita Deflator
Italy
0.0
10.0
20.0
30.0
40.0
50.0
60.0
70.0
2000 2002 2004 2006 2008 2010 2012 2014 2016 2018 2020
Pop
in m
illio
n / G
DP
in 1
000€
/cap
ita
0.0
0.5
1.0
1.5
2.0
2.5
3.0
3.5
4.0
in %
Population Real GDP per capita Deflator
Luxembourg
0.0
10.0
20.0
30.0
40.0
50.0
60.0
70.0
80.0
90.0
2000 2002 2004 2006 2008 2010 2012 2014 2016 2018 2020
Pop
in m
illio
n / G
DP
in 1
000€
/cap
ita
0.0
1.0
2.0
3.0
4.0
5.0
6.0
7.0
in %
Population Real GDP per capita Deflator
Netherlands
0.0
5.0
10.0
15.0
20.0
25.0
30.0
35.0
40.0
2000 2002 2004 2006 2008 2010 2012 2014 2016 2018 2020
Pop
in m
illio
n / G
DP
in 1
000€
/cap
ita
0.0
1.0
2.0
3.0
4.0
5.0
6.0
in %
Population Real GDP per capita Deflator
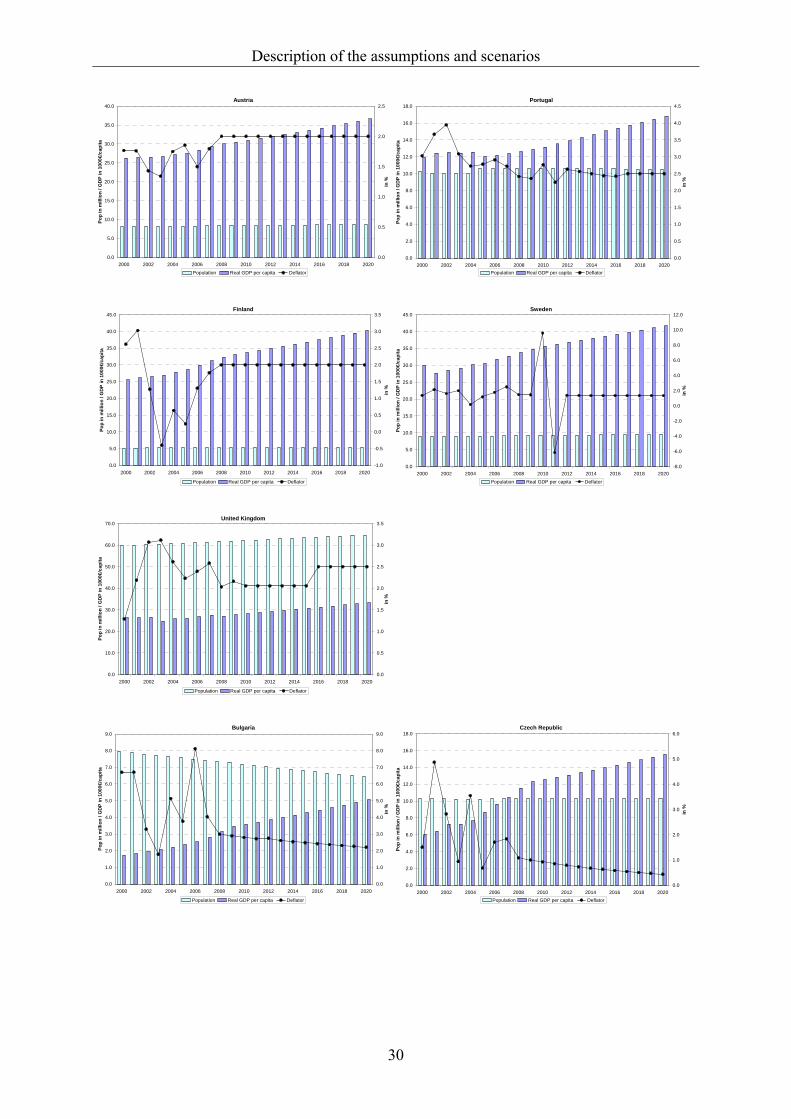
Description of the assumptions and scenarios
30
Austria
0.0
5.0
10.0
15.0
20.0
25.0
30.0
35.0
40.0
2000 2002 2004 2006 2008 2010 2012 2014 2016 2018 2020
Pop
in m
illio
n / G
DP
in 1
000€
/cap
ita
0.0
0.5
1.0
1.5
2.0
2.5
in %
Population Real GDP per capita Deflator
Portugal
0.0
2.0
4.0
6.0
8.0
10.0
12.0
14.0
16.0
18.0
2000 2002 2004 2006 2008 2010 2012 2014 2016 2018 2020
Pop
in m
illio
n / G
DP
in 1
000€
/cap
ita
0.0
0.5
1.0
1.5
2.0
2.5
3.0
3.5
4.0
4.5
in %
Population Real GDP per capita Deflator
Finland
0.0
5.0
10.0
15.0
20.0
25.0
30.0
35.0
40.0
45.0
2000 2002 2004 2006 2008 2010 2012 2014 2016 2018 2020
Pop
in m
illio
n / G
DP
in 1
000€
/cap
ita
-1.0
-0.5
0.0
0.5
1.0
1.5
2.0
2.5
3.0
3.5
in %
Population Real GDP per capita Deflator
Sweden
0.0
5.0
10.0
15.0
20.0
25.0
30.0
35.0
40.0
45.0
2000 2002 2004 2006 2008 2010 2012 2014 2016 2018 2020
Pop
in m
illio
n / G
DP
in 1
000€
/cap
ita
-8.0
-6.0
-4.0
-2.0
0.0
2.0
4.0
6.0
8.0
10.0
12.0
in %
Population Real GDP per capita Deflator
United Kingdom
0.0
10.0
20.0
30.0
40.0
50.0
60.0
70.0
2000 2002 2004 2006 2008 2010 2012 2014 2016 2018 2020
Pop
in m
illio
n / G
DP
in 1
000€
/cap
ita
0.0
0.5
1.0
1.5
2.0
2.5
3.0
3.5
in %
Population Real GDP per capita Deflator
Bulgaria
0.0
1.0
2.0
3.0
4.0
5.0
6.0
7.0
8.0
9.0
2000 2002 2004 2006 2008 2010 2012 2014 2016 2018 2020
Pop
in m
illio
n / G
DP
in 1
000€
/cap
ita
0.0
1.0
2.0
3.0
4.0
5.0
6.0
7.0
8.0
9.0
in %
Population Real GDP per capita Deflator
Czech Republic
0.0
2.0
4.0
6.0
8.0
10.0
12.0
14.0
16.0
18.0
2000 2002 2004 2006 2008 2010 2012 2014 2016 2018 2020
Pop
in m
illio
n / G
DP
in 1
000€
/cap
ita
0.0
1.0
2.0
3.0
4.0
5.0
6.0
in %
Population Real GDP per capita Deflator
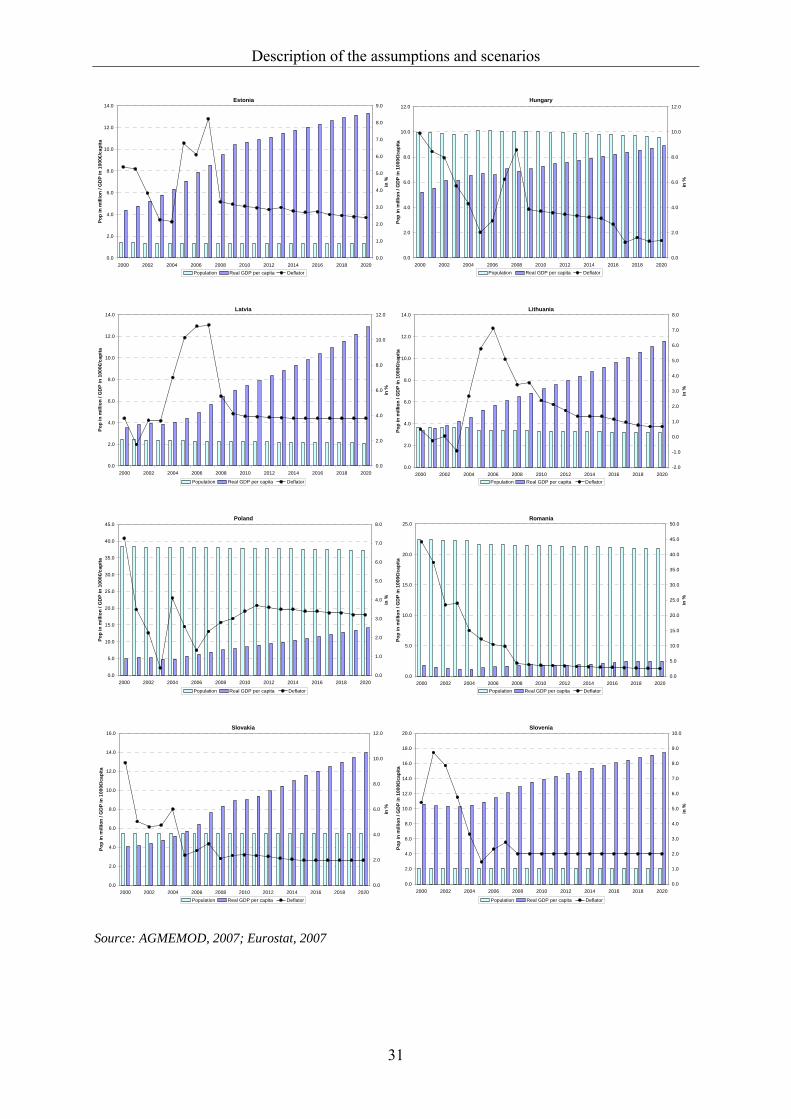
Description of the assumptions and scenarios
31
Estonia
0.0
2.0
4.0
6.0
8.0
10.0
12.0
14.0
2000 2002 2004 2006 2008 2010 2012 2014 2016 2018 2020
Pop
in m
illio
n / G
DP
in 1
000€
/cap
ita
0.0
1.0
2.0
3.0
4.0
5.0
6.0
7.0
8.0
9.0
in %
Population Real GDP per capita Deflator
Hungary
0.0
2.0
4.0
6.0
8.0
10.0
12.0
2000 2002 2004 2006 2008 2010 2012 2014 2016 2018 2020
Pop
in m
illio
n / G
DP
in 1
000€
/cap
ita
0.0
2.0
4.0
6.0
8.0
10.0
12.0
in %
Population Real GDP per capita Deflator
Latvia
0.0
2.0
4.0
6.0
8.0
10.0
12.0
14.0
2000 2002 2004 2006 2008 2010 2012 2014 2016 2018 2020
Pop
in m
illio
n / G
DP
in 1
000€
/cap
ita
0.0
2.0
4.0
6.0
8.0
10.0
12.0
in %
Population Real GDP per capita Deflator
Lithuania
0.0
2.0
4.0
6.0
8.0
10.0
12.0
14.0
2000 2002 2004 2006 2008 2010 2012 2014 2016 2018 2020
Pop
in m
illio
n / G
DP
in 1
000€
/cap
ita
-2.0
-1.0
0.0
1.0
2.0
3.0
4.0
5.0
6.0
7.0
8.0
in %
Population Real GDP per capita Deflator
Poland
0.0
5.0
10.0
15.0
20.0
25.0
30.0
35.0
40.0
45.0
2000 2002 2004 2006 2008 2010 2012 2014 2016 2018 2020
Pop
in m
illio
n / G
DP
in 1
000€
/cap
ita
0.0
1.0
2.0
3.0
4.0
5.0
6.0
7.0
8.0
in %
Population Real GDP per capita Deflator
Romania
0.0
5.0
10.0
15.0
20.0
25.0
2000 2002 2004 2006 2008 2010 2012 2014 2016 2018 2020
Pop
in m
illio
n / G
DP
in 1
000€
/cap
ita
0.0
5.0
10.0
15.0
20.0
25.0
30.0
35.0
40.0
45.0
50.0
in %
Population Real GDP per capita Deflator
Slovakia
0.0
2.0
4.0
6.0
8.0
10.0
12.0
14.0
16.0
2000 2002 2004 2006 2008 2010 2012 2014 2016 2018 2020
Pop
in m
illio
n / G
DP
in 1
000€
/cap
ita
0.0
2.0
4.0
6.0
8.0
10.0
12.0
in %
Population Real GDP per capita Deflator
Slovenia
0.0
2.0
4.0
6.0
8.0
10.0
12.0
14.0
16.0
18.0
20.0
2000 2002 2004 2006 2008 2010 2012 2014 2016 2018 2020
Pop
in m
illio
n / G
DP
in 1
000€
/cap
ita
0.0
1.0
2.0
3.0
4.0
5.0
6.0
7.0
8.0
9.0
10.0
in %
Population Real GDP per capita Deflator
Source: AGMEMOD, 2007; Eurostat, 2007

Description of the assumptions and scenarios
32
Figure 5-2 summarises the baseline assumptions for the key macroeconomic aggregates for the EU-12, EU-15, and EU-27 groups regarding population rate, GDP, inflation rate and economic growth per capita.
Figure 5-2: Macroeconomic projections for EU MS groupings Population (2000 = 100)
92
94
96
98
100
102
104
106
108
2000 2002 2004 2006 2008 2010 2012 2014 2016 2018 2020
EU-12 EU-15 EU-27
Real GDP (2000 = 100)
0
50
100
150
200
250
2000 2002 2004 2006 2008 2010 2012 2014 2016 2018 2020
EU-12 EU-15 EU-27
Real GDP per Capita (2000 = 100)
0
50
100
150
200
250
300
2000 2002 2004 2006 2008 2010 2012 2014 2016 2018 2020
EU-12 EU-15 EU-27
Inflation (2000 = 100)
100
120
140
160
180
200
220
240
2000 2002 2004 2006 2008 2010 2012 2014 2016 2018 2020
EU-12 EU-15 EU-27
Source: EU MS national services
Exchange rate The exchange rate between the Euro and the US dollar is a further key macroeconomic factor, since it influences the Euro value of the exogenous world prices used in the AGMEMOD model. For the Euro zone countries, the baseline projections concerning the evolution of the US dollar/Euro exchange rate is illustrated in Figure 5-3.
Figure 5-3: US dollar/Euro exchange rate - actual and projected values
1.101.151.201.251.301.351.401.451.501.551.60
2005 2006 2007 2008 2009 2010 2011 2012 2013 2014 2015 2016 2017
Source
Source: FAPRI, 2008 (www.fapri.org and www.fapri.missouri.edu)
The US dollar/Euro exchange rate projection is sourced from FAPRI. For non-Eurozone countries, the exchange rate between these national currencies and the US dollar is derived
Description of the assumptions and scenarios
33
from their exchange rate with the euro and the baseline US dollar/Euro exchange rate, so that projected exchanges rates are consistent with the absence of possibilities for triangular arbitrage. The assumptions on the evolution of the US dollar/Euro exchange rate are based on the observed exchange rate for 2007 and the percentage change in this exchange rate that are published by FAPRI 2008.
World market prices Although exogenous world market prices in the AGMEMOD model Version 2.0 are endogenised for skimmed milk and cheese, the generation of the baseline and dairy scenario projections are still dependent on other exogenous world market prices. World market prices are used in the estimation and simulation of the model. Variables relating to world market prices are specifically included in the key price equations to capture the effects of the world market on the EU. These data were mainly compiled on FAPRI projections, but also on sources such as UNCTAD, USDA, and OECD. The originally exogenous estimates for the world market prices of cheese and SMP are replaced by estimated equations for these prices, developed as part of the model. All other world market prices are still exogenous as their estimates did not come up to expectations.
The price projections have, in general, been taken from the FAPRI World Outlook (2008), which has a broadly similar structure to the AGMEMOD model. The world livestock and grain prices are market prices from the US while dairy commodity prices and oilseed, oilseed meal and oil prices are generally northern European export prices. For all simulations the world agricultural commodity price projections are assumed to be unchanged (in US dollars) from the baseline levels, however, the world prices for cheese and SMP could differ as they are endogenously determined.
Historically, the EU net trade situation for the bulk of the commodity markets considered has been stable. In general, the EU is a net exporter for wheat, barley, pig meat, cheese, skimmed milk powder, butter and whole milk powder and a net importer for maize, sunflower seed soybean and sheep meet. For the remaining commodity markets, the net trade situation has varied over the historical period. After a long period as a net importer, the EU became a net exporter for rapeseeds, but has become a net importer again. The reverse is the case for beef and veal, where the EU became a net importer in the early years of this decade and for poultry meat where the EU is likely to become a net importer following the trade agreements of 2007 with Brazil and Thailand.
A dataset comprising macro-economic and world price annual data obtained from OECD, ERS-USDA and FAPRI databases is illustrated in Figure 5-4 to Figure 5-7.
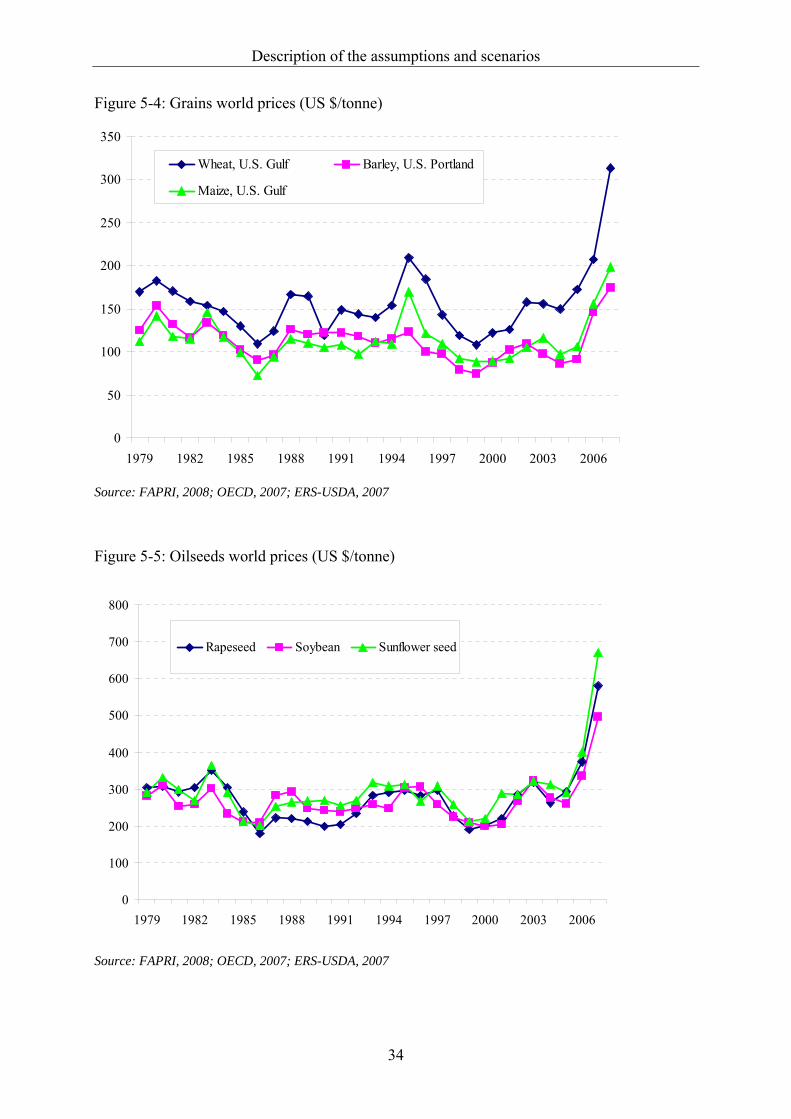
Description of the assumptions and scenarios
34
Figure 5-4: Grains world prices (US $/tonne)
0
50
100
150
200
250
300
350
1979 1982 1985 1988 1991 1994 1997 2000 2003 2006
Wheat, U.S. Gulf Barley, U.S. Portland
Maize, U.S. Gulf
Source: FAPRI, 2008; OECD, 2007; ERS-USDA, 2007
Figure 5-5: Oilseeds world prices (US $/tonne)
0
100
200
300
400
500
600
700
800
1979 1982 1985 1988 1991 1994 1997 2000 2003 2006
Rapeseed Soybean Sunflower seed
Source: FAPRI, 2008; OECD, 2007; ERS-USDA, 2007
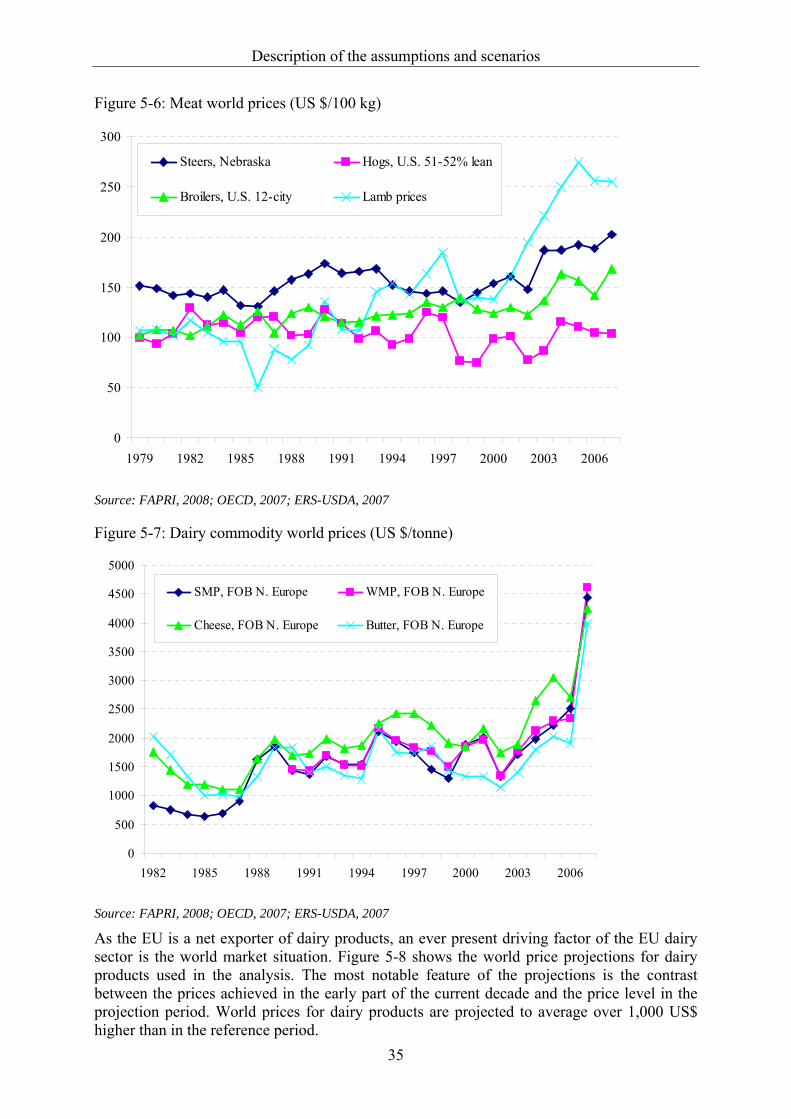
Description of the assumptions and scenarios
35
Figure 5-6: Meat world prices (US $/100 kg)
0
50
100
150
200
250
300
1979 1982 1985 1988 1991 1994 1997 2000 2003 2006
Steers, Nebraska Hogs, U.S. 51-52% lean
Broilers, U.S. 12-city Lamb prices
Source: FAPRI, 2008; OECD, 2007; ERS-USDA, 2007
Figure 5-7: Dairy commodity world prices (US $/tonne)
0
500
1000
1500
2000
2500
3000
3500
4000
4500
5000
1982 1985 1988 1991 1994 1997 2000 2003 2006
SMP, FOB N. Europe WMP, FOB N. Europe
Cheese, FOB N. Europe Butter, FOB N. Europe
Source: FAPRI, 2008; OECD, 2007; ERS-USDA, 2007
As the EU is a net exporter of dairy products, an ever present driving factor of the EU dairy sector is the world market situation. Figure 5-8 shows the world price projections for dairy products used in the analysis. The most notable feature of the projections is the contrast between the prices achieved in the early part of the current decade and the price level in the projection period. World prices for dairy products are projected to average over 1,000 US$ higher than in the reference period.
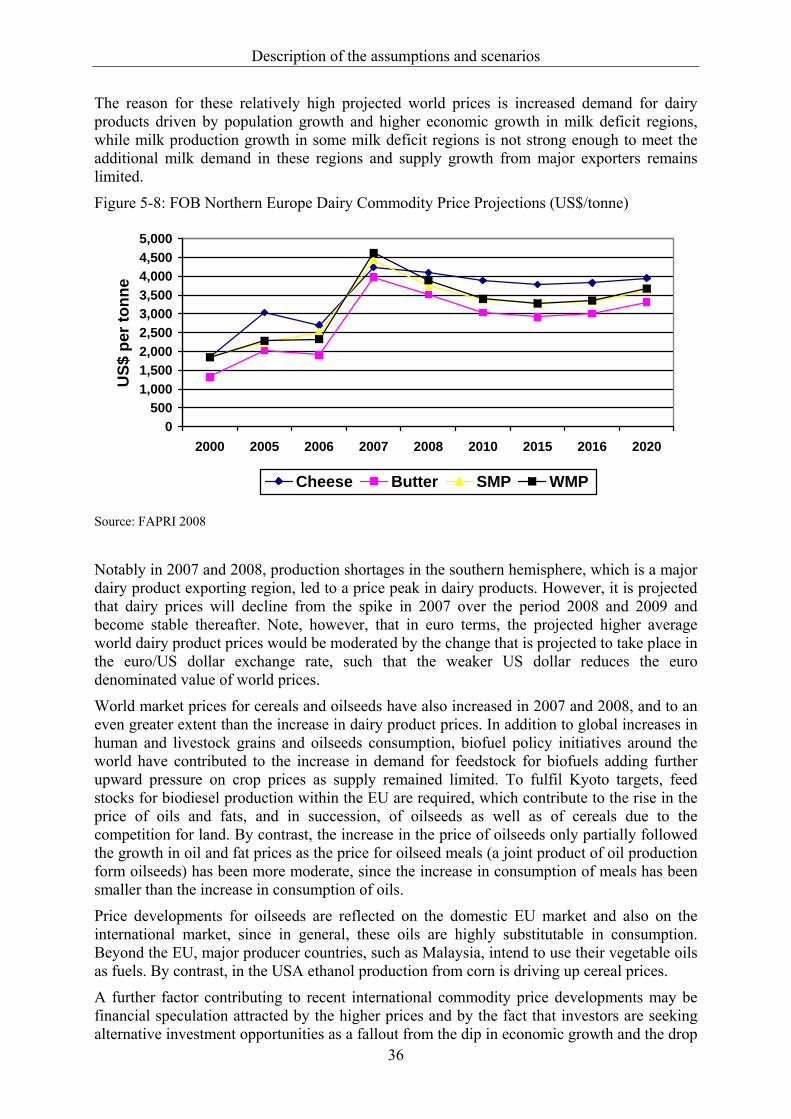
Description of the assumptions and scenarios
36
The reason for these relatively high projected world prices is increased demand for dairy products driven by population growth and higher economic growth in milk deficit regions, while milk production growth in some milk deficit regions is not strong enough to meet the additional milk demand in these regions and supply growth from major exporters remains limited.
Figure 5-8: FOB Northern Europe Dairy Commodity Price Projections (US$/tonne)
0500
1,0001,5002,0002,5003,0003,5004,0004,5005,000
2000 2005 2006 2007 2008 2010 2015 2016 2020
US$
per
tonn
e
Cheese Butter SMP WMP
Source: FAPRI 2008
Notably in 2007 and 2008, production shortages in the southern hemisphere, which is a major dairy product exporting region, led to a price peak in dairy products. However, it is projected that dairy prices will decline from the spike in 2007 over the period 2008 and 2009 and become stable thereafter. Note, however, that in euro terms, the projected higher average world dairy product prices would be moderated by the change that is projected to take place in the euro/US dollar exchange rate, such that the weaker US dollar reduces the euro denominated value of world prices.
World market prices for cereals and oilseeds have also increased in 2007 and 2008, and to an even greater extent than the increase in dairy product prices. In addition to global increases in human and livestock grains and oilseeds consumption, biofuel policy initiatives around the world have contributed to the increase in demand for feedstock for biofuels adding further upward pressure on crop prices as supply remained limited. To fulfil Kyoto targets, feed stocks for biodiesel production within the EU are required, which contribute to the rise in the price of oils and fats, and in succession, of oilseeds as well as of cereals due to the competition for land. By contrast, the increase in the price of oilseeds only partially followed the growth in oil and fat prices as the price for oilseed meals (a joint product of oil production form oilseeds) has been more moderate, since the increase in consumption of meals has been smaller than the increase in consumption of oils.
Price developments for oilseeds are reflected on the domestic EU market and also on the international market, since in general, these oils are highly substitutable in consumption. Beyond the EU, major producer countries, such as Malaysia, intend to use their vegetable oils as fuels. By contrast, in the USA ethanol production from corn is driving up cereal prices.
A further factor contributing to recent international commodity price developments may be financial speculation attracted by the higher prices and by the fact that investors are seeking alternative investment opportunities as a fallout from the dip in economic growth and the drop
Description of the assumptions and scenarios
37
in property values and stocks following the credit crunch. But speculation is unable to change the fundamental medium-term price levels based on supply and demand, however, it may accentuate price volatility. An additional element in the overall picture is contributed by world-wide low commodity stocks which are fundamentally a result of the drivers on the supply and demand side.
To summarise, the rising prises of energy is increasing the production cost of most commodities, but in addition, biofuel related energy production are driving up grain and oilseed commodity prices due to the heightened competition between energy and food use, and to some extent feed use. Commodity market speculation is also partially responsible for the price increases.
The high prices for the cereal-oilseed complex, at least indirectly, influences the dairy sector and most other livestock sectors, as the increase in feed prices, raises livestock and livestock product production costs.
5.2 Assumptions on agricultural and trade policies An essential part of the baseline projections comprises the definition of the agricultural policy implementation in the AGMEMOD country level models. The baseline policy of the EU-15 models reflects the 2003 CAP reform, which includes the increase in milk quotas, the cut in intervention prices and the implementation of the SFP scheme. The dairy premium is treated comparably to the other coupled livestock premiums and is introduced into the SFP in the further progress of the CAP reform9. The implementation of the 2003 CAP reform was not immediate, and was staggered over the period 2005 to 2007 depending on the MS concerned. Also, MS have chosen different options within the scheme as allowed for in the Luxembourg Agreement and their choices have been reflected in the AGMEMOD country level models.
Following the Accession Agreements negotiated at the Copenhagen EU Summit in 2002, the ten new countries joined the EU on 1 May 2004, followed by Bulgaria and Romania, joining the EU on January 2007. The AGMEMOD EU-12 models have simulated the impacts of the accession on their domestic agricultural markets on the basis of the adoption of the SAPS (in the 2004-2008 period) and the regional version - uniform payments per hectare - of the SFP scheme (from 2009).
The baseline for Bulgaria and Romania reflects the pre-accession agricultural policy up to 31 December 2007, but it follows the SAPS/SFP scheme from then.
After the introduction of the 2003 CAP reform, the direct hectare and animal payments mentioned in the tables, have been decoupled from production and enter the country models with reduced values depending on the decoupling rates and multiplier rates used across the MS.
On trade policy, the baseline makes no assumptions concerning the outcome of the Doha Development Round of the WTO. As no probable quantitative outcome is available so far, the impact of the Doha Round on EU agriculture would be speculative. Hence, in the baseline the possibility of using dairy export support continues to exist, if a considerable gap emerges between EU and world prices.
Traditionally the EU Commission has operated export refunds and import tariffs to insulate the EU from the full extent of the fluctuation in these world prices, but these mechanisms are
9 For Germany the dairy premium was directly included in the SFP as the premium was decoupled for only one year.

Description of the assumptions and scenarios
38
likely to be less prevalent in the future due to EU budgetary constraints and the need for adherence to future WTO reform objectives. In the baseline the URAA conditions hold so that export subsidies and import tariffs remain ‘on the books’ and are used when required to support the farm gate milk price. However, in some scenarios export limits are regarded explicitly.
5.3 Description of baseline and scenarios The baseline in this study has been developed as follows:
o milk quotas remain in place at the 2008/09 level throughout the projection period; o 2008/09 quota expansion package (the 2% milk quota increase agreed for 2008/09)
has been implemented; o butter and SMP intervention remains in place throughout the projection period; o no further WTO reform occurs and the URAA conditions hold; o export subsidies and import tariffs remain ‘on the books’ and are used when required
to support the farm gate milk price.
Scenarios One could conceive of many milk quota reform scenarios, but the number of scenarios must be kept reasonable to allow a proper interpretation of the results of the scenarios by both the researchers and the policy makers. The main issue for the scenarios is the pace of quota reform, whether it takes place rapidly in a short number of years (i.e. over 1 or 2 years) or whether it takes place more slowly (over 3, 4, 5 or 6 years).
It seems highly unlikely that quota removal would be accompanied by any additional compensation for the resultant decrease in price, so no compensation is assumed. Alteration of other policy levers in order to create a coherent set of policies for the dairy CMO as quotas are relaxed is a possibility. For example, it might be required that quota removal is accompanied by further reductions in the intervention price for dairy products, in order to prevent stock-building as market prices decrease. This is particularly the case for butter more so than SMP, given that the internal EU butter price has been historically substantially above the world butter price, whereas in the case of SMP the world and EU prices have been much closer to each other in recent years. Reduction of the butter intervention price would also help adjust the butter/protein price ratio in the EU and bring it closer to that prevailing on international markets. Another possibility is that dairy export subsidies would be completely removed. Intervention price reductions and the elimination of export subsidies would be seen as important steps toward aligning EU dairy policy to cope with WTO reform.
Taking the foregoing into consideration, the following four scenarios have been developed for analysis.
Scenario Milk 1: o The milk quota is expanded by 1% each year from 2009/10 to 2013/14; o Represents 5 annual increases relative to the 2008/09 quota; o 2009/10 is year 1 (total increase 5% by 2013); o Milk quota is eliminated in 2015; o No compensation is paid to producers for the resulting price drop; o Other policies remain unchanged.
Scenario Milk 2:
o The milk quota is expanded by 2% each year 2009/10 to 2013/14; o Represents 5 annual increases relative to the 2008/09 quota;
Description of the assumptions and scenarios
39
o 2009/10 is year 1 (total increase 10% by 2013); o Milk quota is eliminated in 2015; o No compensation is paid to producers for the resulting price drop; o Other policies remain unchanged.
Scenario Milk 3:
o As scenario Milk 1 plus the following policy changes: o Butter intervention prices will be reduced by 2% per year starting in 2009.
Scenario Milk 4:
o As scenario Milk 2 plus the following policy changes: o Butter and skimmed milk powder intervention prices will be reduced by 2% per year
starting in 2009; o Dairy subsidised export limits are reduced by 5% per year starting in 2009.
5.4 Qualification of the approach There are some open questions and issues that are important to consider in the context of the selected modelling approach, the underlying assumptions and scenarios.
• How will processors react to quota elimination?
It is difficult to say with certainty how processors will alter the product mix and it cannot be modelled in a precise fashion. To some degree it will be a strategic decision taken at board level by the processor. Largely it should depend on relative dairy commodity prices in the projection period or the expectations thereof, although processing capacity constraints may mean that the potential to alter the product mix to maximise returns may be more limited in some MS than in others, at least over the short term as adjustment is delayed.
• How will farmers boost milk production as milk quotas are relaxed? This can be achieved through higher yields or by slowing the rate of decrease in the number of dairy cows (or by maintaining or increasing cow numbers) as yields increase or by some combination of the changes in yield and a change in cow numbers.
• Does the policy set in each scenario represent policy consistency? There may be changes in internal EU milk policy associated with milk quota removal, including change in the intervention prices for dairy products or dairy export support. Such changes are considered in the analysis in the scenarios Milk 3 and Milk 4.
• What is the impact of the dairy reform on other sectors? The extent to which the increase in milk production following quota removal is derived from increased milk yields (rather than retention of dairy cows) will have implications for the number of dairy cows required to meet that level of milk production. In turn, the dairy cow population will have implications for the supply of calves, the contribution of dairy herds to the level of output from the beef sector and the demand for feed. Since AGMEMOD is a multi commodity model it is possible to address these questions. As a short-term measure farmers may tend to boost yields as an immediate reaction to increase milk production, but to what extent they will be able to shift the yield curve over an extended period remains a question. In order to reflect the fullest impact of milk quota removal on other sectors, the focus is on dairy herd expansion as the origin of increased production.
Description of the assumptions and scenarios
40
• EU and MS quota constraints A common issue for discussions of milk quota expansion is the point at which the milk quota is no longer binding in the EU. However, this is perhaps only one dimension of the analysis. A more incisive question would be to ask at what point the quota is no longer binding at EU MS level. Further depth is added by asking what the impact would be on production in specific MS, where production has reached its economic equilibrium where the quota is no longer binding, but where further EU quota expansion is met by increased production from other MS. It should be understood also that a milk quota which is no longer binding at an EU aggregate level (i.e. EU production remaining static as quota increases) may not necessarily reflect a non-binding quota at the MS level.
It is possible that an expansion in quota may give rise to the following MS outcomes:
o a fall in production in some countries;
o no change in production in some countries; and
o an increase in production in some countries.
Collectively these changes might amount to no overall change in aggregate production, giving the impression at EU level of a quota which is no longer binding.
Aggregate EU modelling of milk quota expansion provides answers to these questions and will ultimately determine when quota is no longer binding at EU level in the sense that further increases in EU quota have no further impact on total EU milk production. However, there may still remain a dynamic story in the background at EU MS level that needs to be drawn out by the scenario analyses. In particular, it may be interesting to look at the full potential for increased production for specific MS, even when quota appears binding in the aggregate. MS level modelling can provide the answer to this more difficult research question.
Ultimately those MS which can achieve the highest rate of expansion in milk production may be among those most in favour of a rapid and substantial increase in milk quota. This would bring about an outcome whereby milk production is restricted by economic factors in MS where milk production is less efficient, while at the same time allowing for a substantial expansion in production in the MS where milk production is most efficient. Essentially, a large quota expansion has the potential to become a backdoor means towards an early quota removal, where the quota reaches a level that makes the milk price and the marginal cost of production the binding constraint, rather than the binding constraint being an imposed production limit.
The dairy sector in the MS must be seen as heterogeneous for a variety of reasons. Differing amounts of milk are produced in the MS, so changes in production in larger milk producing MS having more of a role in determining total EU output than do similar percentage changes in MS with smaller levels of milk production. The price of milk differs considerably between MS due to product mix, the extent of self-sufficiency in dairy products and a differing reliance on third country export markets, as well as owed to the market structure organisation. Costs of production are also a factor, particularly since two relatively distinct production systems are common, one which is extensive and largely pasture feed based and the other which is more intensive and grain feed based.
Modelling the EU aggregate outcome of milk quota scenarios presents huge and arguably insurmountable obstacles for models which treat the EU as a single block. This is where an MS model such as AGMEMOD can provide MS detail which would, otherwise, be absent from an analysis of this kind.
41
6 Results of the quantitative approach This chapter provides a description and analysis of the results of the milk quota policy scenarios examined in this study. The chapter begins by setting out a baseline (Section 6.1) which reflects the projected outlook for the sector under the assumption that policy does not change. The baseline results are then contrasted with the various scenario results in order to provide a measure of the impact of the scenarios (Section 6.2).
6.1 Baseline results The most notable feature of the baseline assumptions is that it assumes that the milk quota remains in place right through the projection period, in spite of the anticipated removal of the system in 2015. This assumption is necessary to provide a reference or benchmark over the entire projection period in order to measure the impact of the alternative scenarios which examine quota expansion and eventual removal from 2015. Details relating to the baseline results are discussed in the rest of this section.
The AGMEMOD baseline milk price outlook could be acceptable from a dairy farmer's perspective due to strong international demand, limited growth in international milk supplies and fixed EU quota. However, there are also a couple of negatives from the producer perspective. Firstly, there is also an increase in production costs and secondly there may also be increased variability in internal EU prices, as movements in world prices are increasingly transmitted into EU dairy commodity markets. However, such price fluctuations are difficult to project, since they generally are attributable to short-term disruptions to supply, such as occurred in parts of the world in 2007 for weather related reasons.
6.1.1 EU baseline milk production In broad terms the baseline reflects a relatively static level of milk production for the EU-27, with the exception of the increase in production arising from the expansion in milk quota as part of the 2008 quota expansion (the 2% EU milk quota increase agreed for 2008/09). When measured against the 2007 level of EU milk production, which was below the 2007/08 EU milk quota level, the increase in milk production by 2020 is projected to be less than 1%. The assumed increase in butterfat content over the projection period requires an offsetting decrease in deliveries to reflect the butterfat adjustment, so a full 2% increase in the volume of milk for processing would not be possible.
Projected developments in milk production across the MS are not uniform. In parts of the EU-12, notably Estonia, Lithuania, Bulgaria and Romania, there is an increase in the delivered milk volume, which reflects a switch in consumption from home produced to processed and marketed milk and dairy products. In other EU-12 MS, as in the EU-1510, the milk quota already constrains production growth, and may slow down the re-structuring process (whereby direct sales are converted to deliveries quota) that would allow a more efficient milk production and processing sector to develop.
Higher milk fat content in milk deliveries will necessitate a scaling back in the volume of production in MS where the reference milk fat level has been exceeded. In some MS, most
10 In most MS of the EU-15 a certain amount of milk products are marketed as direct sales to fulfil certain consumer preferences. Here, often products originating from organic production are sold, which in the medium term is a development not unlikely to occur in MS of the EU-12.
Results of the quantitative approach
42
notably Finland, Greece, Sweden, Hungary, Latvia and Slovenia, production is projected to fail to meet the baseline milk quota.
In the UK where in recent years milk production has been below the milk quota, a slight recovery in milk production is projected due to the rise in producer milk prices, although the baseline UK milk quota is still not binding. However, one has to keep in mind that the exchange rates between sterling and the euro, (sterling has lost 20 percent of its value against the euro over 2007 and 2008), is most likely a factor contributing to the current underfilling of the UK milk quota and could further influence production levels in the UK into the future.
6.1.2 EU baseline dairy product consumption The level of overall EU dairy product consumption is projected to increase over the baseline projection period. Increases in EU domestic use reflect further growth in per capita consumption driven by real income growth, evolving consumer preferences for high value added products and modest EU population growth. The area of strongest consumption growth will be for cheese and fresh dairy products, whereas in general, consumption of more basic traditional products, like butter, is projected to decline.
Cheese: Aggregate EU consumption of cheese is set to continue to grow at about 1.2% per year, with an even stronger level of growth projected in MS where existing levels of cheese consumption are below the EU average. Behind these projected developments, the country growth rates differ.
For the EU-15, smaller consumption increases are expected e.g. for Belgium, the Netherlands, Denmark, Sweden, Finland, Germany, Italy and Greece. Although per capita consumption levels are already high, strong consumer preferences drive increased consumption in Austria and France. Strong cheese consumption growth is also expected for Ireland and UK, but their existing consumption levels are much lower than the EU average.
Among the EU-12, the demand patterns also vary: high growth rates characterize cheese consumption in Slovenia, Romania, Bulgaria, Lithuania and the Czech Republic, while in most other EU-12 countries cheese consumption growth is moderate.
SMP: Across the EU-27 consumption of more basic, traditional commodity dairy products is likely to decline. Most notably the consumption of SMP is set to decline by about 1% per year, in part due to lower butter production, but largely due to a lower calf population and the greater utilisation of skimmed milk in higher value added dairy products rather than in the production of bulk commodities. Furthermore, processing aids for feed production have been set to zero, providing no additional incentive to incorporate skimmed milk or skimmed milk powder in animal feed.
Butter: EU-27 consumption of butter is stable on a per capita basis, as population growth offsets much of the declines in per capita butter consumption occurring in some MS due to the negative consumer sentiment towards dairy fat.
In the EU-15 changes in per capita butter consumption are very limited. Per capita butter consumption is declining in France, the Netherlands and Austria, while per capita consumption is increasing in Belgium, Denmark, UK, Sweden and Finland as well as in the southern MS. In Ireland and Germany per capita butter consumption remains nearly unchanged.
With some exceptions, generally per capita consumption is increasing in the EU-12. Exceptions are Lithuania, Estonia, Hungary, Slovenia and Romania. As a general summary annual per capita butter consumption changes are well below 1%, but there are some
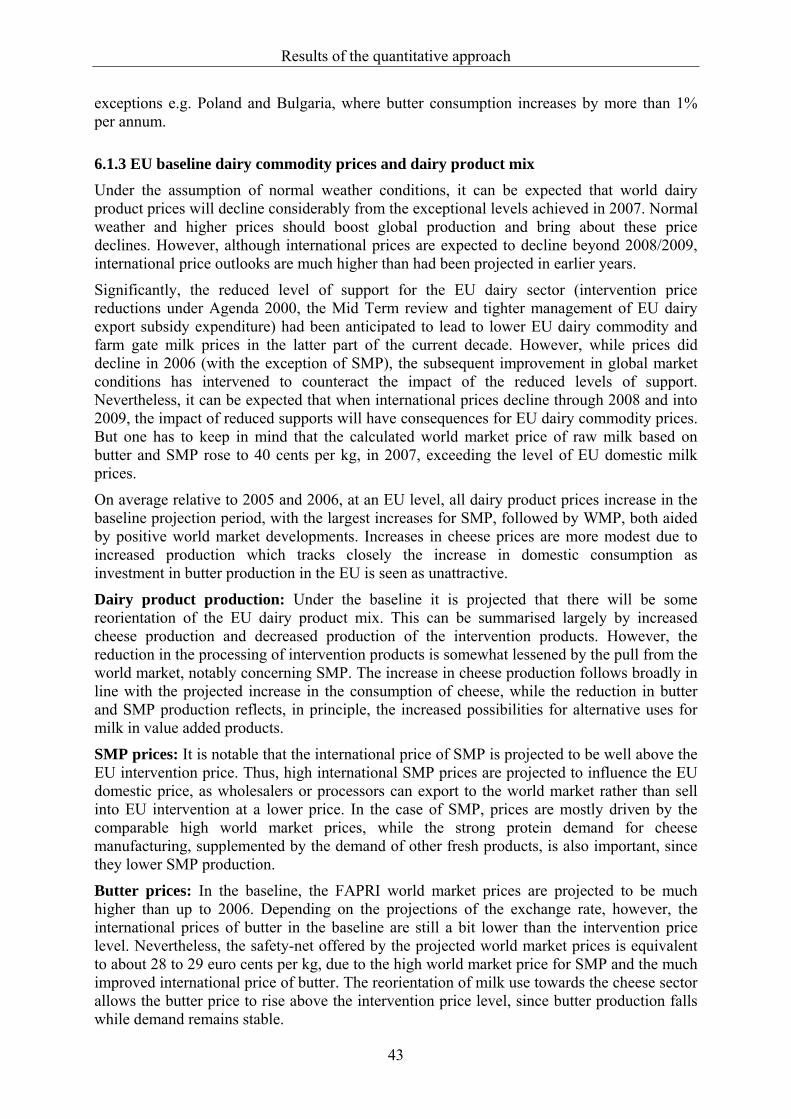
Results of the quantitative approach
43
exceptions e.g. Poland and Bulgaria, where butter consumption increases by more than 1% per annum.
6.1.3 EU baseline dairy commodity prices and dairy product mix Under the assumption of normal weather conditions, it can be expected that world dairy product prices will decline considerably from the exceptional levels achieved in 2007. Normal weather and higher prices should boost global production and bring about these price declines. However, although international prices are expected to decline beyond 2008/2009, international price outlooks are much higher than had been projected in earlier years.
Significantly, the reduced level of support for the EU dairy sector (intervention price reductions under Agenda 2000, the Mid Term review and tighter management of EU dairy export subsidy expenditure) had been anticipated to lead to lower EU dairy commodity and farm gate milk prices in the latter part of the current decade. However, while prices did decline in 2006 (with the exception of SMP), the subsequent improvement in global market conditions has intervened to counteract the impact of the reduced levels of support. Nevertheless, it can be expected that when international prices decline through 2008 and into 2009, the impact of reduced supports will have consequences for EU dairy commodity prices. But one has to keep in mind that the calculated world market price of raw milk based on butter and SMP rose to 40 cents per kg, in 2007, exceeding the level of EU domestic milk prices.
On average relative to 2005 and 2006, at an EU level, all dairy product prices increase in the baseline projection period, with the largest increases for SMP, followed by WMP, both aided by positive world market developments. Increases in cheese prices are more modest due to increased production which tracks closely the increase in domestic consumption as investment in butter production in the EU is seen as unattractive.
Dairy product production: Under the baseline it is projected that there will be some reorientation of the EU dairy product mix. This can be summarised largely by increased cheese production and decreased production of the intervention products. However, the reduction in the processing of intervention products is somewhat lessened by the pull from the world market, notably concerning SMP. The increase in cheese production follows broadly in line with the projected increase in the consumption of cheese, while the reduction in butter and SMP production reflects, in principle, the increased possibilities for alternative uses for milk in value added products.
SMP prices: It is notable that the international price of SMP is projected to be well above the EU intervention price. Thus, high international SMP prices are projected to influence the EU domestic price, as wholesalers or processors can export to the world market rather than sell into EU intervention at a lower price. In the case of SMP, prices are mostly driven by the comparable high world market prices, while the strong protein demand for cheese manufacturing, supplemented by the demand of other fresh products, is also important, since they lower SMP production.
Butter prices: In the baseline, the FAPRI world market prices are projected to be much higher than up to 2006. Depending on the projections of the exchange rate, however, the international prices of butter in the baseline are still a bit lower than the intervention price level. Nevertheless, the safety-net offered by the projected world market prices is equivalent to about 28 to 29 euro cents per kg, due to the high world market price for SMP and the much improved international price of butter. The reorientation of milk use towards the cheese sector allows the butter price to rise above the intervention price level, since butter production falls while demand remains stable.
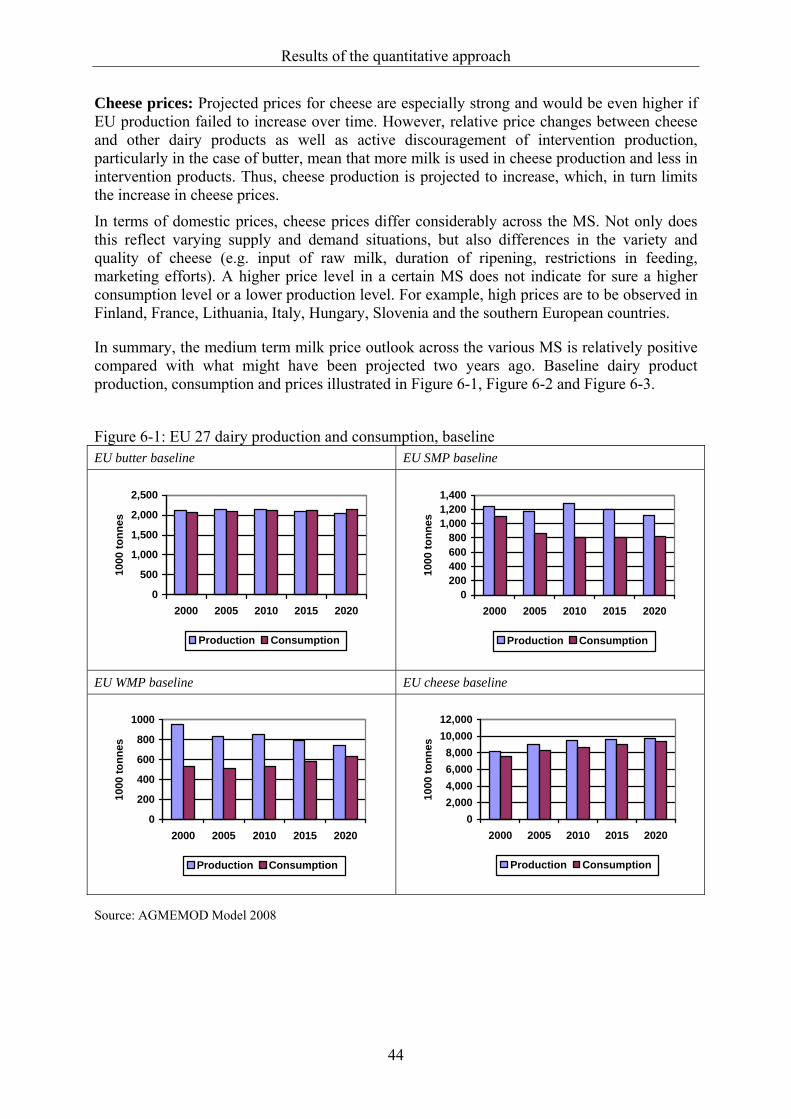
Results of the quantitative approach
44
Cheese prices: Projected prices for cheese are especially strong and would be even higher if EU production failed to increase over time. However, relative price changes between cheese and other dairy products as well as active discouragement of intervention production, particularly in the case of butter, mean that more milk is used in cheese production and less in intervention products. Thus, cheese production is projected to increase, which, in turn limits the increase in cheese prices.
In terms of domestic prices, cheese prices differ considerably across the MS. Not only does this reflect varying supply and demand situations, but also differences in the variety and quality of cheese (e.g. input of raw milk, duration of ripening, restrictions in feeding, marketing efforts). A higher price level in a certain MS does not indicate for sure a higher consumption level or a lower production level. For example, high prices are to be observed in Finland, France, Lithuania, Italy, Hungary, Slovenia and the southern European countries.
In summary, the medium term milk price outlook across the various MS is relatively positive compared with what might have been projected two years ago. Baseline dairy product production, consumption and prices illustrated in Figure 6-1, Figure 6-2 and Figure 6-3.
Figure 6-1: EU 27 dairy production and consumption, baseline EU butter baseline EU SMP baseline
0
500
1,000
1,500
2,000
2,500
2000 2005 2010 2015 2020
1000
tonn
es
Production Consumption
0200400600800
1,0001,2001,400
2000 2005 2010 2015 2020
1000
tonn
es
Production Consumption
EU WMP baseline EU cheese baseline
0
200
400
600
800
1000
2000 2005 2010 2015 2020
1000
tonn
es
Production Consumption
02,0004,0006,0008,000
10,00012,000
2000 2005 2010 2015 2020
1000
tonn
es
Production Consumption
Source: AGMEMOD Model 2008
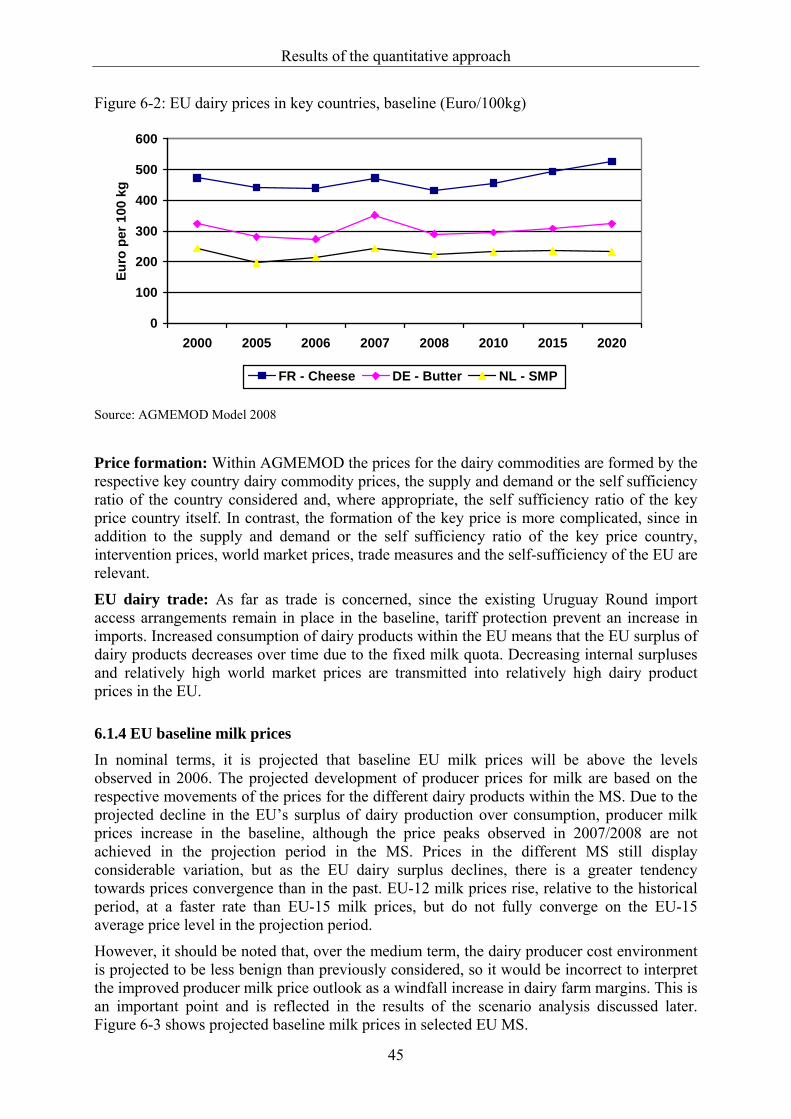
Results of the quantitative approach
45
Figure 6-2: EU dairy prices in key countries, baseline (Euro/100kg)
0
100
200
300
400
500
600
2000 2005 2006 2007 2008 2010 2015 2020
Euro
per
100
kg
FR - Cheese DE - Butter NL - SMP
Source: AGMEMOD Model 2008
Price formation: Within AGMEMOD the prices for the dairy commodities are formed by the respective key country dairy commodity prices, the supply and demand or the self sufficiency ratio of the country considered and, where appropriate, the self sufficiency ratio of the key price country itself. In contrast, the formation of the key price is more complicated, since in addition to the supply and demand or the self sufficiency ratio of the key price country, intervention prices, world market prices, trade measures and the self-sufficiency of the EU are relevant.
EU dairy trade: As far as trade is concerned, since the existing Uruguay Round import access arrangements remain in place in the baseline, tariff protection prevent an increase in imports. Increased consumption of dairy products within the EU means that the EU surplus of dairy products decreases over time due to the fixed milk quota. Decreasing internal surpluses and relatively high world market prices are transmitted into relatively high dairy product prices in the EU.
6.1.4 EU baseline milk prices In nominal terms, it is projected that baseline EU milk prices will be above the levels observed in 2006. The projected development of producer prices for milk are based on the respective movements of the prices for the different dairy products within the MS. Due to the projected decline in the EU’s surplus of dairy production over consumption, producer milk prices increase in the baseline, although the price peaks observed in 2007/2008 are not achieved in the projection period in the MS. Prices in the different MS still display considerable variation, but as the EU dairy surplus declines, there is a greater tendency towards prices convergence than in the past. EU-12 milk prices rise, relative to the historical period, at a faster rate than EU-15 milk prices, but do not fully converge on the EU-15 average price level in the projection period.
However, it should be noted that, over the medium term, the dairy producer cost environment is projected to be less benign than previously considered, so it would be incorrect to interpret the improved producer milk price outlook as a windfall increase in dairy farm margins. This is an important point and is reflected in the results of the scenario analysis discussed later. Figure 6-3 shows projected baseline milk prices in selected EU MS.
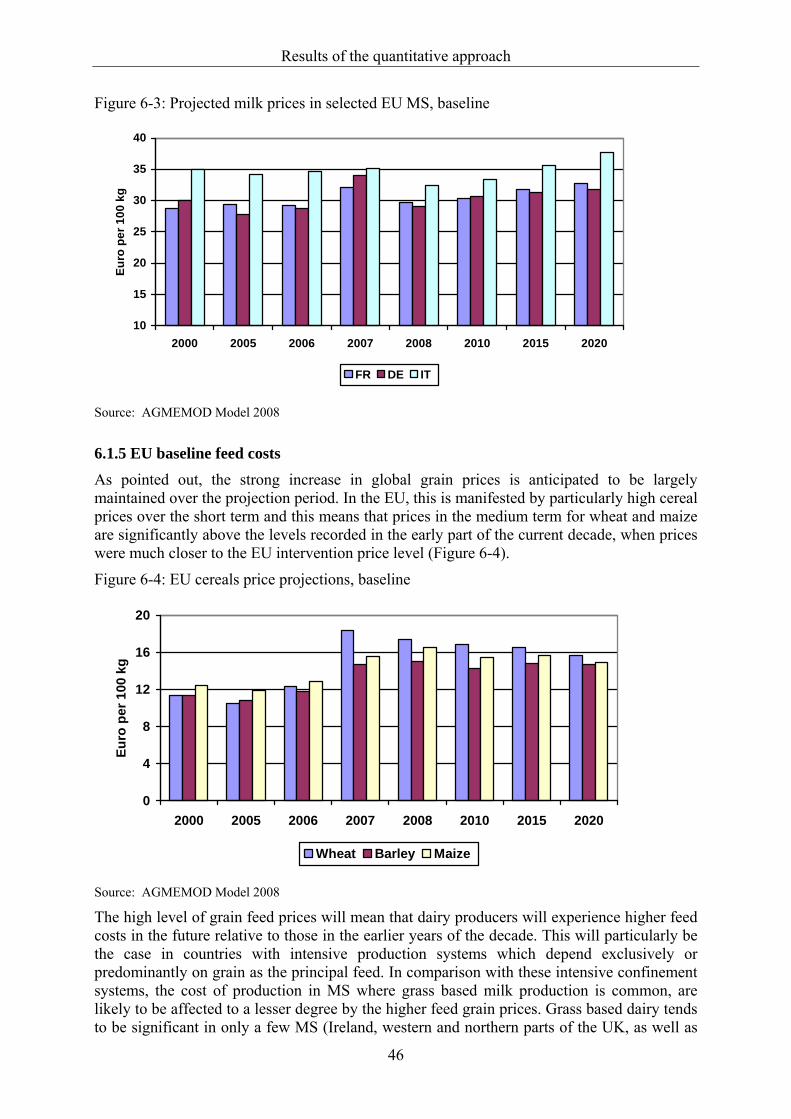
Results of the quantitative approach
46
Figure 6-3: Projected milk prices in selected EU MS, baseline
10
15
20
25
30
35
40
2000 2005 2006 2007 2008 2010 2015 2020
Euro
per
100
kg
FR DE IT
Source: AGMEMOD Model 2008
6.1.5 EU baseline feed costs As pointed out, the strong increase in global grain prices is anticipated to be largely maintained over the projection period. In the EU, this is manifested by particularly high cereal prices over the short term and this means that prices in the medium term for wheat and maize are significantly above the levels recorded in the early part of the current decade, when prices were much closer to the EU intervention price level (Figure 6-4).
Figure 6-4: EU cereals price projections, baseline
0
4
8
12
16
20
2000 2005 2006 2007 2008 2010 2015 2020
Euro
per
100
kg
Wheat Barley Maize
Source: AGMEMOD Model 2008
The high level of grain feed prices will mean that dairy producers will experience higher feed costs in the future relative to those in the earlier years of the decade. This will particularly be the case in countries with intensive production systems which depend exclusively or predominantly on grain as the principal feed. In comparison with these intensive confinement systems, the cost of production in MS where grass based milk production is common, are likely to be affected to a lesser degree by the higher feed grain prices. Grass based dairy tends to be significant in only a few MS (Ireland, western and northern parts of the UK, as well as
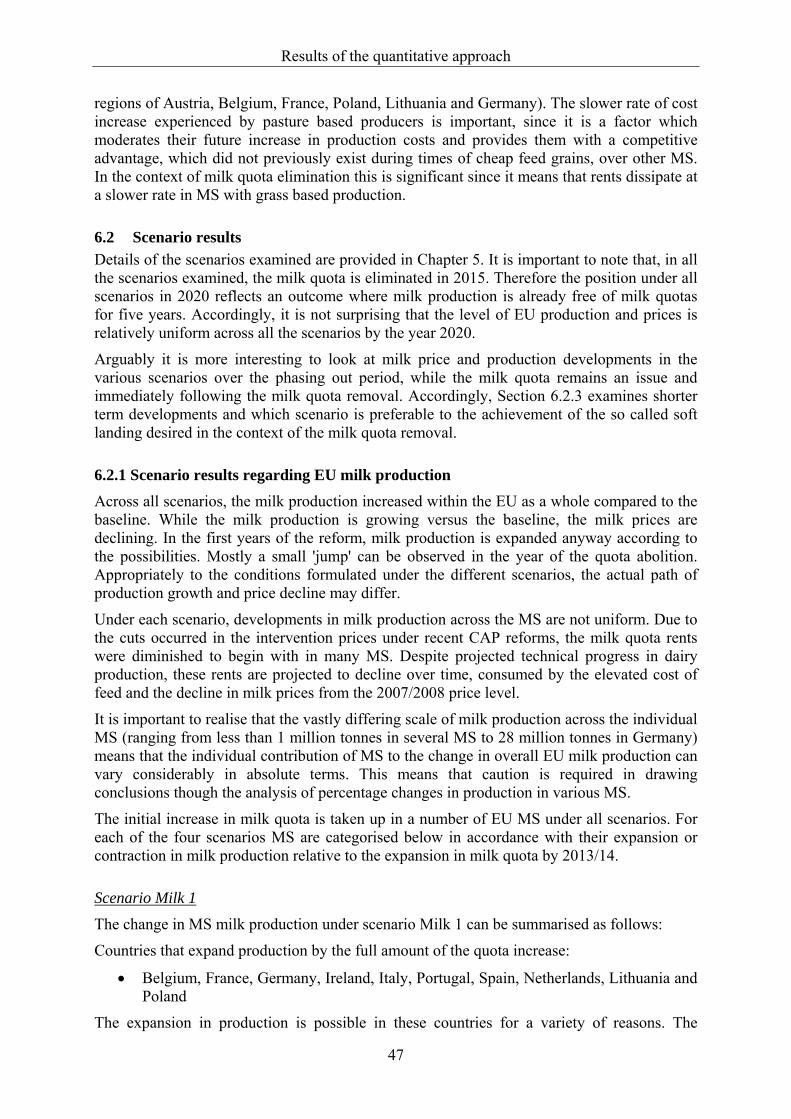
Results of the quantitative approach
47
regions of Austria, Belgium, France, Poland, Lithuania and Germany). The slower rate of cost increase experienced by pasture based producers is important, since it is a factor which moderates their future increase in production costs and provides them with a competitive advantage, which did not previously exist during times of cheap feed grains, over other MS. In the context of milk quota elimination this is significant since it means that rents dissipate at a slower rate in MS with grass based production.
6.2 Scenario results Details of the scenarios examined are provided in Chapter 5. It is important to note that, in all the scenarios examined, the milk quota is eliminated in 2015. Therefore the position under all scenarios in 2020 reflects an outcome where milk production is already free of milk quotas for five years. Accordingly, it is not surprising that the level of EU production and prices is relatively uniform across all the scenarios by the year 2020.
Arguably it is more interesting to look at milk price and production developments in the various scenarios over the phasing out period, while the milk quota remains an issue and immediately following the milk quota removal. Accordingly, Section 6.2.3 examines shorter term developments and which scenario is preferable to the achievement of the so called soft landing desired in the context of the milk quota removal.
6.2.1 Scenario results regarding EU milk production
Across all scenarios, the milk production increased within the EU as a whole compared to the baseline. While the milk production is growing versus the baseline, the milk prices are declining. In the first years of the reform, milk production is expanded anyway according to the possibilities. Mostly a small 'jump' can be observed in the year of the quota abolition. Appropriately to the conditions formulated under the different scenarios, the actual path of production growth and price decline may differ.
Under each scenario, developments in milk production across the MS are not uniform. Due to the cuts occurred in the intervention prices under recent CAP reforms, the milk quota rents were diminished to begin with in many MS. Despite projected technical progress in dairy production, these rents are projected to decline over time, consumed by the elevated cost of feed and the decline in milk prices from the 2007/2008 price level.
It is important to realise that the vastly differing scale of milk production across the individual MS (ranging from less than 1 million tonnes in several MS to 28 million tonnes in Germany) means that the individual contribution of MS to the change in overall EU milk production can vary considerably in absolute terms. This means that caution is required in drawing conclusions though the analysis of percentage changes in production in various MS.
The initial increase in milk quota is taken up in a number of EU MS under all scenarios. For each of the four scenarios MS are categorised below in accordance with their expansion or contraction in milk production relative to the expansion in milk quota by 2013/14.
Scenario Milk 1 The change in MS milk production under scenario Milk 1 can be summarised as follows:
Countries that expand production by the full amount of the quota increase:
• Belgium, France, Germany, Ireland, Italy, Portugal, Spain, Netherlands, Lithuania and Poland
The expansion in production is possible in these countries for a variety of reasons. The
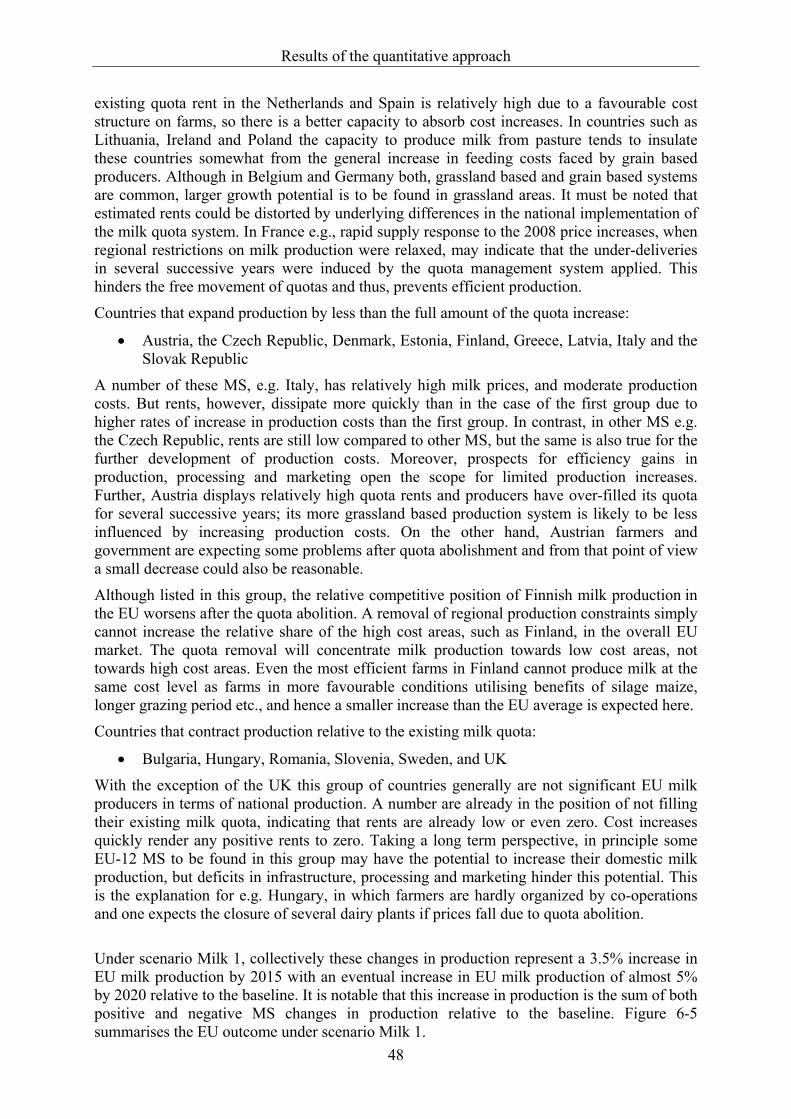
Results of the quantitative approach
48
existing quota rent in the Netherlands and Spain is relatively high due to a favourable cost structure on farms, so there is a better capacity to absorb cost increases. In countries such as Lithuania, Ireland and Poland the capacity to produce milk from pasture tends to insulate these countries somewhat from the general increase in feeding costs faced by grain based producers. Although in Belgium and Germany both, grassland based and grain based systems are common, larger growth potential is to be found in grassland areas. It must be noted that estimated rents could be distorted by underlying differences in the national implementation of the milk quota system. In France e.g., rapid supply response to the 2008 price increases, when regional restrictions on milk production were relaxed, may indicate that the under-deliveries in several successive years were induced by the quota management system applied. This hinders the free movement of quotas and thus, prevents efficient production.
Countries that expand production by less than the full amount of the quota increase:
• Austria, the Czech Republic, Denmark, Estonia, Finland, Greece, Latvia, Italy and the Slovak Republic
A number of these MS, e.g. Italy, has relatively high milk prices, and moderate production costs. But rents, however, dissipate more quickly than in the case of the first group due to higher rates of increase in production costs than the first group. In contrast, in other MS e.g. the Czech Republic, rents are still low compared to other MS, but the same is also true for the further development of production costs. Moreover, prospects for efficiency gains in production, processing and marketing open the scope for limited production increases. Further, Austria displays relatively high quota rents and producers have over-filled its quota for several successive years; its more grassland based production system is likely to be less influenced by increasing production costs. On the other hand, Austrian farmers and government are expecting some problems after quota abolishment and from that point of view a small decrease could also be reasonable.
Although listed in this group, the relative competitive position of Finnish milk production in the EU worsens after the quota abolition. A removal of regional production constraints simply cannot increase the relative share of the high cost areas, such as Finland, in the overall EU market. The quota removal will concentrate milk production towards low cost areas, not towards high cost areas. Even the most efficient farms in Finland cannot produce milk at the same cost level as farms in more favourable conditions utilising benefits of silage maize, longer grazing period etc., and hence a smaller increase than the EU average is expected here.
Countries that contract production relative to the existing milk quota:
• Bulgaria, Hungary, Romania, Slovenia, Sweden, and UK
With the exception of the UK this group of countries generally are not significant EU milk producers in terms of national production. A number are already in the position of not filling their existing milk quota, indicating that rents are already low or even zero. Cost increases quickly render any positive rents to zero. Taking a long term perspective, in principle some EU-12 MS to be found in this group may have the potential to increase their domestic milk production, but deficits in infrastructure, processing and marketing hinder this potential. This is the explanation for e.g. Hungary, in which farmers are hardly organized by co-operations and one expects the closure of several dairy plants if prices fall due to quota abolition.
Under scenario Milk 1, collectively these changes in production represent a 3.5% increase in EU milk production by 2015 with an eventual increase in EU milk production of almost 5% by 2020 relative to the baseline. It is notable that this increase in production is the sum of both positive and negative MS changes in production relative to the baseline. Figure 6-5 summarises the EU outcome under scenario Milk 1.
Results of the quantitative approach
49
Figure 6-5: Change in EU milk production and price under scenario Milk 1 (relative to the baseline)
% Change in EU milk production (scenario Milk1) % Change in EU milk price (scenario Milk1)
0.0
1.0
2.0
3.0
4.0
5.0
6.0
2010 2012 2014 2016 2018 2020
per c
ent
-10.0
-8.0
-6.0
-4.0
-2.0
0.02010 2012 2014 2016 2018 2020
per c
ent
Source: AGMEMOD Model 2008
By 2020 the EU milk price decrease is just about 7% under this scenario relative to the baseline. At EU aggregate level, production continues to expand once milk quotas are removed and the milk price continues to fall, but the change relative to the milk quota period is small. This development relies on the quite favourable world market price outlook, which indicates that domestic prices can exceed the low price levels that have occurred from time to time in the 2000 to 2005 period. Under the condition of a favourable world market situation, the requirements for intervention buying will be quite small and may occur only when the farmers’ production response to a quota abolition will be over-shooting in a short-term perspective. However, a negative deviation from the positive world prices outlook will manifest itself in lower domestic prices, and hence reduce the extent of the milk production increase in the scenarios.
Scenario Milk 2: The change in EU milk production under scenario Milk 2 can be summarised as follows:
Countries that expand production by the full amount of the quota increase:
• Ireland Countries that expand production by less than the full amount of quota increase:
• Austria, Belgium, Denmark, Finland, France, Germany, Greece, Italy, Latvia, Lithuania, the Netherlands, Poland, Portugal and Spain
Countries that contract production relative to the existing milk quota:
• Bulgaria, Hungary, Romania, Slovenia, Sweden, and UK.
Under scenario Milk 2 in aggregate these changes in production represent a 3.5% increase in EU milk production by 2015 with an eventual increase in EU milk production of 4.8% by 2020. As with scenario Milk 1, it is notable that this increase in production is the sum of both positive and negative MS changes in production relative to the baseline. By 2020 the EU milk price decreases more than 7% under this scenario relative to the baseline. Figure 6-6 summarises the EU outcome under scenario Milk 2. However, the most notable feature of the results is that the increase in EU milk production is well below the milk quota increase. While Ireland fully utilises the quota increase, its total production is small in overall EU terms (6.3 mt in 2020) and has minimal impact on the overall EU outcome.
Results of the quantitative approach
50
Figure 6-6: Change in EU milk production and price under scenario Milk 2 (relative to the baseline)
% Change in EU milk production (scenario Milk2) % Change in EU milk price (scenario Milk2)
0.0
1.0
2.0
3.0
4.0
5.0
6.0
2010 2012 2014 2016 2018 2020
per c
ent
-10.0
-8.0
-6.0
-4.0
-2.0
0.02010 2012 2014 2016 2018 2020
per c
ent
Source: AGMEMOD Model 2008
Scenario Milk 3: The change in EU milk production under scenario Milk 3 can be summarised as follows:
Countries that expand production by the full amount of the quota increase:
• Belgium, France, Germany, Ireland, Italy, Portugal, Spain, the Netherlands, Lithuania and Poland
Countries that expand production by less than the full amount of quota increase:
• Austria, the Czech Republic, Denmark, Estonia, Finland, Greece, Latvia, Italy and the Slovak Republic
Countries that contract production relative to the existing milk quota:
• Bulgaria, Hungary, Romania, Slovenia, Sweden, and UK
Under scenario Milk 3 in aggregate these changes in production represent a 3% increase in EU milk production by 2015 with an eventual increase in EU milk production of 4.3% by 2020. By 2020 the EU milk price decreases by 8 percent under this scenario relative to the baseline. The outcome in scenario Milk 3 differs from scenario Milk 1 in that the expansion of production is marginally smaller due to the reduction of the intervention price, which depresses the milk price more than in scenario Milk 1. But this price effect is quite limited as the domestic whole sale price for butter does not follow the full cut of the butter intervention price. When the domestic key price drops to the world market price level, the intervention price is replaced by the now higher world market price for butter as the support price, a development which had already happened in the case of SMP. Figure 6-7 summarises the EU outcome under scenario Milk 3.
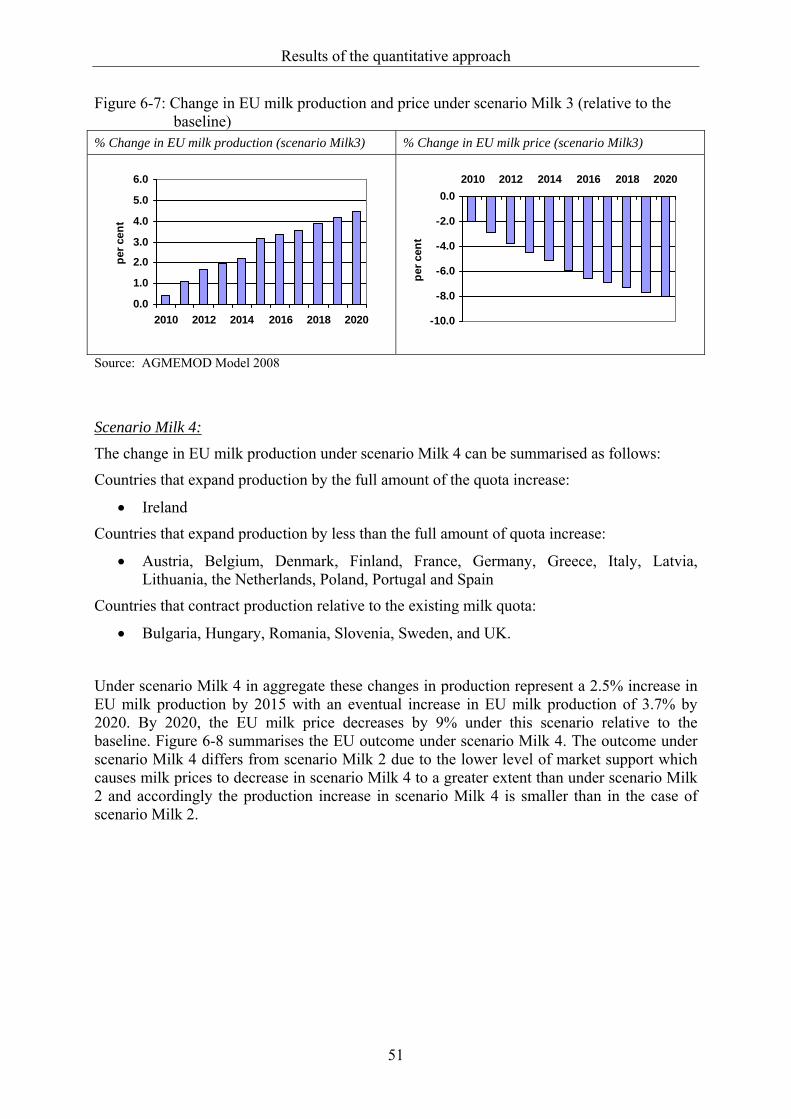
Results of the quantitative approach
51
Figure 6-7: Change in EU milk production and price under scenario Milk 3 (relative to the baseline)
% Change in EU milk production (scenario Milk3) % Change in EU milk price (scenario Milk3)
0.0
1.0
2.0
3.0
4.0
5.0
6.0
2010 2012 2014 2016 2018 2020
per c
ent
-10.0
-8.0
-6.0
-4.0
-2.0
0.02010 2012 2014 2016 2018 2020
per c
ent
Source: AGMEMOD Model 2008
Scenario Milk 4: The change in EU milk production under scenario Milk 4 can be summarised as follows:
Countries that expand production by the full amount of the quota increase:
• Ireland Countries that expand production by less than the full amount of quota increase:
• Austria, Belgium, Denmark, Finland, France, Germany, Greece, Italy, Latvia, Lithuania, the Netherlands, Poland, Portugal and Spain
Countries that contract production relative to the existing milk quota:
• Bulgaria, Hungary, Romania, Slovenia, Sweden, and UK.
Under scenario Milk 4 in aggregate these changes in production represent a 2.5% increase in EU milk production by 2015 with an eventual increase in EU milk production of 3.7% by 2020. By 2020, the EU milk price decreases by 9% under this scenario relative to the baseline. Figure 6-8 summarises the EU outcome under scenario Milk 4. The outcome under scenario Milk 4 differs from scenario Milk 2 due to the lower level of market support which causes milk prices to decrease in scenario Milk 4 to a greater extent than under scenario Milk 2 and accordingly the production increase in scenario Milk 4 is smaller than in the case of scenario Milk 2.
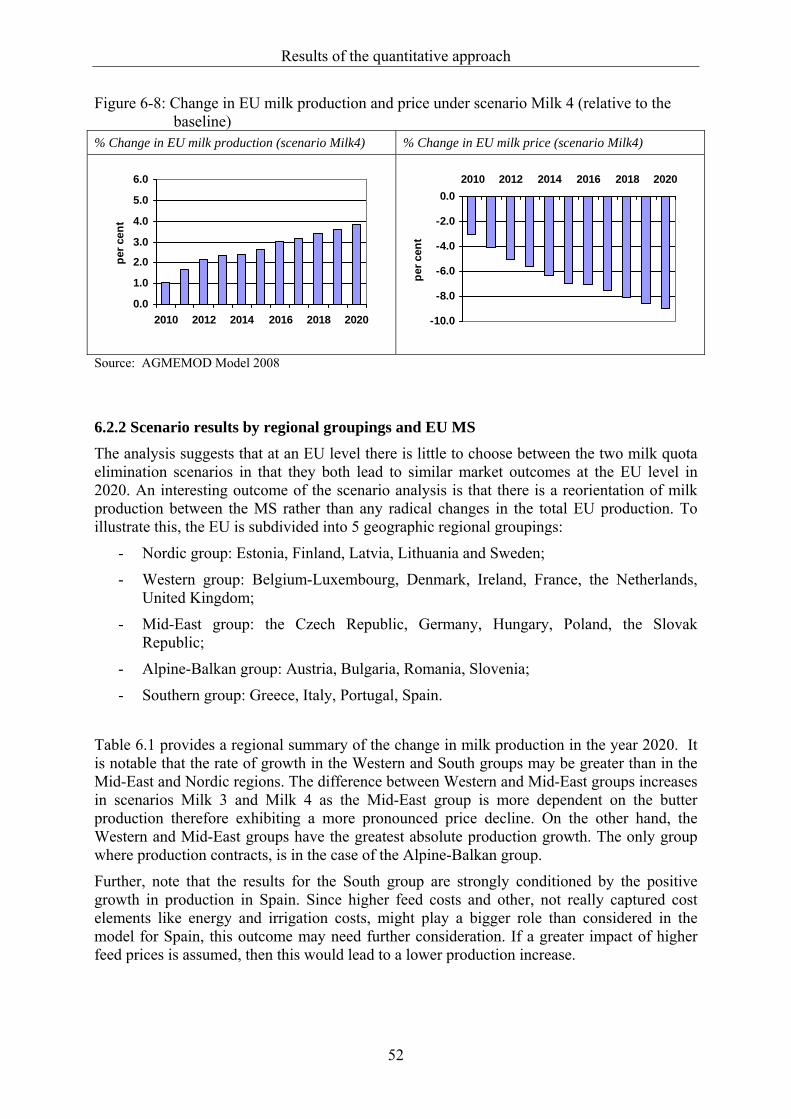
Results of the quantitative approach
52
Figure 6-8: Change in EU milk production and price under scenario Milk 4 (relative to the baseline)
% Change in EU milk production (scenario Milk4) % Change in EU milk price (scenario Milk4)
0.0
1.0
2.0
3.0
4.0
5.0
6.0
2010 2012 2014 2016 2018 2020
per c
ent
-10.0
-8.0
-6.0
-4.0
-2.0
0.02010 2012 2014 2016 2018 2020
per c
ent
Source: AGMEMOD Model 2008
6.2.2 Scenario results by regional groupings and EU MS
The analysis suggests that at an EU level there is little to choose between the two milk quota elimination scenarios in that they both lead to similar market outcomes at the EU level in 2020. An interesting outcome of the scenario analysis is that there is a reorientation of milk production between the MS rather than any radical changes in the total EU production. To illustrate this, the EU is subdivided into 5 geographic regional groupings:
- Nordic group: Estonia, Finland, Latvia, Lithuania and Sweden;
- Western group: Belgium-Luxembourg, Denmark, Ireland, France, the Netherlands, United Kingdom;
- Mid-East group: the Czech Republic, Germany, Hungary, Poland, the Slovak Republic;
- Alpine-Balkan group: Austria, Bulgaria, Romania, Slovenia;
- Southern group: Greece, Italy, Portugal, Spain.
Table 6.1 provides a regional summary of the change in milk production in the year 2020. It is notable that the rate of growth in the Western and South groups may be greater than in the Mid-East and Nordic regions. The difference between Western and Mid-East groups increases in scenarios Milk 3 and Milk 4 as the Mid-East group is more dependent on the butter production therefore exhibiting a more pronounced price decline. On the other hand, the Western and Mid-East groups have the greatest absolute production growth. The only group where production contracts, is in the case of the Alpine-Balkan group.
Further, note that the results for the South group are strongly conditioned by the positive growth in production in Spain. Since higher feed costs and other, not really captured cost elements like energy and irrigation costs, might play a bigger role than considered in the model for Spain, this outcome may need further consideration. If a greater impact of higher feed prices is assumed, then this would lead to a lower production increase.
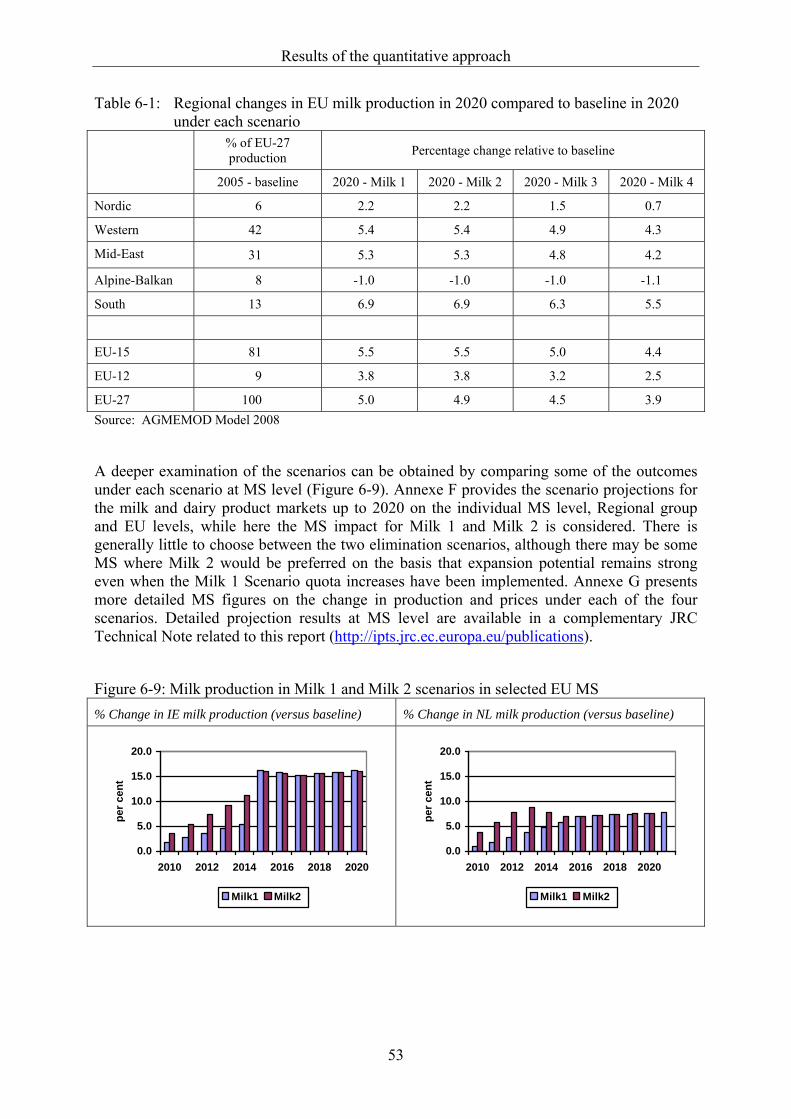
Results of the quantitative approach
53
Table 6-1: Regional changes in EU milk production in 2020 compared to baseline in 2020 under each scenario
% of EU-27 production Percentage change relative to baseline
2005 - baseline 2020 - Milk 1 2020 - Milk 2 2020 - Milk 3 2020 - Milk 4
Nordic 6 2.2 2.2 1.5 0.7
Western 42 5.4 5.4 4.9 4.3
Mid-East 31 5.3 5.3 4.8 4.2
Alpine-Balkan 8 -1.0 -1.0 -1.0 -1.1
South 13 6.9 6.9 6.3 5.5
EU-15 81 5.5 5.5 5.0 4.4
EU-12 9 3.8 3.8 3.2 2.5
EU-27 100 5.0 4.9 4.5 3.9 Source: AGMEMOD Model 2008
A deeper examination of the scenarios can be obtained by comparing some of the outcomes under each scenario at MS level (Figure 6-9). Annexe F provides the scenario projections for the milk and dairy product markets up to 2020 on the individual MS level, Regional group and EU levels, while here the MS impact for Milk 1 and Milk 2 is considered. There is generally little to choose between the two elimination scenarios, although there may be some MS where Milk 2 would be preferred on the basis that expansion potential remains strong even when the Milk 1 Scenario quota increases have been implemented. Annexe G presents more detailed MS figures on the change in production and prices under each of the four scenarios. Detailed projection results at MS level are available in a complementary JRC Technical Note related to this report (http://ipts.jrc.ec.europa.eu/publications).
Figure 6-9: Milk production in Milk 1 and Milk 2 scenarios in selected EU MS % Change in IE milk production (versus baseline) % Change in NL milk production (versus baseline)
0.0
5.0
10.0
15.0
20.0
2010 2012 2014 2016 2018 2020
per c
ent
Milk1 Milk2
0.0
5.0
10.0
15.0
20.0
2010 2012 2014 2016 2018 2020
per c
ent
Milk1 Milk2
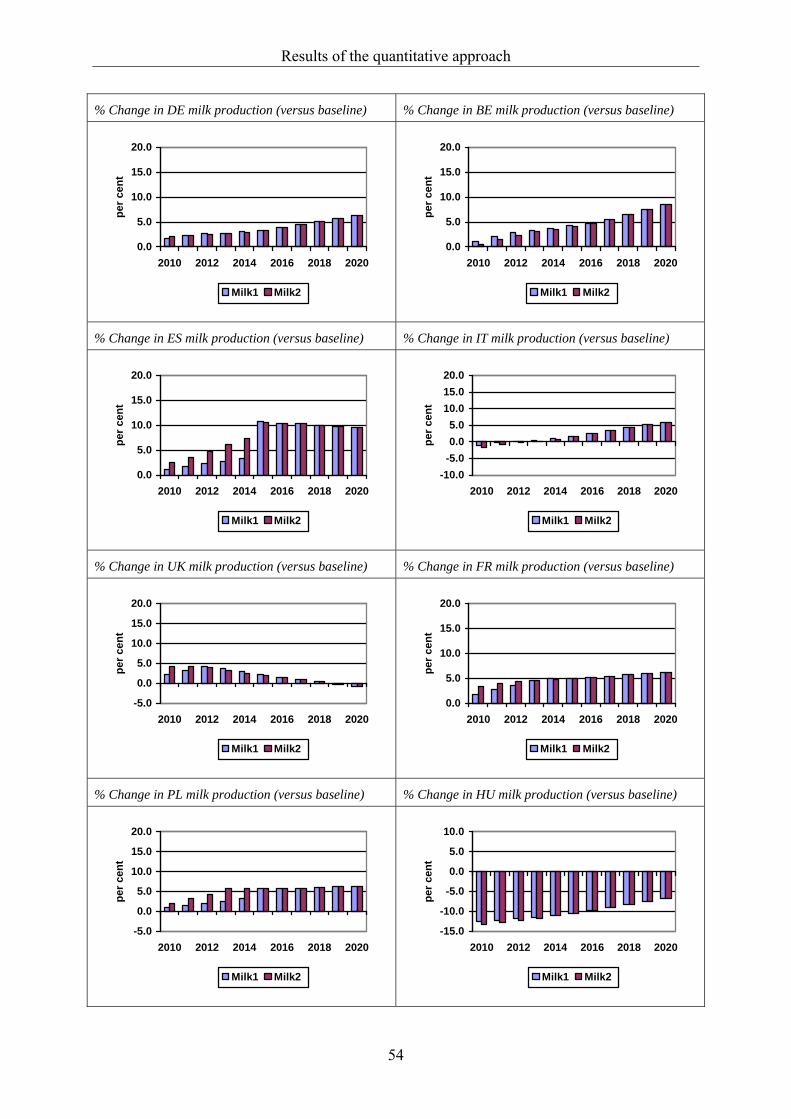
Results of the quantitative approach
54
% Change in DE milk production (versus baseline) % Change in BE milk production (versus baseline)
0.0
5.0
10.0
15.0
20.0
2010 2012 2014 2016 2018 2020
per c
ent
Milk1 Milk2
0.0
5.0
10.0
15.0
20.0
2010 2012 2014 2016 2018 2020
per c
ent
Milk1 Milk2
% Change in ES milk production (versus baseline) % Change in IT milk production (versus baseline)
0.0
5.0
10.0
15.0
20.0
2010 2012 2014 2016 2018 2020
per c
ent
Milk1 Milk2
-10.0-5.00.05.0
10.015.020.0
2010 2012 2014 2016 2018 2020
per c
ent
Milk1 Milk2
% Change in UK milk production (versus baseline) % Change in FR milk production (versus baseline)
-5.0
0.0
5.0
10.0
15.0
20.0
2010 2012 2014 2016 2018 2020
per c
ent
Milk1 Milk2
0.0
5.0
10.0
15.0
20.0
2010 2012 2014 2016 2018 2020
per c
ent
Milk1 Milk2
% Change in PL milk production (versus baseline) % Change in HU milk production (versus baseline)
-5.0
0.0
5.0
10.0
15.0
20.0
2010 2012 2014 2016 2018 2020
per c
ent
Milk1 Milk2
-15.0
-10.0
-5.0
0.0
5.0
10.0
2010 2012 2014 2016 2018 2020
per c
ent
Milk1 Milk2
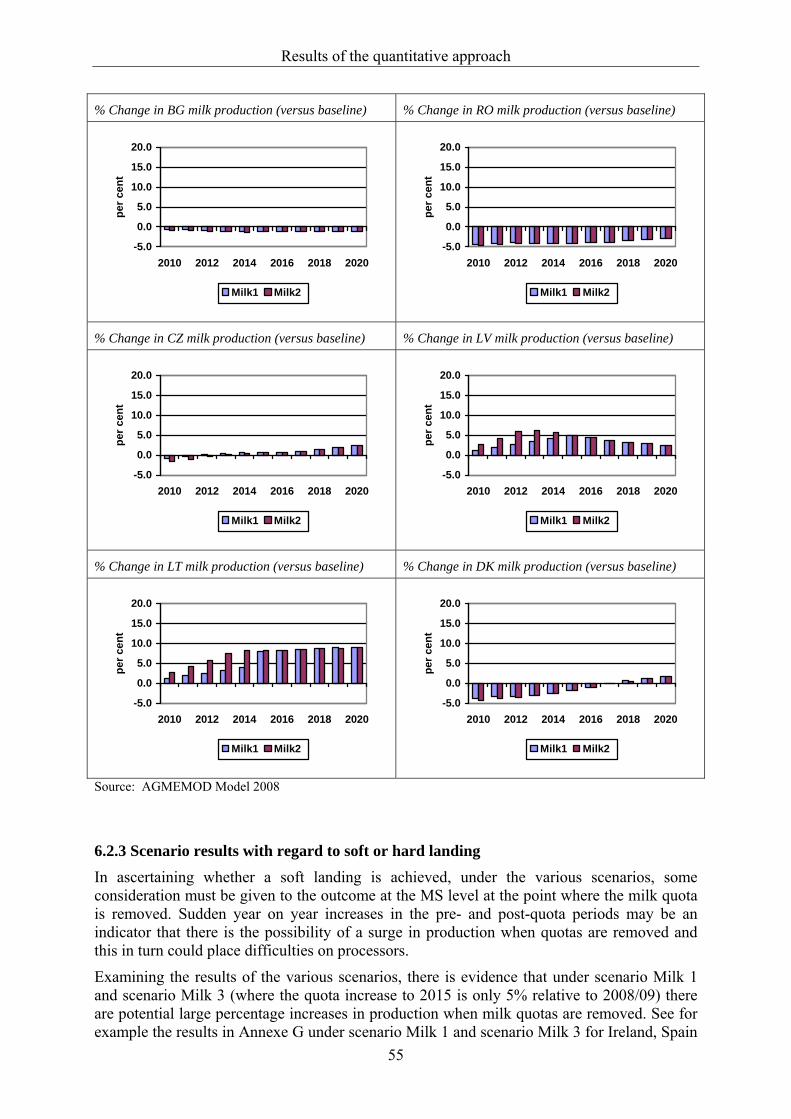
Results of the quantitative approach
55
% Change in BG milk production (versus baseline) % Change in RO milk production (versus baseline)
-5.0
0.0
5.0
10.0
15.0
20.0
2010 2012 2014 2016 2018 2020
per c
ent
Milk1 Milk2
-5.0
0.0
5.0
10.0
15.0
20.0
2010 2012 2014 2016 2018 2020
per c
ent
Milk1 Milk2
% Change in CZ milk production (versus baseline) % Change in LV milk production (versus baseline)
-5.0
0.0
5.0
10.0
15.0
20.0
2010 2012 2014 2016 2018 2020
per c
ent
Milk1 Milk2
-5.0
0.0
5.0
10.0
15.0
20.0
2010 2012 2014 2016 2018 2020
per c
ent
Milk1 Milk2
% Change in LT milk production (versus baseline) % Change in DK milk production (versus baseline)
-5.0
0.0
5.0
10.0
15.0
20.0
2010 2012 2014 2016 2018 2020
per c
ent
Milk1 Milk2
-5.0
0.0
5.0
10.0
15.0
20.0
2010 2012 2014 2016 2018 2020
per c
ent
Milk1 Milk2
Source: AGMEMOD Model 2008
6.2.3 Scenario results with regard to soft or hard landing In ascertaining whether a soft landing is achieved, under the various scenarios, some consideration must be given to the outcome at the MS level at the point where the milk quota is removed. Sudden year on year increases in the pre- and post-quota periods may be an indicator that there is the possibility of a surge in production when quotas are removed and this in turn could place difficulties on processors.
Examining the results of the various scenarios, there is evidence that under scenario Milk 1 and scenario Milk 3 (where the quota increase to 2015 is only 5% relative to 2008/09) there are potential large percentage increases in production when milk quotas are removed. See for example the results in Annexe G under scenario Milk 1 and scenario Milk 3 for Ireland, Spain
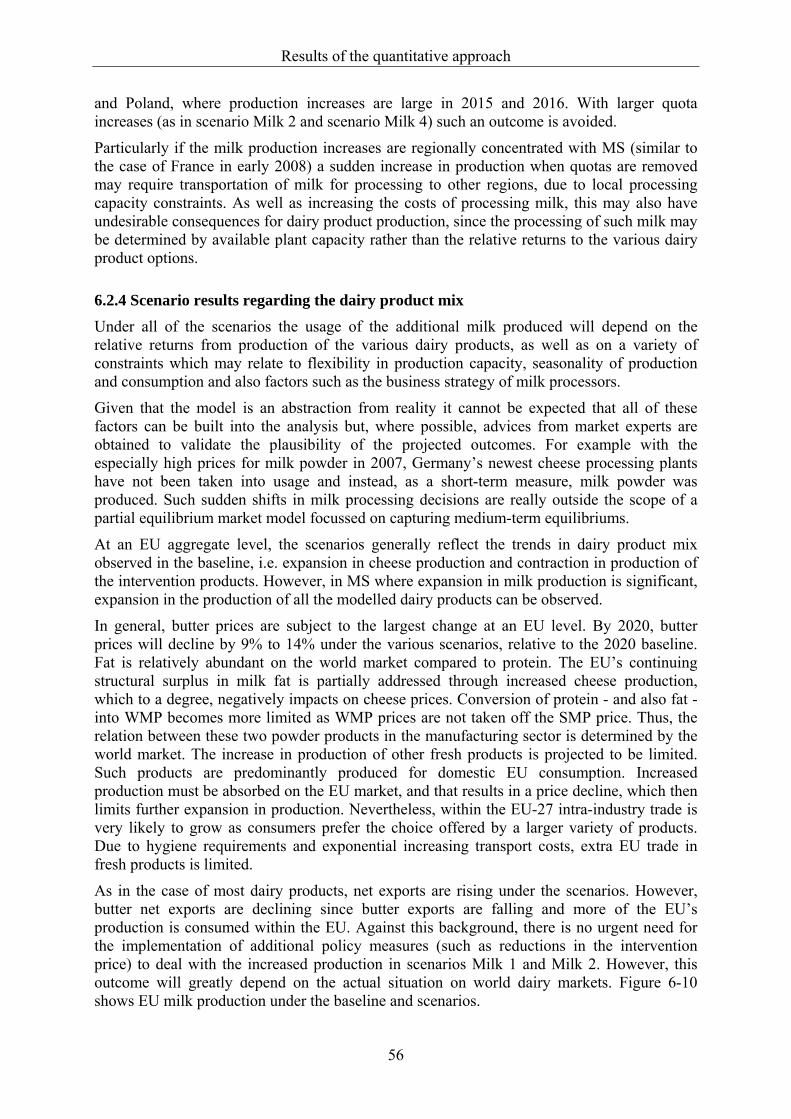
Results of the quantitative approach
56
and Poland, where production increases are large in 2015 and 2016. With larger quota increases (as in scenario Milk 2 and scenario Milk 4) such an outcome is avoided.
Particularly if the milk production increases are regionally concentrated with MS (similar to the case of France in early 2008) a sudden increase in production when quotas are removed may require transportation of milk for processing to other regions, due to local processing capacity constraints. As well as increasing the costs of processing milk, this may also have undesirable consequences for dairy product production, since the processing of such milk may be determined by available plant capacity rather than the relative returns to the various dairy product options.
6.2.4 Scenario results regarding the dairy product mix Under all of the scenarios the usage of the additional milk produced will depend on the relative returns from production of the various dairy products, as well as on a variety of constraints which may relate to flexibility in production capacity, seasonality of production and consumption and also factors such as the business strategy of milk processors.
Given that the model is an abstraction from reality it cannot be expected that all of these factors can be built into the analysis but, where possible, advices from market experts are obtained to validate the plausibility of the projected outcomes. For example with the especially high prices for milk powder in 2007, Germany’s newest cheese processing plants have not been taken into usage and instead, as a short-term measure, milk powder was produced. Such sudden shifts in milk processing decisions are really outside the scope of a partial equilibrium market model focussed on capturing medium-term equilibriums.
At an EU aggregate level, the scenarios generally reflect the trends in dairy product mix observed in the baseline, i.e. expansion in cheese production and contraction in production of the intervention products. However, in MS where expansion in milk production is significant, expansion in the production of all the modelled dairy products can be observed.
In general, butter prices are subject to the largest change at an EU level. By 2020, butter prices will decline by 9% to 14% under the various scenarios, relative to the 2020 baseline. Fat is relatively abundant on the world market compared to protein. The EU’s continuing structural surplus in milk fat is partially addressed through increased cheese production, which to a degree, negatively impacts on cheese prices. Conversion of protein - and also fat - into WMP becomes more limited as WMP prices are not taken off the SMP price. Thus, the relation between these two powder products in the manufacturing sector is determined by the world market. The increase in production of other fresh products is projected to be limited. Such products are predominantly produced for domestic EU consumption. Increased production must be absorbed on the EU market, and that results in a price decline, which then limits further expansion in production. Nevertheless, within the EU-27 intra-industry trade is very likely to grow as consumers prefer the choice offered by a larger variety of products. Due to hygiene requirements and exponential increasing transport costs, extra EU trade in fresh products is limited.
As in the case of most dairy products, net exports are rising under the scenarios. However, butter net exports are declining since butter exports are falling and more of the EU’s production is consumed within the EU. Against this background, there is no urgent need for the implementation of additional policy measures (such as reductions in the intervention price) to deal with the increased production in scenarios Milk 1 and Milk 2. However, this outcome will greatly depend on the actual situation on world dairy markets. Figure 6-10 shows EU milk production under the baseline and scenarios.
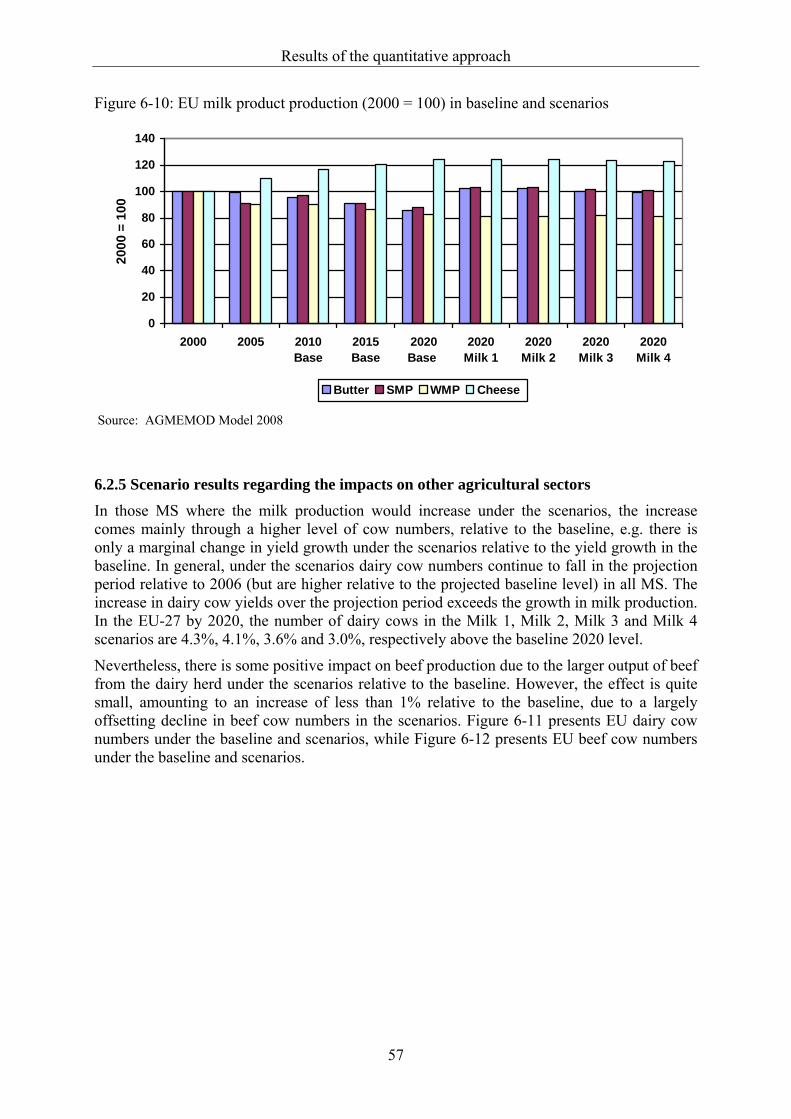
Results of the quantitative approach
57
Figure 6-10: EU milk product production (2000 = 100) in baseline and scenarios
0
20
40
60
80
100
120
140
2000 2005 2010Base
2015Base
2020Base
2020Milk 1
2020Milk 2
2020Milk 3
2020Milk 4
2000
= 1
00
Butter SMP WMP Cheese
Source: AGMEMOD Model 2008
6.2.5 Scenario results regarding the impacts on other agricultural sectors In those MS where the milk production would increase under the scenarios, the increase comes mainly through a higher level of cow numbers, relative to the baseline, e.g. there is only a marginal change in yield growth under the scenarios relative to the yield growth in the baseline. In general, under the scenarios dairy cow numbers continue to fall in the projection period relative to 2006 (but are higher relative to the projected baseline level) in all MS. The increase in dairy cow yields over the projection period exceeds the growth in milk production. In the EU-27 by 2020, the number of dairy cows in the Milk 1, Milk 2, Milk 3 and Milk 4 scenarios are 4.3%, 4.1%, 3.6% and 3.0%, respectively above the baseline 2020 level.
Nevertheless, there is some positive impact on beef production due to the larger output of beef from the dairy herd under the scenarios relative to the baseline. However, the effect is quite small, amounting to an increase of less than 1% relative to the baseline, due to a largely offsetting decline in beef cow numbers in the scenarios. Figure 6-11 presents EU dairy cow numbers under the baseline and scenarios, while Figure 6-12 presents EU beef cow numbers under the baseline and scenarios.
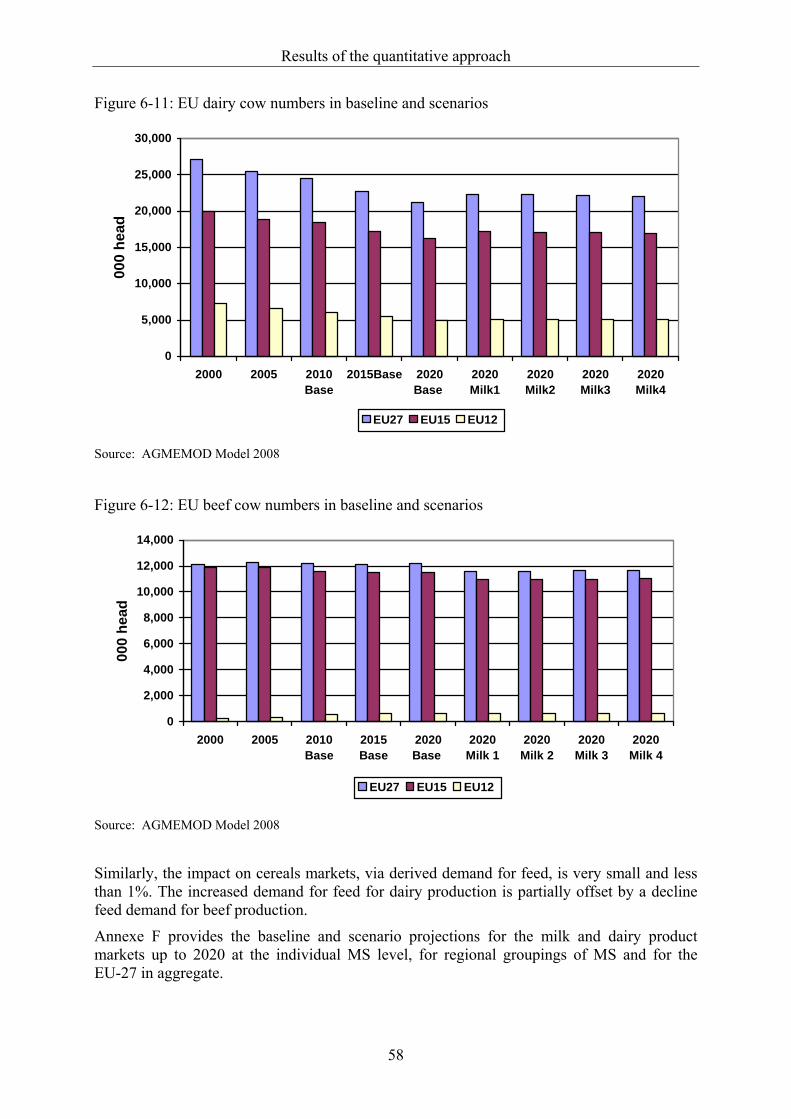
Results of the quantitative approach
58
Figure 6-11: EU dairy cow numbers in baseline and scenarios
0
5,000
10,000
15,000
20,000
25,000
30,000
2000 2005 2010Base
2015Base 2020Base
2020Milk1
2020Milk2
2020Milk3
2020Milk4
000
head
EU27 EU15 EU12
Source: AGMEMOD Model 2008
Figure 6-12: EU beef cow numbers in baseline and scenarios
0
2,000
4,000
6,000
8,000
10,000
12,000
14,000
2000 2005 2010Base
2015Base
2020Base
2020Milk 1
2020Milk 2
2020Milk 3
2020Milk 4
000
head
EU27 EU15 EU12
Source: AGMEMOD Model 2008
Similarly, the impact on cereals markets, via derived demand for feed, is very small and less than 1%. The increased demand for feed for dairy production is partially offset by a decline feed demand for beef production.
Annexe F provides the baseline and scenario projections for the milk and dairy product markets up to 2020 at the individual MS level, for regional groupings of MS and for the EU-27 in aggregate.
59
7 Conclusions The EU milk quota regime is one of the most important elements of the CMO for milk and milk products. However, in the context of the CAP Health Check the European Commission made clear its intention not to extend the dairy quota regime beyond 2015. This study provides an in-depth model based quantitative analysis of possible implications of a dairy policy reform on the milk and dairy market as well as on other agricultural markets in the EU. The objectives of the study are threefold:
• to assess the implications of changing policy and market conditions for EU agriculture, with special emphasis on milk quota phasing-out and export subsidy removal, by using a modelling tool that allows for regional and sectoral differentiations;
• to carry out policy relevant scenarios reflecting the impacts of different forms of deregulation (e.g. quota abolition and expanded quotas), the changes in quota and price levels; and
• to analyse the implications of policy reform scenarios and to draw appropriate policy recommendations.
For the quantitative analysis the AGMEMOD (AGricultural MEmber states MODelling) model Version 2.0 has been applied. AGMEMOD is an econometric, dynamic, partial equilibrium, multi-country, multi-market model for EU agriculture at the MS level. Based on a set of commodity specific templates, country specific models are developed to reflect the details of agriculture at MS level and at the same time allow for their combination in an EU model. The close adherence to templates assures the analytical consistency across the country models, which is essential for the aggregation towards an EU level and in addition also facilitates the comparison of the impact of a policy change across different MS.
Projections are generated from 2006 until 2020. The baseline reflects agreed agricultural policy at the time that the analysis was completed in May 2008. For example the baseline includes the Luxembourg Agreement of 2003 and the 2008/09 quota expansion package agreed in March 2008. In view of the elevated price of cereals, the suspension of the set-aside regime agreed in 2007 is carried forward through the projection period. The baseline projections are contrasted with four scenario of the EU milk quota expansion in advance of its elimination.
Baseline results show a decline of EU dairy commodity and milk prices from the elevated levels of 2007 over the period 2008 and 2009. However, the medium term trend is for prices to be maintained at a level above those observed in the earlier part of this decade. Since EU production is virtually unchanged and consumption is increasing, the amount of dairy product available for export declines. Projections indicate a strong EU domestic demand for cheese, which causes increases in cheese production in the baseline, while production of butter and SMP decreases. As milk yields increase by about 1% per year, there is an offsetting reduction in the number of dairy cows. This implies that the contribution of the dairy sector towards EU beef output declines over time.
Scenario results indicate, that external factors relating to global supply and demand for dairy products (as reflected in the baseline) are a more important determinant of the future level of EU dairy product prices, milk prices and dairy production than are the changes in the milk quota regime which are examined.
Under the scenarios the change in product mix observed in the baseline is also a feature, but in addition some of the additional milk that is produced is channelled to all the major products.
Conclusions
60
The outcome under the milk quota expansion/elimination scenarios leads to conclusions which are broadly the same for the scenarios Milk 1 and Milk 2. EU dairy production increases by 2015 relative to the baseline by about 4% and there is a 5% reduction in the EU milk price as a result. This outcome is the sum of both increases and decreases in individual MS level milk production. Beyond 2015 there is more or less a stabilisation of production in most of the MS. Due to the further policy interventions in the second set of scenarios (Milk 3 and Milk 4) the outcome especially concerning prices is more marked.
EU MS can be categorised in accordance with the extent of the observed production increases (decreases). Grass based dairy producers, with high initial quota rents, are best placed to expand milk production under quota expansion and elimination. High feed prices drive rents to zero relatively quickly in MS with low initial rents and where grain feeding is the dominant production system. Few countries exploit the full extend of the quota increase available to them in the phase-out period, suggesting that the quota expansion allowed under the Milk 1 and Milk 3 scenarios is sufficient for most MS and a “hard landing” at EU level is avoided. A few MS continue to increase milk production once quotas are removed even under the Milk 2 and Milk 4 scenarios. This gives merit to consider larger quota increases for these MS, particularly given that their contribution to overall EU milk production is small. Such specific quota increases would avoid large production increases at the point where milk quotas are removed, which could otherwise have negative consequences for the sector in these MS over the short term.
The consequences of milk quota removal for other agricultural sectors are minimal. While there are projected to be more dairy cows (than in the baseline), this is offset by a reduction in the number of beef cows, so the net change in the total number of cattle is small relative to the baseline. Thus, the consequences of the scenarios for the derived demand for feed are insignificant.
As with all projections and policy simulations, the results described in this report are based on several explicit or implicit assumptions. Deviations from these assumptions may also alter the outcomes of the model simulations presented here. In this context it is worthwhile emphasising the following points:
• High world market prices for milk products are the essential drivers for domestic prices and partially also for processing decisions. Although world market prices are projected to remain high, there is an increased risk of volatile world price fluctuations;
• Higher production costs are projected to limit the growth potential. In this respect especially energy prices and their impact on the commodity prices as well as consumption prospects in general are important;
• Other issues for further discussion include the selection of quota rent values in the calibration year as well as the rate of technical progress and its transmission into the production costs used in the study.
Additional uncertainties that might govern the above mentioned include: further political support of bio-energy; further development of energy prices; increased occurrence of extreme weather conditions and water availabilities; development of exchange rates; and actual production potentials in emerging economies.
61
8 References
AGMEMOD database (2008): http://www.agmemod.org AGMEMOD Partnership (2008): Impact analysis of CAP reform on the main agricultural
commodities. JRC-IPTS scientific and technical reports. Editors: L. Bartova – R. M'barek. EUR Number: 22940 EN/1-5. http://ipts.jrc.ec.europa.eu/publications
Banse, M., S. Tangermann (1996): Agricultural implications of Hungary’s Accession to the EU – Partial versus general equilibrium effects. 50th EAAE Seminar “Economic Transition and the Greening of Policies: New Challenges for Agriculture and Agribusiness in Europe”, October 15 -17, 1996. Giessen, Germany.
Binfield, J., Donnellan, T., Hanrahan, K., and Westhoff, P. (2007): CAP Health Check analysis: Impact on EU milk quota expansion. Teagasc Rural Economy Research Series, report nr. 51. Teagasc Rural Economy Research Centre, Athenry, Ireland.
Bouamra-Mechemache, Z., Requillart, V., Burrell, A., Guyomard, H., Jongeneel, R., (2002): The INRA-Wageningen simulation system for the EU dairy sector. Abstract in: Salamon, P., 2002: Proposal for a thematic session “Modelling the phasing-out of milk quotas”. In: CD, containing the papers and abstracts of the EAAE Congress at Zaragoza 28-31 August 2002.
Bouamra-Mechemache, Z., Requillart, V. (2006): European Dairy Industry Model: Dairy Policy Simulations, EC FP6 Research Project, February 2006.
Cap Monitor (2007): Agra Infoma Ltd, Tunbridge Wells, Kent, England. Cathagne, A., Guyomard, H., Levert, F. (2006): Milk quotas in the European Union:
Distribution of marginal costs and quota rents. Working paper 01/2006. EDIM/INRA, France.
Chantreuil, F., Hanrahan, K., Levert, F. (2005): The Luxembourg Agreement Reform of the CAP: An analysis using the AG-MEMOD composite model. In: 89th EAAE Seminar: Modelling agricultural policies: state of the art and new challenges, 3-5 February 2005, Parma.
Chantreuil, F., and Levert, F. (2007): AGMEMOD database documentation. AGMEMOD WP3 P1 D3 document. http://www.agmemod.org/fp6fl/deliverables/D3/AGMEMOD-WP3-P1-D3.pdf
Colman, D., Burton, M.P., Rigby, D.S., Franks, J.R. (1998): An economic evaluation of the UK milk quota system. Report commissioned by MAFF, the Welsh Office Agricultural Department, Department of Agriculture for Northern Ireland and Scottish Office of Agriculture, Environment and Fisheries, CAFRE, School of Economic Studies, University of Manchester.
Colman, D. (ed.) (2002): Phasing out Milk Quotas in the EU. University of Manchester http://statistics.defra.gov.uk/esg/reports/milkquota
Esposti, R., Lo Bianco, A. (2005): Analysing the Impact of the CAP Reform on the Italian Crop production with the AG-MEMOD Model: the Case of Durum Wheat. In: 89th EAAE Seminar: Modelling agricultural policies: state of the art and new challenges, 3-5 February 2005, Parma.
European Commission (2002): Report on milk quotas. Commission working document. SEC (2002) 789 final. Brussels.
References
62
European Commission (2006): Costs of production for milk in the European Union – Period 1997 – 2003. Brussels.
European Commission (2006): Milk and Milk Products in the European Union. Brussels. European Commission (2007a): Preparing for the Health Check of the CAP reform.
Communication from the Commission to the European Parliament and the Council. http://ec.europa.eu/agriculture/healthcheck/index_en.htm
European Commission (2007b): Prospects for Agricultural Markets and income in the European Union 2007 – 2014. Brussels. http://ec.europa.eu/agriculture/publi/caprep/prospects2007b/index_en.htm
European Commission(2008): Proposal for a Council regulation establishing common rules for direct support schemes for farmers under the common agricultural policy and establishing certain support schemes for farmers COM(2008) 306/4, Brussels. http://ec.europa.eu/agriculture/healthcheck/prop_en.pdf
Esposti, R., Lo Bianco, A. (2005): Analysing the Impact of the CAP Reform on the Italian Crop production with the AG-MEMOD Model: the Case of Durum Wheat. In: 89th EAAE Seminar: Modelling agricultural policies: state of the art and new challenges, 3-5 February 2005, Parma.
Eurostat (2007): NewCronos database. http://epp.eurostat.cec.eu.int Faostat (2007): FAO Statistical database. http://faostat.fao.org/ FAPRI (2007): http://www.fapri.org and http://www.fapri.missouri.edu FAPRI (2008): http://www.fapri.org and http://www.fapri.missouri.edu Gracia, A., Casado, J. M. (2005) An Assessment of the Luxembourg Agreement on the
Spanish Agricultural Sector: an Econometric Model. In: 89th EAAE Seminar: Modelling agricultural policies: state of the art and new challenges, 3-5 February 2005, Parma.
Helming, J. and Peerlings, J. (2002): The impact of milk quota abolishment on Dutch agriculture and economy – applying an agricultural sector model integrated into a mixed input-output model. Paper presented at the 10th EAAE-Conference, August 28-31, 2002, in Zaragoza, Spain.
Helming, J.F.M. (2005): A model of Dutch agriculture based on Positive Mathematical Programming with regional and environmental applications. Online at http://www.lei.dlo.nl/publicaties/PDF/2005/PS_xxx/PS_05_02.pdf
Hennessy, T., Fingleton, W., Frawley, J., Keeney, M., and O Leary, E. (2000): The changing structure and production potential of Irish dairy farming in the context of quota abolition. Paper presented at the Teagasc Agri-Food Economics Conference, December 2000 in Dublin, Ireland.
Hennessy, T. (2007): FAPRI-Ireland CAP Health Check analysis: Farm level implications of EU milk quota expansion. Teagasc Rural Economy Research Series, report nr. 49. Teagasc Rural Economy Research Centre, Athenry, Ireland.
Hertel, Thomas (ed.) (1997): Global Trade Analysis: Modeling and Applications, Cambridge University Press.
Isermeyer, F., Brockmeier, M., Gömann, H., Hargens, R., Klepper, R., Kreins, P., Offermann, F., Osterburg, B., Pelikan, J., Salamon, P., Thiele, H., (2006): Analyse politischer Handlungsoptionen für den Milchmarkt. Landbauforschung Völkenrode Sonderheft 300, Braunschweig.
References
63
Jansson, T., and Britz, W. (2002): Experiences of using a quadratic programming model to simulate removal of milk quotas. Paper presented at the 10th EAAE-Conference, August 28-31, 2002 in Zaragoza, Spain.
Kleinhanss, W., Manegold, D., Bertelsmeier, M., Deeken, E., Giffhorn, E., Jägersberg, P., Offermann, F., Osterburg, B., Salamon, P. (2002): Phasing-out Milk Quotas – Possible Impacts on German Agriculture. Bundesforschungsanstalt für Landwirtschaft (FAL), Arbeitsbericht 01/2002, Braunschweig.
Leeuwen, M. van, Tabeau, A. (2005): Consequences of 2003 CAP Reform for Dutch Agriculture. In: 89th EAAE Seminar: Modelling agricultural policies: state of the art and new challenges, 3-5 February 2005, Parma.
Lips, M., and Rieder, P. (2002): Endogenous adjusted production quotas – the abolishment of the raw milk quota in the European Union. Paper presented at the 10th EAAE-Conference, August 28-31, 2002 in Zaragoza, Spain.
Lips, M., and Rieder, P. (2005): Abolition of Raw Milk Quota in the European Union: A CGE Analysis at the Member Country Level. Journal of Agricultural Economics 56 (1), 1–17.
OECD (2007): http://www.agri-outlook.org Réquillart. V., Bouamra-Mechemache, Z, Jongeneel, R. and Penel C. (2008): Economic
analysis of the effects of the expiry of the EU milk quota system. Report prepared for the European Commission, IDEI, Toulouse.
Salamon, P., Bertelsmeier, M., Jägersberg, P., v. Ledebur, O. (2002): Modelling the phasing-out of milk quotas in Europe – an overview. Paper prepared for the 10th EAAE conference, August 28-31 2002, Zaragoza, Spain.
Salamon, P., von Ledebur, O., Heiden, M. (2006): Der europäische Milchmarkt zwischen Reform und Liberalisierung. Paper at the 46th Jahrestagung der Gesellschaft für Wirtschafts- und Sozialwissenschaften des Landbaus an der Justus-Liebig-Universität Gießen, 04-06 Oktober 2006.
Salamon, P. (2006): Wohin bewegt sich der Milchpreis in Deutschland und der EU? Landbauforschung Völkenrode Sonderheft 299, Braunschweig, ISBN10:3-86576-023-6.
Salamon, P., Heiden, M., von Ledebur, O. (2007). The EU dairy market imprisoned between CAP and international market. Contributed paper for the 6th Congresso Internacional do Leite, December 04-06 2007, Brasil.
Salvatici, L., G. Anania, F. Arfini, P. Conforti, P. De Muro, P. Londero, P. Sckokai (2001): Recent developments in modelling the CAP: hype or hope? In: Agricultural Sector Modelling and Policy Information Systems. Hecklei T., Witzke P., Henrichsmeyer W. (eds.). Wissenschaftverlag Vauk, Kiel.
Sckokai, P. (2003): Estimating milk supply response under quota trade: The simulation of quota removal in Italy. Contributed paper presented at the International Conference Agricultural policy reform and the WTO: where are we heading. June 23-26, 2003, Capri, Italy.
Sckokai, P. (2006): Do estimated quota rents reflect the competitiveness of the EU dairy industry? The Rural Economy Research Centre (RERC), TEAGASC seminar.
Tyers, R., K. Anderson (1992): Disarray in World Food Markets. A Quantitative Assessment. Cambridge University Press. Cambridge.
USDA – Economic Research Service (2007): http://www.ers.usda.gov Van Berkum, S., and J. Helming (2006): European dairy policy in the years to come.
Wageningen UR, The Hague.
References
64
Van Tongeren, F., H. van Meijl, Y. Surry (2001): Global models applied to agricultural and trade policies: A review and assessment. Agricultural Economics, 26:149–172.
Van Tongeren, F. (2002): Forward-looking analysis of reforms of the EU dairy policy. Presented at the 10th EAAE Conference, August 28-31, 2002 in Zaragoza, Spain.
Von Ledebur, E., Salamon, P., Weber, G. (2005): Who is Telling the Truth? Synthetic Uniformly Structured or Econometric Country Specific Models – a Model Comparison based on the Luxembourg Agreement. In: 89th EAAE Seminar: Modelling agricultural policies: state of the art and new challenges, 3-5 February 2005, Parma.
Westhoff, P., and Young, R. (1999): Elimination or expansion of milk quotas – impacts on European milk supply, demand and prices. Paper presented to the dairy research symposium, October 1999, Kansas City.
Zentrale Markt- und Preisberichtsstelle (ZMP) (2007): Marktbilanz Milch, various years.
65
Annexe A: Overview on approaches to model milk quota abolition A broad selection of modelling approaches has already been applied in the previous debate on quota abolition during the Agenda 2000 Reform (Salamon et al, 2002). Such questions are evaluated by employing computable general equilibrium (CGE), partial equilibrium (PE) and programming modelling systems. Although PE models may display a considerable amount of detailed policy instruments, when a particular sector is studied, this often will require refinement of the approach employed. This is especially the case when the complex dairy sector is studied, requiring a multi-level, multi-input, multi-output approach. The challenges intensify when policy scenarios such as quota abolition are studied, given supply functions have to be specified, bearing in mind that the available historical data has been derived under quota conditions.
Since the prospect of an extension or elimination of the milk quota system has arisen during discussions on previous CAP reforms, there is a body of study which has addressed the topic of the impacts of its abolition. A wide variety of contributions were made in advance of the previous reforms to shed some light on the issue. Most of the research was model-based, but some also encompassed different approaches (Colman, 1998, 2002; European Commission, 2002; Helming et al., 2000; Hennessy et al., 2000; Jansson and Britz, 2002; Kleinhanss et al., 2002; Lips et al., 2002; Lips et al., 2005; Van Tongeren, 2002, Westhoff and Young, 1999). An overview of these studies can be found in Salamon (2002). Since then, some of these studies have been revised and extended notably (Bouamra-Mechemache and Requillart, 2006; Helming, 2005); Van Berkum and Helming, 2006; Hennessy, 2007; Binfield et al., 2007; Isermeyer et al., 2006; Requillart et al., 2008). Other studies are in preparation or have yet to be published.
So far, nearly all approaches are derived from microeconomic theory, with the exception of the Irish studies. These Irish studies supplemented microeconomic theory with survey techniques (Hennessy et al., 2000), while conclusions were drawn on an impact analysis of hypothetical milk quota abolition under Agenda 2000. The study was based on a data survey of 490 specialised dairy farms in 1999. Information on factor availability and intermediate inputs are supplemented by more qualitative data like farmers’ attitudes and plans for future investments including the likelihood of a continuation of dairy farming. Future production potential in 2008 is based on possible cow stocks as well as on possible efficiency gains. The latter are derived synthetically from a literature survey, National Farm Survey data (similar to FADN) and most notably from expert assessments. The calculated impact on income assumes full implementation of estimated production potentials. Additionally, possible investment decisions and resulting income effects are also analysed. Results for 2008 represent short term and long term impacts.
In contrast, more recent Irish studies (Hennessy, 2007 and Binfield et al., 2007) combines market level results based on the PE FAPRI-GOLD and FAPRI-Ireland model with a case study, in which the modelled price and cost projections are applied to 2006 Irish National Farm Survey data (Hennessy, 2007, p.1).
Various models which differ significantly have been employed to model quota abolition. Often several models are operated in unison to enable an in-depth analysis, most notably where commodity market level models and farm level models are applied to the analysis of a common set of scenarios. Studies simulating quota abolition have drawn on CGE models (Lips et al., 2002; Lips et al., 2005; Van Tongeren, 2002; Isermeyer et al., 2006), PE models covering either the whole agricultural sector (Kleinhanss et al., 2002; Jansson and Britz, 2002) or focussing exclusively on the dairy sector (Kleinhanss et al., 2002; Bouamra-Mechemache et al., 2002), econometric supply models (Bouamra-Mechemache et al., 2002;
Annexe A: Overview on approaches to model milk quota abolition
66
Bouamra-Mechemache and Requillart, 2006), various types of (regional) programming models (Helming, 2005); Van Berkum and Helming, 2006; Kleinhanss et al., 2002; Isermeyer, et. al., 2006; Colman et al., 2002; Jansson and Britz, 2002) and expert based simulation models (Kleinhanss et al., 2002).
Annexe A 1: CGE models The distinction of CGE models is that they allow for the analysis of economy wide effects. In this context, studies using CGE approaches employ the GTAP (Global Trade Analysis Project) model (Hertel, 1997). The GTAP model is a comparative-static, multi-regional and multi-sector model with a database of 87 regions including the 27 MS of the EU, and 57 sectors, of which 2 sectors focus on dairy, namely raw milk (primary agricultural sector) and dairy products (the processed food sector). Regional and sectoral coverage can be aggregated according to the particular problem at hand. Trade is represented by bilateral trade matrices based on the Armington assumption. In general, policy scenarios are modelled as price wedges, but also income transfers and direct payments are implemented. In principle, quantitative measures are implemented as tariff equivalents. However, in these studies the standard versions of GTAP have been extended to introduce other additional measures, including milk quotas. Here, based on a complementary approach, quantitative restrictions have been established enabling an endogenous switch from a binding to a non-binding status and vice versa. The model can endogenously adjust both the quantity produced and the quota rent. Differences are to be found in where the restriction is applied (raw milk or dairy products), how the restriction is handled (output tax or additional primary factor), in the size of quota rents, and in the implementation of other EU market policies such as intervention prices and restrictions on EU export refunds. In all these studies quota rents are gathered from the literature. Distinctions also exist in terms of regional coverage (Lips et al., 2002; the revision of Lips et al., 2005 - EU MS; Van Tongeren, 2002 - EU-15 aggregate; Isermeyer et al., 2006 - EU-27 aggregate) and product coverage. Quota abolition in these studies was modelled either by introducing dairy price reductions resulting in non-binding quotas or by increasing quotas until they become non-binding.
Results based on CGE models have the advantage that they capture the interaction between the agricultural sector and the non-agricultural sectors of the economy on one hand and quite frequently the global integration on the other hand (Van Tongeren, Van Meijl and Surry, 2001). However, to limit the overall complexity of the model and to improve its computational feasibility, agricultural production is often aggregated like in the studies mentioned above. Further, inclusion of some agricultural policy measures is sometimes difficult due to this aggregation of agricultural production and inadequate representation of physical resource constraints (Banse and Tangerman, 1996). To overcome this problem in Van Tongeren (2002) the restriction was placed on dairy products. Tyers and Anderson (1992) note that such an aggregation often weakens the interaction and causal linkages between different agricultural production sectors in CGE models.
Annexe A 2: PE models On the other hand and by definition, PE models do not include linkages that allow for the analysis of the impact of developments in the agricultural sector on other sectors of the economy. However, as PE models have the ability to incorporate greater amounts of details on production and policy instruments, they have advantages over their CGE counterparts (Salvatici et al., 2001). Generally, PE models describe one sector or a group of closely related products in an economy with a greater level of disaggregation than is common in CGE models. Given the capacity of PE models to incorporate detailed representations of relationships between policy instruments and agricultural commodity supply and demand, this
Annexe A: Overview on approaches to model milk quota abolition
67
type of model is very suitable to the analysis of the agricultural sector of developed economies. The PE framework also facilitates the coverage of more detailed products. Important features of the PE model grouping are their relatively simple economic structure, and their easily understandable and interpretable results. This last feature can be advantageous when model results are used by non-economists. A more detailed overview on general and partial equilibrium models and their different features is to be found in van Tongeren et al. (2001). 11
Partial equilibrium models applied to the analysis of quota abolition generally cover the whole agricultural sector (Kleinhanss et al., 2002; Jansson and Britz, 2002; Binfield et al., 2007), but some only focus on the dairy sector (Bouamra-Mechemache et al., 2001; Bouamra-Mechemache and Réquillart, 2006; Kleinhanss et al., 2002, Réquillart et al. 2008). Consequently, such models vary with respect to product coverage and policy implementation. Furthermore, base years and databases differ. Apart from the FAPRI-Ireland model, which largely uses national data sources, nearly all models draw most of their information from NewCronos (EUROSTAT database), but these are often supplemented by other national statistics. A common feature in most studies is the multi-level approach including raw milk production, processing of dairy products and demand for dairy products (Bouamra-Mechemache et al., 2001; Bouamra-Mechemache and Réquillart, 2006, Kleinhanss et al., 2002; Jansson and Britz, 2002). It seems to be difficult to estimate production functions based on time series in order to model quota abolition in a PE framework. Since its introduction in 1984, all estimates will reflect the existence of the milk quota. Hence, additional information is generated by production and farm models and directly or indirectly applied to the PE models. With respect to the processing sector, available milk is often broken down into fat and protein components thus enabling fat and protein to be considered as the inputs for the production of the different dairy products rather than just raw milk.
A detailed spatial PE model (INRADM) was employed by a Commission study (European Commission, 2002) examining the vertical impact from milk supply, down through milk processing and into the demand for final dairy products. Within this approach total milk supplies and usages were divided into fat and protein and processing technologies were explicitly modelled. The model considered 14 final dairy products. At that time, the results of the individual EU-14 MS, four additional regions and imports from an aggregate 'Rest of the World' (ROW) were represented. Demand developments were captured by annual shifts in demand functions. Additionally, a production model based on a dual short-run profit and netput function depicting the raw milk and beef production was applied. Production in the context of quota abolition was handled through interaction with a production model in which the quota restrictions were removed.
In Kleinhanss et al. (2002) two different PE models were applied. Firstly, GAPsi (a multi-product, multi-regional model) generated the equilibrium prices needed by the different supply models. In terms of regional aggregation, individual EU MS and the 'ROW' were covered. Concerning products, the standard model represented cereals, oilseeds, pulses, potatoes and sugar (beets) as well as milk, beef, sheep meat, pig meat, poultry meat and eggs, whereas compound feed (feed grains, protein meals and starchy meals) were included as inputs. Under the consideration of available information on quota rents and expert knowledge a production function was constructed applicable for the quota abolition. Secondly, the PE model MIPsi was employed specifically to simulate the effects of alternative EU milk policies. Maintaining the same regional aggregation as GAPsi, MIPsi comprises a completely
11 For a detailed discussion on the relative merits of CGE and PE models see AGMEMOD Report III.
Annexe A: Overview on approaches to model milk quota abolition
68
different product structure, with raw milk processed into five dairy products (fresh milk, butter, cheese, milk powder, other products) each consisting of price-dependent quantities of fat, protein and other inputs including value added. Due to the differentiation of dairy products in the model, intervention prices for butter and SMP as well as WTO restrictions concerning individual products can be implemented in the model directly.
The study by Binfield et al. (2007) is in some respects a follow-up on the study by Westhoff and Young (1999). The earlier study had been based on the standard FAPRI model, while the more recent study employed the FAPRI GOLD and FAPRI-Ireland models. The 2007 study is characterised by an enhanced representation of the Irish agriculture sector. The general design of the FAPRI-GOLD and FAPRI-Ireland models is a PE, multi-market model, organized along commodity lines with EU MS or EU regional modules. Depending on data availability, most MS and regional modules contain equations for five commodities: milk, butter, cheese, non-fat dry milk, and WMP. Price and quantity variables are passed between the dairy model and the other FAPRI commodity models to accommodate interactions. The dairy model solves for equilibrium in international markets for the four derived products, and a domestic equilibrium for fluid milk is maintained at all times (FAPRI 2007). Reflecting the structure of these models, quota abolition is simulated by quota expansion until the quota is no longer binding.
Annexe A 3: Production and farm based models Production and farm based models (Bouamra-Mechemache et al., 2002; Kleinhanss et al., 2002; Isermeyer et al., 2006, Jansson, 2002; Helming et al., 2002; Helming, 2006), include programming models, econometric production models as well as expert based simulation models. Econometric cost functions are often based on information of the European Community’s Farm Accountancy Data Network (FADN). A broaden variety of programming models can be found that can simulate quota abolition, but their application is more focused on agricultural farm effects alone rather than on commodity market reactions or on international trade effects. Typically, these models simulate different production activities which are optimised under a set of production restrictions, prices and costs. Values for these variables are usually exogenously to the models themselves. Instead of values for prices or costs, functions can be implemented in these models in order to reflect market processes. However, even with such improvements, the model results often tend to show extreme reactions when small changes occur (Van Berkum and Helming, 2006; Helming, 2005).
Based on FADN data, cost functions and quota rents for each MS were estimated by applying a dual cost function approach, and then this information was used in calibrating the shadow supply function for milk (see Bouamra-Mechemache et al., 2002). It is necessary to fix the levels, as adjustments of the production levels to price changes could not be observed. Thus, to predict how milk supply would respond if the quota is abolished, information about the shadow supply function for milk was required. In this context, it is important to know the current shadow price for raw milk (the producer price at which the dairy farmers would produce their current level of production when no quota is applicable). To estimate such a cost function for each MS, individual data for dairy farms was used. By taking the first partial derivative of the cost function concerning the milk quantity produced, the milk shadow price function was gained and the difference between the farm-gate milk price received and the milk shadow price gave the respective milk quota rent. In principle the shadow price function determines production in the case of a quota removal. In practice, three functional forms were examined, namely the quadratic, the translog, and an ad-hoc functional form. For each dairy producer a well-behaved cost structure with two outputs and two fixed inputs were considered. The selected specification depended on milk output and other outputs, milk
Annexe A: Overview on approaches to model milk quota abolition
69
yields, stocking rate per hectare and family labour. The ad-hoc specification was used for Denmark, France and Germany.
A dual short-run profit and netput functions supplemented by a stock and land adjustment component was developed at the Wageningen University and applied as production model (Bouamra-Mechemache et al., 2002). All behavioural equations were econometrically estimated. The model was set-up to derive the impacts of dairy and beef policy instruments on milk and beef outputs, feed used as an input into milk and beef production, the stocks of dairy cows and beef cows and the allocation of land to beef and dairy production. A normalized quadratic functional form for the profit function was assumed. Implicit in the short-run model were the shadow price relationships for the quasi-fixed factors and the limited milk output, which were obtained by differentiating the profit function with respect to the quasi-fixed factor. Data came from the SPEL data base (Eurostat), FADN and other official sources with an estimation period covering the years 1973-1995. Due to the switch in the policy regime, a mixed estimation procedure was applied, which allows sample and non-sample information to be combined. Estimation was done separately for each EU MS. When the model simulated the removal of quotas, supply adjusted according to the shadow milk supply function. Although the short-run milk supply response, given the quasi-fixed factors, was quite small, after one period, as the cow numbers began to adjust there was a much greater reaction of milk supply. The full response extends over a number of periods, and depends also on prices for beef and feed.
To study quota abolition, Sckokai (2003) estimated three profit functions for three different geographical areas in Italy, where production costs and the related rental prices of quotas varied greatly. The equations estimated were derived from a normalised quadratic specification of a restricted profit function and tradable quotas. Data for specialised dairy farms were taken from the 1996-99 Italian FADN database, while survey information on rental prices of milk quotas were used in estimating. A medium-run simulation model was defined and estimated assuming that farmers could dynamically adjust the dairy cow stock level in response to varying milk prices. To simulate quota abolition and other scenarios, milk producer prices were exogenously provided based on the market simulations of Bouarma-Mechemache et al. (2002).
In Helming and Peerling (2002) and in the later study of Van Berkum and Helming (2006) the DRAM model was used, which is a regionalised, mathematical programming model for the Netherlands agriculture sector. The model assumes that farmers’ behaviour at sector level can be described by maximisation of total profits from agriculture under the restriction that all markets taken into account are in equilibrium. To reach an optimal solution, marginal costs should equal marginal revenues for all regional agricultural activities. Hence, marginal costs and marginal benefits are determined by regional differences in respectively production possibilities, prices of inputs and outputs and activity levels relative to a base year level. In the earlier study DRAM was integrated with a mixed input-output model to derive impacts for the Dutch economy as a whole. Prices in the different policy scenarios including the quota abolition scenarios were determined exogenously.
The MDM (Manchester Dairy Model) was a single year comparative-static model of milk supply, expressed as a family of cost functions reflecting different dairy farm sizes, different regions and different performance characteristics such as yields. The last version of the model was based on input costs for 1999/2000 (called 1999), though the cost functions themselves represent technical efficiency conditions prevailing in 1996/97. Within the MDM, milk production re-allocates between different regions and farm types according to the relative economic efficiency of farm types. These were weighted to represent all dairy farms in the UK. A simulation model is used to reflect economic behaviour in response to different price levels. Assuming constrained profit maximisation, the simulation model allowed the
Annexe A: Overview on approaches to model milk quota abolition
70
expansion of production on some farms if others contracted or quitted. Again for this model the simulation of quota abolition requires exogenously determined milk prices, which were provided by the INRADM in the last study (Colman et al., 2002).
The CAPRI model distinguishes 250 regions within the EU (mostly in line with the NUTS 2 level) and covers European agricultural product generation and input use. The model consists of a supply and a market module. The supply module is represented by individual non-linear programming models for each region, which are considered as one aggregated farm. The market module can be regarded as a multi commodity market model using aggregated supply quantities from the regional models. An iterative procedure between the supply and the market modules guarantees equilibrium. In order to assess possible adjustment reactions in case of an abolition of the milk quota scheme, estimations of quota rents are implemented exogenously. Respective data were collected from various sources (Jansson and Britz, 2002).
RAUMIS, a regionally differentiated non-linear programming model for the German agricultural sector, operates with 326 'regional farms'. Due to its consistency with national farm accounts, the model is especially suited to deal with sector balances or budget constraints for direct payments and to ensure the balance between supply and demand of young livestock. For this study, these aspects are of particular importance for the prediction of beef production. Furthermore, RAUMIS was required to have a consistent set of exogenous prices to simulate quota abolition (Kleinhanss et al, 2002; Isermeyer et al., 2006). In contrast to this, FARMIS' homogenous farm groups are aggregated in accordance with stratification criteria like region, farm type and farm size. Improved aggregation factors allow for an extrapolation of the results to the sector level for monetary as well as for physical indicators. As the modelling structure and definition of activities is almost the same as in RAUMIS, the two models are well-suited for a combined use to assess impacts of policy changes at regional and farm group level. Also for FARMIS a consistent set of variables were needed when effects of a removal of milk quotas had to be simulated (Kleinhanss et al, 2002; Isermeyer et al., 2006).
In summary, for the modelling of quota abolition and other milk and dairy market reforms with respect to changing trade regimes, the most common approaches used are CGE models, PE models, programming models and econometric estimations of cost functions. As shown, assessments are often based on a combination of these different approaches (Isermeyer et al, 2006; Kleinhanss et al, 2002; Colman, 2002; Bouamra-Mechemache et al., 2002). Either a type of shadow price supply function is applied exogenously to a PE or CGE model or else milk price vectors are provided exogenously in the case of programming models.
Annexe A 4: Synthetic production functions The basis for the production functions in this study is provided by the existing literature. Since various estimates of production cost and shadow prices are available from the literature, the following section presents a short overview of the empirical work in this area.
In 2006, the EU Commission (EU Commission, 2006) published estimates of the costs of milk production for the period 1989 – 2003, where farm input expenditures are allocated to milk production. An estimation procedure is required however, to identify and separate dairy related costs, since FADN accounts do not distinguish enterprise costs on farms with more than one enterprise.
To allocate farm overheads, depreciation and other non-specific input expenditures across farm enterprises, the respective output plus subsidies were used. The allocation schemes were based on three criteria:
1. The share of livestock units: for the direct costs (mainly feed);
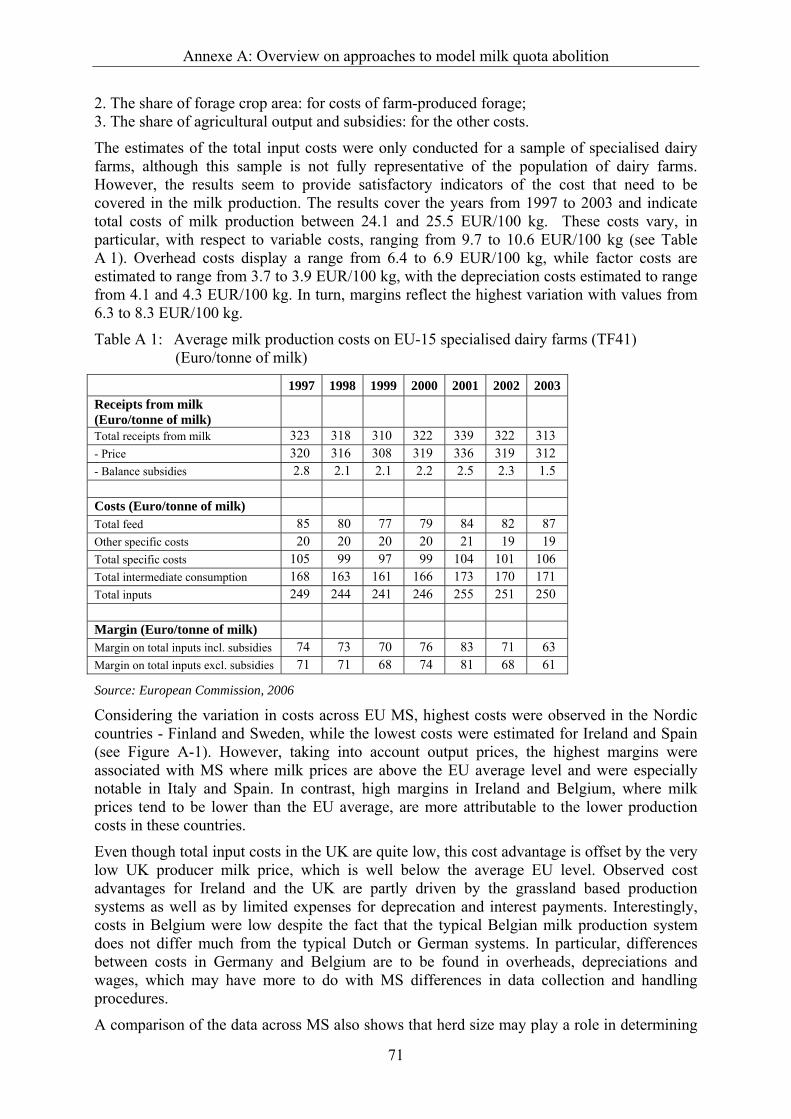
Annexe A: Overview on approaches to model milk quota abolition
71
2. The share of forage crop area: for costs of farm-produced forage; 3. The share of agricultural output and subsidies: for the other costs.
The estimates of the total input costs were only conducted for a sample of specialised dairy farms, although this sample is not fully representative of the population of dairy farms. However, the results seem to provide satisfactory indicators of the cost that need to be covered in the milk production. The results cover the years from 1997 to 2003 and indicate total costs of milk production between 24.1 and 25.5 EUR/100 kg. These costs vary, in particular, with respect to variable costs, ranging from 9.7 to 10.6 EUR/100 kg (see Table A 1). Overhead costs display a range from 6.4 to 6.9 EUR/100 kg, while factor costs are estimated to range from 3.7 to 3.9 EUR/100 kg, with the depreciation costs estimated to range from 4.1 and 4.3 EUR/100 kg. In turn, margins reflect the highest variation with values from 6.3 to 8.3 EUR/100 kg.
Table A 1: Average milk production costs on EU-15 specialised dairy farms (TF41) (Euro/tonne of milk)
1997 1998 1999 2000 2001 2002 2003 Receipts from milk (Euro/tonne of milk)
Total receipts from milk 323 318 310 322 339 322 313 - Price 320 316 308 319 336 319 312 - Balance subsidies 2.8 2.1 2.1 2.2 2.5 2.3 1.5 Costs (Euro/tonne of milk) Total feed 85 80 77 79 84 82 87 Other specific costs 20 20 20 20 21 19 19 Total specific costs 105 99 97 99 104 101 106 Total intermediate consumption 168 163 161 166 173 170 171 Total inputs 249 244 241 246 255 251 250 Margin (Euro/tonne of milk) Margin on total inputs incl. subsidies 74 73 70 76 83 71 63 Margin on total inputs excl. subsidies 71 71 68 74 81 68 61
Source: European Commission, 2006
Considering the variation in costs across EU MS, highest costs were observed in the Nordic countries - Finland and Sweden, while the lowest costs were estimated for Ireland and Spain (see Figure A-1). However, taking into account output prices, the highest margins were associated with MS where milk prices are above the EU average level and were especially notable in Italy and Spain. In contrast, high margins in Ireland and Belgium, where milk prices tend to be lower than the EU average, are more attributable to the lower production costs in these countries.
Even though total input costs in the UK are quite low, this cost advantage is offset by the very low UK producer milk price, which is well below the average EU level. Observed cost advantages for Ireland and the UK are partly driven by the grassland based production systems as well as by limited expenses for deprecation and interest payments. Interestingly, costs in Belgium were low despite the fact that the typical Belgian milk production system does not differ much from the typical Dutch or German systems. In particular, differences between costs in Germany and Belgium are to be found in overheads, depreciations and wages, which may have more to do with MS differences in data collection and handling procedures.
A comparison of the data across MS also shows that herd size may play a role in determining
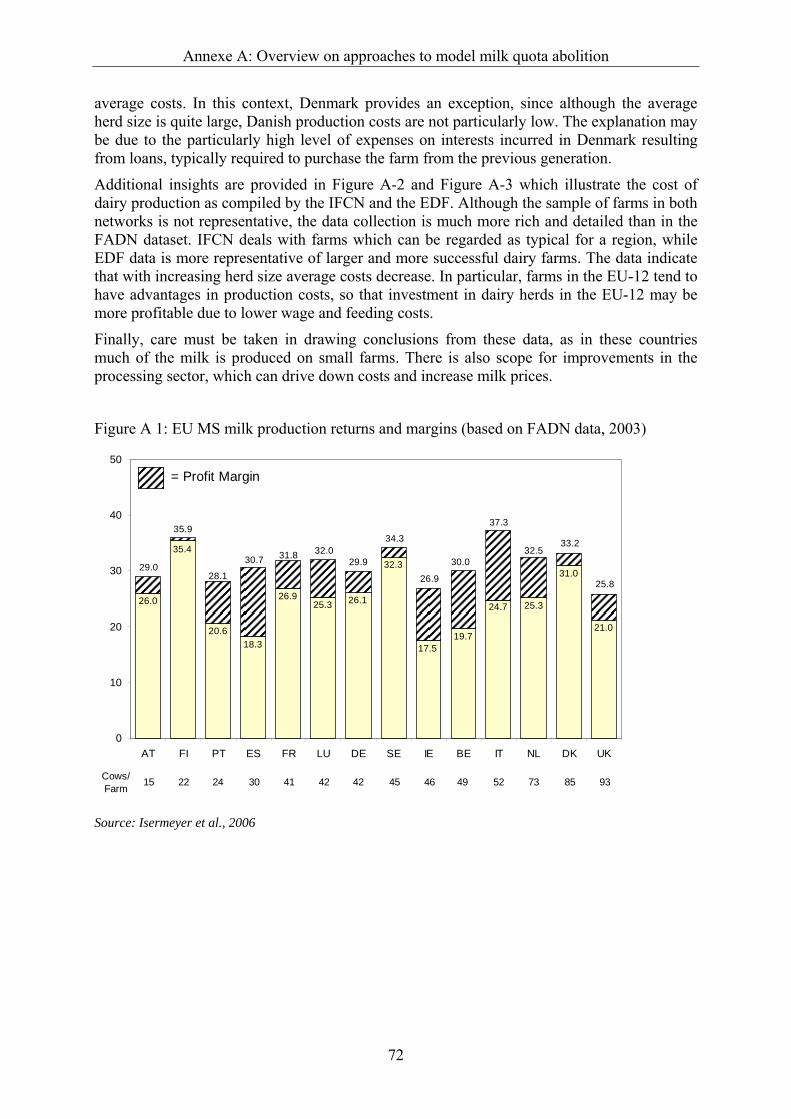
Annexe A: Overview on approaches to model milk quota abolition
72
average costs. In this context, Denmark provides an exception, since although the average herd size is quite large, Danish production costs are not particularly low. The explanation may be due to the particularly high level of expenses on interests incurred in Denmark resulting from loans, typically required to purchase the farm from the previous generation.
Additional insights are provided in Figure A-2 and Figure A-3 which illustrate the cost of dairy production as compiled by the IFCN and the EDF. Although the sample of farms in both networks is not representative, the data collection is much more rich and detailed than in the FADN dataset. IFCN deals with farms which can be regarded as typical for a region, while EDF data is more representative of larger and more successful dairy farms. The data indicate that with increasing herd size average costs decrease. In particular, farms in the EU-12 tend to have advantages in production costs, so that investment in dairy herds in the EU-12 may be more profitable due to lower wage and feeding costs.
Finally, care must be taken in drawing conclusions from these data, as in these countries much of the milk is produced on small farms. There is also scope for improvements in the processing sector, which can drive down costs and increase milk prices.
Figure A 1: EU MS milk production returns and margins (based on FADN data, 2003)
21.0
31.0
25.324.7
19.717.5
32.3
26.125.326.9
18.320.6
35.4
26.0
0
10
20
30
40
50
AT FI PT ES FR LU DE SE IE BE IT NL DK UK
= Profit Margin
29.0
35.9
28.1
30.7 31.8 32.029.9
34.3
26.9
30.0
37.3
32.533.2
25.8
15 22 24 30 41 42 42 45 46 49 52 73 85 93Cows/Farm
Source: Isermeyer et al., 2006
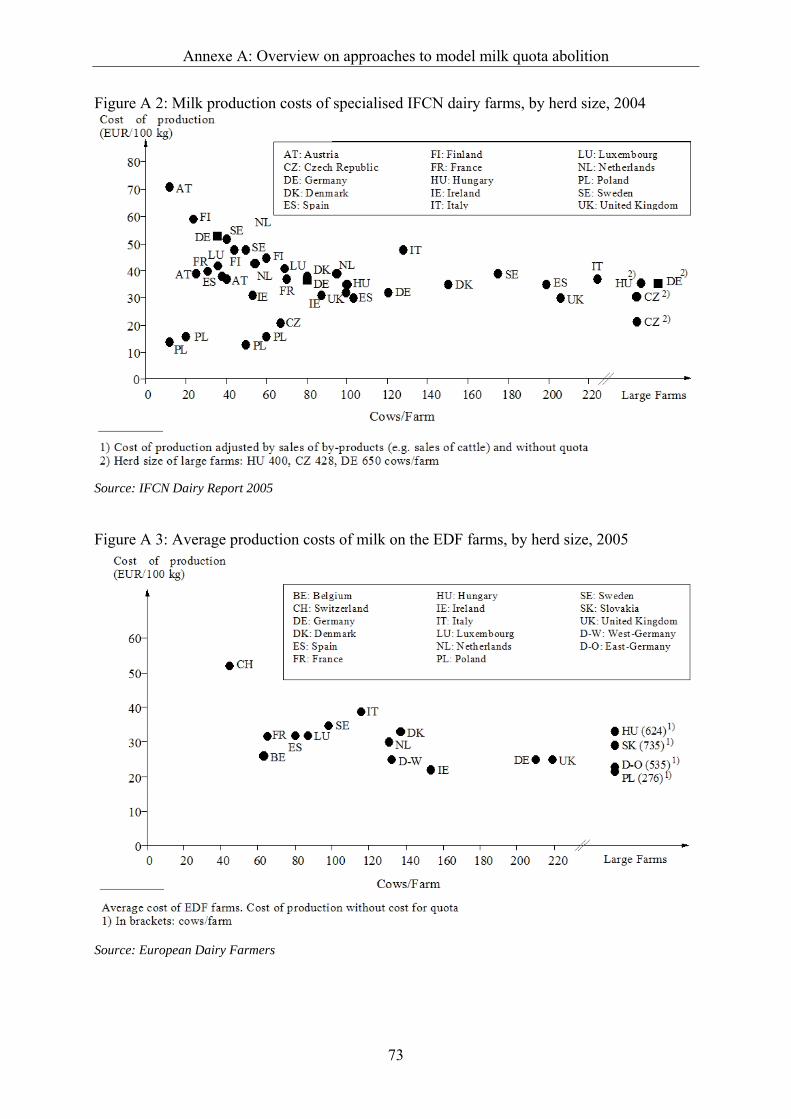
Annexe A: Overview on approaches to model milk quota abolition
73
Figure A 2: Milk production costs of specialised IFCN dairy farms, by herd size, 2004
Source: IFCN Dairy Report 2005
Figure A 3: Average production costs of milk on the EDF farms, by herd size, 2005
Source: European Dairy Farmers
Annexe A: Overview on approaches to model milk quota abolition
74
The results detailed above are only partly consistent with estimates of marginal costs produced by Cathagne et al. (2006) and Sckokai (2006). Both of these approaches are based on FADN, but each uses a different sample and different specification of empirical cost function.
Cathagne et al. (2006) assumes that dairy farms can be represented by a multi-output cost function with milk as one of the outputs. Therefore, the partial derivative of the cost function with respect to the milk price gives the marginal cost of milk production function. In their model an ad-hoc specification is used. In addition to milk, beef and other outputs are also produced. Concerning inputs, three specifications are used corresponding to a short-run, a medium-run and a long-run horizon: Thus, in the short run, all primary factors are considered as fixed factors, but all other inputs are variable, while in the medium run, family labour and land are still fixed, in contrast, all other inputs hired, labour and capital are presumed to be variable. In the long run, only family labour is fixed, with everything else considered as variable. In addition, the ratio of the total number of livestock units to forage area, the milk yield per dairy cow and the share of fodder maize area in total forage area are included as variables. The marginal cost function is defined as a quadratic function of milk output. Estimates were based on a dataset for the period 1996-2001.
Short-run (SR) marginal cost estimates for specialised dairy farms run from 6.2 EUR/100 kg milk in Austria to 25.4 EUR/100 kg milk in Italy (Table A 2). The estimate of Cathagne et al. (2006) for SR marginal costs of milk production in Belgian equal 1.3 EUR/100 kg milk, seems unrealistic. SR marginal costs are comparatively higher in the Nordic states (Sweden and Finland) and in the south (Portugal, Spain, and Italy). Quite low SR marginal costs are observed for Austria, Ireland and the Netherlands. Milk output per farm is in the same order of magnitude in the Netherlands as well as in Denmark, but SR marginal costs are much higher in Denmark. Cathagne et al. (2006) concluded that within a country heterogeneity may be more important than heterogeneity between various countries.
Medium-run (MR) marginal cost estimates vary between 9.3 EUR/100 kg milk in Belgium and 34.4 EUR/100 kg milk in Italy. Apart from Portugal, all other MS milk producer prices in the Cathagne et al. (2006) study exceed these MR marginal costs. Again, the low level of marginal costs for Belgium and the high level for Italy stand out, with the ranking of countries in terms of their marginal costs in the short run remains largely unchanged in the MR with marginal costs highest in Mediterranean countries (Italy and Portugal, and to a lesser extent Spain) as well as in Nordic countries (Finland and Sweden).
As expected long-run (LR) marginal costs exceed MR marginal costs. LR marginal cost range between 20.6 EUR/100 kg milk in Belgium to 38.4 EUR/100 kg milk in Italy. In some MS the LR marginal costs exceed the milk producer prices (Austria, Denmark, Finland, Germany, Luxembourg, Portugal and Sweden). In France and Ireland they are almost equal to the milk producer price, while they are lower in Italy, the Netherlands, Spain and the United Kingdom. However, in interpreting these LR results, it should be borne in mind that the marginal costs implicitly reflect the cost of land. Furthermore, dairy farm heterogeneity is not considered.
Sckokai (2006) adopts a cost minimization approach in analysing the marginal costs of milk production, where milk production is restricted by the milk quota. Other outputs, variable input prices, quasi-fixed input levels and variable input levels are considered. In contrast to Cathagne et al. (2006) the underlying specification of the cost function is based on a theoretically well founded flexible functional form (FFF) the hybrid-translog cost function. This cost specification is consistent with underlying microeconomic theory but comes with the risk of over-parameterisation in estimation. The sample used by Sckokai (2006) covers the period 1996 to 2002 for all FADN dairy farms (specialised and non-specialised), thus the data used are quite heterogeneous. To deal with the problems caused by this heterogeneity,
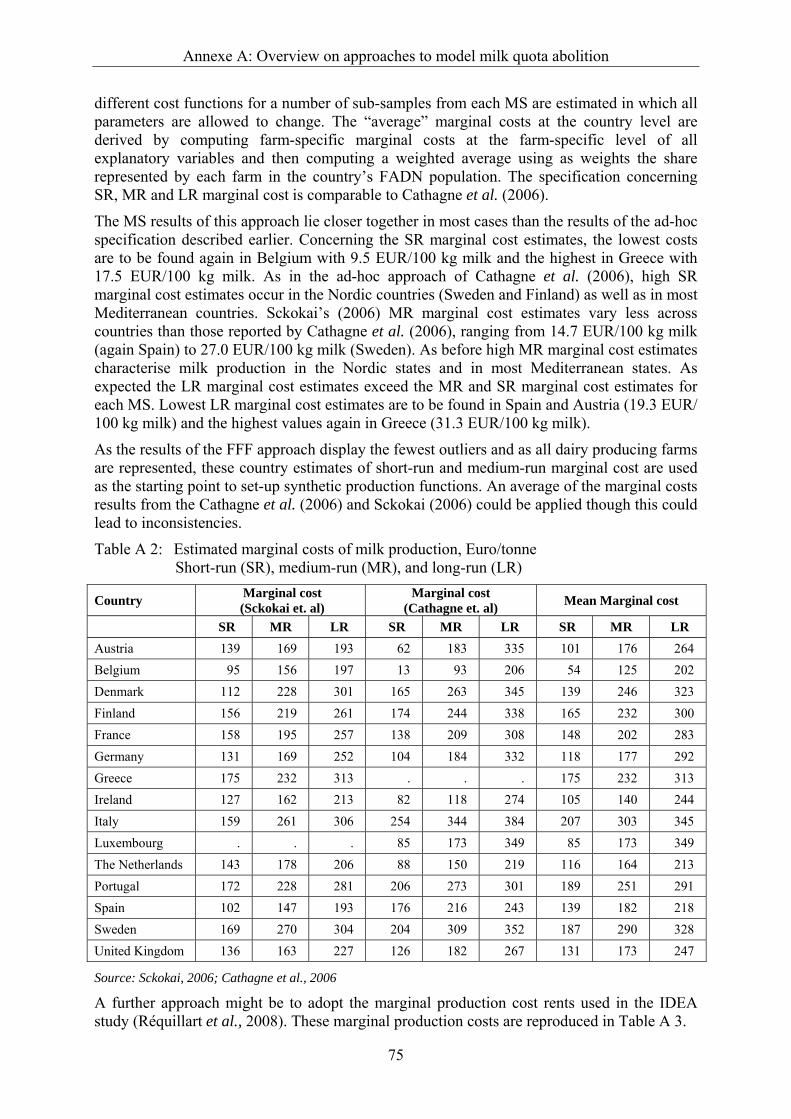
Annexe A: Overview on approaches to model milk quota abolition
75
different cost functions for a number of sub-samples from each MS are estimated in which all parameters are allowed to change. The “average” marginal costs at the country level are derived by computing farm-specific marginal costs at the farm-specific level of all explanatory variables and then computing a weighted average using as weights the share represented by each farm in the country’s FADN population. The specification concerning SR, MR and LR marginal cost is comparable to Cathagne et al. (2006).
The MS results of this approach lie closer together in most cases than the results of the ad-hoc specification described earlier. Concerning the SR marginal cost estimates, the lowest costs are to be found again in Belgium with 9.5 EUR/100 kg milk and the highest in Greece with 17.5 EUR/100 kg milk. As in the ad-hoc approach of Cathagne et al. (2006), high SR marginal cost estimates occur in the Nordic countries (Sweden and Finland) as well as in most Mediterranean countries. Sckokai’s (2006) MR marginal cost estimates vary less across countries than those reported by Cathagne et al. (2006), ranging from 14.7 EUR/100 kg milk (again Spain) to 27.0 EUR/100 kg milk (Sweden). As before high MR marginal cost estimates characterise milk production in the Nordic states and in most Mediterranean states. As expected the LR marginal cost estimates exceed the MR and SR marginal cost estimates for each MS. Lowest LR marginal cost estimates are to be found in Spain and Austria (19.3 EUR/ 100 kg milk) and the highest values again in Greece (31.3 EUR/100 kg milk).
As the results of the FFF approach display the fewest outliers and as all dairy producing farms are represented, these country estimates of short-run and medium-run marginal cost are used as the starting point to set-up synthetic production functions. An average of the marginal costs results from the Cathagne et al. (2006) and Sckokai (2006) could be applied though this could lead to inconsistencies.
Table A 2: Estimated marginal costs of milk production, Euro/tonne Short-run (SR), medium-run (MR), and long-run (LR)
Country Marginal cost (Sckokai et. al)
Marginal cost (Cathagne et. al) Mean Marginal cost
SR MR LR SR MR LR SR MR LR Austria 139 169 193 62 183 335 101 176 264 Belgium 95 156 197 13 93 206 54 125 202 Denmark 112 228 301 165 263 345 139 246 323 Finland 156 219 261 174 244 338 165 232 300 France 158 195 257 138 209 308 148 202 283 Germany 131 169 252 104 184 332 118 177 292 Greece 175 232 313 . . . 175 232 313 Ireland 127 162 213 82 118 274 105 140 244 Italy 159 261 306 254 344 384 207 303 345 Luxembourg . . . 85 173 349 85 173 349 The Netherlands 143 178 206 88 150 219 116 164 213 Portugal 172 228 281 206 273 301 189 251 291 Spain 102 147 193 176 216 243 139 182 218 Sweden 169 270 304 204 309 352 187 290 328 United Kingdom 136 163 227 126 182 267 131 173 247
Source: Sckokai, 2006; Cathagne et al., 2006
A further approach might be to adopt the marginal production cost rents used in the IDEA study (Réquillart et al., 2008). These marginal production costs are reproduced in Table A 3.
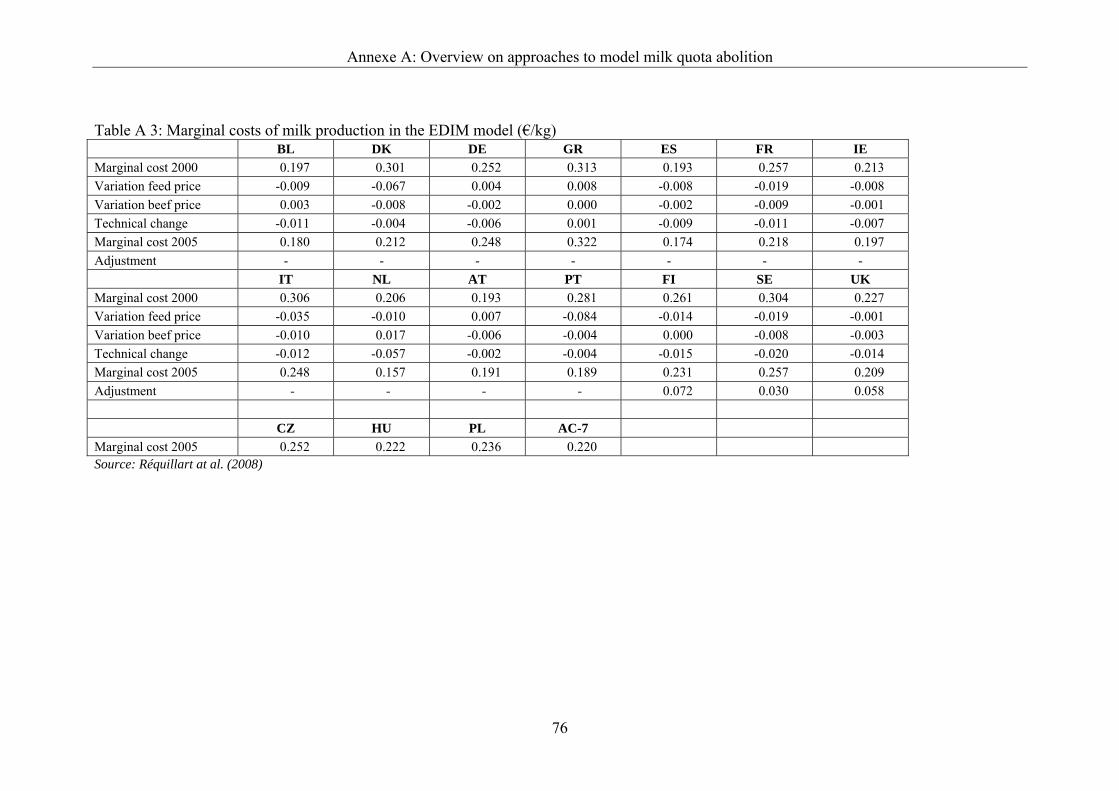
Annexe A: Overview on approaches to model milk quota abolition
76
Table A 3: Marginal costs of milk production in the EDIM model (€/kg) BL DK DE GR ES FR IE Marginal cost 2000 0.197 0.301 0.252 0.313 0.193 0.257 0.213 Variation feed price -0.009 -0.067 0.004 0.008 -0.008 -0.019 -0.008 Variation beef price 0.003 -0.008 -0.002 0.000 -0.002 -0.009 -0.001 Technical change -0.011 -0.004 -0.006 0.001 -0.009 -0.011 -0.007 Marginal cost 2005 0.180 0.212 0.248 0.322 0.174 0.218 0.197 Adjustment - - - - - - - IT NL AT PT FI SE UK Marginal cost 2000 0.306 0.206 0.193 0.281 0.261 0.304 0.227 Variation feed price -0.035 -0.010 0.007 -0.084 -0.014 -0.019 -0.001 Variation beef price -0.010 0.017 -0.006 -0.004 0.000 -0.008 -0.003 Technical change -0.012 -0.057 -0.002 -0.004 -0.015 -0.020 -0.014 Marginal cost 2005 0.248 0.157 0.191 0.189 0.231 0.257 0.209 Adjustment - - - - 0.072 0.030 0.058 CZ HU PL AC-7 Marginal cost 2005 0.252 0.222 0.236 0.220 Source: Réquillart at al. (2008)
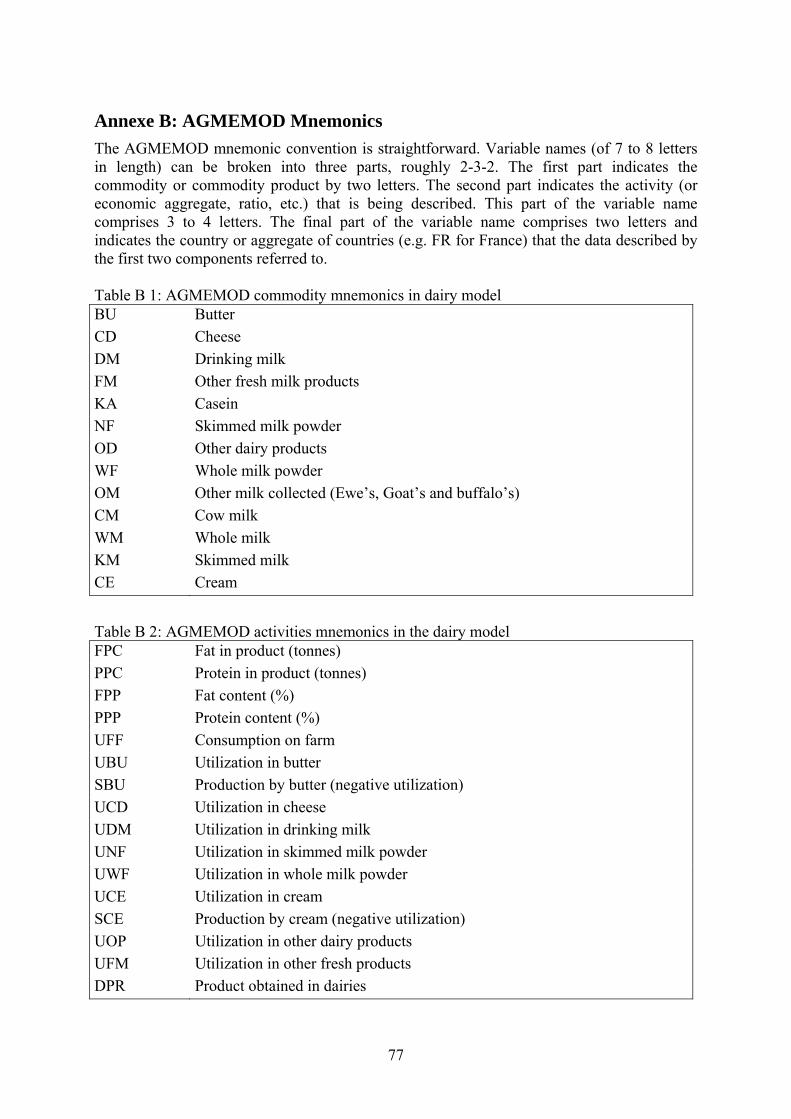
77
Annexe B: AGMEMOD Mnemonics The AGMEMOD mnemonic convention is straightforward. Variable names (of 7 to 8 letters in length) can be broken into three parts, roughly 2-3-2. The first part indicates the commodity or commodity product by two letters. The second part indicates the activity (or economic aggregate, ratio, etc.) that is being described. This part of the variable name comprises 3 to 4 letters. The final part of the variable name comprises two letters and indicates the country or aggregate of countries (e.g. FR for France) that the data described by the first two components referred to. Table B 1: AGMEMOD commodity mnemonics in dairy model BU Butter CD Cheese DM Drinking milk FM Other fresh milk products KA Casein NF Skimmed milk powder OD Other dairy products WF Whole milk powder OM Other milk collected (Ewe’s, Goat’s and buffalo’s) CM Cow milk WM Whole milk KM Skimmed milk CE Cream
Table B 2: AGMEMOD activities mnemonics in the dairy model FPC Fat in product (tonnes) PPC Protein in product (tonnes) FPP Fat content (%) PPP Protein content (%) UFF Consumption on farm UBU Utilization in butter SBU Production by butter (negative utilization) UCD Utilization in cheese UDM Utilization in drinking milk UNF Utilization in skimmed milk powder UWF Utilization in whole milk powder UCE Utilization in cream SCE Production by cream (negative utilization) UOP Utilization in other dairy products UFM Utilization in other fresh products DPR Product obtained in dairies
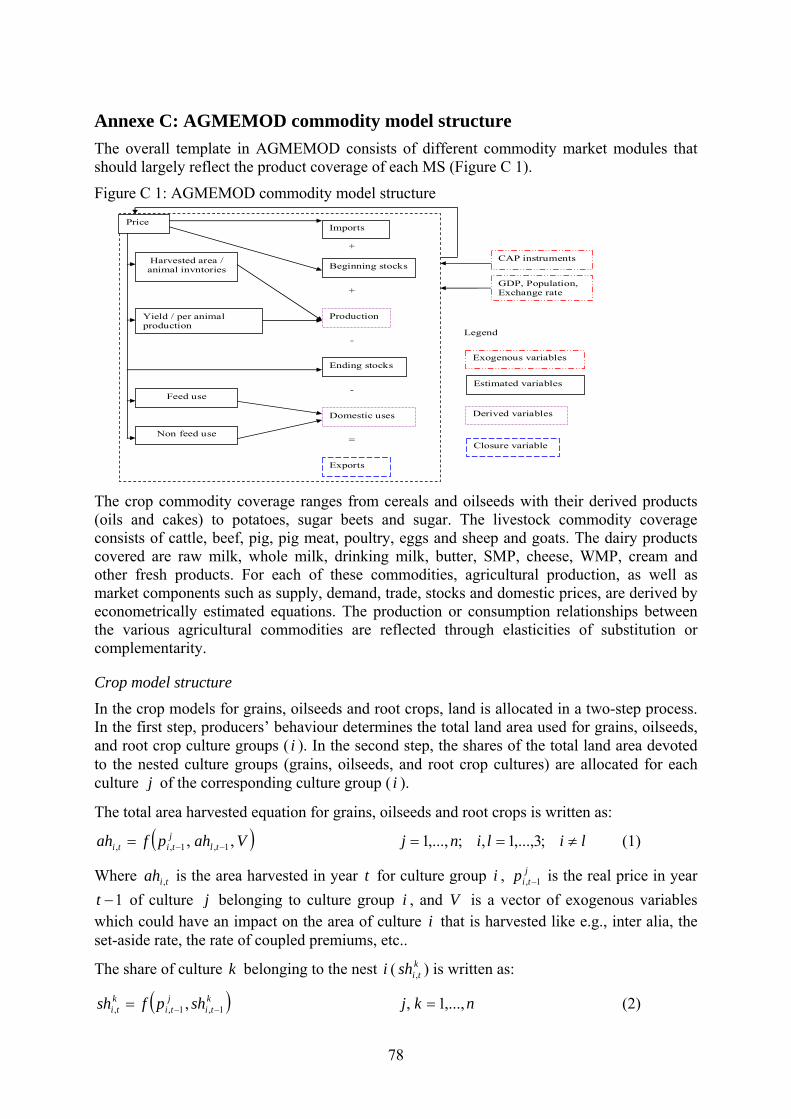
78
Annexe C: AGMEMOD commodity model structure The overall template in AGMEMOD consists of different commodity market modules that should largely reflect the product coverage of each MS (Figure C 1).
Figure C 1: AGMEMOD commodity model structure
The crop commodity coverage ranges from cereals and oilseeds with their derived products (oils and cakes) to potatoes, sugar beets and sugar. The livestock commodity coverage consists of cattle, beef, pig, pig meat, poultry, eggs and sheep and goats. The dairy products covered are raw milk, whole milk, drinking milk, butter, SMP, cheese, WMP, cream and other fresh products. For each of these commodities, agricultural production, as well as market components such as supply, demand, trade, stocks and domestic prices, are derived by econometrically estimated equations. The production or consumption relationships between the various agricultural commodities are reflected through elasticities of substitution or complementarity.
Crop model structure In the crop models for grains, oilseeds and root crops, land is allocated in a two-step process. In the first step, producers’ behaviour determines the total land area used for grains, oilseeds, and root crop culture groups ( i ). In the second step, the shares of the total land area devoted to the nested culture groups (grains, oilseeds, and root crop cultures) are allocated for each culture j of the corresponding culture group ( i ).
The total area harvested equation for grains, oilseeds and root crops is written as:
( )Vahpfah tljtiti ,, 1,1,, −−= lilinj ≠== ;3,...,1,;,...,1 (1)
Where tiah , is the area harvested in year t for culture group i , jtip 1, − is the real price in year
1−t of culture j belonging to culture group i , and V is a vector of exogenous variables which could have an impact on the area of culture i that is harvested like e.g., inter alia, the set-aside rate, the rate of coupled premiums, etc..
The share of culture k belonging to the nest i ( ktish , ) is written as:
( )kti
jti
kti shpfsh 1,1,, , −−= nkj ,...,1, = (2)
CAP instruments
Legend
Exogenous variables
GDP, Population, Exchange rate
Derived variables
Harvested area / animal invntories
Yield / per animal production
Production
Beginning stocks
Ending stocks
Domestic uses
Exports
Feed use
Non feed use =
-
-
+
+
Closure variable
Estimated variables
Price Imports
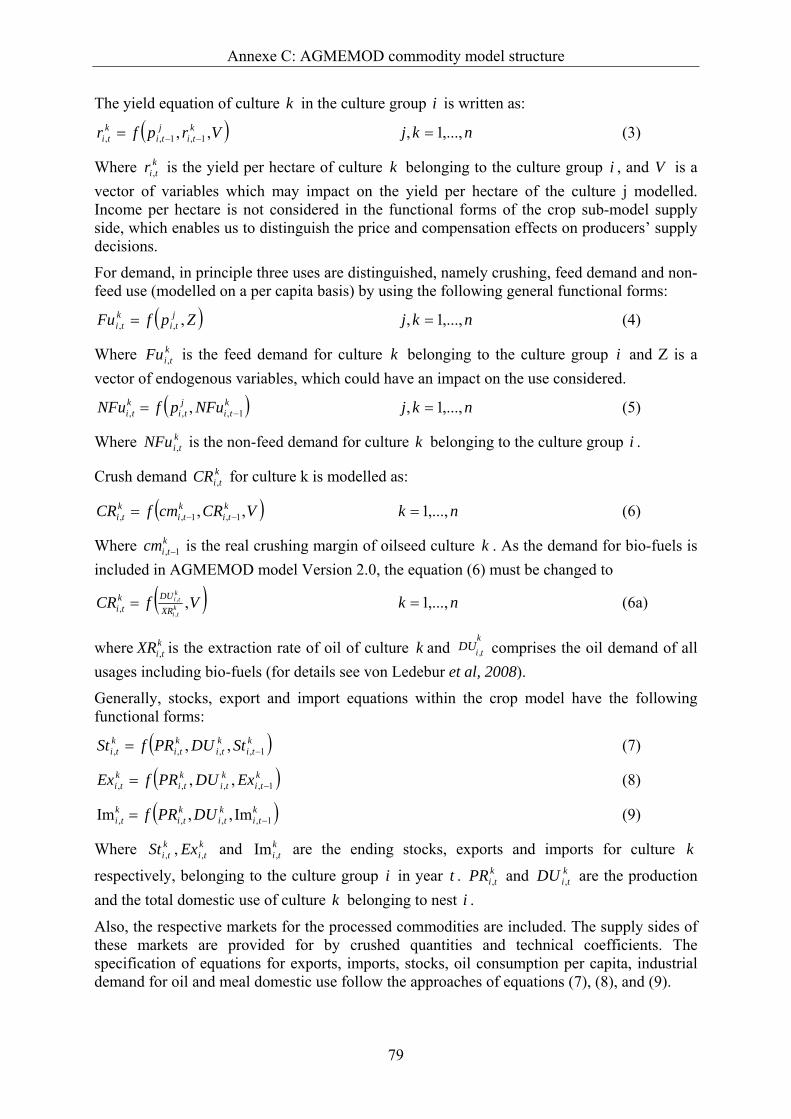
Annexe C: AGMEMOD commodity model structure
79
The yield equation of culture k in the culture group i is written as:
( )Vrpfr kti
jti
kti ,, 1,1,, −−= nkj ,...,1, = (3)
Where ktir , is the yield per hectare of culture k belonging to the culture group i , and V is a
vector of variables which may impact on the yield per hectare of the culture j modelled. Income per hectare is not considered in the functional forms of the crop sub-model supply side, which enables us to distinguish the price and compensation effects on producers’ supply decisions.
For demand, in principle three uses are distinguished, namely crushing, feed demand and non-feed use (modelled on a per capita basis) by using the following general functional forms:
( )ZpfFu jti
kti ,,, = nkj ,...,1, = (4)
Where ktiFu , is the feed demand for culture k belonging to the culture group i and Z is a
vector of endogenous variables, which could have an impact on the use considered.
( )kti
jti
kti NFupfNFu 1,,, , −= nkj ,...,1, = (5)
Where ktiNFu , is the non-feed demand for culture k belonging to the culture group i .
Crush demand ktiCR , for culture k is modelled as:
( )VCRcmfCR kti
kti
kti ,, 1,1,, −−= nk ,...,1= (6)
Where kticm 1, − is the real crushing margin of oilseed culture k . As the demand for bio-fuels is
included in AGMEMOD model Version 2.0, the equation (6) must be changed to
( )VfCR kti
kti
XRDUk
ti ,,
,, = nk ,...,1= (6a)
where ktiXR , is the extraction rate of oil of culture k and
k
tiDU , comprises the oil demand of all usages including bio-fuels (for details see von Ledebur et al, 2008).
Generally, stocks, export and import equations within the crop model have the following functional forms:
( )kti
kti
kti
kti StDUPRfSt 1,,,, ,, −= (7)
( )kti
kti
kti
kti ExDUPRfEx 1,,,, ,, −= (8)
( )kti
kti
kti
kti DUPRf 1,,,, Im,,Im −= (9)
Where ktiSt , , k
tiEx , and kti ,Im are the ending stocks, exports and imports for culture k
respectively, belonging to the culture group i in year t . ktiPR , and k
tiDU , are the production and the total domestic use of culture k belonging to nest i .
Also, the respective markets for the processed commodities are included. The supply sides of these markets are provided for by crushed quantities and technical coefficients. The specification of equations for exports, imports, stocks, oil consumption per capita, industrial demand for oil and meal domestic use follow the approaches of equations (7), (8), and (9).
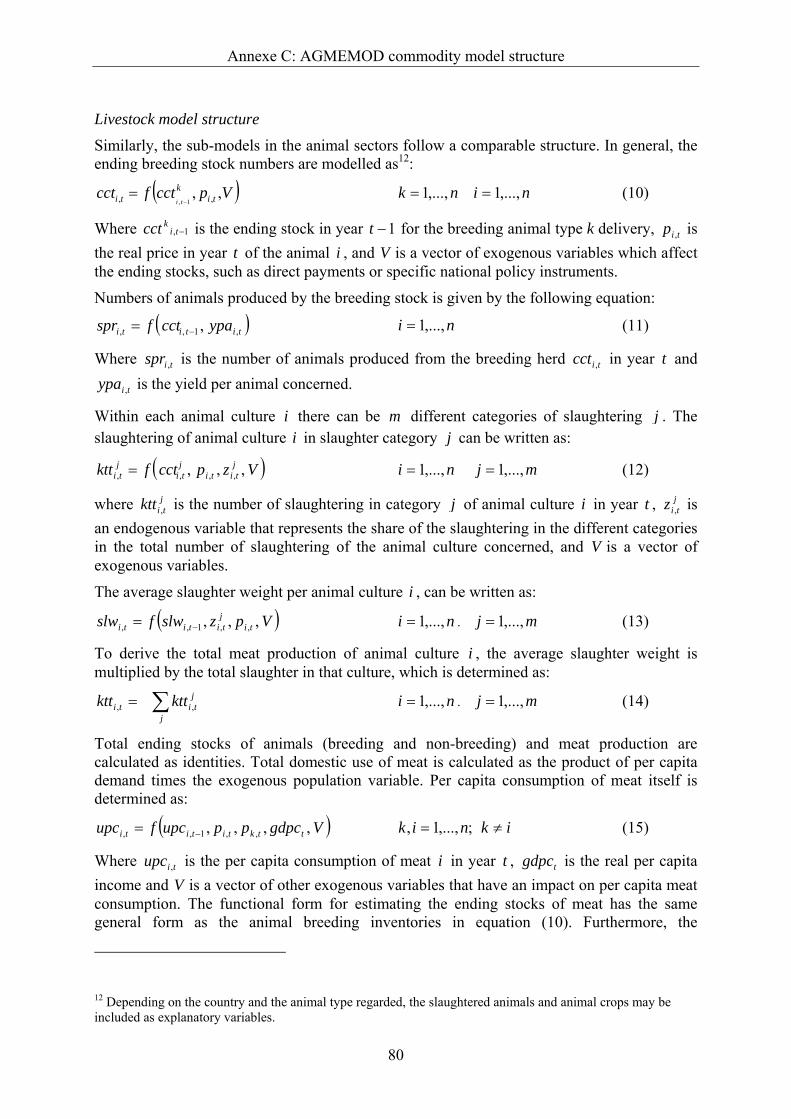
Annexe C: AGMEMOD commodity model structure
80
Livestock model structure
Similarly, the sub-models in the animal sectors follow a comparable structure. In general, the ending breeding stock numbers are modelled as12:
( )Vpcctfcct tik
ti ti,, ,, 1, −
= nk ,...,1= ni ,...,1= (10)
Where 1, −tikcct is the ending stock in year 1−t for the breeding animal type k delivery, tip , is
the real price in year t of the animal i , and V is a vector of exogenous variables which affect the ending stocks, such as direct payments or specific national policy instruments.
Numbers of animals produced by the breeding stock is given by the following equation:
( )tititi ypacctfspr ,1,, ,−= ni ,...,1= (11)
Where tispr , is the number of animals produced from the breeding herd ticct , in year t and
tiypa , is the yield per animal concerned.
Within each animal culture i there can be m different categories of slaughtering j . The slaughtering of animal culture i in slaughter category j can be written as:
( )Vzpcctfktt jtiti
jti
jti ,,, ,,,, = ni ,...,1= mj ,...,1= (12)
where jtiktt , is the number of slaughtering in category j of animal culture i in year t , j
tiz , is an endogenous variable that represents the share of the slaughtering in the different categories in the total number of slaughtering of the animal culture concerned, and V is a vector of exogenous variables.
The average slaughter weight per animal culture i , can be written as:
( )Vpzslwfslw tijtititi ,,, ,,1,, −= ni ,...,1= . mj ,...,1= (13)
To derive the total meat production of animal culture i , the average slaughter weight is multiplied by the total slaughter in that culture, which is determined as:
∑=j
jtiti kttktt ,, ni ,...,1= . mj ,...,1= (14)
Total ending stocks of animals (breeding and non-breeding) and meat production are calculated as identities. Total domestic use of meat is calculated as the product of per capita demand times the exogenous population variable. Per capita consumption of meat itself is determined as:
( )Vgdpcppupcfupc ttktititi ,,,, ,,1,, −= iknik ≠= ;,...,1, (15)
Where tiupc , is the per capita consumption of meat i in year t , tgdpc is the real per capita income and V is a vector of other exogenous variables that have an impact on per capita meat consumption. The functional form for estimating the ending stocks of meat has the same general form as the animal breeding inventories in equation (10). Furthermore, the
12 Depending on the country and the animal type regarded, the slaughtered animals and animal crops may be included as explanatory variables.
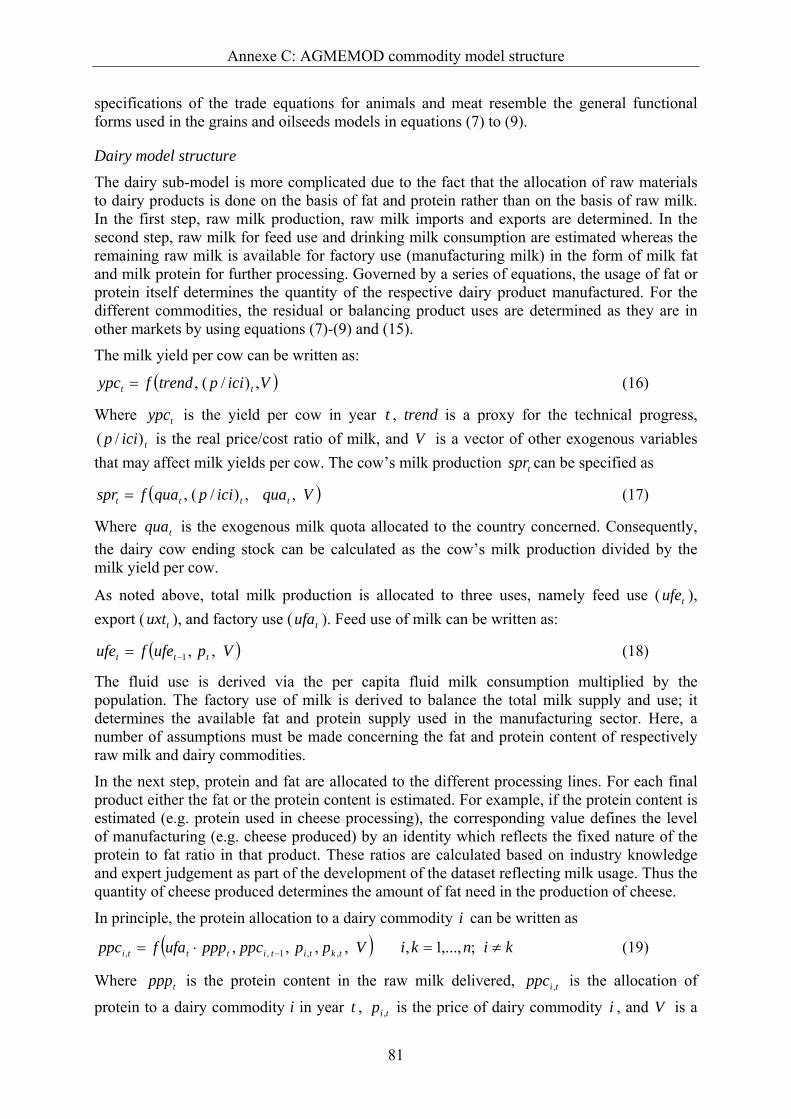
Annexe C: AGMEMOD commodity model structure
81
specifications of the trade equations for animals and meat resemble the general functional forms used in the grains and oilseeds models in equations (7) to (9).
Dairy model structure
The dairy sub-model is more complicated due to the fact that the allocation of raw materials to dairy products is done on the basis of fat and protein rather than on the basis of raw milk. In the first step, raw milk production, raw milk imports and exports are determined. In the second step, raw milk for feed use and drinking milk consumption are estimated whereas the remaining raw milk is available for factory use (manufacturing milk) in the form of milk fat and milk protein for further processing. Governed by a series of equations, the usage of fat or protein itself determines the quantity of the respective dairy product manufactured. For the different commodities, the residual or balancing product uses are determined as they are in other markets by using equations (7)-(9) and (15).
The milk yield per cow can be written as:
( )Viciptrendfypc tt ,)/(,= (16)
Where typc is the yield per cow in year t , trend is a proxy for the technical progress,
ticip )/( is the real price/cost ratio of milk, and V is a vector of other exogenous variables that may affect milk yields per cow. The cow’s milk production tspr can be specified as
( )Vquaicipquafspr tttt ,,)/(,= (17)
Where tqua is the exogenous milk quota allocated to the country concerned. Consequently, the dairy cow ending stock can be calculated as the cow’s milk production divided by the milk yield per cow.
As noted above, total milk production is allocated to three uses, namely feed use ( tufe ), export ( tuxt ), and factory use ( tufa ). Feed use of milk can be written as:
( )Vpufefufe ttt ,,1−= (18)
The fluid use is derived via the per capita fluid milk consumption multiplied by the population. The factory use of milk is derived to balance the total milk supply and use; it determines the available fat and protein supply used in the manufacturing sector. Here, a number of assumptions must be made concerning the fat and protein content of respectively raw milk and dairy commodities.
In the next step, protein and fat are allocated to the different processing lines. For each final product either the fat or the protein content is estimated. For example, if the protein content is estimated (e.g. protein used in cheese processing), the corresponding value defines the level of manufacturing (e.g. cheese produced) by an identity which reflects the fixed nature of the protein to fat ratio in that product. These ratios are calculated based on industry knowledge and expert judgement as part of the development of the dataset reflecting milk usage. Thus the quantity of cheese produced determines the amount of fat need in the production of cheese.
In principle, the protein allocation to a dairy commodity i can be written as
( )Vppppcpppufafppc tktitittti ,,,, ,,1,, −⋅= kinki ≠= ;,...,1, (19)
Where tppp is the protein content in the raw milk delivered, tippc , is the allocation of
protein to a dairy commodity i in year t , tip , is the price of dairy commodity i , and V is a
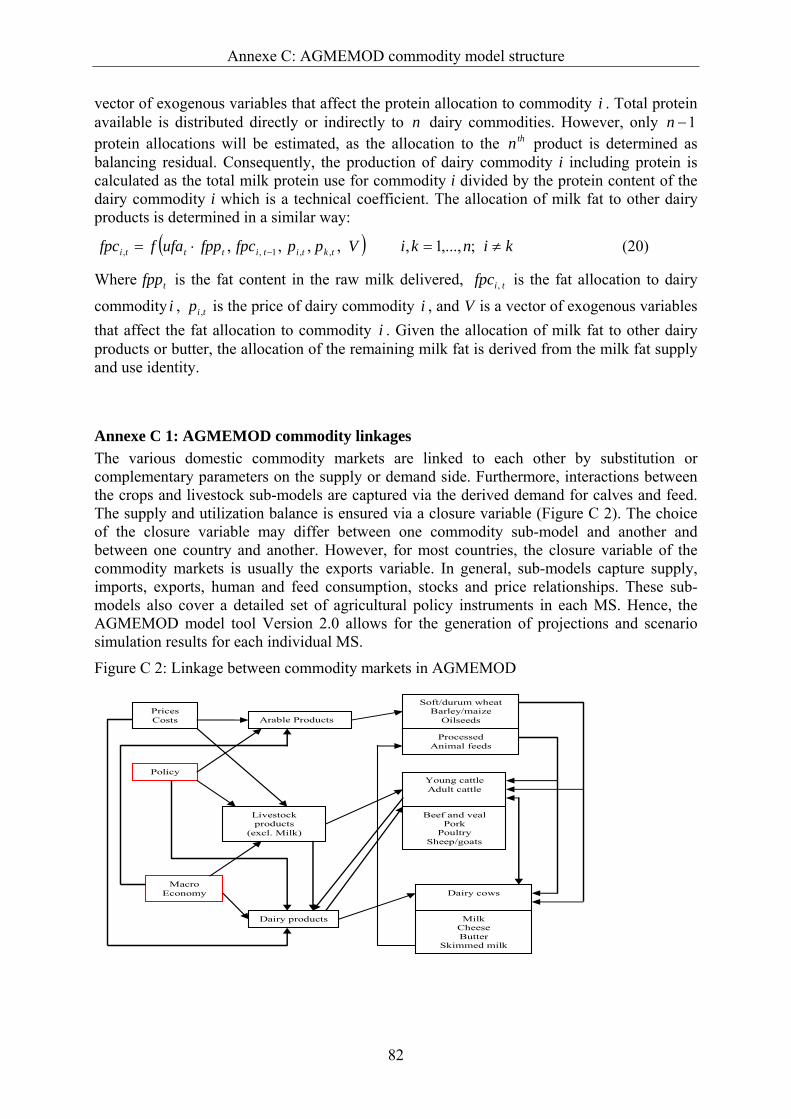
Annexe C: AGMEMOD commodity model structure
82
vector of exogenous variables that affect the protein allocation to commodity i . Total protein available is distributed directly or indirectly to n dairy commodities. However, only 1−n protein allocations will be estimated, as the allocation to the thn product is determined as balancing residual. Consequently, the production of dairy commodity i including protein is calculated as the total milk protein use for commodity i divided by the protein content of the dairy commodity i which is a technical coefficient. The allocation of milk fat to other dairy products is determined in a similar way:
( )Vppfpcfppufaffpc tktitittti ,,,, ,,1,, −⋅= kinki ≠= ;,...,1, (20)
Where tfpp is the fat content in the raw milk delivered, tifpc , is the fat allocation to dairy
commodity i , tip , is the price of dairy commodity i , and V is a vector of exogenous variables that affect the fat allocation to commodity i . Given the allocation of milk fat to other dairy products or butter, the allocation of the remaining milk fat is derived from the milk fat supply and use identity.
Annexe C 1: AGMEMOD commodity linkages The various domestic commodity markets are linked to each other by substitution or complementary parameters on the supply or demand side. Furthermore, interactions between the crops and livestock sub-models are captured via the derived demand for calves and feed. The supply and utilization balance is ensured via a closure variable (Figure C 2). The choice of the closure variable may differ between one commodity sub-model and another and between one country and another. However, for most countries, the closure variable of the commodity markets is usually the exports variable. In general, sub-models capture supply, imports, exports, human and feed consumption, stocks and price relationships. These sub-models also cover a detailed set of agricultural policy instruments in each MS. Hence, the AGMEMOD model tool Version 2.0 allows for the generation of projections and scenario simulation results for each individual MS.
Figure C 2: Linkage between commodity markets in AGMEMOD
Arable Products
Soft/durum wheat Barley/maize
Oilseeds
Processed Animal feeds
Young cattleAdult cattle
Beef and veal Pork
Poultry Sheep/goats
Livestock products
(excl. Milk)
Dairy products
Dairy cows
Milk Cheese Butter
Skimmed milk
Macro Economy
Policy
Prices Costs
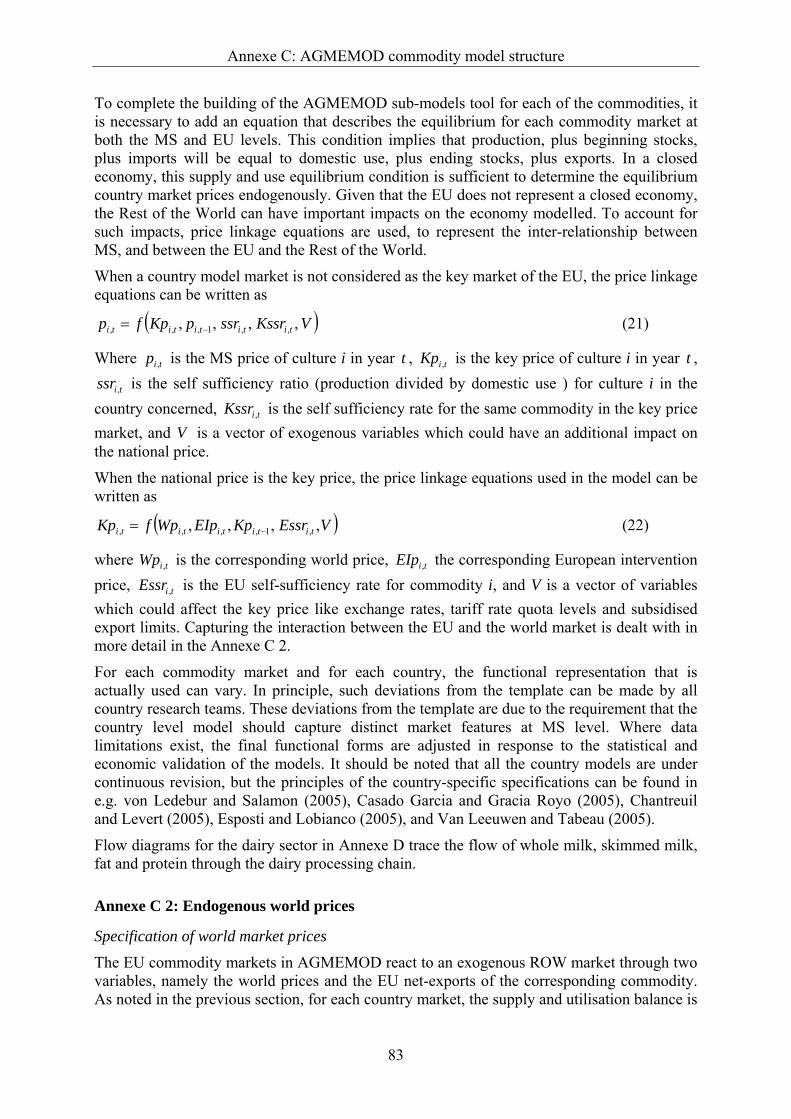
Annexe C: AGMEMOD commodity model structure
83
To complete the building of the AGMEMOD sub-models tool for each of the commodities, it is necessary to add an equation that describes the equilibrium for each commodity market at both the MS and EU levels. This condition implies that production, plus beginning stocks, plus imports will be equal to domestic use, plus ending stocks, plus exports. In a closed economy, this supply and use equilibrium condition is sufficient to determine the equilibrium country market prices endogenously. Given that the EU does not represent a closed economy, the Rest of the World can have important impacts on the economy modelled. To account for such impacts, price linkage equations are used, to represent the inter-relationship between MS, and between the EU and the Rest of the World.
When a country model market is not considered as the key market of the EU, the price linkage equations can be written as
( )VKssrssrpKpfp tititititi ,,,, ,,1,,, −= (21)
Where tip , is the MS price of culture i in year t , tiKp , is the key price of culture i in year t ,
tissr , is the self sufficiency ratio (production divided by domestic use ) for culture i in the country concerned, tiKssr , is the self sufficiency rate for the same commodity in the key price market, and V is a vector of exogenous variables which could have an additional impact on the national price.
When the national price is the key price, the price linkage equations used in the model can be written as
( )VEssrKpEIpWpfKp tititititi ,,,, ,1,,,, −= (22)
where tiWp , is the corresponding world price, tiEIp , the corresponding European intervention price, tiEssr , is the EU self-sufficiency rate for commodity i, and V is a vector of variables which could affect the key price like exchange rates, tariff rate quota levels and subsidised export limits. Capturing the interaction between the EU and the world market is dealt with in more detail in the Annexe C 2.
For each commodity market and for each country, the functional representation that is actually used can vary. In principle, such deviations from the template can be made by all country research teams. These deviations from the template are due to the requirement that the country level model should capture distinct market features at MS level. Where data limitations exist, the final functional forms are adjusted in response to the statistical and economic validation of the models. It should be noted that all the country models are under continuous revision, but the principles of the country-specific specifications can be found in e.g. von Ledebur and Salamon (2005), Casado Garcia and Gracia Royo (2005), Chantreuil and Levert (2005), Esposti and Lobianco (2005), and Van Leeuwen and Tabeau (2005).
Flow diagrams for the dairy sector in Annexe D trace the flow of whole milk, skimmed milk, fat and protein through the dairy processing chain.
Annexe C 2: Endogenous world prices
Specification of world market prices
The EU commodity markets in AGMEMOD react to an exogenous ROW market through two variables, namely the world prices and the EU net-exports of the corresponding commodity. As noted in the previous section, for each country market, the supply and utilisation balance is
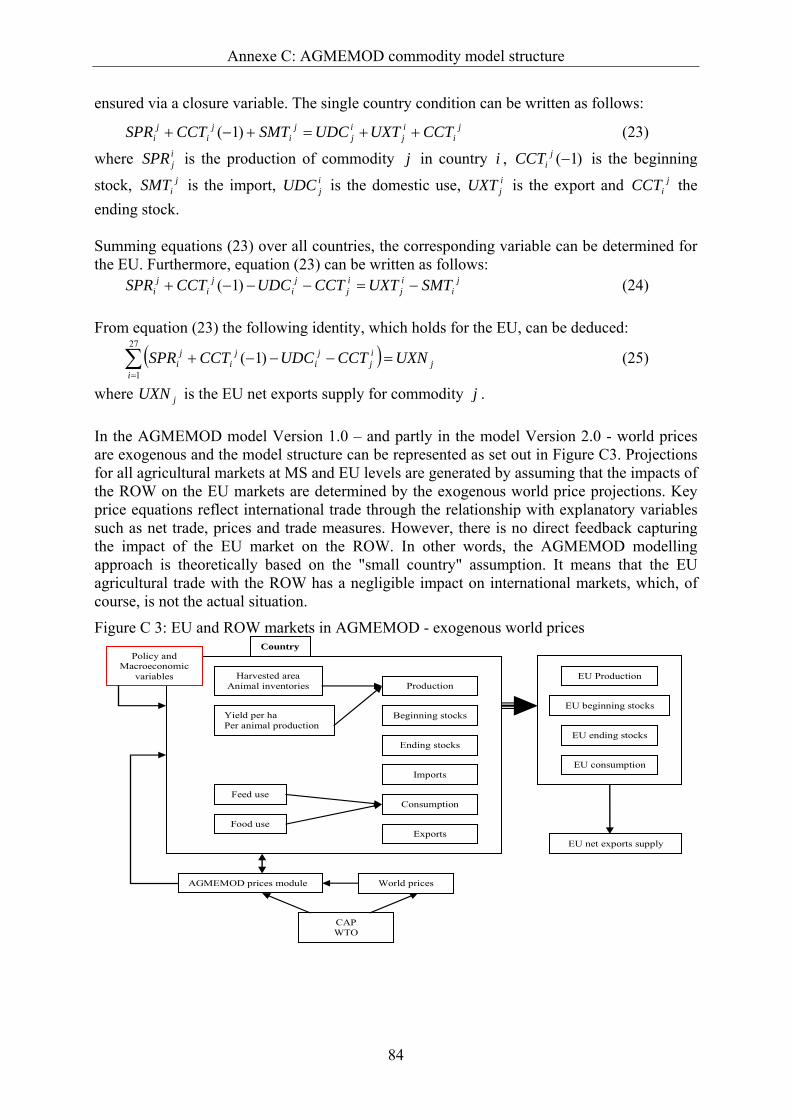
Annexe C: AGMEMOD commodity model structure
84
ensured via a closure variable. The single country condition can be written as follows: j
iij
ij
ji
ji
ji CCTUXTUDCSMTCCTSPR ++=+−+ )1( (23)
where ijSPR is the production of commodity j in country i , )1(−j
iCCT is the beginning
stock, jiSMT is the import, i
jUDC is the domestic use, ijUXT is the export and j
iCCT the ending stock. Summing equations (23) over all countries, the corresponding variable can be determined for the EU. Furthermore, equation (23) can be written as follows:
ji
ij
ij
ji
ji
ji SMTUXTCCTUDCCCTSPR −=−−−+ )1( (24)
From equation (23) the following identity, which holds for the EU, can be deduced:
( ) ji
ij
ji
ji
ji UXNCCTUDCCCTSPR =−−−+∑
=
27
1)1( (25)
where jUXN is the EU net exports supply for commodity j . In the AGMEMOD model Version 1.0 – and partly in the model Version 2.0 - world prices are exogenous and the model structure can be represented as set out in Figure C3. Projections for all agricultural markets at MS and EU levels are generated by assuming that the impacts of the ROW on the EU markets are determined by the exogenous world price projections. Key price equations reflect international trade through the relationship with explanatory variables such as net trade, prices and trade measures. However, there is no direct feedback capturing the impact of the EU market on the ROW. In other words, the AGMEMOD modelling approach is theoretically based on the "small country" assumption. It means that the EU agricultural trade with the ROW has a negligible impact on international markets, which, of course, is not the actual situation.
Figure C 3: EU and ROW markets in AGMEMOD - exogenous world prices Country
Policy and Macroeconomic
variables Harvested area Animal inventories
Yield per ha Per animal production
Feed use
Food use
Production
Beginning stocks
Ending stocks
Imports
Consumption
Exports
EU Production
EU beginning stocks
EU ending stocks
EU consumption
EU net exports supply
World prices AGMEMOD prices module
CAP WTO
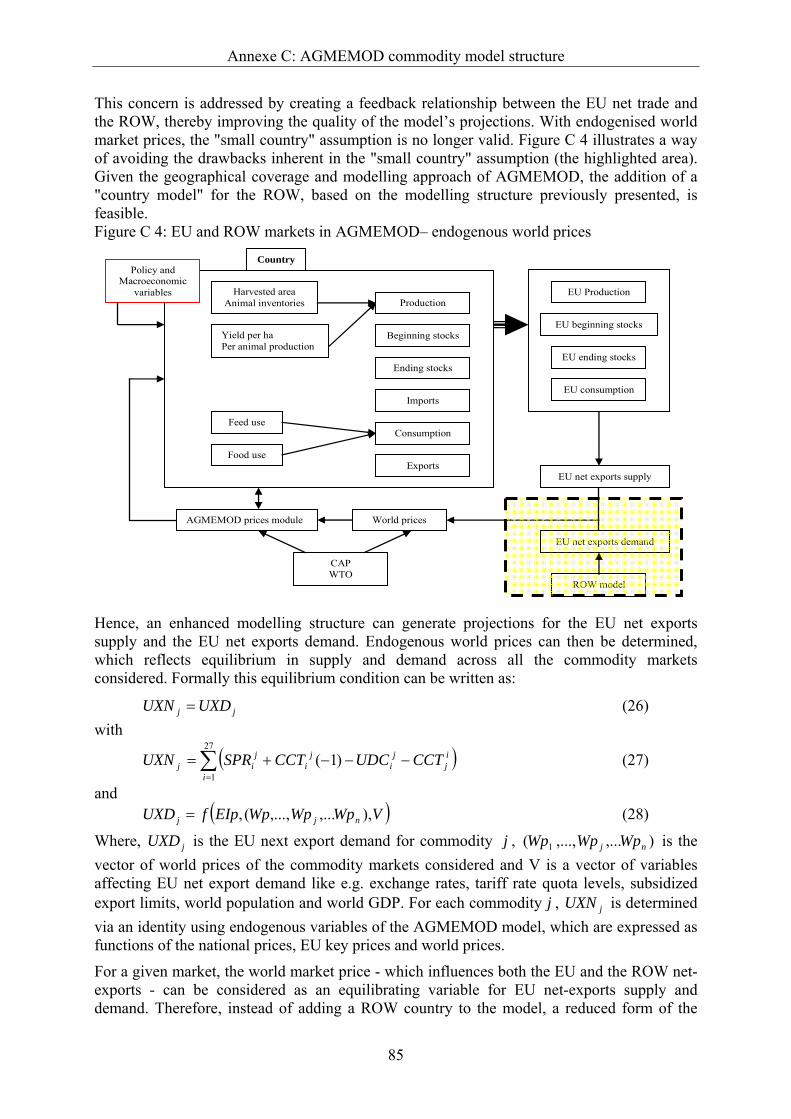
Annexe C: AGMEMOD commodity model structure
85
This concern is addressed by creating a feedback relationship between the EU net trade and the ROW, thereby improving the quality of the model’s projections. With endogenised world market prices, the "small country" assumption is no longer valid. Figure C 4 illustrates a way of avoiding the drawbacks inherent in the "small country" assumption (the highlighted area). Given the geographical coverage and modelling approach of AGMEMOD, the addition of a "country model" for the ROW, based on the modelling structure previously presented, is feasible. Figure C 4: EU and ROW markets in AGMEMOD– endogenous world prices
Country Policy and
Macroeconomic variables Harvested area
Animal inventories
Yield per ha Per animal production
Feed use
Food use
Production
Beginning stocks
Ending stocks
Imports
Consumption
Exports
EU Production
EU beginning stocks
EU ending stocks
EU consumption
EU net exports supply
EU net exports demand
ROW model
World prices AGMEMOD prices module
CAP WTO
Hence, an enhanced modelling structure can generate projections for the EU net exports supply and the EU net exports demand. Endogenous world prices can then be determined, which reflects equilibrium in supply and demand across all the commodity markets considered. Formally this equilibrium condition can be written as:
jj UXDUXN = (26) with
( )∑=
−−−+=27
1)1(
i
ij
ji
ji
jij CCTUDCCCTSPRUXN (27)
and ( )VWpWpWpEIpfUXD njj ),,...,...,(,= (28)
Where, jUXD is the EU next export demand for commodity j , ),...,...,( 1 nj WpWpWp is the vector of world prices of the commodity markets considered and V is a vector of variables affecting EU net export demand like e.g. exchange rates, tariff rate quota levels, subsidized export limits, world population and world GDP. For each commodity j , jUXN is determined via an identity using endogenous variables of the AGMEMOD model, which are expressed as functions of the national prices, EU key prices and world prices.
For a given market, the world market price - which influences both the EU and the ROW net-exports - can be considered as an equilibrating variable for EU net-exports supply and demand. Therefore, instead of adding a ROW country to the model, a reduced form of the
Annexe C: AGMEMOD commodity model structure
86
world market price equation is introduced. As a result, the world market price is specified as a function of EU net-exports and could also be influenced by demand shifters such as the world GDP and population as well as by policy variables as export refunds. Accordingly, the endogenisation of the world prices will lead to the following price transmission in AGMEMOD, which is a three step process. As an example, the butter market is considered.
The world price for butter is explained as a function of EU net-exports, demand shifters and policy variables. Then, the world price for butter is deduced and used in the AGMEMOD key price equation for butter. The key price for butter is the German one, which depends on the world price, the European intervention price, the self-sufficiency ratio for EU, the German self-sufficiency rate and policy variables such as TRQ and subsidized exports limits (SXL). Finally, for non key markets, the butter price depends on the German key price, the corresponding non key market self-sufficiency rate and the German self-sufficiency rate. Figure C 5 summarises this price transmission.
Figure C 5: Butter price transmission in AGMEMOD – endogenous world prices
World price Key price Non key market prices
Export refunds EU net exports
TRQ, SXL EU and German self-
sufficiency rates
Self-sufficiency rates in key and non key markets
Population, GDP
Finally, the functional form for the world market prices of dairy commodities in AGMEMOD can be expressed as follows:
( )VwmpuxrUXNfwmp titititi ,,, 1,,,, −= (29)
Where tiwmp , is the world market price (in USD/tonne) for dairy product i, tiUXN , is the EU net export for commodity i, tiuxr , are the EU export refunds (in USD/tonne) for dairy product i and V is a vector of variables affecting EU net export demand such as exchange rates, tariff rate quota levels, subsidized export limits, world population and world GDP.
Annexe C: AGMEMOD commodity model structure
87
Data
Most of the equations are estimated with annual data for the period 1973-2004 obtained from the AGMEMOD database (or a shorter period in case of insufficient data). The macro-economic data for the Rest of the World and data for world prices are obtained from OECD, ERS-USDA and FAPRI databases. Finally, information on policy variables like export refunds were obtained from the European Commission.
The data for EU net export variables have been calculated from the AGMEMOD database taking into account the EU enlargement over the period 1973-2004 (Table C 1).
Table C 1: EU country coverage in AGMEMOD database
1973 – 1980 Belgium, Luxembourg, Denmark, Germany, France, Ireland, Italy, The Netherlands, United Kingdom (EU9)
1981 – 1985 EU-9 plus Greece (EU10)
1986 – 1994 EU-10 plus Portugal and Spain (EU-12)
1995 – 2003 EU-12 plus Austria, Finland and Sweden (EU-15)
2004 EU-15 plus the Czech Republic, Estonia, Hungary, Latvia, Lithuania, Poland, the Slovak Republic and Slovenia. Malta, Cyprus are not included (EU-25)
2007 EU-25 plus Bulgaria and Romania (EU-27)
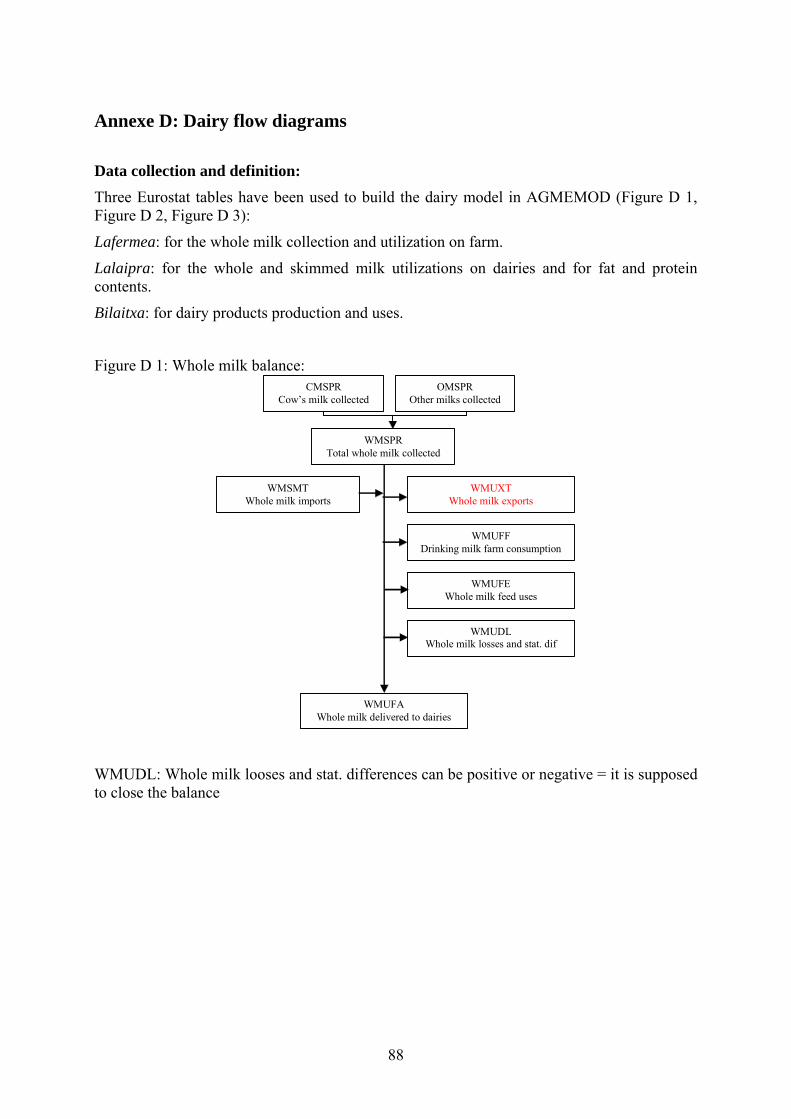
88
Annexe D: Dairy flow diagrams
Data collection and definition: Three Eurostat tables have been used to build the dairy model in AGMEMOD (Figure D 1, Figure D 2, Figure D 3):
Lafermea: for the whole milk collection and utilization on farm.
Lalaipra: for the whole and skimmed milk utilizations on dairies and for fat and protein contents.
Bilaitxa: for dairy products production and uses.
Figure D 1: Whole milk balance: CMSPR
Cow’s milk collected OMSPR
Other milks collected
WMSPRTotal whole milk collected
WMSMT Whole milk imports
WMUFFDrinking milk farm consumption
WMUFEWhole milk feed uses
WMUDLWhole milk losses and stat. dif
WMUXTWhole milk exports
WMUFAWhole milk delivered to dairies
WMUDL: Whole milk looses and stat. differences can be positive or negative = it is supposed to close the balance
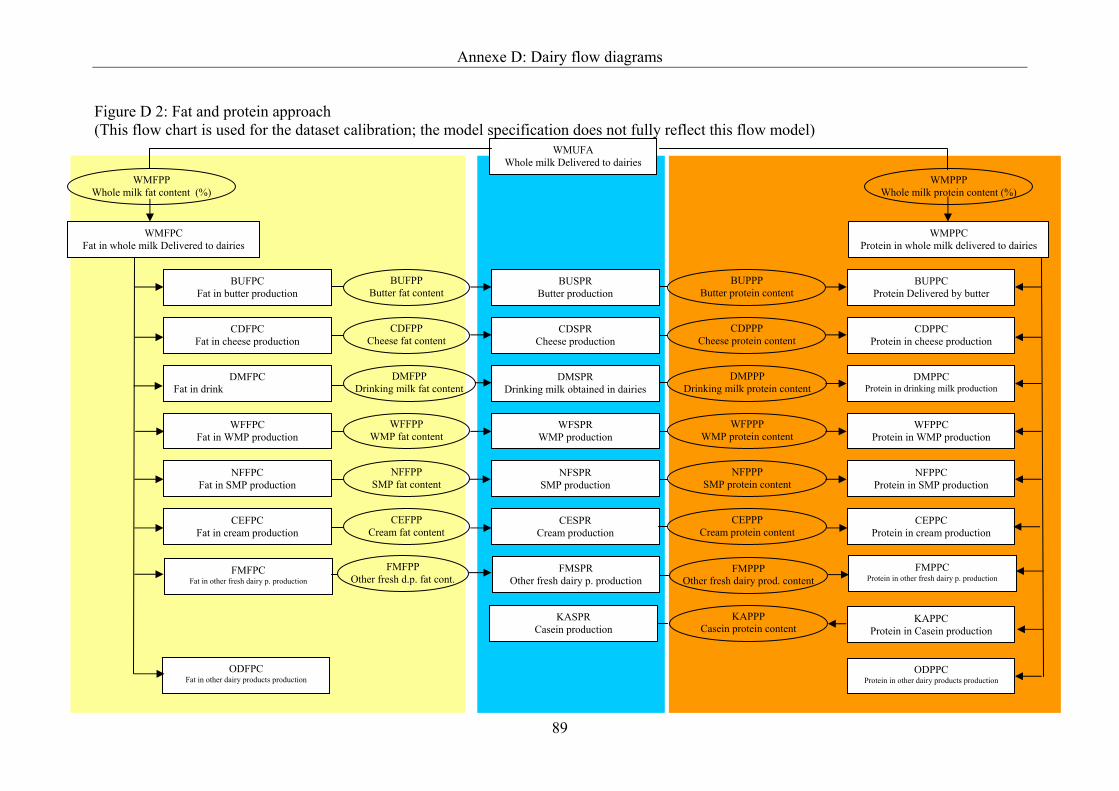
Annexe D: Dairy flow diagrams
89
Figure D 2: Fat and protein approach (This flow chart is used for the dataset calibration; the model specification does not fully reflect this flow model)
WMFPC Fat in whole milk Delivered to dairies
WMUFA Whole milk Delivered to dairies
BUFPC Fat in butter production
WMFPP Whole milk fat content (%)
BUFPP Butter fat content
BUSPR Butter production
BUPPP Butter protein content
BUPPC Protein Delivered by butter
CDFPC Fat in cheese production
CDFPP Cheese fat content
CDSPR Cheese production
CDPPP Cheese protein content
CDPPC Protein in cheese production
DMFPC Fat in drink
DMFPP Drinking milk fat content
DMSPR Drinking milk obtained in dairies
DMPPP Drinking milk protein content
DMPPC Protein in drinking milk production
WFFPC Fat in WMP production
WFFPP WMP fat content
WFSPR WMP production
WFPPP WMP protein content
WFPPC Protein in WMP production
NFFPC Fat in SMP production
NFFPP SMP fat content
NFSPR SMP production
NFPPP SMP protein content
NFPPC Protein in SMP production
CEFPC Fat in cream production
CEFPP Cream fat content
CESPR Cream production
CEPPP Cream protein content
CEPPC Protein in cream production
ODFPC Fat in other dairy products production
KAPPC Protein in Casein production
WMPPP Whole milk protein content (%)
WMPPC Protein in whole milk delivered to dairies
FMPPC Protein in other fresh dairy p. production
FMSPR Other fresh dairy p. production
FMPPP Other fresh dairy prod. content
FMFPP Other fresh d.p. fat cont.
FMFPC Fat in other fresh dairy p. production
ODPPC Protein in other dairy products production
KASPR Casein production
KAPPP Casein protein content
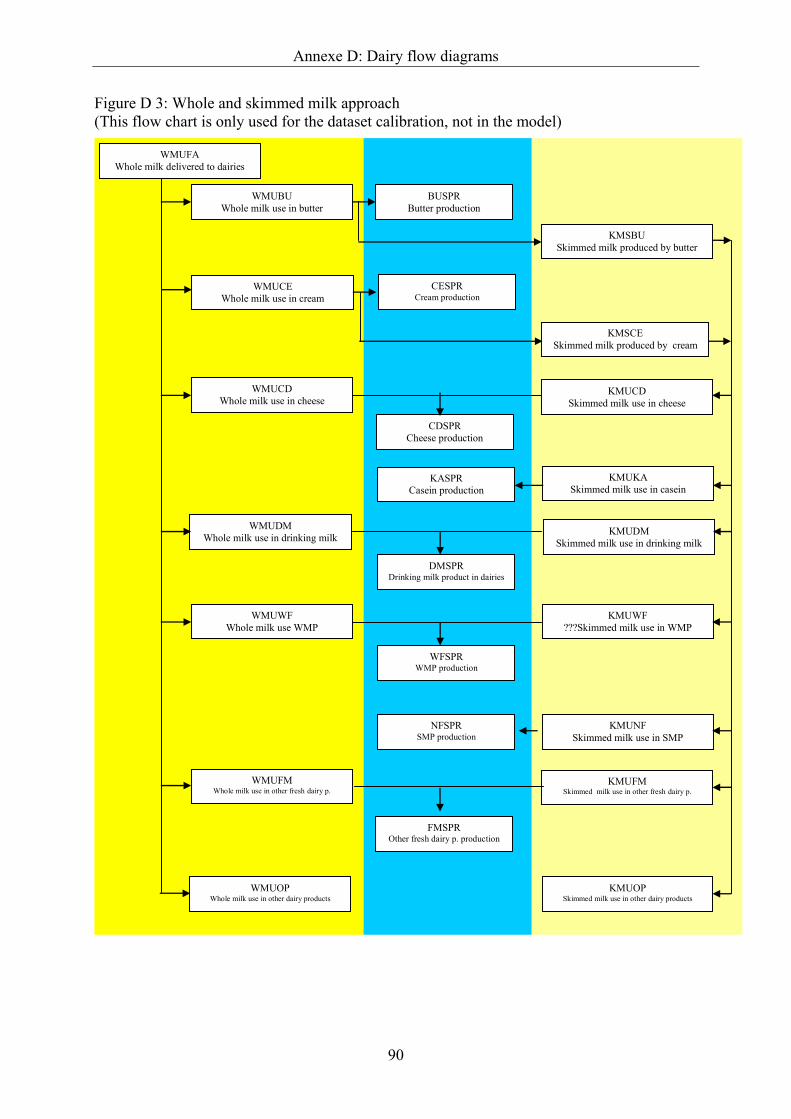
Annexe D: Dairy flow diagrams
90
Figure D 3: Whole and skimmed milk approach (This flow chart is only used for the dataset calibration, not in the model)
WMUBU Whole milk use in butter
WMUFA Whole milk delivered to dairies
WMUOP Whole milk use in other dairy products
WMUCE Whole milk use in cream
WMUWF Whole milk use WMP
WMUDM Whole milk use in drinking milk
WMUCD Whole milk use in cheese
BUSPR Butter production
KMSBU Skimmed milk produced by butter
CDSPR Cheese production
KMUCD Skimmed milk use in cheese
KASPR Casein production
KMUDM Skimmed milk use in drinking milk
DMSPR Drinking milk product in dairies
KMUWF ???Skimmed milk use in WMP
WFSPR WMP production
KMUNF Skimmed milk use in SMP
NFSPR SMP production
KMSCE Skimmed milk produced by cream
CESPR Cream production
KMUOP Skimmed milk use in other dairy products
WMUFM Whole milk use in other fresh dairy p.
FMSPR Other fresh dairy p. production
KMUFM Skimmed milk use in other fresh dairy p.
KMUKA Skimmed milk use in casein
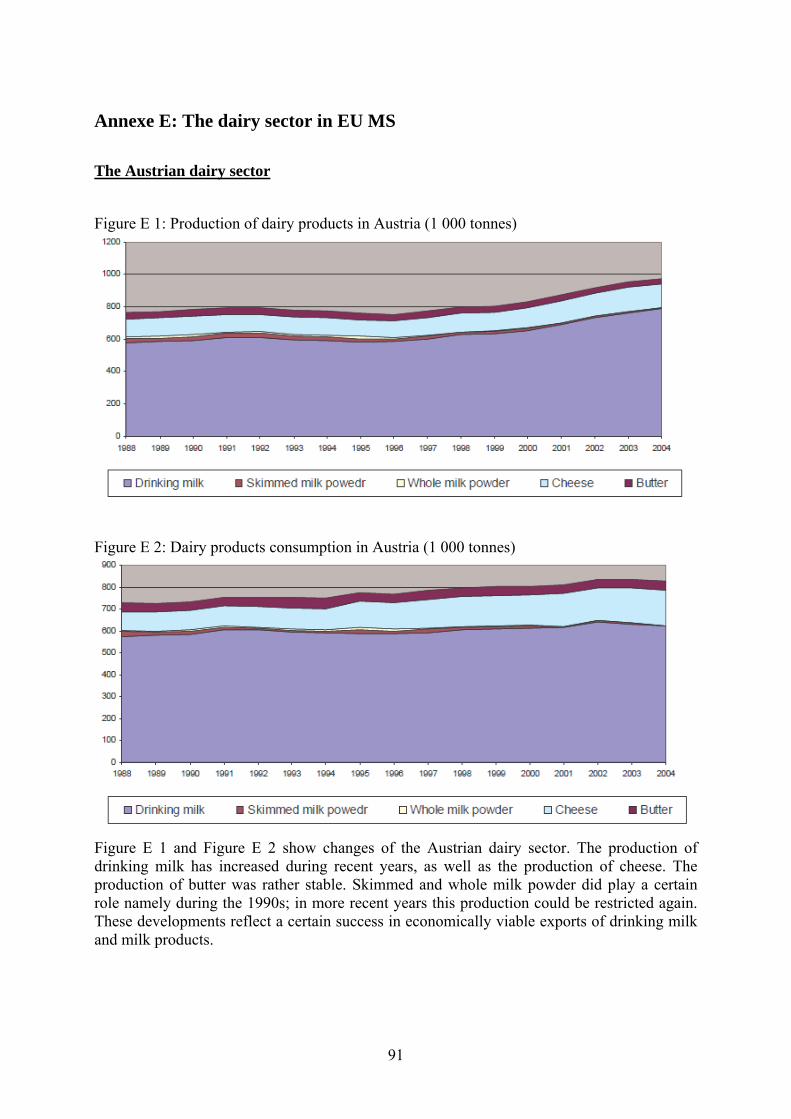
91
Annexe E: The dairy sector in EU MS
The Austrian dairy sector
Figure E 1: Production of dairy products in Austria (1 000 tonnes)
Figure E 2: Dairy products consumption in Austria (1 000 tonnes)
Figure E 1 and Figure E 2 show changes of the Austrian dairy sector. The production of drinking milk has increased during recent years, as well as the production of cheese. The production of butter was rather stable. Skimmed and whole milk powder did play a certain role namely during the 1990s; in more recent years this production could be restricted again. These developments reflect a certain success in economically viable exports of drinking milk and milk products.
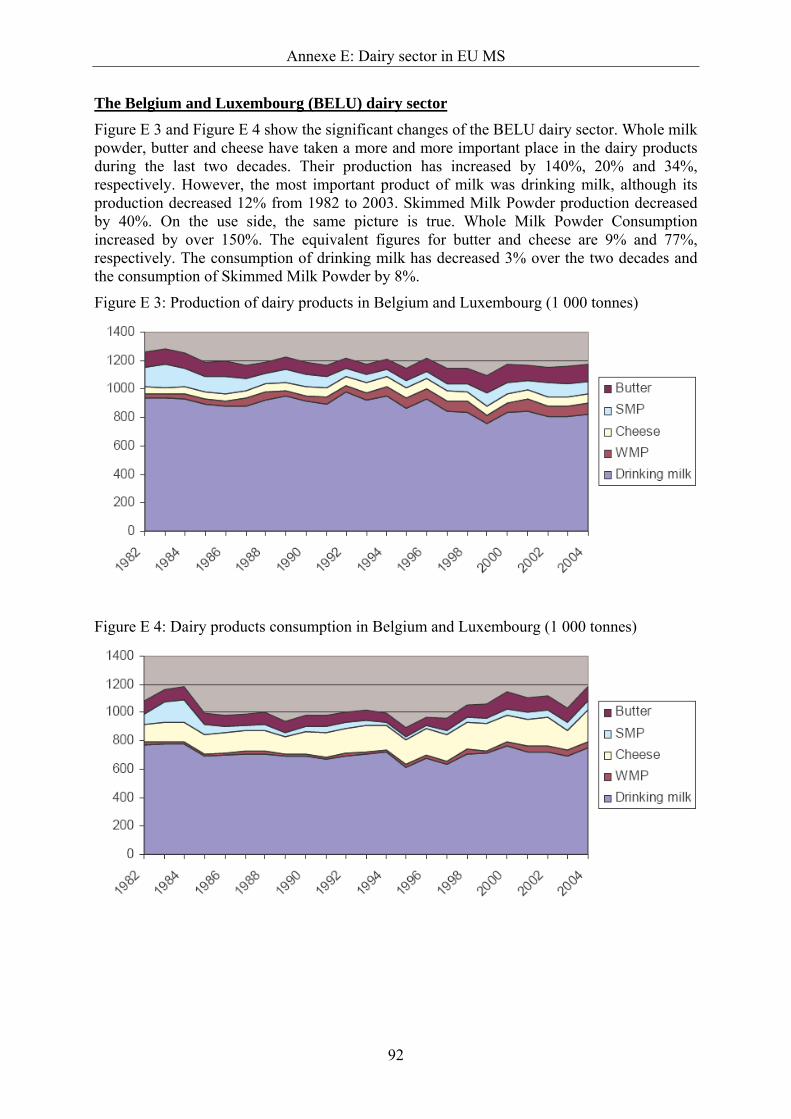
Annexe E: Dairy sector in EU MS
92
The Belgium and Luxembourg (BELU) dairy sector Figure E 3 and Figure E 4 show the significant changes of the BELU dairy sector. Whole milk powder, butter and cheese have taken a more and more important place in the dairy products during the last two decades. Their production has increased by 140%, 20% and 34%, respectively. However, the most important product of milk was drinking milk, although its production decreased 12% from 1982 to 2003. Skimmed Milk Powder production decreased by 40%. On the use side, the same picture is true. Whole Milk Powder Consumption increased by over 150%. The equivalent figures for butter and cheese are 9% and 77%, respectively. The consumption of drinking milk has decreased 3% over the two decades and the consumption of Skimmed Milk Powder by 8%.
Figure E 3: Production of dairy products in Belgium and Luxembourg (1 000 tonnes)
Figure E 4: Dairy products consumption in Belgium and Luxembourg (1 000 tonnes)
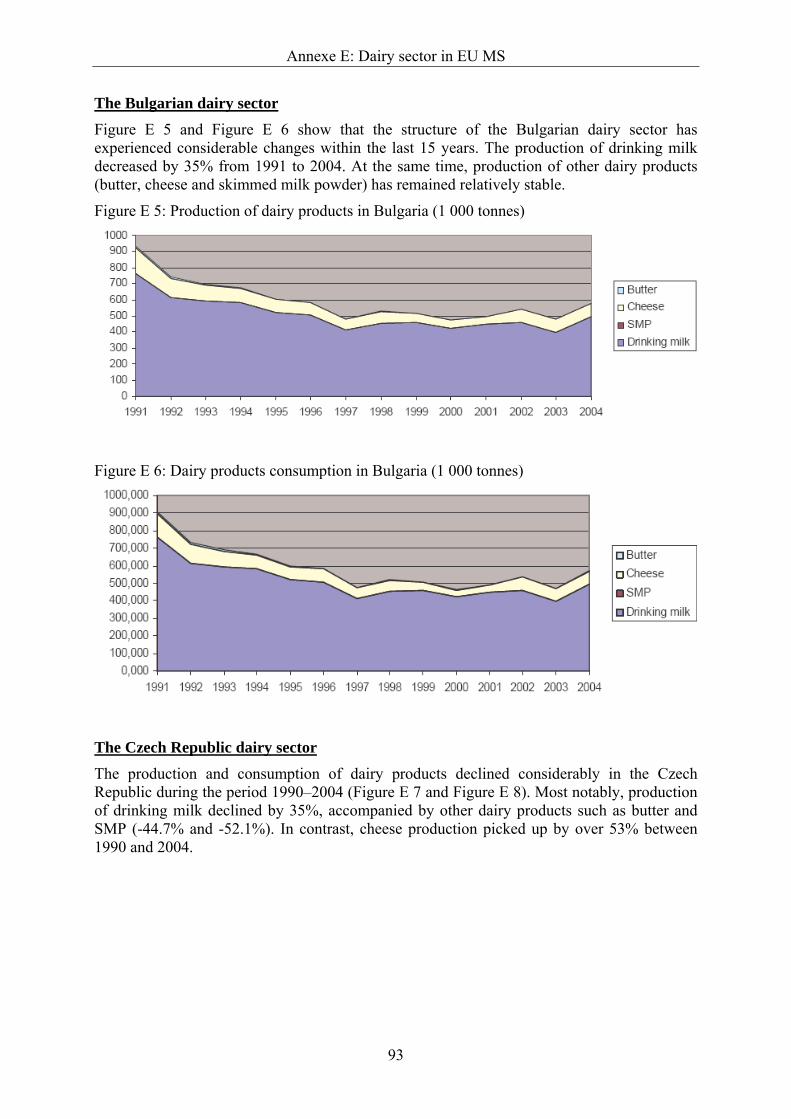
Annexe E: Dairy sector in EU MS
93
The Bulgarian dairy sector Figure E 5 and Figure E 6 show that the structure of the Bulgarian dairy sector has experienced considerable changes within the last 15 years. The production of drinking milk decreased by 35% from 1991 to 2004. At the same time, production of other dairy products (butter, cheese and skimmed milk powder) has remained relatively stable.
Figure E 5: Production of dairy products in Bulgaria (1 000 tonnes)
Figure E 6: Dairy products consumption in Bulgaria (1 000 tonnes)
The Czech Republic dairy sector The production and consumption of dairy products declined considerably in the Czech Republic during the period 1990–2004 (Figure E 7 and Figure E 8). Most notably, production of drinking milk declined by 35%, accompanied by other dairy products such as butter and SMP (-44.7% and -52.1%). In contrast, cheese production picked up by over 53% between 1990 and 2004.
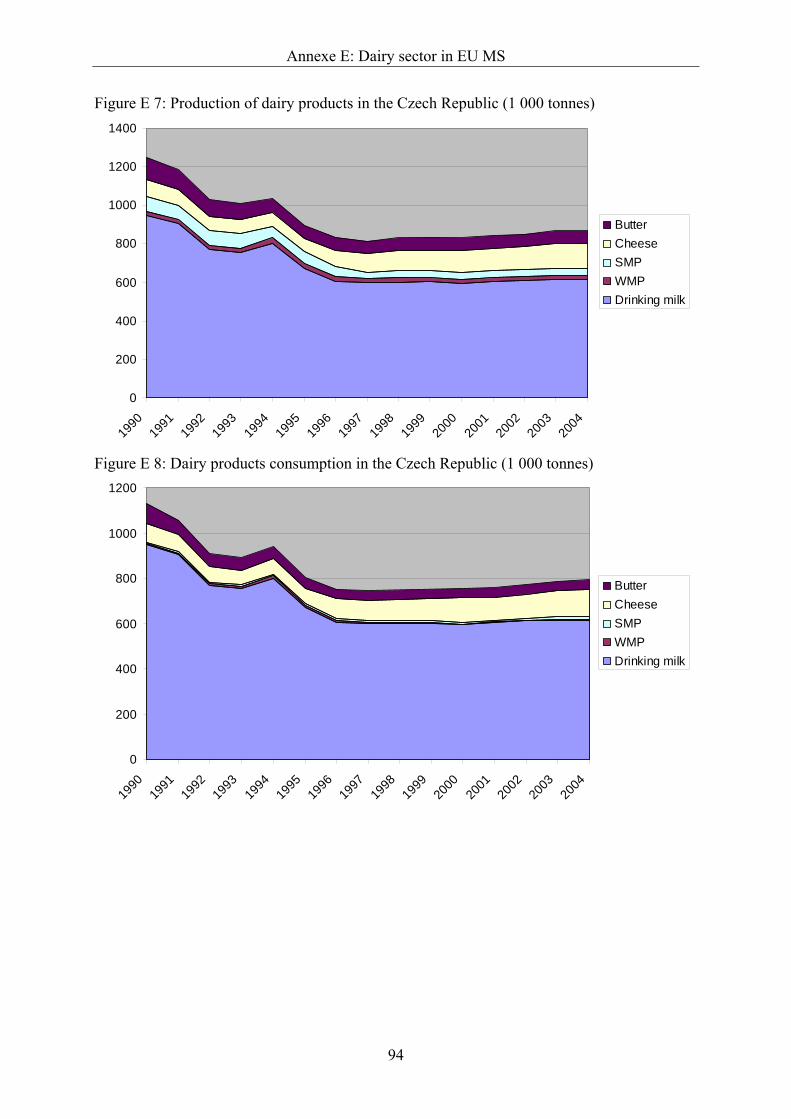
Annexe E: Dairy sector in EU MS
94
Figure E 7: Production of dairy products in the Czech Republic (1 000 tonnes)
0
200
400
600
800
1000
1200
1400
1990
1991
1992
1993
1994
1995
1996
1997
1998
1999
2000
2001
2002
2003
2004
ButterCheeseSMPWMPDrinking milk
Figure E 8: Dairy products consumption in the Czech Republic (1 000 tonnes)
0
200
400
600
800
1000
1200
1990
1991
1992
1993
1994
1995
1996
1997
1998
1999
2000
2001
2002
2003
2004
ButterCheeseSMPWMPDrinking milk
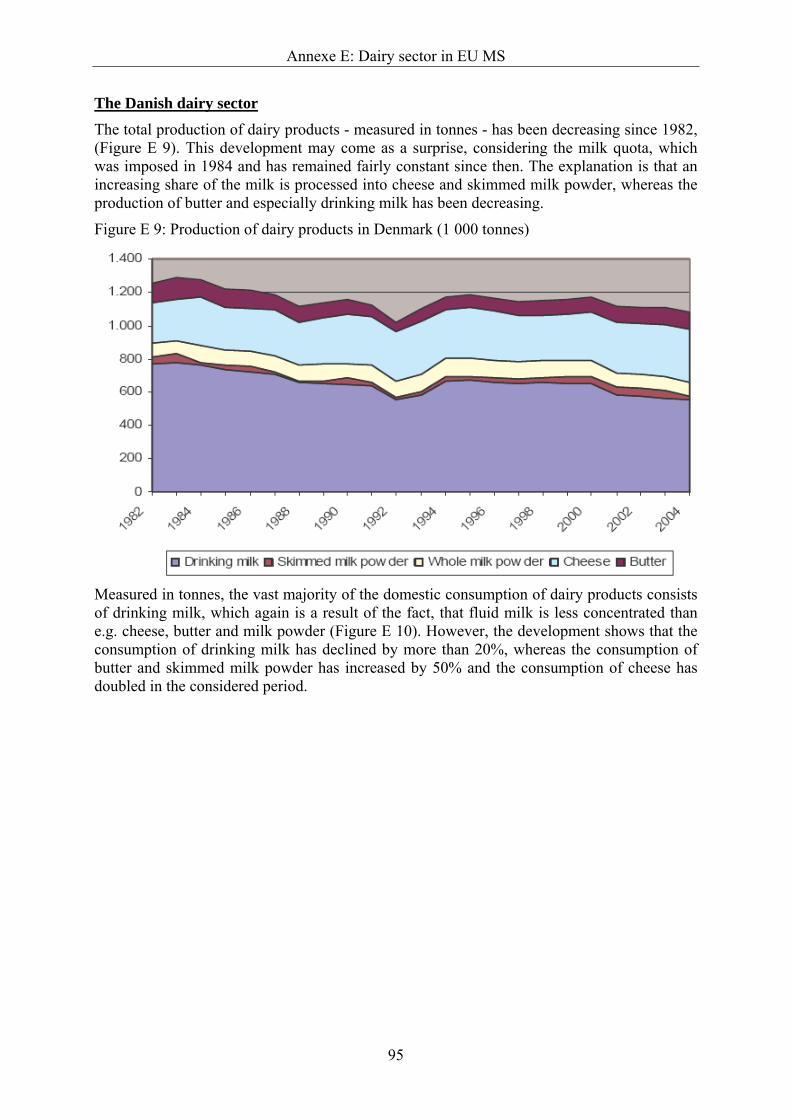
Annexe E: Dairy sector in EU MS
95
The Danish dairy sector The total production of dairy products - measured in tonnes - has been decreasing since 1982, (Figure E 9). This development may come as a surprise, considering the milk quota, which was imposed in 1984 and has remained fairly constant since then. The explanation is that an increasing share of the milk is processed into cheese and skimmed milk powder, whereas the production of butter and especially drinking milk has been decreasing.
Figure E 9: Production of dairy products in Denmark (1 000 tonnes)
Measured in tonnes, the vast majority of the domestic consumption of dairy products consists of drinking milk, which again is a result of the fact, that fluid milk is less concentrated than e.g. cheese, butter and milk powder (Figure E 10). However, the development shows that the consumption of drinking milk has declined by more than 20%, whereas the consumption of butter and skimmed milk powder has increased by 50% and the consumption of cheese has doubled in the considered period.
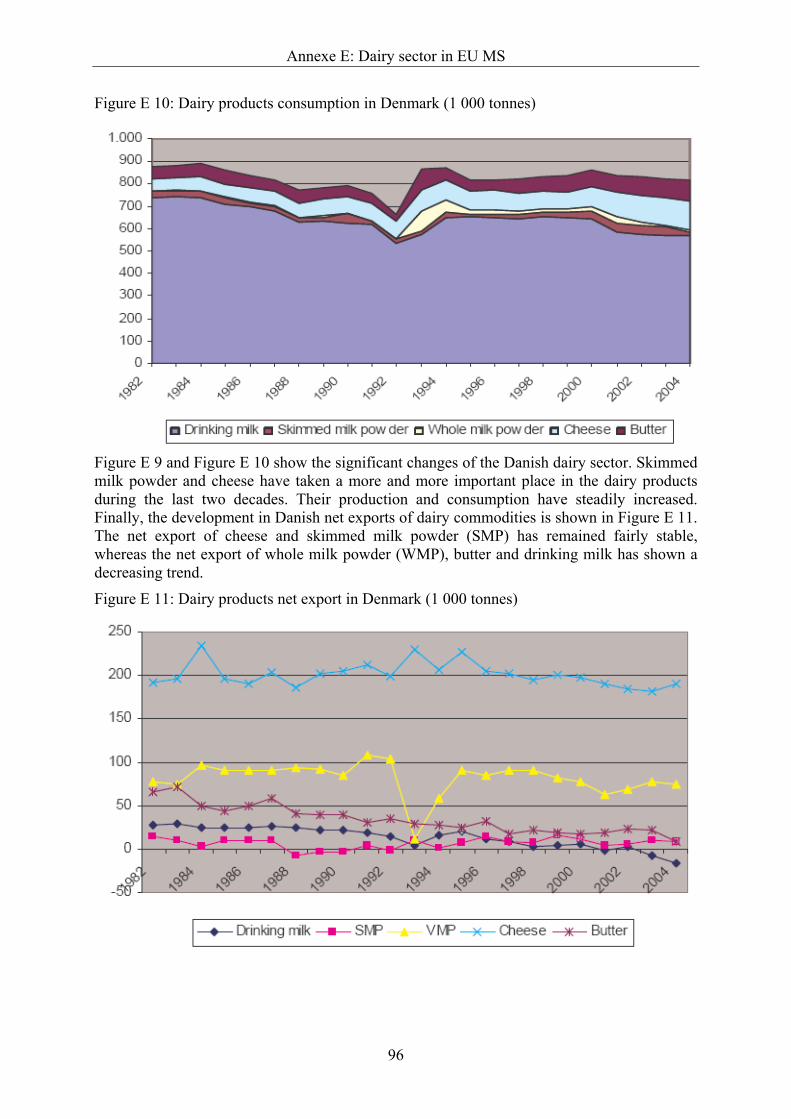
Annexe E: Dairy sector in EU MS
96
Figure E 10: Dairy products consumption in Denmark (1 000 tonnes)
Figure E 9 and Figure E 10 show the significant changes of the Danish dairy sector. Skimmed milk powder and cheese have taken a more and more important place in the dairy products during the last two decades. Their production and consumption have steadily increased. Finally, the development in Danish net exports of dairy commodities is shown in Figure E 11. The net export of cheese and skimmed milk powder (SMP) has remained fairly stable, whereas the net export of whole milk powder (WMP), butter and drinking milk has shown a decreasing trend.
Figure E 11: Dairy products net export in Denmark (1 000 tonnes)
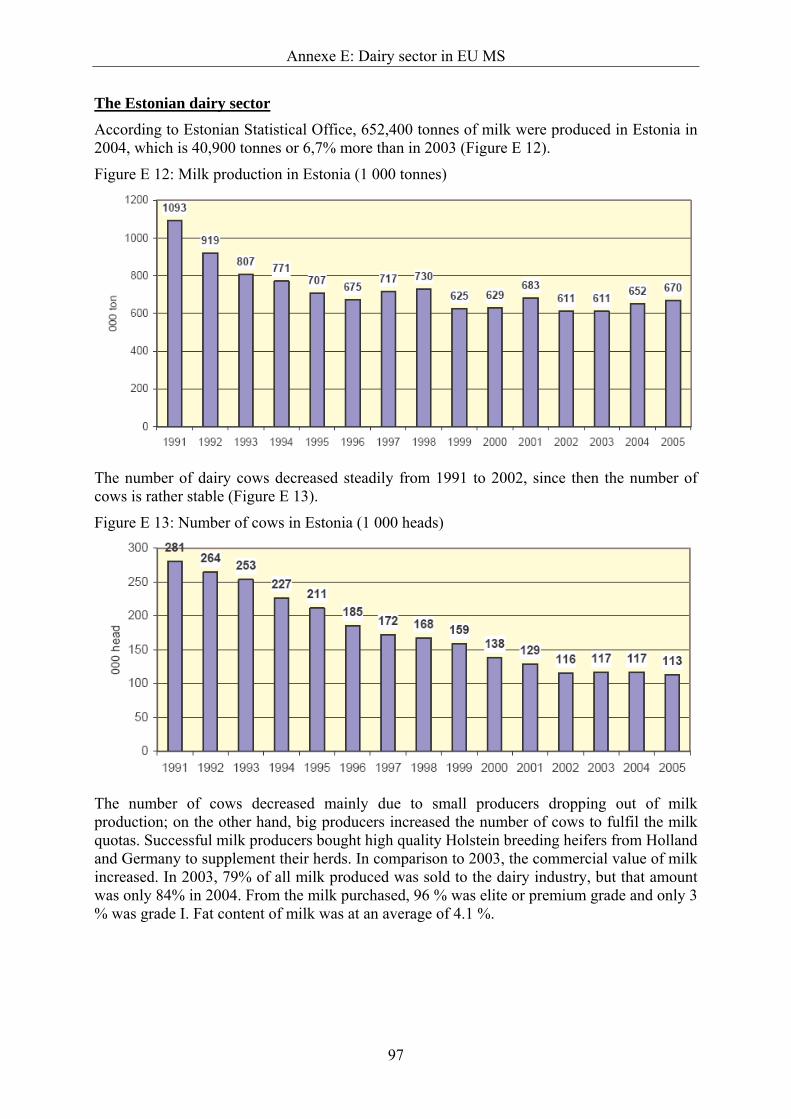
Annexe E: Dairy sector in EU MS
97
The Estonian dairy sector According to Estonian Statistical Office, 652,400 tonnes of milk were produced in Estonia in 2004, which is 40,900 tonnes or 6,7% more than in 2003 (Figure E 12).
Figure E 12: Milk production in Estonia (1 000 tonnes)
The number of dairy cows decreased steadily from 1991 to 2002, since then the number of cows is rather stable (Figure E 13).
Figure E 13: Number of cows in Estonia (1 000 heads)
The number of cows decreased mainly due to small producers dropping out of milk production; on the other hand, big producers increased the number of cows to fulfil the milk quotas. Successful milk producers bought high quality Holstein breeding heifers from Holland and Germany to supplement their herds. In comparison to 2003, the commercial value of milk increased. In 2003, 79% of all milk produced was sold to the dairy industry, but that amount was only 84% in 2004. From the milk purchased, 96 % was elite or premium grade and only 3 % was grade I. Fat content of milk was at an average of 4.1 %.
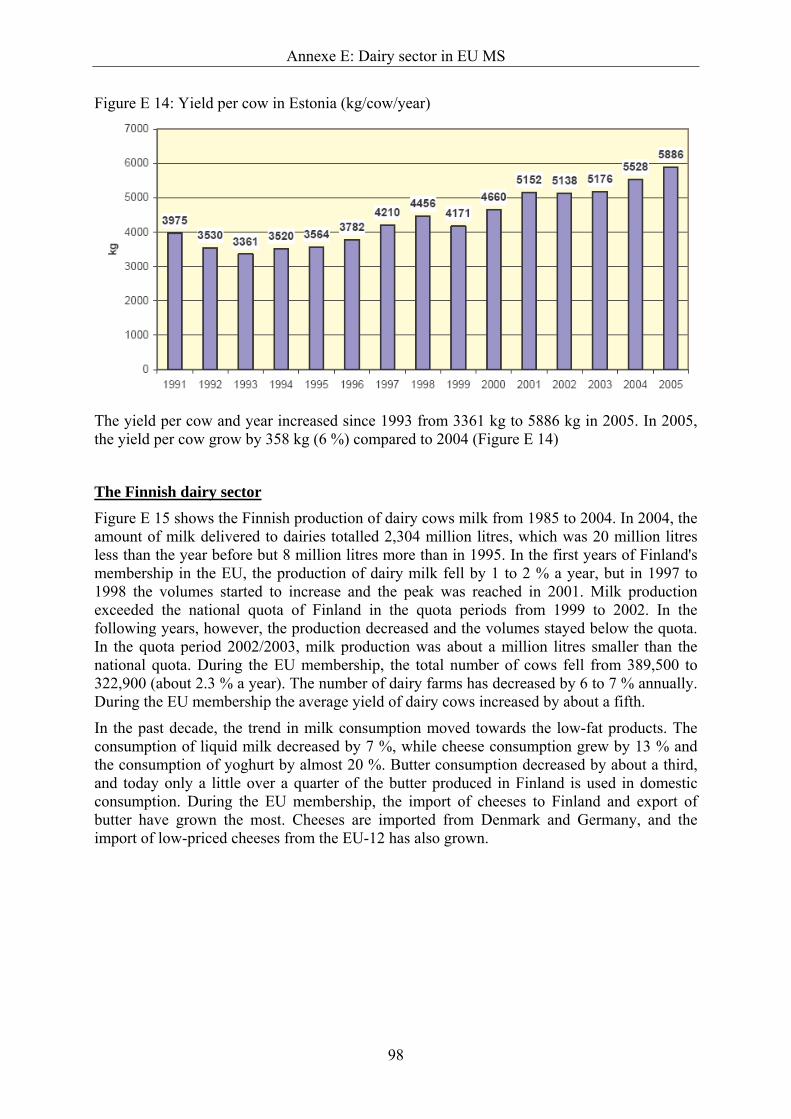
Annexe E: Dairy sector in EU MS
98
Figure E 14: Yield per cow in Estonia (kg/cow/year)
The yield per cow and year increased since 1993 from 3361 kg to 5886 kg in 2005. In 2005, the yield per cow grow by 358 kg (6 %) compared to 2004 (Figure E 14)
The Finnish dairy sector Figure E 15 shows the Finnish production of dairy cows milk from 1985 to 2004. In 2004, the amount of milk delivered to dairies totalled 2,304 million litres, which was 20 million litres less than the year before but 8 million litres more than in 1995. In the first years of Finland's membership in the EU, the production of dairy milk fell by 1 to 2 % a year, but in 1997 to 1998 the volumes started to increase and the peak was reached in 2001. Milk production exceeded the national quota of Finland in the quota periods from 1999 to 2002. In the following years, however, the production decreased and the volumes stayed below the quota. In the quota period 2002/2003, milk production was about a million litres smaller than the national quota. During the EU membership, the total number of cows fell from 389,500 to 322,900 (about 2.3 % a year). The number of dairy farms has decreased by 6 to 7 % annually. During the EU membership the average yield of dairy cows increased by about a fifth.
In the past decade, the trend in milk consumption moved towards the low-fat products. The consumption of liquid milk decreased by 7 %, while cheese consumption grew by 13 % and the consumption of yoghurt by almost 20 %. Butter consumption decreased by about a third, and today only a little over a quarter of the butter produced in Finland is used in domestic consumption. During the EU membership, the import of cheeses to Finland and export of butter have grown the most. Cheeses are imported from Denmark and Germany, and the import of low-priced cheeses from the EU-12 has also grown.
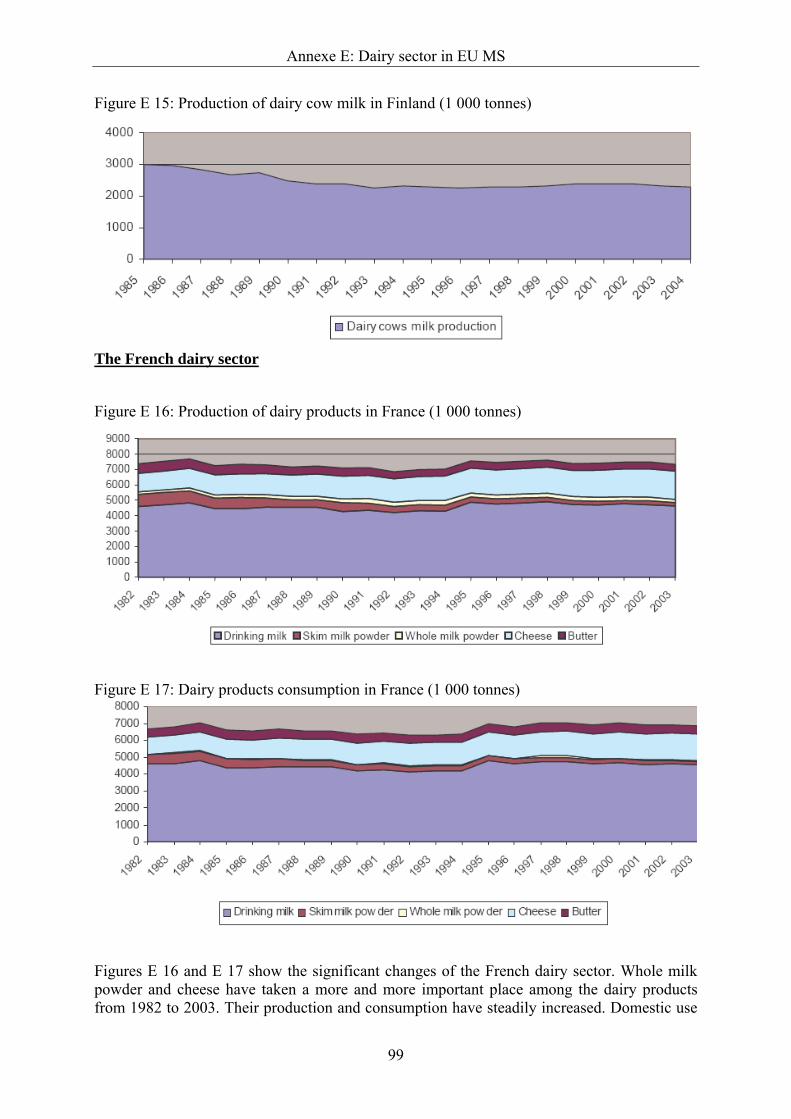
Annexe E: Dairy sector in EU MS
99
Figure E 15: Production of dairy cow milk in Finland (1 000 tonnes)
The French dairy sector
Figure E 16: Production of dairy products in France (1 000 tonnes)
Figure E 17: Dairy products consumption in France (1 000 tonnes)
Figures E 16 and E 17 show the significant changes of the French dairy sector. Whole milk powder and cheese have taken a more and more important place among the dairy products from 1982 to 2003. Their production and consumption have steadily increased. Domestic use
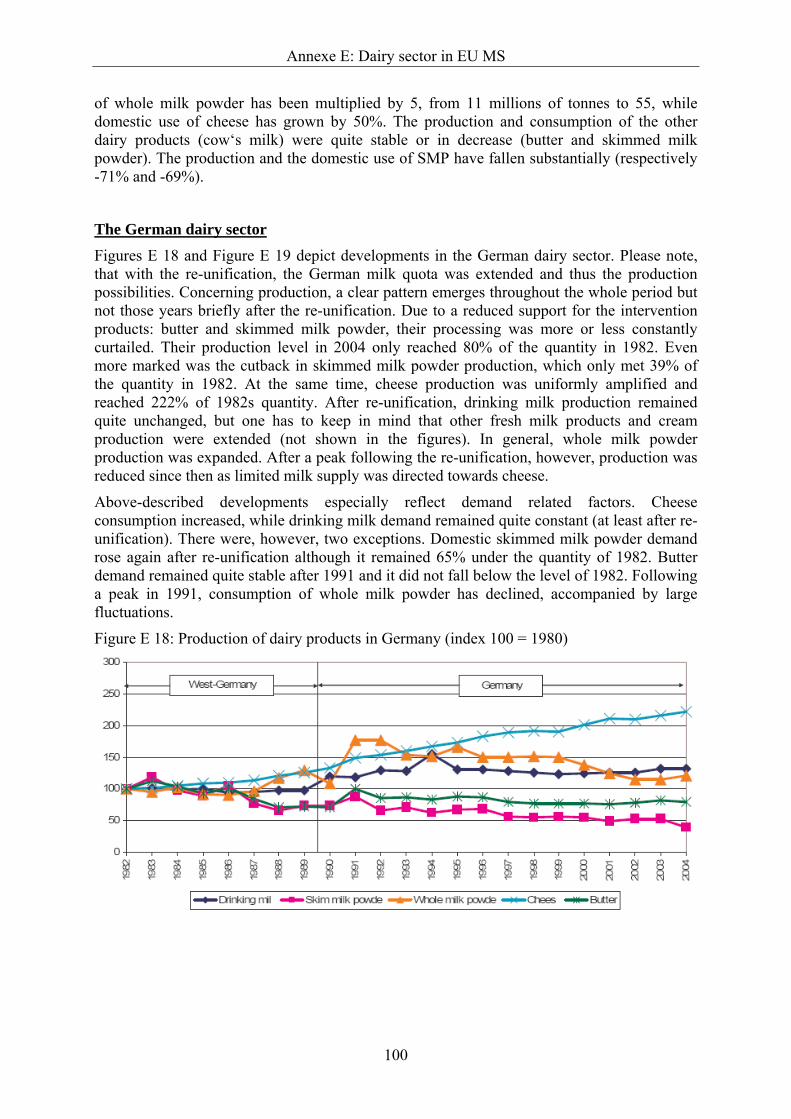
Annexe E: Dairy sector in EU MS
100
of whole milk powder has been multiplied by 5, from 11 millions of tonnes to 55, while domestic use of cheese has grown by 50%. The production and consumption of the other dairy products (cow‘s milk) were quite stable or in decrease (butter and skimmed milk powder). The production and the domestic use of SMP have fallen substantially (respectively -71% and -69%).
The German dairy sector Figures E 18 and Figure E 19 depict developments in the German dairy sector. Please note, that with the re-unification, the German milk quota was extended and thus the production possibilities. Concerning production, a clear pattern emerges throughout the whole period but not those years briefly after the re-unification. Due to a reduced support for the intervention products: butter and skimmed milk powder, their processing was more or less constantly curtailed. Their production level in 2004 only reached 80% of the quantity in 1982. Even more marked was the cutback in skimmed milk powder production, which only met 39% of the quantity in 1982. At the same time, cheese production was uniformly amplified and reached 222% of 1982s quantity. After re-unification, drinking milk production remained quite unchanged, but one has to keep in mind that other fresh milk products and cream production were extended (not shown in the figures). In general, whole milk powder production was expanded. After a peak following the re-unification, however, production was reduced since then as limited milk supply was directed towards cheese.
Above-described developments especially reflect demand related factors. Cheese consumption increased, while drinking milk demand remained quite constant (at least after re-unification). There were, however, two exceptions. Domestic skimmed milk powder demand rose again after re-unification although it remained 65% under the quantity of 1982. Butter demand remained quite stable after 1991 and it did not fall below the level of 1982. Following a peak in 1991, consumption of whole milk powder has declined, accompanied by large fluctuations.
Figure E 18: Production of dairy products in Germany (index 100 = 1980)
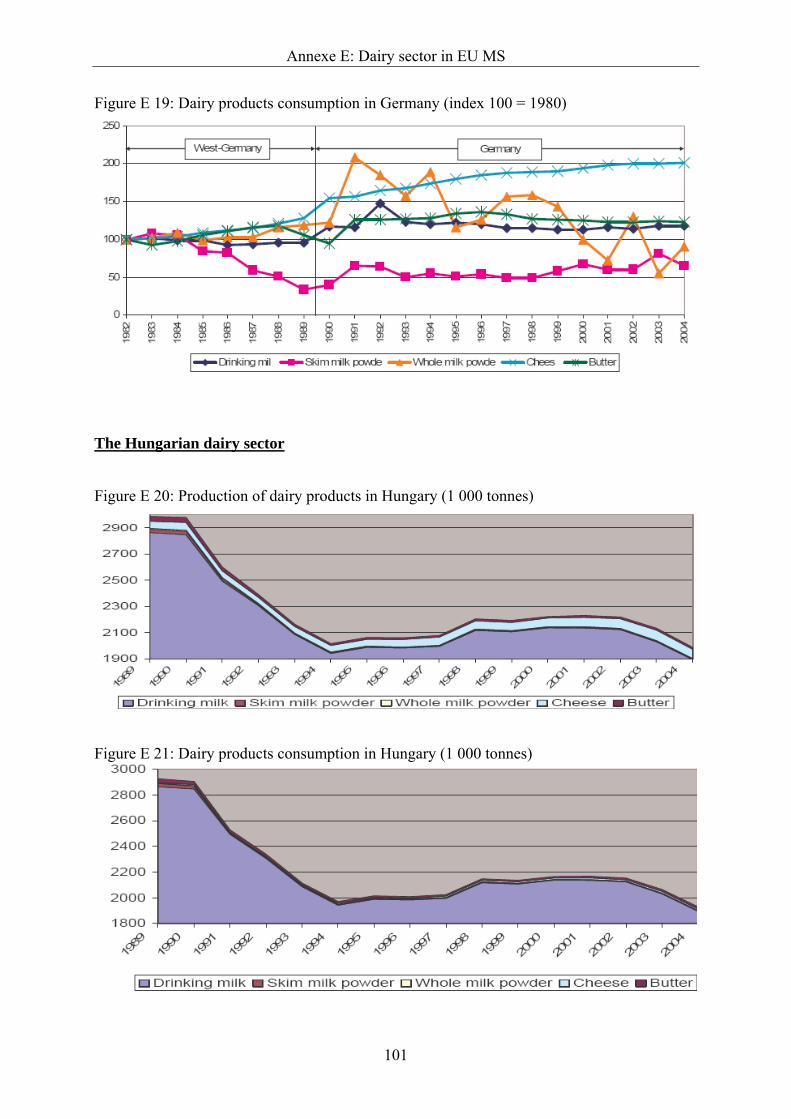
Annexe E: Dairy sector in EU MS
101
Figure E 19: Dairy products consumption in Germany (index 100 = 1980)
The Hungarian dairy sector
Figure E 20: Production of dairy products in Hungary (1 000 tonnes)
Figure E 21: Dairy products consumption in Hungary (1 000 tonnes)
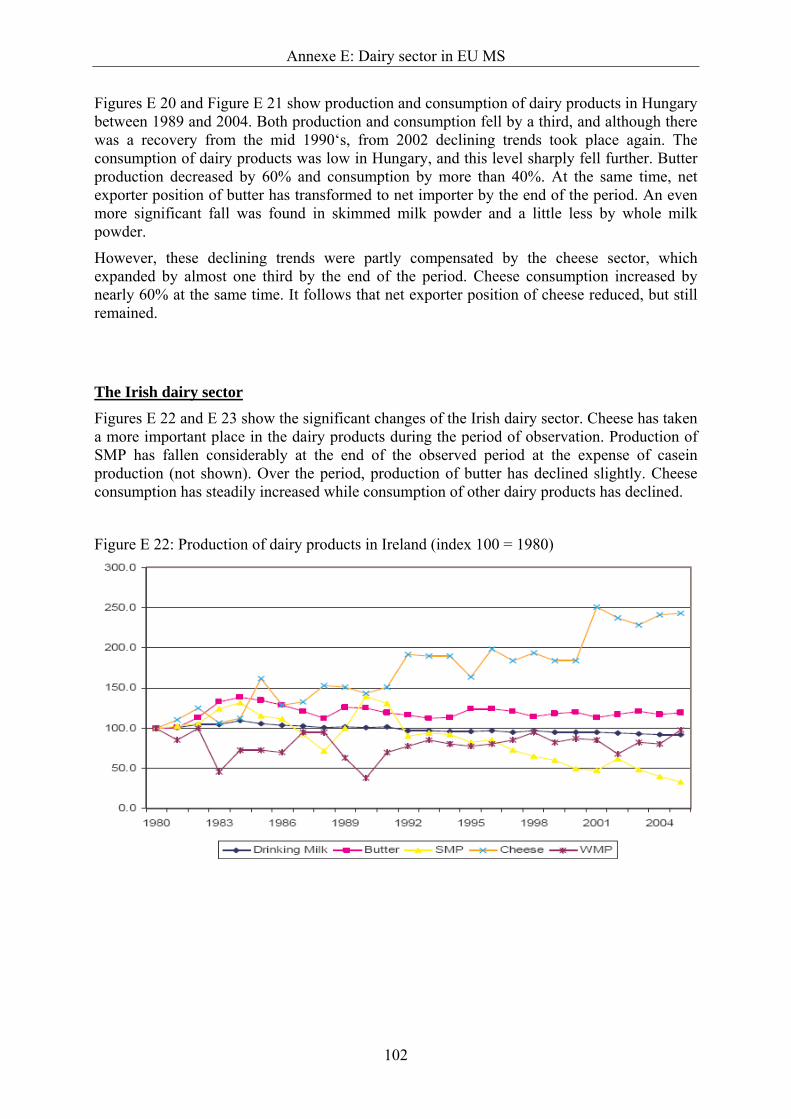
Annexe E: Dairy sector in EU MS
102
Figures E 20 and Figure E 21 show production and consumption of dairy products in Hungary between 1989 and 2004. Both production and consumption fell by a third, and although there was a recovery from the mid 1990‘s, from 2002 declining trends took place again. The consumption of dairy products was low in Hungary, and this level sharply fell further. Butter production decreased by 60% and consumption by more than 40%. At the same time, net exporter position of butter has transformed to net importer by the end of the period. An even more significant fall was found in skimmed milk powder and a little less by whole milk powder.
However, these declining trends were partly compensated by the cheese sector, which expanded by almost one third by the end of the period. Cheese consumption increased by nearly 60% at the same time. It follows that net exporter position of cheese reduced, but still remained.
The Irish dairy sector Figures E 22 and E 23 show the significant changes of the Irish dairy sector. Cheese has taken a more important place in the dairy products during the period of observation. Production of SMP has fallen considerably at the end of the observed period at the expense of casein production (not shown). Over the period, production of butter has declined slightly. Cheese consumption has steadily increased while consumption of other dairy products has declined.
Figure E 22: Production of dairy products in Ireland (index 100 = 1980)
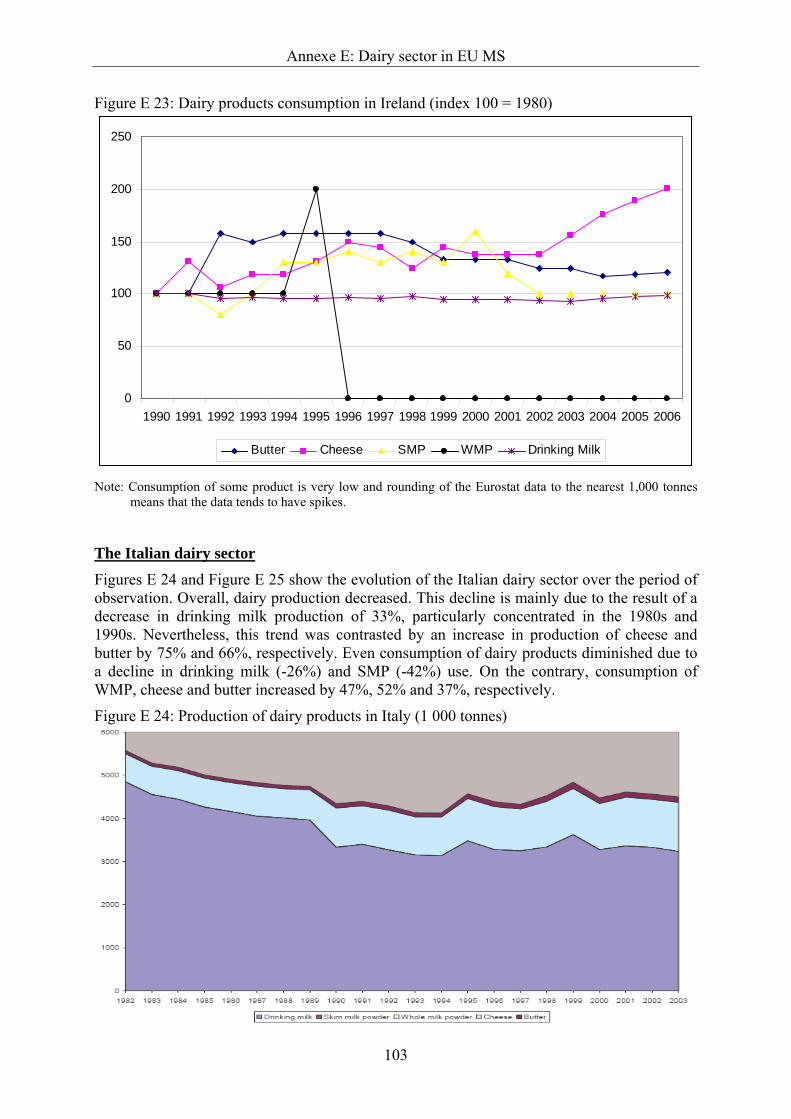
Annexe E: Dairy sector in EU MS
103
Figure E 23: Dairy products consumption in Ireland (index 100 = 1980)
0
50
100
150
200
250
1990 1991 1992 1993 1994 1995 1996 1997 1998 1999 2000 2001 2002 2003 2004 2005 2006
Butter Cheese SMP WMP Drinking Milk
Note: Consumption of some product is very low and rounding of the Eurostat data to the nearest 1,000 tonnes means that the data tends to have spikes.
The Italian dairy sector Figures E 24 and Figure E 25 show the evolution of the Italian dairy sector over the period of observation. Overall, dairy production decreased. This decline is mainly due to the result of a decrease in drinking milk production of 33%, particularly concentrated in the 1980s and 1990s. Nevertheless, this trend was contrasted by an increase in production of cheese and butter by 75% and 66%, respectively. Even consumption of dairy products diminished due to a decline in drinking milk (-26%) and SMP (-42%) use. On the contrary, consumption of WMP, cheese and butter increased by 47%, 52% and 37%, respectively.
Figure E 24: Production of dairy products in Italy (1 000 tonnes)
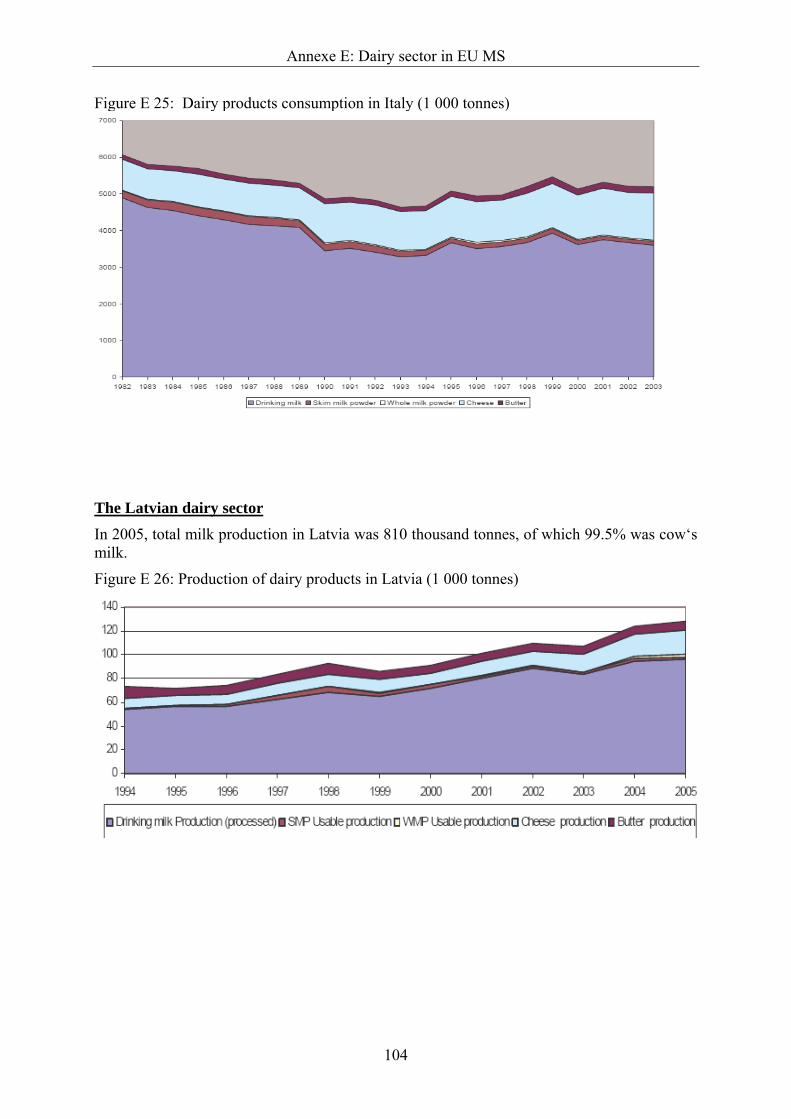
Annexe E: Dairy sector in EU MS
104
Figure E 25: Dairy products consumption in Italy (1 000 tonnes)
The Latvian dairy sector
In 2005, total milk production in Latvia was 810 thousand tonnes, of which 99.5% was cow‘s milk.
Figure E 26: Production of dairy products in Latvia (1 000 tonnes)
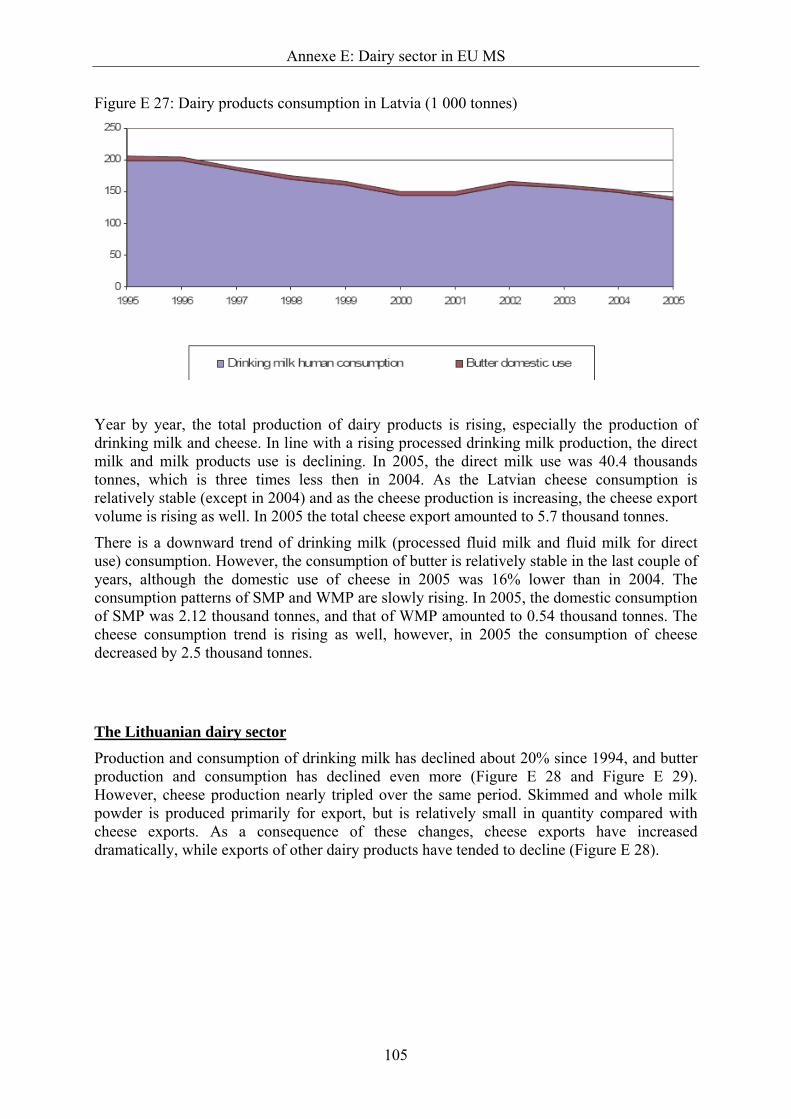
Annexe E: Dairy sector in EU MS
105
Figure E 27: Dairy products consumption in Latvia (1 000 tonnes)
Year by year, the total production of dairy products is rising, especially the production of drinking milk and cheese. In line with a rising processed drinking milk production, the direct milk and milk products use is declining. In 2005, the direct milk use was 40.4 thousands tonnes, which is three times less then in 2004. As the Latvian cheese consumption is relatively stable (except in 2004) and as the cheese production is increasing, the cheese export volume is rising as well. In 2005 the total cheese export amounted to 5.7 thousand tonnes.
There is a downward trend of drinking milk (processed fluid milk and fluid milk for direct use) consumption. However, the consumption of butter is relatively stable in the last couple of years, although the domestic use of cheese in 2005 was 16% lower than in 2004. The consumption patterns of SMP and WMP are slowly rising. In 2005, the domestic consumption of SMP was 2.12 thousand tonnes, and that of WMP amounted to 0.54 thousand tonnes. The cheese consumption trend is rising as well, however, in 2005 the consumption of cheese decreased by 2.5 thousand tonnes.
The Lithuanian dairy sector
Production and consumption of drinking milk has declined about 20% since 1994, and butter production and consumption has declined even more (Figure E 28 and Figure E 29). However, cheese production nearly tripled over the same period. Skimmed and whole milk powder is produced primarily for export, but is relatively small in quantity compared with cheese exports. As a consequence of these changes, cheese exports have increased dramatically, while exports of other dairy products have tended to decline (Figure E 28).
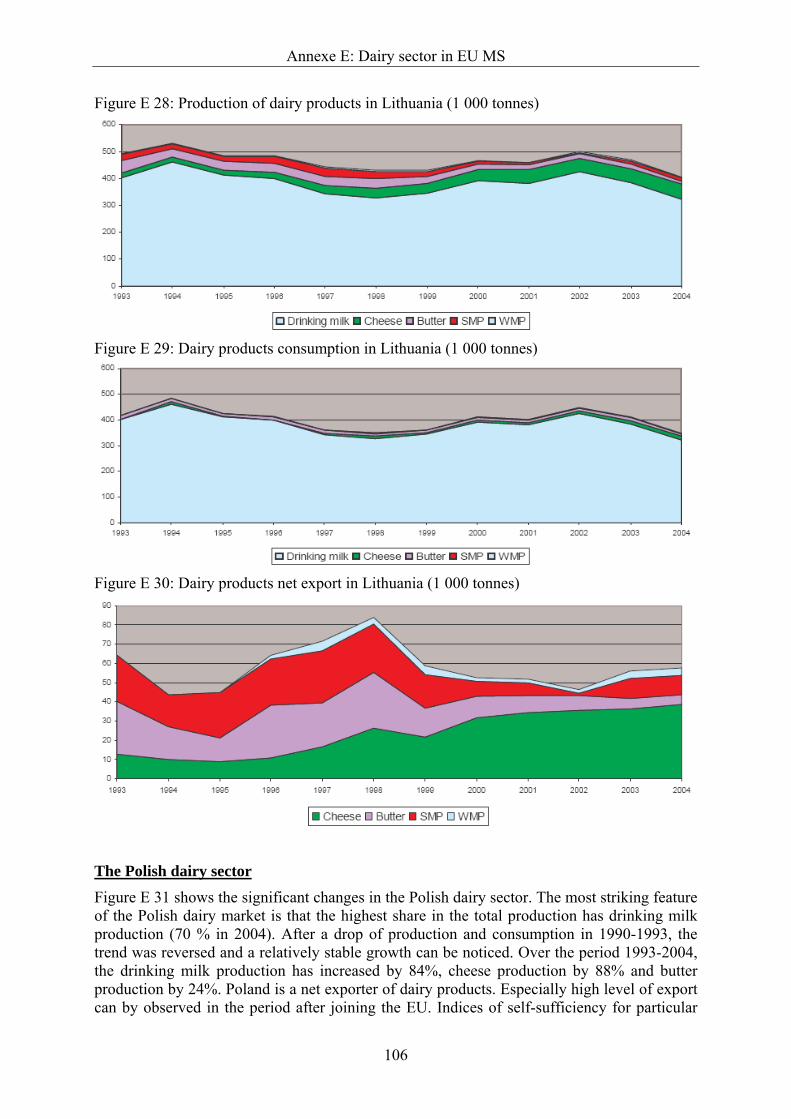
Annexe E: Dairy sector in EU MS
106
Figure E 28: Production of dairy products in Lithuania (1 000 tonnes)
Figure E 29: Dairy products consumption in Lithuania (1 000 tonnes)
Figure E 30: Dairy products net export in Lithuania (1 000 tonnes)
The Polish dairy sector Figure E 31 shows the significant changes in the Polish dairy sector. The most striking feature of the Polish dairy market is that the highest share in the total production has drinking milk production (70 % in 2004). After a drop of production and consumption in 1990-1993, the trend was reversed and a relatively stable growth can be noticed. Over the period 1993-2004, the drinking milk production has increased by 84%, cheese production by 88% and butter production by 24%. Poland is a net exporter of dairy products. Especially high level of export can by observed in the period after joining the EU. Indices of self-sufficiency for particular
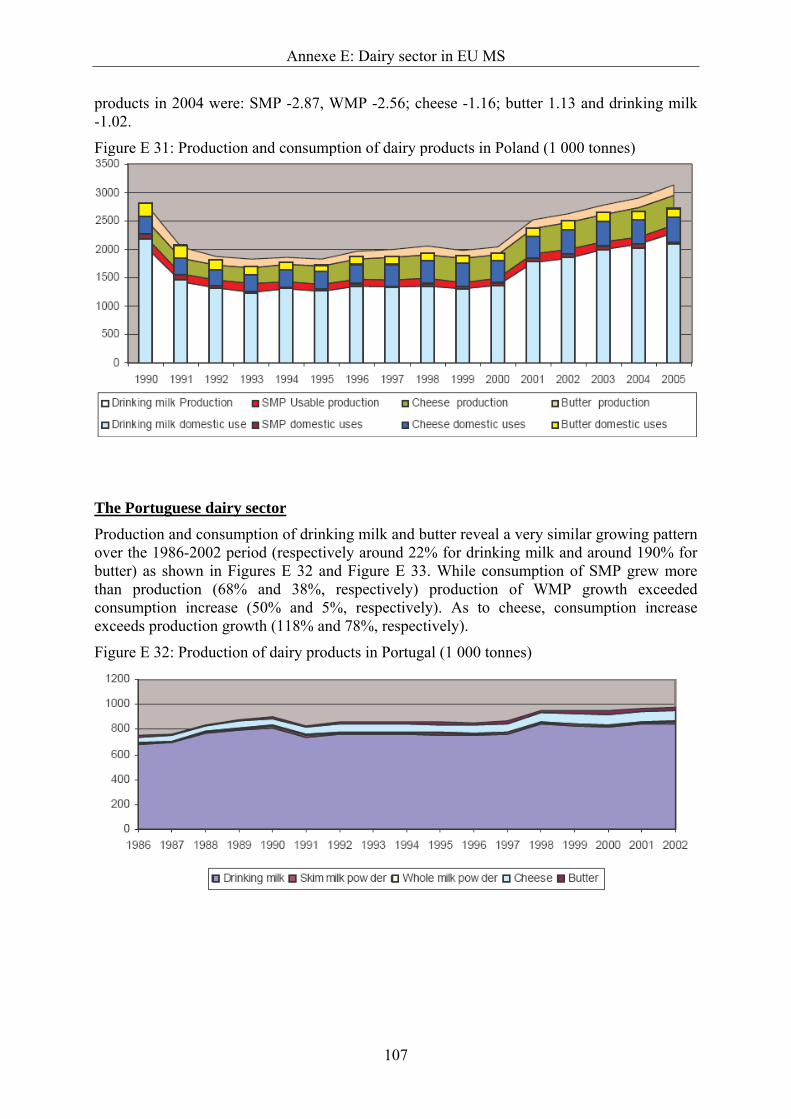
Annexe E: Dairy sector in EU MS
107
products in 2004 were: SMP -2.87, WMP -2.56; cheese -1.16; butter 1.13 and drinking milk -1.02.
Figure E 31: Production and consumption of dairy products in Poland (1 000 tonnes)
The Portuguese dairy sector
Production and consumption of drinking milk and butter reveal a very similar growing pattern over the 1986-2002 period (respectively around 22% for drinking milk and around 190% for butter) as shown in Figures E 32 and Figure E 33. While consumption of SMP grew more than production (68% and 38%, respectively) production of WMP growth exceeded consumption increase (50% and 5%, respectively). As to cheese, consumption increase exceeds production growth (118% and 78%, respectively).
Figure E 32: Production of dairy products in Portugal (1 000 tonnes)
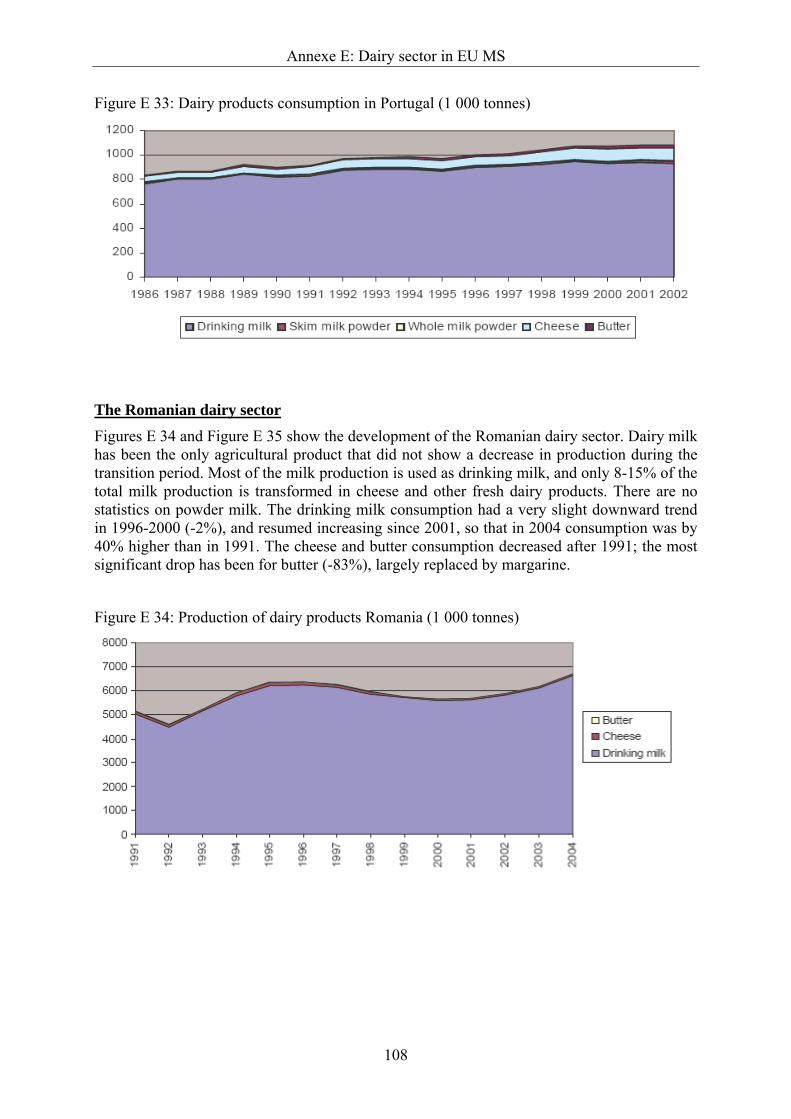
Annexe E: Dairy sector in EU MS
108
Figure E 33: Dairy products consumption in Portugal (1 000 tonnes)
The Romanian dairy sector Figures E 34 and Figure E 35 show the development of the Romanian dairy sector. Dairy milk has been the only agricultural product that did not show a decrease in production during the transition period. Most of the milk production is used as drinking milk, and only 8-15% of the total milk production is transformed in cheese and other fresh dairy products. There are no statistics on powder milk. The drinking milk consumption had a very slight downward trend in 1996-2000 (-2%), and resumed increasing since 2001, so that in 2004 consumption was by 40% higher than in 1991. The cheese and butter consumption decreased after 1991; the most significant drop has been for butter (-83%), largely replaced by margarine.
Figure E 34: Production of dairy products Romania (1 000 tonnes)
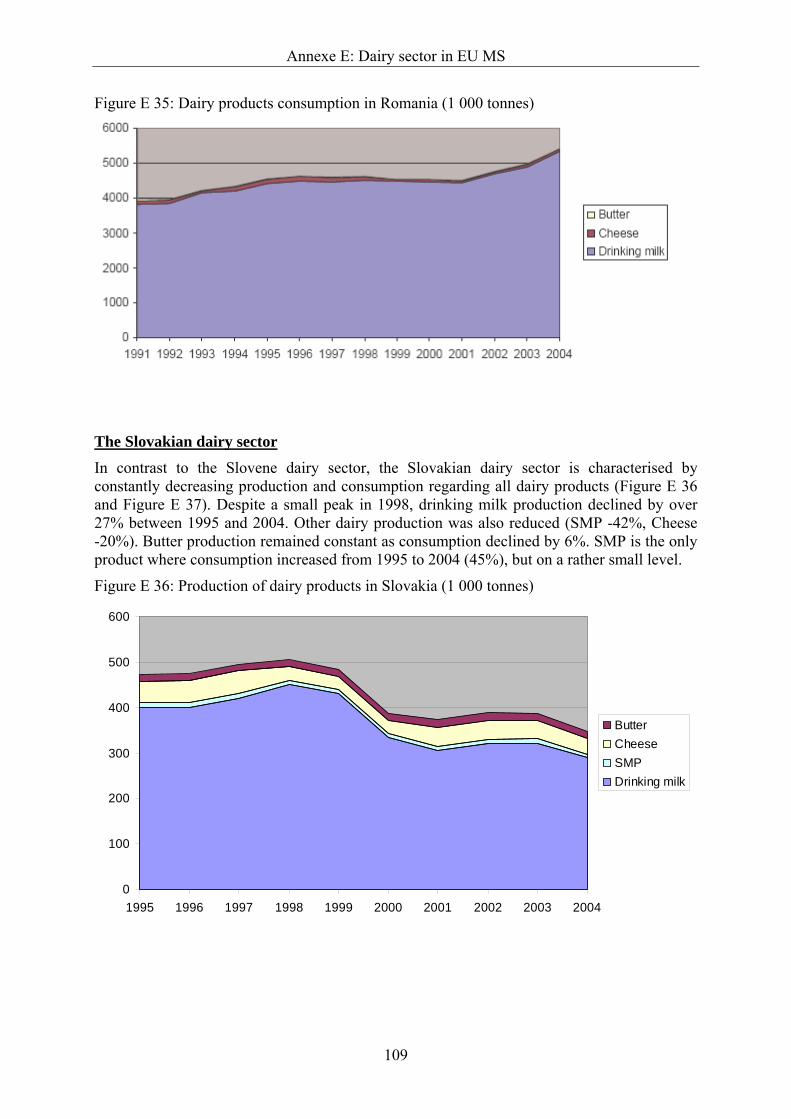
Annexe E: Dairy sector in EU MS
109
Figure E 35: Dairy products consumption in Romania (1 000 tonnes)
The Slovakian dairy sector In contrast to the Slovene dairy sector, the Slovakian dairy sector is characterised by constantly decreasing production and consumption regarding all dairy products (Figure E 36 and Figure E 37). Despite a small peak in 1998, drinking milk production declined by over 27% between 1995 and 2004. Other dairy production was also reduced (SMP -42%, Cheese -20%). Butter production remained constant as consumption declined by 6%. SMP is the only product where consumption increased from 1995 to 2004 (45%), but on a rather small level.
Figure E 36: Production of dairy products in Slovakia (1 000 tonnes)
0
100
200
300
400
500
600
1995 1996 1997 1998 1999 2000 2001 2002 2003 2004
ButterCheeseSMPDrinking milk
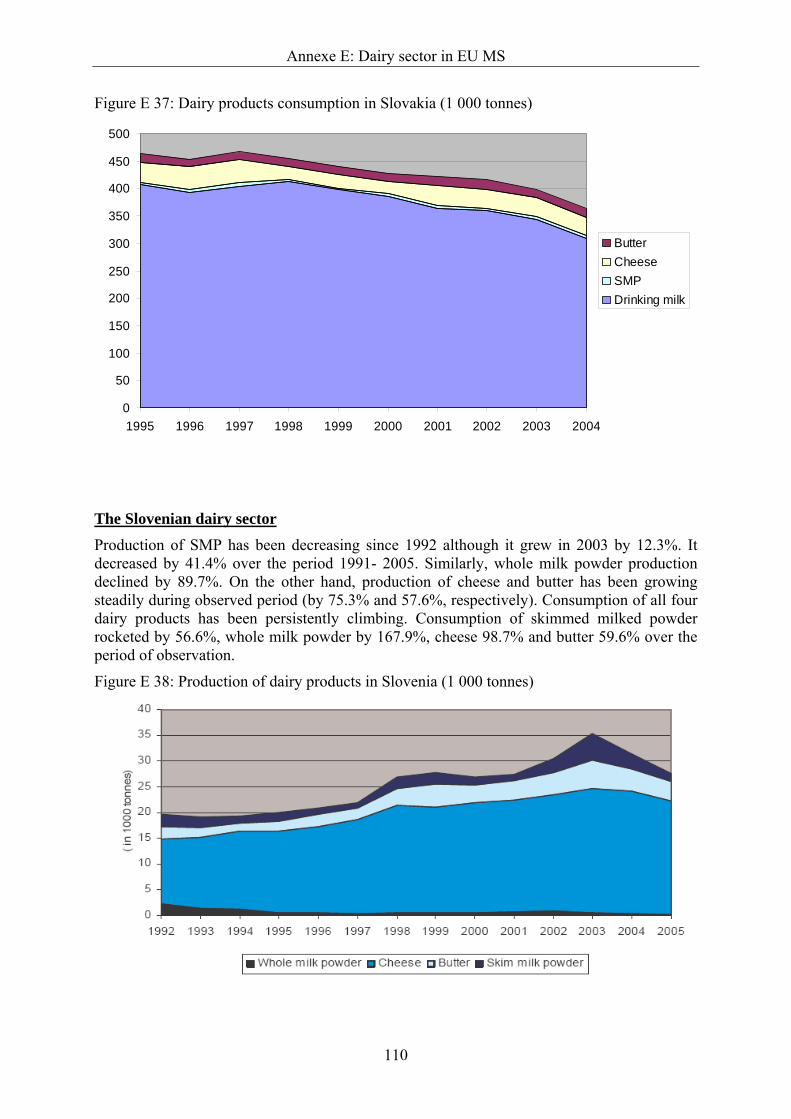
Annexe E: Dairy sector in EU MS
110
Figure E 37: Dairy products consumption in Slovakia (1 000 tonnes)
0
50
100
150
200
250
300
350
400
450
500
1995 1996 1997 1998 1999 2000 2001 2002 2003 2004
ButterCheeseSMPDrinking milk
The Slovenian dairy sector Production of SMP has been decreasing since 1992 although it grew in 2003 by 12.3%. It decreased by 41.4% over the period 1991- 2005. Similarly, whole milk powder production declined by 89.7%. On the other hand, production of cheese and butter has been growing steadily during observed period (by 75.3% and 57.6%, respectively). Consumption of all four dairy products has been persistently climbing. Consumption of skimmed milked powder rocketed by 56.6%, whole milk powder by 167.9%, cheese 98.7% and butter 59.6% over the period of observation.
Figure E 38: Production of dairy products in Slovenia (1 000 tonnes)
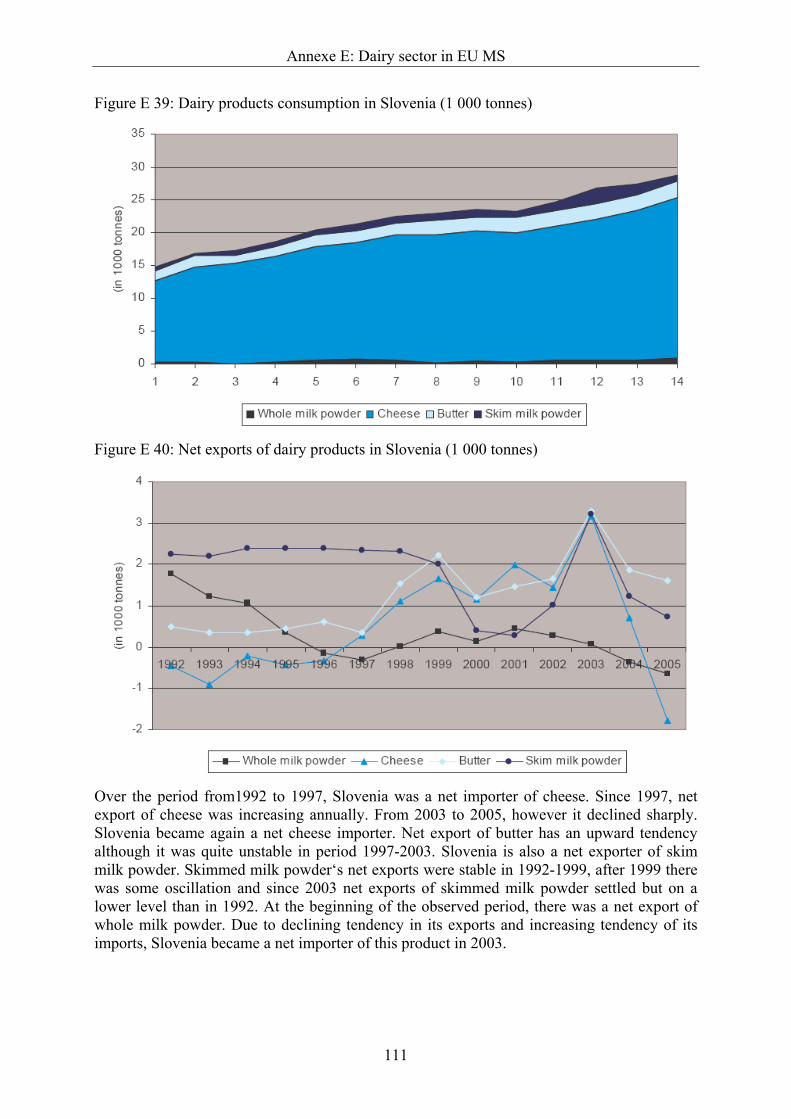
Annexe E: Dairy sector in EU MS
111
Figure E 39: Dairy products consumption in Slovenia (1 000 tonnes)
Figure E 40: Net exports of dairy products in Slovenia (1 000 tonnes)
Over the period from1992 to 1997, Slovenia was a net importer of cheese. Since 1997, net export of cheese was increasing annually. From 2003 to 2005, however it declined sharply. Slovenia became again a net cheese importer. Net export of butter has an upward tendency although it was quite unstable in period 1997-2003. Slovenia is also a net exporter of skim milk powder. Skimmed milk powder‘s net exports were stable in 1992-1999, after 1999 there was some oscillation and since 2003 net exports of skimmed milk powder settled but on a lower level than in 1992. At the beginning of the observed period, there was a net export of whole milk powder. Due to declining tendency in its exports and increasing tendency of its imports, Slovenia became a net importer of this product in 2003.
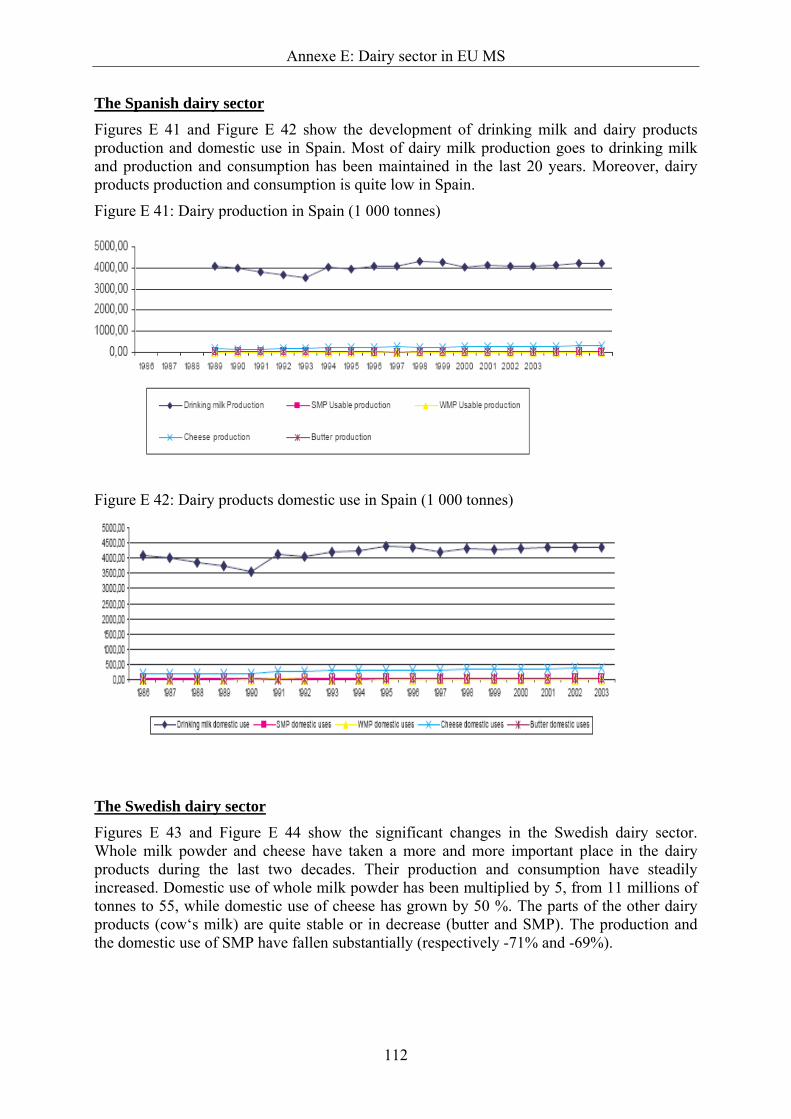
Annexe E: Dairy sector in EU MS
112
The Spanish dairy sector Figures E 41 and Figure E 42 show the development of drinking milk and dairy products production and domestic use in Spain. Most of dairy milk production goes to drinking milk and production and consumption has been maintained in the last 20 years. Moreover, dairy products production and consumption is quite low in Spain.
Figure E 41: Dairy production in Spain (1 000 tonnes)
Figure E 42: Dairy products domestic use in Spain (1 000 tonnes)
The Swedish dairy sector Figures E 43 and Figure E 44 show the significant changes in the Swedish dairy sector. Whole milk powder and cheese have taken a more and more important place in the dairy products during the last two decades. Their production and consumption have steadily increased. Domestic use of whole milk powder has been multiplied by 5, from 11 millions of tonnes to 55, while domestic use of cheese has grown by 50 %. The parts of the other dairy products (cow‘s milk) are quite stable or in decrease (butter and SMP). The production and the domestic use of SMP have fallen substantially (respectively -71% and -69%).
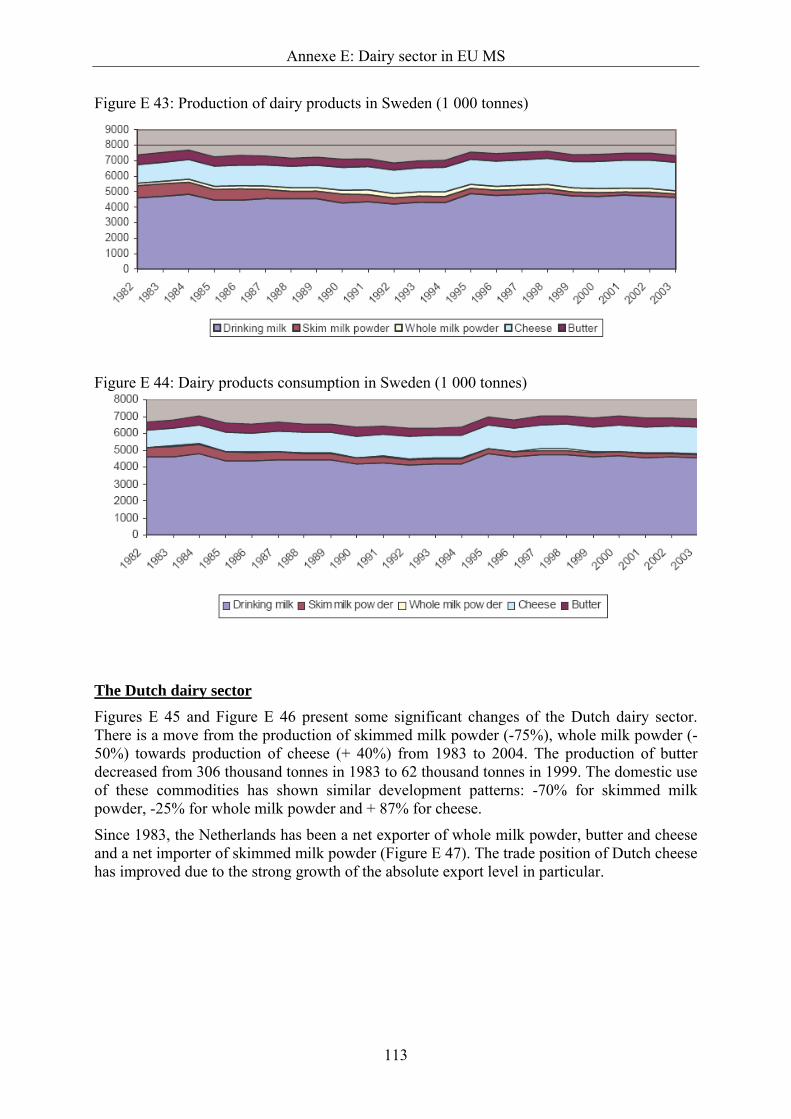
Annexe E: Dairy sector in EU MS
113
Figure E 43: Production of dairy products in Sweden (1 000 tonnes)
Figure E 44: Dairy products consumption in Sweden (1 000 tonnes)
The Dutch dairy sector Figures E 45 and Figure E 46 present some significant changes of the Dutch dairy sector. There is a move from the production of skimmed milk powder (-75%), whole milk powder (-50%) towards production of cheese (+ 40%) from 1983 to 2004. The production of butter decreased from 306 thousand tonnes in 1983 to 62 thousand tonnes in 1999. The domestic use of these commodities has shown similar development patterns: -70% for skimmed milk powder, -25% for whole milk powder and + 87% for cheese.
Since 1983, the Netherlands has been a net exporter of whole milk powder, butter and cheese and a net importer of skimmed milk powder (Figure E 47). The trade position of Dutch cheese has improved due to the strong growth of the absolute export level in particular.
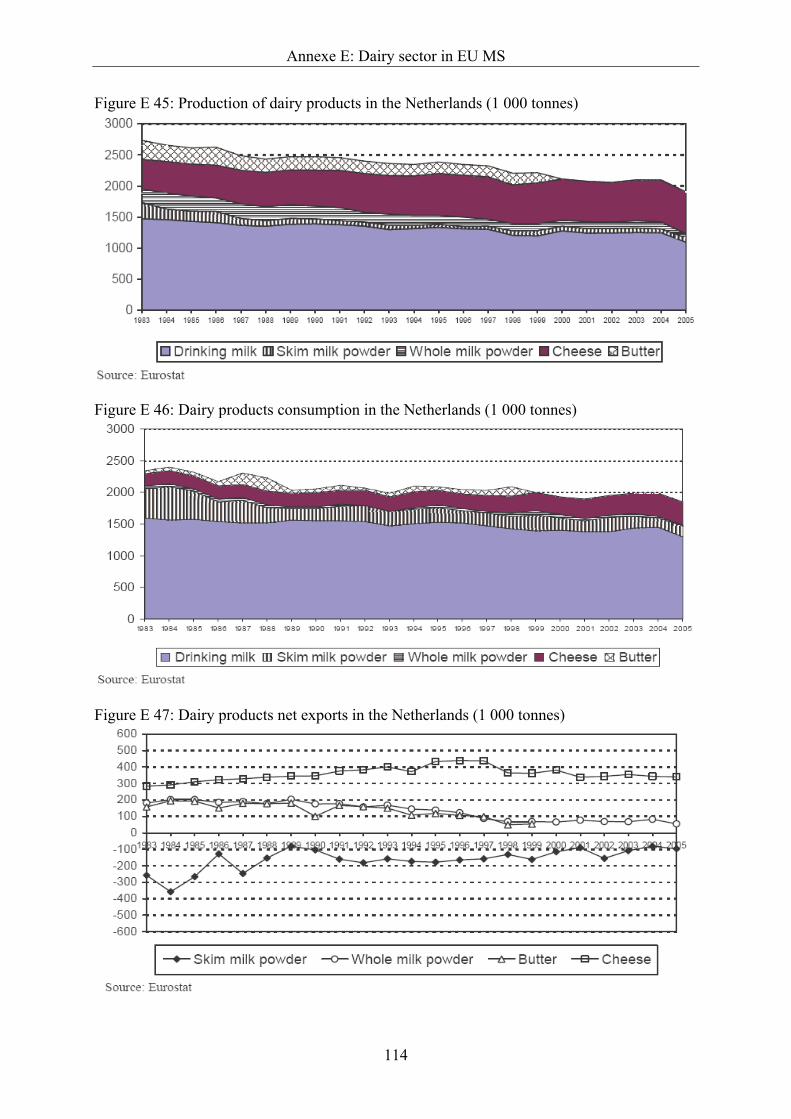
Annexe E: Dairy sector in EU MS
114
Figure E 45: Production of dairy products in the Netherlands (1 000 tonnes)
Figure E 46: Dairy products consumption in the Netherlands (1 000 tonnes)
Figure E 47: Dairy products net exports in the Netherlands (1 000 tonnes)
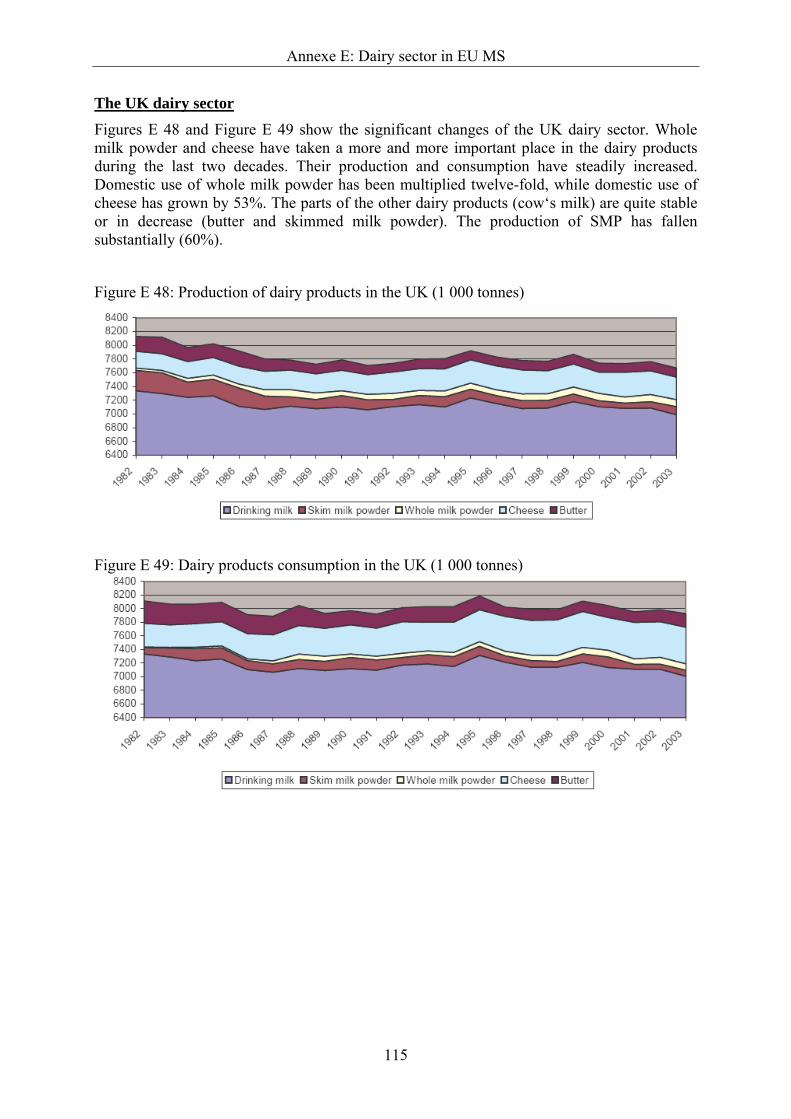
Annexe E: Dairy sector in EU MS
115
The UK dairy sector Figures E 48 and Figure E 49 show the significant changes of the UK dairy sector. Whole milk powder and cheese have taken a more and more important place in the dairy products during the last two decades. Their production and consumption have steadily increased. Domestic use of whole milk powder has been multiplied twelve-fold, while domestic use of cheese has grown by 53%. The parts of the other dairy products (cow‘s milk) are quite stable or in decrease (butter and skimmed milk powder). The production of SMP has fallen substantially (60%).
Figure E 48: Production of dairy products in the UK (1 000 tonnes)
Figure E 49: Dairy products consumption in the UK (1 000 tonnes)
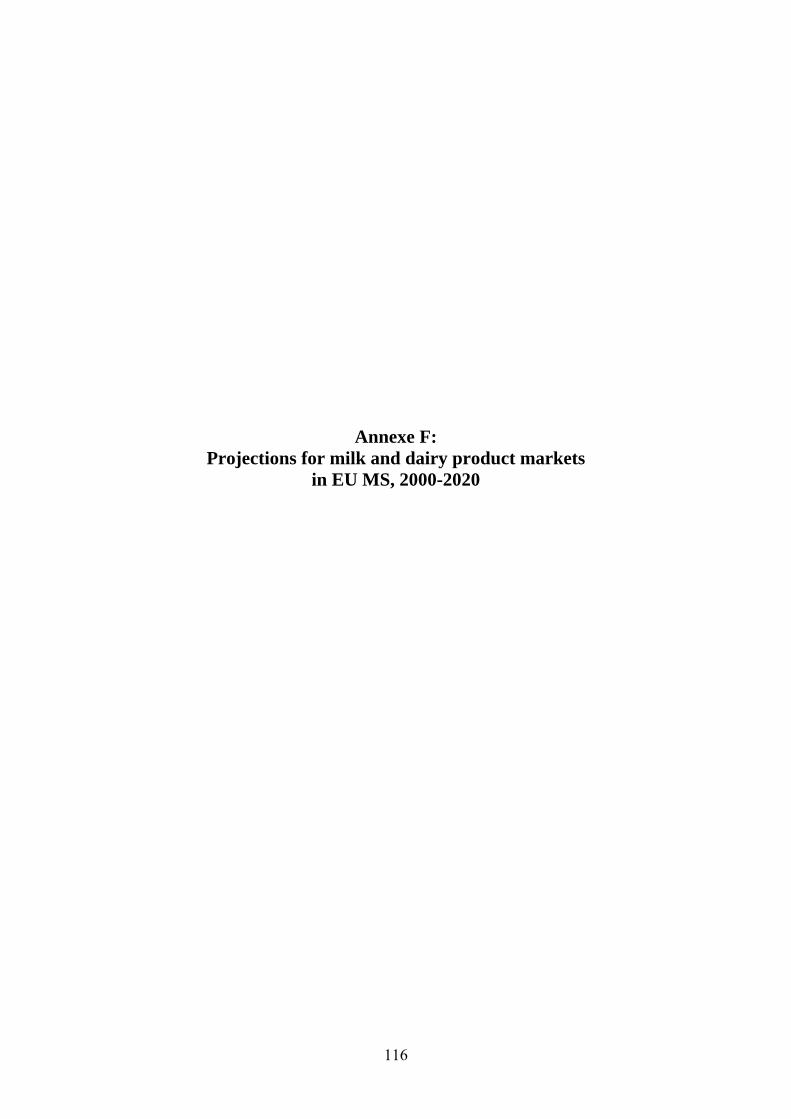
116
Annexe F: Projections for milk and dairy product markets
in EU MS, 2000-2020
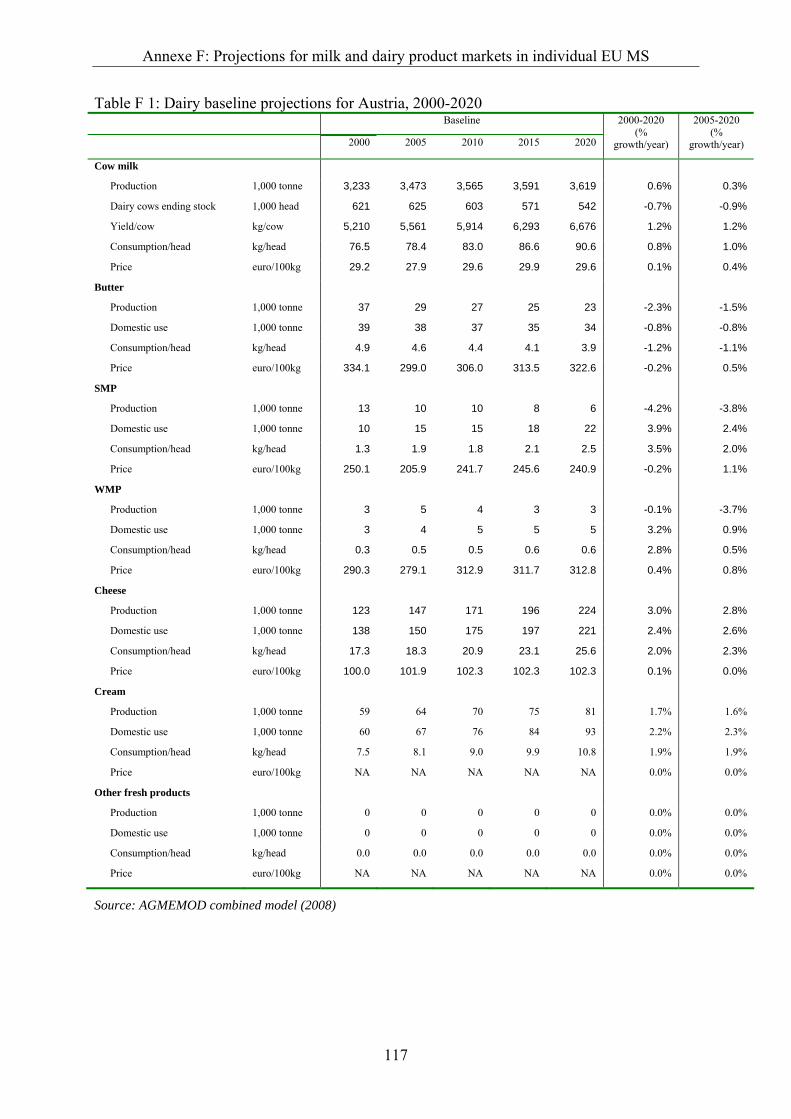
Annexe F: Projections for milk and dairy product markets in individual EU MS
117
Table F 1: Dairy baseline projections for Austria, 2000-2020 Baseline
2000 2005 2010 2015 2020
2000-2020 (%
growth/year)
2005-2020 (%
growth/year)
Cow milk
Production 1,000 tonne 3,233 3,473 3,565 3,591 3,619 0.6% 0.3%
Dairy cows ending stock 1,000 head 621 625 603 571 542 -0.7% -0.9%
Yield/cow kg/cow 5,210 5,561 5,914 6,293 6,676 1.2% 1.2%
Consumption/head kg/head 76.5 78.4 83.0 86.6 90.6 0.8% 1.0%
Price euro/100kg 29.2 27.9 29.6 29.9 29.6 0.1% 0.4%
Butter
Production 1,000 tonne 37 29 27 25 23 -2.3% -1.5%
Domestic use 1,000 tonne 39 38 37 35 34 -0.8% -0.8%
Consumption/head kg/head 4.9 4.6 4.4 4.1 3.9 -1.2% -1.1%
Price euro/100kg 334.1 299.0 306.0 313.5 322.6 -0.2% 0.5%
SMP
Production 1,000 tonne 13 10 10 8 6 -4.2% -3.8%
Domestic use 1,000 tonne 10 15 15 18 22 3.9% 2.4%
Consumption/head kg/head 1.3 1.9 1.8 2.1 2.5 3.5% 2.0%
Price euro/100kg 250.1 205.9 241.7 245.6 240.9 -0.2% 1.1%
WMP
Production 1,000 tonne 3 5 4 3 3 -0.1% -3.7%
Domestic use 1,000 tonne 3 4 5 5 5 3.2% 0.9%
Consumption/head kg/head 0.3 0.5 0.5 0.6 0.6 2.8% 0.5%
Price euro/100kg 290.3 279.1 312.9 311.7 312.8 0.4% 0.8%
Cheese
Production 1,000 tonne 123 147 171 196 224 3.0% 2.8%
Domestic use 1,000 tonne 138 150 175 197 221 2.4% 2.6%
Consumption/head kg/head 17.3 18.3 20.9 23.1 25.6 2.0% 2.3%
Price euro/100kg 100.0 101.9 102.3 102.3 102.3 0.1% 0.0%
Cream
Production 1,000 tonne 59 64 70 75 81 1.7% 1.6%
Domestic use 1,000 tonne 60 67 76 84 93 2.2% 2.3%
Consumption/head kg/head 7.5 8.1 9.0 9.9 10.8 1.9% 1.9%
Price euro/100kg NA NA NA NA NA 0.0% 0.0%
Other fresh products
Production 1,000 tonne 0 0 0 0 0 0.0% 0.0%
Domestic use 1,000 tonne 0 0 0 0 0 0.0% 0.0%
Consumption/head kg/head 0.0 0.0 0.0 0.0 0.0 0.0% 0.0%
Price euro/100kg NA NA NA NA NA 0.0% 0.0%
Source: AGMEMOD combined model (2008)
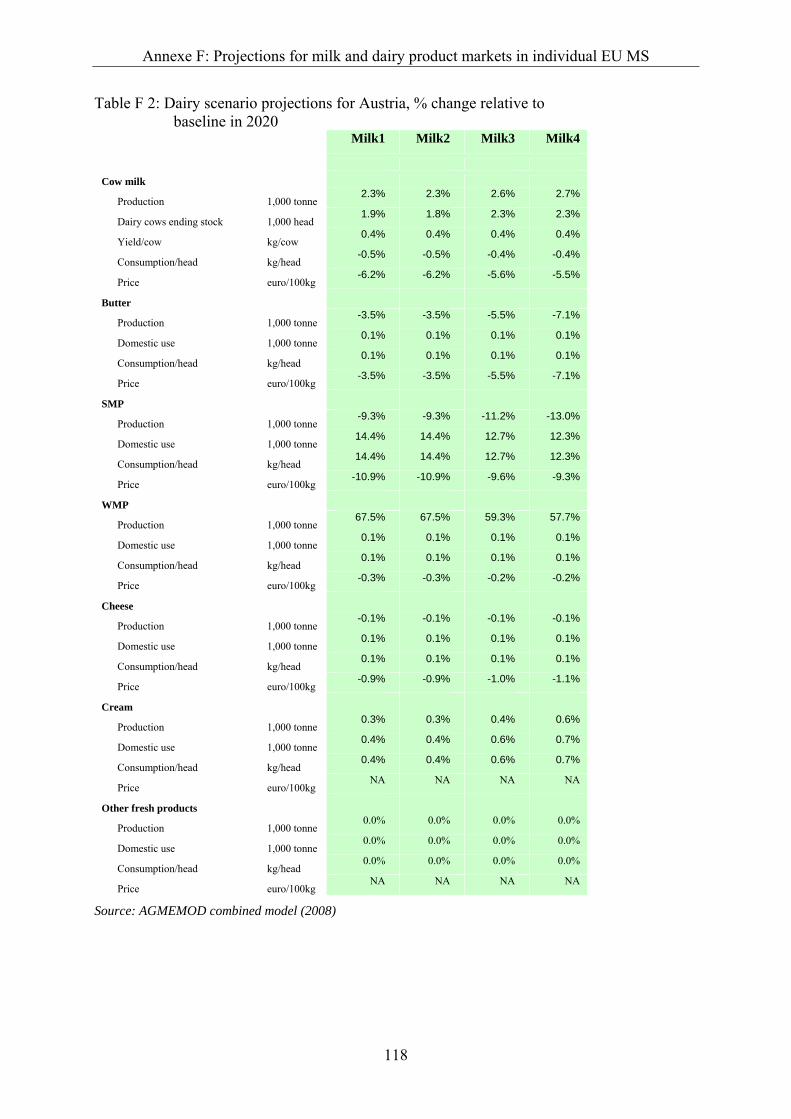
Annexe F: Projections for milk and dairy product markets in individual EU MS
118
Table F 2: Dairy scenario projections for Austria, % change relative to baseline in 2020
Milk1 Milk2 Milk3 Milk4
Cow milk
Production 1,000 tonne 2.3% 2.3% 2.6% 2.7%
Dairy cows ending stock 1,000 head 1.9% 1.8% 2.3% 2.3%
Yield/cow kg/cow 0.4% 0.4% 0.4% 0.4%
Consumption/head kg/head -0.5% -0.5% -0.4% -0.4%
Price euro/100kg -6.2% -6.2% -5.6% -5.5%
Butter
Production 1,000 tonne -3.5% -3.5% -5.5% -7.1%
Domestic use 1,000 tonne 0.1% 0.1% 0.1% 0.1%
Consumption/head kg/head 0.1% 0.1% 0.1% 0.1%
Price euro/100kg -3.5% -3.5% -5.5% -7.1%
SMP
Production 1,000 tonne -9.3% -9.3% -11.2% -13.0%
Domestic use 1,000 tonne 14.4% 14.4% 12.7% 12.3%
Consumption/head kg/head 14.4% 14.4% 12.7% 12.3%
Price euro/100kg -10.9% -10.9% -9.6% -9.3%
WMP
Production 1,000 tonne 67.5% 67.5% 59.3% 57.7%
Domestic use 1,000 tonne 0.1% 0.1% 0.1% 0.1%
Consumption/head kg/head 0.1% 0.1% 0.1% 0.1%
Price euro/100kg -0.3% -0.3% -0.2% -0.2%
Cheese
Production 1,000 tonne -0.1% -0.1% -0.1% -0.1%
Domestic use 1,000 tonne 0.1% 0.1% 0.1% 0.1%
Consumption/head kg/head 0.1% 0.1% 0.1% 0.1%
Price euro/100kg -0.9% -0.9% -1.0% -1.1%
Cream
Production 1,000 tonne 0.3% 0.3% 0.4% 0.6%
Domestic use 1,000 tonne 0.4% 0.4% 0.6% 0.7%
Consumption/head kg/head 0.4% 0.4% 0.6% 0.7%
Price euro/100kg NA NA NA NA
Other fresh products
Production 1,000 tonne 0.0% 0.0% 0.0% 0.0%
Domestic use 1,000 tonne 0.0% 0.0% 0.0% 0.0%
Consumption/head kg/head 0.0% 0.0% 0.0% 0.0%
Price euro/100kg NA NA NA NA
Source: AGMEMOD combined model (2008)
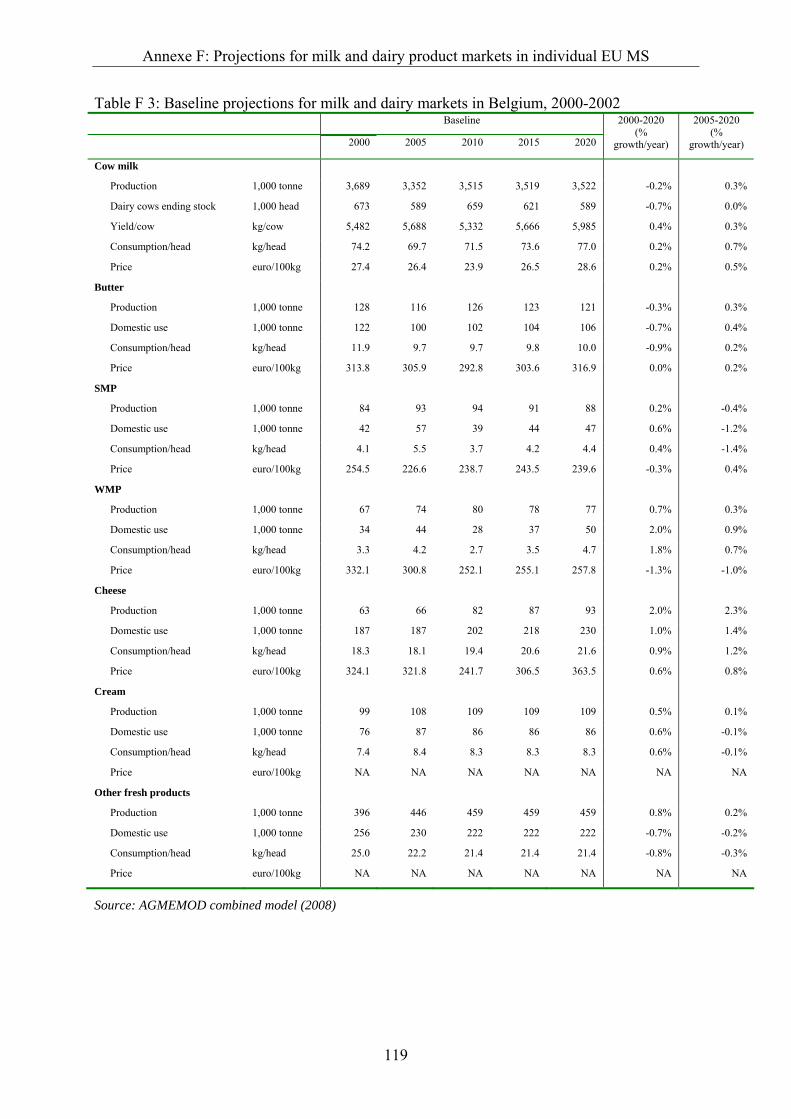
Annexe F: Projections for milk and dairy product markets in individual EU MS
119
Table F 3: Baseline projections for milk and dairy markets in Belgium, 2000-2002 Baseline
2000 2005 2010 2015 2020
2000-2020 (%
growth/year)
2005-2020 (%
growth/year)
Cow milk
Production 1,000 tonne 3,689 3,352 3,515 3,519 3,522 -0.2% 0.3%
Dairy cows ending stock 1,000 head 673 589 659 621 589 -0.7% 0.0%
Yield/cow kg/cow 5,482 5,688 5,332 5,666 5,985 0.4% 0.3%
Consumption/head kg/head 74.2 69.7 71.5 73.6 77.0 0.2% 0.7%
Price euro/100kg 27.4 26.4 23.9 26.5 28.6 0.2% 0.5%
Butter
Production 1,000 tonne 128 116 126 123 121 -0.3% 0.3%
Domestic use 1,000 tonne 122 100 102 104 106 -0.7% 0.4%
Consumption/head kg/head 11.9 9.7 9.7 9.8 10.0 -0.9% 0.2%
Price euro/100kg 313.8 305.9 292.8 303.6 316.9 0.0% 0.2%
SMP
Production 1,000 tonne 84 93 94 91 88 0.2% -0.4%
Domestic use 1,000 tonne 42 57 39 44 47 0.6% -1.2%
Consumption/head kg/head 4.1 5.5 3.7 4.2 4.4 0.4% -1.4%
Price euro/100kg 254.5 226.6 238.7 243.5 239.6 -0.3% 0.4%
WMP
Production 1,000 tonne 67 74 80 78 77 0.7% 0.3%
Domestic use 1,000 tonne 34 44 28 37 50 2.0% 0.9%
Consumption/head kg/head 3.3 4.2 2.7 3.5 4.7 1.8% 0.7%
Price euro/100kg 332.1 300.8 252.1 255.1 257.8 -1.3% -1.0%
Cheese
Production 1,000 tonne 63 66 82 87 93 2.0% 2.3%
Domestic use 1,000 tonne 187 187 202 218 230 1.0% 1.4%
Consumption/head kg/head 18.3 18.1 19.4 20.6 21.6 0.9% 1.2%
Price euro/100kg 324.1 321.8 241.7 306.5 363.5 0.6% 0.8%
Cream
Production 1,000 tonne 99 108 109 109 109 0.5% 0.1%
Domestic use 1,000 tonne 76 87 86 86 86 0.6% -0.1%
Consumption/head kg/head 7.4 8.4 8.3 8.3 8.3 0.6% -0.1%
Price euro/100kg NA NA NA NA NA NA NA
Other fresh products
Production 1,000 tonne 396 446 459 459 459 0.8% 0.2%
Domestic use 1,000 tonne 256 230 222 222 222 -0.7% -0.2%
Consumption/head kg/head 25.0 22.2 21.4 21.4 21.4 -0.8% -0.3%
Price euro/100kg NA NA NA NA NA NA NA
Source: AGMEMOD combined model (2008)

Annexe F: Projections for milk and dairy product markets in individual EU MS
120
Table F 4: Dairy scenario projections for Belgium, % change relative to baseline in 2020
Milk1 Milk2 Milk3 Milk4
Cow milk
Production 1,000 tonne 8.4% 8.4% 8.3% 8.0%
Dairy cows ending stock 1,000 head 11.6% 11.6% 11.5% 11.4%
Yield/cow kg/cow -2.8% -2.8% -2.9% -3.0%
Consumption/head kg/head 0.8% 0.8% 0.8% 0.8%
Price euro/100kg -9.1% -9.1% -9.3% -9.8%
Butter
Production 1,000 tonne 17.0% 17.0% 16.4% 15.4%
Domestic use 1,000 tonne 2.0% 2.0% 2.6% 3.1%
Consumption/head kg/head 2.0% 2.0% 2.6% 3.1%
Price euro/100kg -9.0% -9.0% -12.0% -14.2%
SMP
Production 1,000 tonne 32.7% 32.6% 31.3% 29.3%
Domestic use 1,000 tonne 1.1% 0.9% 0.3% -0.1%
Consumption/head kg/head 1.1% 0.9% 0.3% -0.1%
Price euro/100kg -8.9% -8.9% -7.7% -7.4%
WMP
Production 1,000 tonne 18.6% 18.6% 18.8% 19.1%
Domestic use 1,000 tonne 0.3% 0.3% 0.3% 0.3%
Consumption/head kg/head 0.3% 0.3% 0.3% 0.3%
Price euro/100kg -0.5% -0.5% -0.5% -0.5%
Cheese
Production 1,000 tonne 3.8% 3.8% 4.0% 4.2%
Domestic use 1,000 tonne -1.8% -1.8% -1.8% -1.9%
Consumption/head kg/head -1.8% -1.8% -1.8% -1.9%
Price euro/100kg -14.0% -14.0% -14.0% -14.5%
Cream
Production 1,000 tonne 0.0% 0.0% 0.0% 0.0%
Domestic use 1,000 tonne 0.0% 0.0% 0.0% 0.0%
Consumption/head kg/head 0.0% 0.0% 0.0% 0.0%
Price euro/100kg NA NA NA NA
Other fresh products
Production 1,000 tonne 0.0% 0.0% 0.0% 0.0%
Domestic use 1,000 tonne 0.0% 0.0% 0.0% 0.0%
Consumption/head kg/head 0.0% 0.0% 0.0% 0.0%
Price euro/100kg NA NA NA NA
Source: AGMEMOD combined model (2008)

Annexe F: Projections for milk and dairy product markets in individual EU MS
121
Table F 5: Dairy baseline projections for Denmark, 2000-2020 Baseline
2000 2005 2010 2015 2020
2000-2020 (%
growth/year)
2005-2020 (%
growth/year)
Cow milk
Production 1,000 tonne 4,719 4,584 4,745 4,747 4,751 0.0% 0.2%
Dairy cows ending stock 1,000 head 644 558 569 529 494 -1.3% -0.8%
Yield/cow kg/cow 7,328 8,215 8,337 8,968 9,610 1.4% 1.1%
Consumption/head kg/head 121.0 121.3 125.2 132.6 141.1 0.8% 1.0%
Price euro/100kg 30.9 28.7 30.4 32.1 33.9 0.5% 1.1%
Butter
Production 1,000 tonne 93 104 97 92 89 -0.2% -1.0%
Domestic use 1,000 tonne 72 82 87 88 89 1.1% 0.5%
Consumption/head kg/head 13.5 15.1 15.8 15.8 15.8 0.8% 0.3%
Price euro/100kg 385.8 380.2 384.5 394.0 404.3 0.2% 0.4%
SMP
Production 1,000 tonne 42 17 46 53 59 1.8% 8.7%
Domestic use 1,000 tonne 30 9 26 27 29 -0.2% 8.0%
Consumption/head kg/head 5.6 1.7 4.7 4.9 5.1 -0.5% 7.7%
Price euro/100kg 105.6 105.6 115.2 117.4 115.4 0.4% 0.6%
WMP
Production 1,000 tonne 97 93 93 92 92 -0.2% -0.1%
Domestic use 1,000 tonne 20 18 21 22 22 0.4% 1.3%
Consumption/head kg/head 3.7 3.3 3.9 3.9 3.9 0.2% 1.0%
Price euro/100kg 281.2 281.2 289.4 293.7 289.6 0.1% 0.2%
Cheese
Production 1,000 tonne 288 332 329 339 345 0.9% 0.3%
Domestic use 1,000 tonne 92 163 125 130 152 2.5% -0.5%
Consumption/head kg/head 17.2 30.1 22.8 23.4 27.0 2.3% -0.7%
Price euro/100kg 405.6 405.6 401.4 429.5 458.8 0.6% 0.8%
Cream
Production 1,000 tonne 58 63 60 60 60 0.1% -0.4%
Domestic use 1,000 tonne 50 49 55 58 60 0.9% 1.4%
Consumption/head kg/head 9.4 9.0 10.1 10.4 10.7 0.7% 1.1%
Price euro/100kg 143.6 128.5 126.7 126.7 126.7 -0.6% -0.1%
Other fresh products
Production 1,000 tonne 123 183 183 183 183 2.0% 0.0%
Domestic use 1,000 tonne 119 166 166 166 166 1.7% 0.0%
Consumption/head kg/head 22.3 30.6 30.6 30.6 30.6 1.6% 0.0%
Price euro/100kg 59.2 60.3 60.3 60.3 60.3 0.1% 0.0%
Source: AGMEMOD combined model (2008)
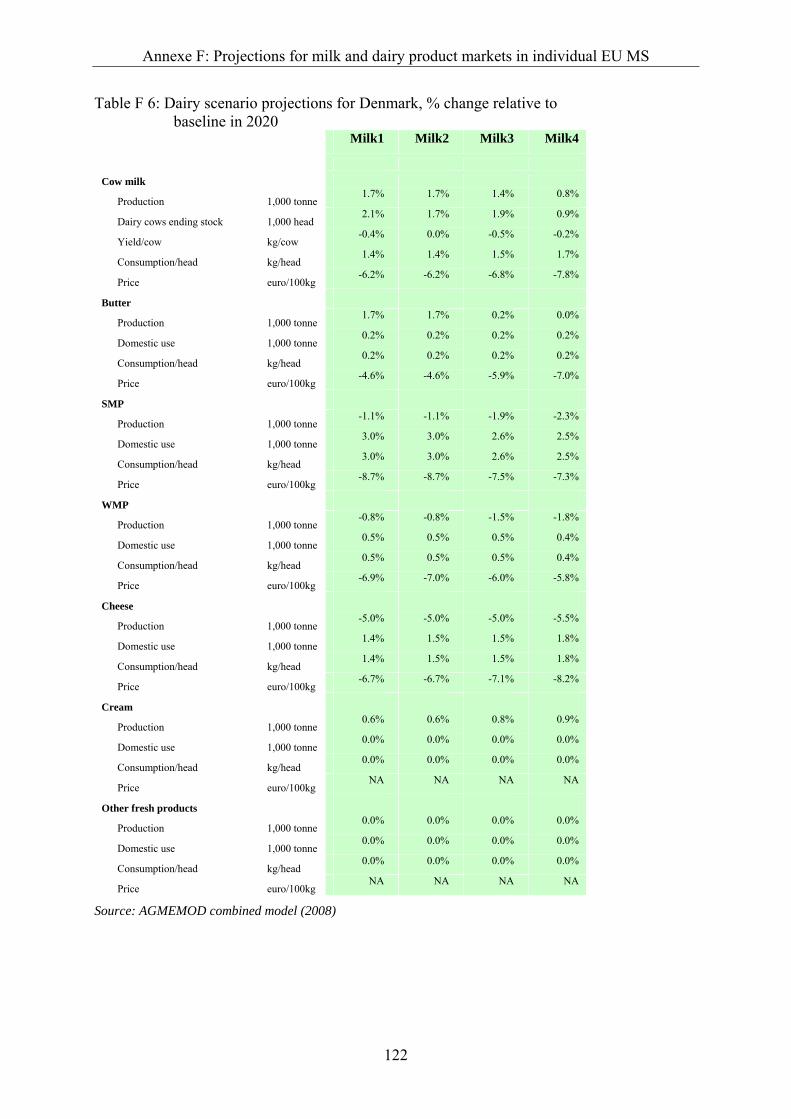
Annexe F: Projections for milk and dairy product markets in individual EU MS
122
Table F 6: Dairy scenario projections for Denmark, % change relative to baseline in 2020
Milk1 Milk2 Milk3 Milk4
Cow milk
Production 1,000 tonne 1.7% 1.7% 1.4% 0.8%
Dairy cows ending stock 1,000 head 2.1% 1.7% 1.9% 0.9%
Yield/cow kg/cow -0.4% 0.0% -0.5% -0.2%
Consumption/head kg/head 1.4% 1.4% 1.5% 1.7%
Price euro/100kg -6.2% -6.2% -6.8% -7.8%
Butter
Production 1,000 tonne 1.7% 1.7% 0.2% 0.0%
Domestic use 1,000 tonne 0.2% 0.2% 0.2% 0.2%
Consumption/head kg/head 0.2% 0.2% 0.2% 0.2%
Price euro/100kg -4.6% -4.6% -5.9% -7.0%
SMP
Production 1,000 tonne -1.1% -1.1% -1.9% -2.3%
Domestic use 1,000 tonne 3.0% 3.0% 2.6% 2.5%
Consumption/head kg/head 3.0% 3.0% 2.6% 2.5%
Price euro/100kg -8.7% -8.7% -7.5% -7.3%
WMP
Production 1,000 tonne -0.8% -0.8% -1.5% -1.8%
Domestic use 1,000 tonne 0.5% 0.5% 0.5% 0.4%
Consumption/head kg/head 0.5% 0.5% 0.5% 0.4%
Price euro/100kg -6.9% -7.0% -6.0% -5.8%
Cheese
Production 1,000 tonne -5.0% -5.0% -5.0% -5.5%
Domestic use 1,000 tonne 1.4% 1.5% 1.5% 1.8%
Consumption/head kg/head 1.4% 1.5% 1.5% 1.8%
Price euro/100kg -6.7% -6.7% -7.1% -8.2%
Cream
Production 1,000 tonne 0.6% 0.6% 0.8% 0.9%
Domestic use 1,000 tonne 0.0% 0.0% 0.0% 0.0%
Consumption/head kg/head 0.0% 0.0% 0.0% 0.0%
Price euro/100kg NA NA NA NA
Other fresh products
Production 1,000 tonne 0.0% 0.0% 0.0% 0.0%
Domestic use 1,000 tonne 0.0% 0.0% 0.0% 0.0%
Consumption/head kg/head 0.0% 0.0% 0.0% 0.0%
Price euro/100kg NA NA NA NA
Source: AGMEMOD combined model (2008)
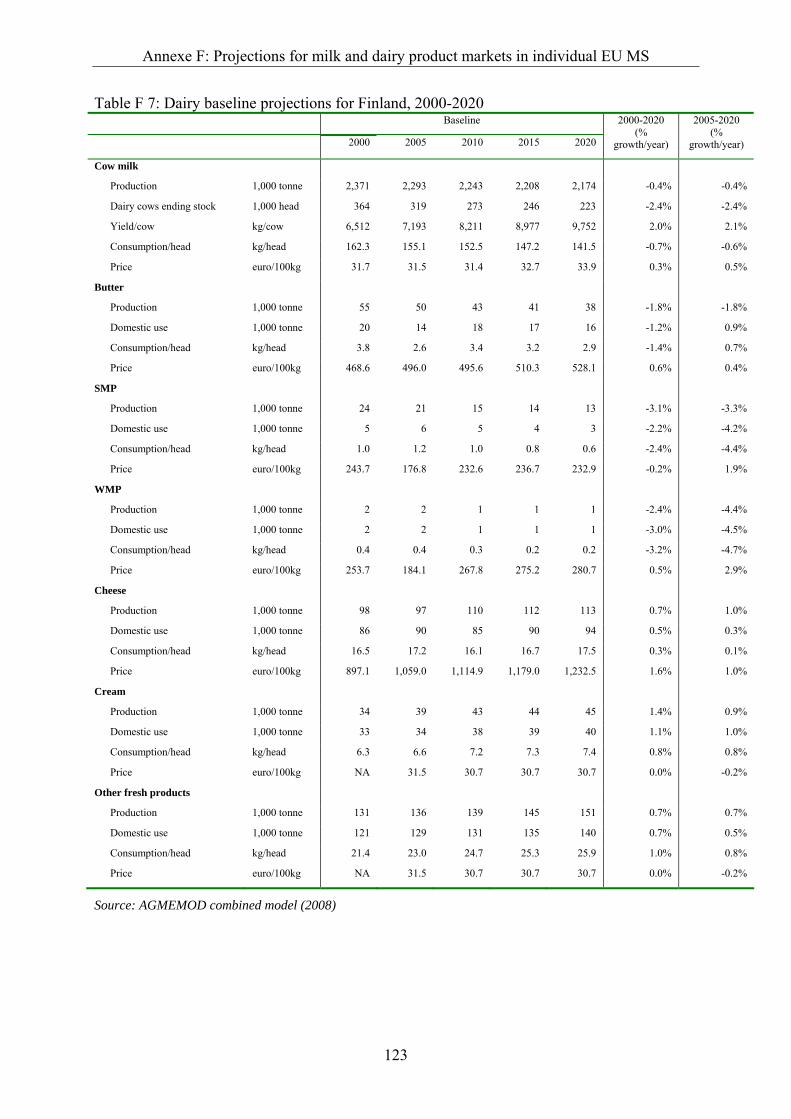
Annexe F: Projections for milk and dairy product markets in individual EU MS
123
Table F 7: Dairy baseline projections for Finland, 2000-2020 Baseline
2000 2005 2010 2015 2020
2000-2020 (%
growth/year)
2005-2020 (%
growth/year)
Cow milk
Production 1,000 tonne 2,371 2,293 2,243 2,208 2,174 -0.4% -0.4%
Dairy cows ending stock 1,000 head 364 319 273 246 223 -2.4% -2.4%
Yield/cow kg/cow 6,512 7,193 8,211 8,977 9,752 2.0% 2.1%
Consumption/head kg/head 162.3 155.1 152.5 147.2 141.5 -0.7% -0.6%
Price euro/100kg 31.7 31.5 31.4 32.7 33.9 0.3% 0.5%
Butter
Production 1,000 tonne 55 50 43 41 38 -1.8% -1.8%
Domestic use 1,000 tonne 20 14 18 17 16 -1.2% 0.9%
Consumption/head kg/head 3.8 2.6 3.4 3.2 2.9 -1.4% 0.7%
Price euro/100kg 468.6 496.0 495.6 510.3 528.1 0.6% 0.4%
SMP
Production 1,000 tonne 24 21 15 14 13 -3.1% -3.3%
Domestic use 1,000 tonne 5 6 5 4 3 -2.2% -4.2%
Consumption/head kg/head 1.0 1.2 1.0 0.8 0.6 -2.4% -4.4%
Price euro/100kg 243.7 176.8 232.6 236.7 232.9 -0.2% 1.9%
WMP
Production 1,000 tonne 2 2 1 1 1 -2.4% -4.4%
Domestic use 1,000 tonne 2 2 1 1 1 -3.0% -4.5%
Consumption/head kg/head 0.4 0.4 0.3 0.2 0.2 -3.2% -4.7%
Price euro/100kg 253.7 184.1 267.8 275.2 280.7 0.5% 2.9%
Cheese
Production 1,000 tonne 98 97 110 112 113 0.7% 1.0%
Domestic use 1,000 tonne 86 90 85 90 94 0.5% 0.3%
Consumption/head kg/head 16.5 17.2 16.1 16.7 17.5 0.3% 0.1%
Price euro/100kg 897.1 1,059.0 1,114.9 1,179.0 1,232.5 1.6% 1.0%
Cream
Production 1,000 tonne 34 39 43 44 45 1.4% 0.9%
Domestic use 1,000 tonne 33 34 38 39 40 1.1% 1.0%
Consumption/head kg/head 6.3 6.6 7.2 7.3 7.4 0.8% 0.8%
Price euro/100kg NA 31.5 30.7 30.7 30.7 0.0% -0.2%
Other fresh products
Production 1,000 tonne 131 136 139 145 151 0.7% 0.7%
Domestic use 1,000 tonne 121 129 131 135 140 0.7% 0.5%
Consumption/head kg/head 21.4 23.0 24.7 25.3 25.9 1.0% 0.8%
Price euro/100kg NA 31.5 30.7 30.7 30.7 0.0% -0.2%
Source: AGMEMOD combined model (2008)

Annexe F: Projections for milk and dairy product markets in individual EU MS
124
Table F 8: Dairy scenario projections for Finland, % change relative to baseline in 2020
Milk1 Milk2 Milk3 Milk4
Cow milk
Production 1,000 tonne 1.5% 1.5% 0.7% 0.0%
Dairy cows ending stock 1,000 head 2.2% 2.2% 1.6% 1.0%
Yield/cow kg/cow -0.7% -0.7% -0.9% -1.0%
Consumption/head kg/head 1.2% 1.2% 1.4% 1.7%
Price euro/100kg -6.6% -6.6% -8.1% -9.6%
Butter
Production 1,000 tonne 3.0% 3.0% 0.5% -1.7%
Domestic use 1,000 tonne 0.8% 0.8% 1.1% 1.3%
Consumption/head kg/head 0.8% 0.8% 1.1% 1.3%
Price euro/100kg -7.3% -7.3% -9.8% -11.6%
SMP
Production 1,000 tonne 4.1% 4.1% -1.3% -5.8%
Domestic use 1,000 tonne 4.6% 4.6% 3.9% 3.8%
Consumption/head kg/head 4.6% 4.6% 3.9% 3.8%
Price euro/100kg -8.2% -8.2% -7.1% -6.9%
WMP
Production 1,000 tonne 2.8% 2.8% -0.9% -4.1%
Domestic use 1,000 tonne 6.5% 6.5% 7.5% 8.5%
Consumption/head kg/head 6.5% 6.5% 7.5% 8.5%
Price euro/100kg -8.8% -8.8% -10.2% -11.5%
Cheese
Production 1,000 tonne 0.9% 0.9% 1.0% 0.9%
Domestic use 1,000 tonne 1.9% 1.9% 2.0% 2.2%
Consumption/head kg/head 1.9% 1.9% 2.0% 2.2%
Price euro/100kg -6.3% -6.3% -6.6% -7.6%
Cream
Production 1,000 tonne 0.0% 0.0% 0.0% 0.0%
Domestic use 1,000 tonne 0.0% 0.0% 0.0% 0.0%
Consumption/head kg/head 0.0% 0.0% 0.0% 0.0%
Price euro/100kg NA NA NA NA
Other fresh products
Production 1,000 tonne 0.6% 0.6% 0.8% 0.9%
Domestic use 1,000 tonne 0.7% 0.7% 0.8% 1.0%
Consumption/head kg/head 0.7% 0.7% 0.8% 1.0%
Price euro/100kg NA NA NA NA
Source: AGMEMOD combined model (2008)
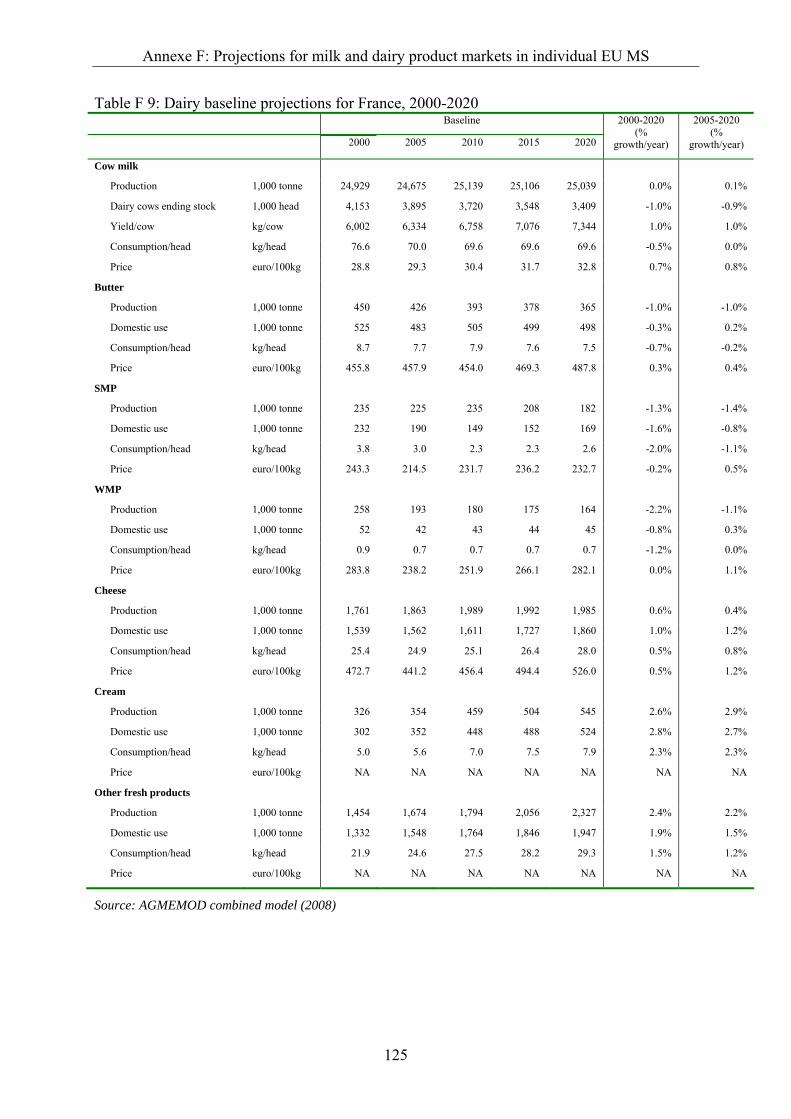
Annexe F: Projections for milk and dairy product markets in individual EU MS
125
Table F 9: Dairy baseline projections for France, 2000-2020 Baseline
2000 2005 2010 2015 2020
2000-2020 (%
growth/year)
2005-2020 (%
growth/year)
Cow milk
Production 1,000 tonne 24,929 24,675 25,139 25,106 25,039 0.0% 0.1%
Dairy cows ending stock 1,000 head 4,153 3,895 3,720 3,548 3,409 -1.0% -0.9%
Yield/cow kg/cow 6,002 6,334 6,758 7,076 7,344 1.0% 1.0%
Consumption/head kg/head 76.6 70.0 69.6 69.6 69.6 -0.5% 0.0%
Price euro/100kg 28.8 29.3 30.4 31.7 32.8 0.7% 0.8%
Butter
Production 1,000 tonne 450 426 393 378 365 -1.0% -1.0%
Domestic use 1,000 tonne 525 483 505 499 498 -0.3% 0.2%
Consumption/head kg/head 8.7 7.7 7.9 7.6 7.5 -0.7% -0.2%
Price euro/100kg 455.8 457.9 454.0 469.3 487.8 0.3% 0.4%
SMP
Production 1,000 tonne 235 225 235 208 182 -1.3% -1.4%
Domestic use 1,000 tonne 232 190 149 152 169 -1.6% -0.8%
Consumption/head kg/head 3.8 3.0 2.3 2.3 2.6 -2.0% -1.1%
Price euro/100kg 243.3 214.5 231.7 236.2 232.7 -0.2% 0.5%
WMP
Production 1,000 tonne 258 193 180 175 164 -2.2% -1.1%
Domestic use 1,000 tonne 52 42 43 44 45 -0.8% 0.3%
Consumption/head kg/head 0.9 0.7 0.7 0.7 0.7 -1.2% 0.0%
Price euro/100kg 283.8 238.2 251.9 266.1 282.1 0.0% 1.1%
Cheese
Production 1,000 tonne 1,761 1,863 1,989 1,992 1,985 0.6% 0.4%
Domestic use 1,000 tonne 1,539 1,562 1,611 1,727 1,860 1.0% 1.2%
Consumption/head kg/head 25.4 24.9 25.1 26.4 28.0 0.5% 0.8%
Price euro/100kg 472.7 441.2 456.4 494.4 526.0 0.5% 1.2%
Cream
Production 1,000 tonne 326 354 459 504 545 2.6% 2.9%
Domestic use 1,000 tonne 302 352 448 488 524 2.8% 2.7%
Consumption/head kg/head 5.0 5.6 7.0 7.5 7.9 2.3% 2.3%
Price euro/100kg NA NA NA NA NA NA NA
Other fresh products
Production 1,000 tonne 1,454 1,674 1,794 2,056 2,327 2.4% 2.2%
Domestic use 1,000 tonne 1,332 1,548 1,764 1,846 1,947 1.9% 1.5%
Consumption/head kg/head 21.9 24.6 27.5 28.2 29.3 1.5% 1.2%
Price euro/100kg NA NA NA NA NA NA NA
Source: AGMEMOD combined model (2008)

Annexe F: Projections for milk and dairy product markets in individual EU MS
126
Table F 10: Dairy scenario projections for France, % change relative to baseline in 2020
Milk1 Milk2 Milk3 Milk4
Cow milk
Production 1,000 tonne 6.1% 6.1% 5.6% 4.9%
Dairy cows ending stock 1,000 head 4.0% 3.9% 3.1% 2.1%
Yield/cow kg/cow 2.0% 2.1% 2.4% 2.8%
Consumption/head kg/head 0.0% 0.0% 0.0% 0.0%
Price euro/100kg -5.9% -5.9% -6.8% -7.8%
Butter
Production 1,000 tonne 4.3% 4.3% 2.6% 1.7%
Domestic use 1,000 tonne 2.7% 2.8% 3.6% 4.3%
Consumption/head kg/head 2.7% 2.8% 3.6% 4.3%
Price euro/100kg -7.9% -7.9% -10.4% -12.3%
SMP
Production 1,000 tonne 25.9% 25.9% 19.4% 18.2%
Domestic use 1,000 tonne 5.7% 5.7% 4.9% 4.8%
Consumption/head kg/head 5.7% 5.7% 4.9% 4.8%
Price euro/100kg -8.5% -8.5% -7.3% -7.1%
WMP
Production 1,000 tonne 6.7% 6.7% 4.2% 1.6%
Domestic use 1,000 tonne 0.0% 0.0% 0.0% 0.0%
Consumption/head kg/head 0.0% 0.0% 0.0% 0.0%
Price euro/100kg -11.7% -11.7% -11.9% -12.0%
Cheese
Production 1,000 tonne 8.1% 8.1% 7.4% 6.1%
Domestic use 1,000 tonne 0.9% 0.9% 0.9% 1.0%
Consumption/head kg/head 0.9% 0.9% 0.9% 1.0%
Price euro/100kg -8.7% -8.7% -9.1% -10.5%
Cream
Production 1,000 tonne 7.3% 7.3% 10.0% 11.6%
Domestic use 1,000 tonne 6.9% 6.9% 9.2% 10.8%
Consumption/head kg/head 6.9% 6.9% 9.2% 10.8%
Price euro/100kg NA NA NA NA
Other fresh products
Production 1,000 tonne 0.6% 0.7% 0.8% 0.9%
Domestic use 1,000 tonne 2.6% 2.6% 3.0% 3.4%
Consumption/head kg/head 2.6% 2.6% 3.0% 3.4%
Price euro/100kg NA NA NA NA
Source: AGMEMOD combined model (2008)

Annexe F: Projections for milk and dairy product markets in individual EU MS
127
Table F 11: Dairy baseline projections for Germany, 2000-2020 Baseline
2000 2005 2010 2015 2020
2000-2020 (%
growth/year)
2005-2020 (%
growth/year)
Cow milk
Production 1,000 tonne 28,331 28,776 29,456 29,273 29,132 0.1% 0.1%
Dairy cows ending stock 1,000 head 4,539 4,429 4,253 3,977 3,735 -1.0% -1.1%
Yield/cow kg/cow 6,242 6,497 6,925 7,361 7,799 1.1% 1.2%
Consumption/head kg/head 60.9 62.2 63.4 65.0 66.8 0.5% 0.5%
Price euro/100kg 30.0 27.7 30.7 31.3 31.8 0.3% 0.9%
Butter
Production 1,000 tonne 426 442 439 426 415 -0.1% -0.4%
Domestic use 1,000 tonne 545 527 529 525 527 -0.2% 0.0%
Consumption/head kg/head 6.6 6.4 6.5 6.5 6.6 0.0% 0.3%
Price euro/100kg 323.9 280.9 295.5 308.4 324.0 0.0% 1.0%
SMP
Production 1,000 tonne 335 256 304 269 241 -1.6% -0.4%
Domestic use 1,000 tonne 165 99 118 104 92 -2.9% -0.5%
Consumption/head kg/head 2.0 1.2 1.4 1.3 1.2 -2.7% -0.2%
Price euro/100kg 242.9 181.9 226.5 217.9 208.2 -0.8% 0.9%
WMP
Production 1,000 tonne 185 153 161 123 90 -3.5% -3.5%
Domestic use 1,000 tonne 143 161 170 191 212 2.0% 1.9%
Consumption/head kg/head 1.7 1.9 2.1 2.4 2.7 2.2% 2.1%
Price euro/100kg 284.3 232.4 275.9 270.7 265.2 -0.3% 0.9%
Cheese
Production 1,000 tonne 1,942 2,216 2,270 2,313 2,352 1.0% 0.4%
Domestic use 1,000 tonne 1,774 1,805 1,893 1,901 1,904 0.4% 0.4%
Consumption/head kg/head 21.6 21.9 23.1 23.5 24.0 0.5% 0.6%
Price euro/100kg 399.4 342.7 358.1 387.0 411.0 0.1% 1.2%
Cream
Production 1,000 tonne 671 655 692 722 752 0.6% 0.9%
Domestic use 1,000 tonne 643 616 646 665 684 0.3% 0.7%
Consumption/head kg/head 7.8 7.5 7.9 8.2 8.6 0.5% 1.0%
Price euro/100kg 222.4 208.7 211.6 217.6 222.0 0.0% 0.4%
Other fresh products
Production 1,000 tonne 2,613 2,729 2,892 3,100 3,325 1.2% 1.3%
Domestic use 1,000 tonne 2,176 2,285 2,538 2,775 3,033 1.7% 1.9%
Consumption/head kg/head 26.5 27.7 31.0 34.4 38.2 1.9% 2.2%
Price euro/100kg 105.7 107.5 133.5 142.9 151.4 1.8% 2.3%
Source: AGMEMOD combined model (2008)

Annexe F: Projections for milk and dairy product markets in individual EU MS
128
Table F 12: Dairy scenario projections for Germany, % change relative to baseline in 2020
Milk1 Milk2 Milk3 Milk4
Cow milk
Production 1,000 tonne 6.3% 6.2% 5.7% 5.2%
Dairy cows ending stock 1,000 head 6.3% 6.3% 5.7% 5.3%
Yield/cow kg/cow 0.0% 0.0% 0.0% 0.0%
Consumption/head kg/head 0.3% 0.3% 0.4% 0.4%
Price euro/100kg -4.5% -4.5% -5.5% -6.2%
Butter
Production 1,000 tonne 9.1% 9.1% 7.9% 7.0%
Domestic use 1,000 tonne 0.7% 0.7% 0.9% 1.1%
Consumption/head kg/head 0.7% 0.7% 0.9% 1.1%
Price euro/100kg -10.5% -10.5% -14.0% -16.6%
SMP
Production 1,000 tonne 19.0% 18.9% 16.4% 14.5%
Domestic use 1,000 tonne 22.0% 21.9% 18.9% 16.9%
Consumption/head kg/head 22.0% 21.9% 18.9% 16.9%
Price euro/100kg 2.1% 2.1% 1.8% 1.6%
WMP
Production 1,000 tonne 14.5% 14.5% 13.8% 13.7%
Domestic use 1,000 tonne -1.6% -1.6% -1.8% -1.9%
Consumption/head kg/head -1.6% -1.6% -1.8% -1.9%
Price euro/100kg -1.4% -1.4% -2.0% -2.5%
Cheese
Production 1,000 tonne 5.4% 5.4% 5.1% 4.7%
Domestic use 1,000 tonne 2.6% 2.6% 2.6% 2.7%
Consumption/head kg/head 2.6% 2.6% 2.6% 2.7%
Price euro/100kg -8.3% -8.4% -8.2% -8.5%
Cream
Production 1,000 tonne 0.0% 0.0% 0.0% 0.0%
Domestic use 1,000 tonne 0.0% 0.0% 0.0% 0.0%
Consumption/head kg/head 0.0% 0.0% 0.0% 0.0%
Price euro/100kg -5.6% -5.6% -5.6% -5.7%
Other fresh products
Production 1,000 tonne 0.1% 0.1% 0.2% 0.2%
Domestic use 1,000 tonne 0.2% 0.2% 0.2% 0.2%
Consumption/head kg/head 0.2% 0.2% 0.2% 0.2%
Price euro/100kg -1.8% -1.8% -2.2% -2.5%
Source: AGMEMOD combined model (2008)

Annexe F: Projections for milk and dairy product markets in individual EU MS
129
Table F 13: Dairy baseline projections for Greece, 2000-2020 Baseline
2000 2005 2010 2015 2020
2000-2020 (%
growth/year)
2005-2020 (%
growth/year)
Cow milk
Production 1,000 tonne 789 766 891 883 876 0.5% 0.9%
Dairy cows ending stock 1,000 head 180 150 153 136 123 -1.9% -1.3%
Yield/cow kg/cow 4,385 5,106 5,843 6,490 7,139 2.5% 2.3%
Consumption/head kg/head 58.0 64.2 74.8 81.0 89.2 2.2% 2.2%
Price euro/100kg 37.5 41.1 38.2 39.2 40.2 0.3% -0.1%
Butter
Production 1,000 tonne 3 3 1 1 1 -5.0% -6.8%
Domestic use 1,000 tonne 7 9 19 23 27 6.8% 7.5%
Consumption/head kg/head 0.7 0.8 1.7 2.0 2.4 6.6% 7.4%
Price euro/100kg 477.2 569.8 488.1 493.5 498.4 0.2% -0.9%
SMP
Production 1,000 tonne 0 0 0 0 0 0.0% 0.0%
Domestic use 1,000 tonne 0 3 3 3 3 9.3% 0.1%
Consumption/head kg/head NA 0.2 0.2 0.2 0.2 9.1% 0.0%
Price euro/100kg NA NA NA NA NA NA NA
WMP
Production 1,000 tonne 0 0 0 0 0 0.0% 0.0%
Domestic use 1,000 tonne 16 16 16 16 16 -0.2% -0.1%
Consumption/head kg/head 1.5 1.4 1.4 1.4 1.4 -0.3% -0.3%
Price euro/100kg NA NA NA NA NA NA NA
Cheese
Production 1,000 tonne 219 226 267 284 298 1.5% 1.9%
Domestic use 1,000 tonne 265 284 285 297 304 0.7% 0.5%
Consumption/head kg/head 24.3 25.6 25.4 26.3 26.9 0.5% 0.3%
Price euro/100kg 691.5 747.6 741.7 771.5 810.0 0.8% 0.5%
Cream
Production 1,000 tonne 10 9 9 9 9 -0.4% 0.0%
Domestic use 1,000 tonne 16 18 18 18 18 0.8% 0.0%
Consumption/head kg/head 1.4 1.6 1.6 1.6 1.6 0.8% 0.0%
Price euro/100kg 254.4 295.6 295.6 295.6 295.6 0.8% 0.0%
Other fresh products
Production 1,000 tonne 93 94 94 94 94 0.0% 0.0%
Domestic use 1,000 tonne 100 100 100 100 100 0.0% 0.0%
Consumption/head kg/head 9.1 9.0 25.5 33.3 42.8 8.0% 11.0%
Price euro/100kg 260.5 316.5 316.5 316.5 316.5 1.0% 0.0%
Source: AGMEMOD combined model (2008)

Annexe F: Projections for milk and dairy product markets in individual EU MS
130
Table F 14: Dairy scenario projections for Greece, % change relative to baseline in 2020
Milk1 Milk2 Milk3 Milk4
Cow milk
Production 1,000 tonne 0.1% 0.1% 0.2% 0.0%
Dairy cows ending stock 1,000 head 0.4% 0.3% 0.4% 0.3%
Yield/cow kg/cow -0.2% -0.2% -0.2% -0.2%
Consumption/head kg/head 0.1% 0.1% 0.1% 0.1%
Price euro/100kg -1.7% -1.8% -1.7% -1.9%
Butter
Production 1,000 tonne 3.7% 4.0% 4.2% 5.2%
Domestic use 1,000 tonne -0.1% -0.1% -0.1% -0.1%
Consumption/head kg/head -0.1% -0.1% -0.1% -0.1%
Price euro/100kg -1.7% -1.7% -1.7% -1.7%
SMP
Production 1,000 tonne 0.0% 0.0% 0.0% 0.0%
Domestic use 1,000 tonne -6.6% -6.8% -5.7% -5.6%
Consumption/head kg/head -6.6% -6.8% -5.7% -5.6%
Price euro/100kg NA NA NA NA
WMP
Production 1,000 tonne 0.0% 0.0% 0.0% 0.0%
Domestic use 1,000 tonne 0.0% 0.0% 0.0% 0.0%
Consumption/head kg/head 0.0% 0.0% 0.0% 0.0%
Price euro/100kg NA NA NA NA
Cheese
Production 1,000 tonne -1.4% -1.5% -1.6% -2.0%
Domestic use 1,000 tonne 0.5% 0.5% 0.5% 0.6%
Consumption/head kg/head 0.5% 0.5% 0.5% 0.6%
Price euro/100kg -6.3% -6.5% -6.7% -7.7%
Cream
Production 1,000 tonne 0.0% 0.0% 0.0% 0.0%
Domestic use 1,000 tonne 0.0% 0.0% 0.0% 0.0%
Consumption/head kg/head 0.0% 0.0% 0.0% 0.0%
Price euro/100kg NA NA NA NA
Other fresh products
Production 1,000 tonne 0.0% 0.0% 0.0% 0.0%
Domestic use 1,000 tonne 0.0% 0.0% 0.0% 0.0%
Consumption/head kg/head 0.1% 0.2% 0.1% 0.2%
Price euro/100kg 0.0% 0.0% 0.0% 0.0%
Source: AGMEMOD combined model (2008)
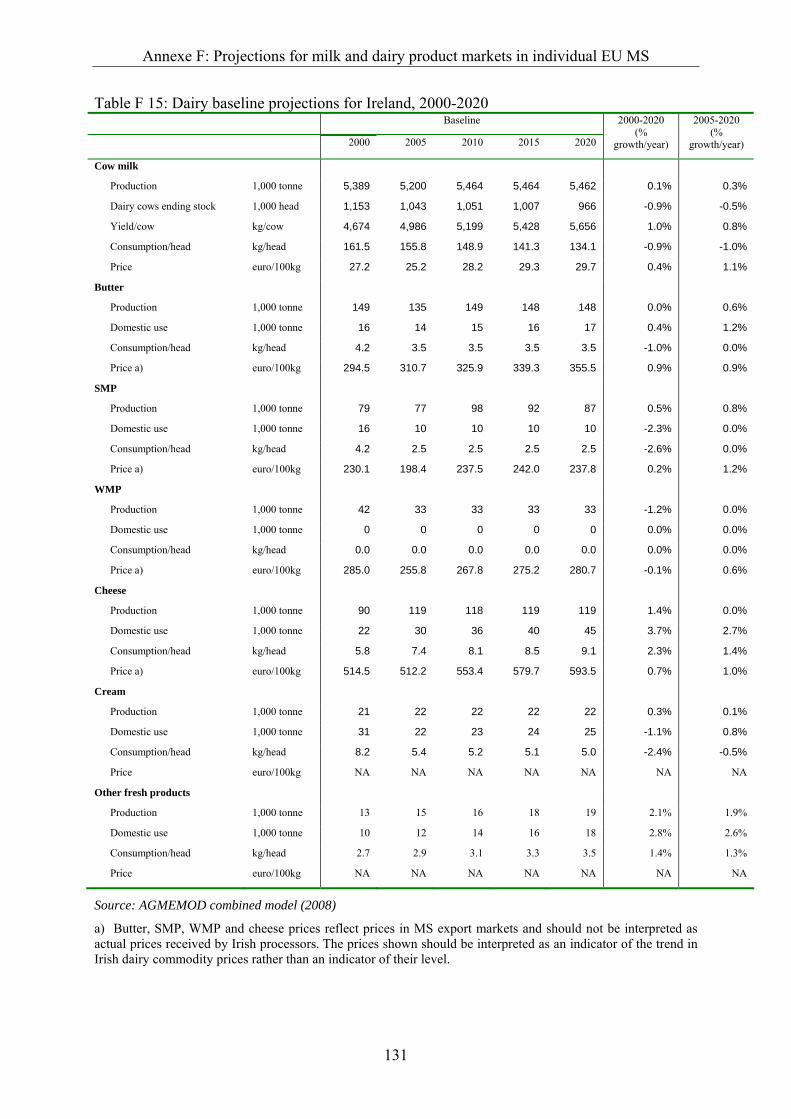
Annexe F: Projections for milk and dairy product markets in individual EU MS
131
Table F 15: Dairy baseline projections for Ireland, 2000-2020 Baseline
2000 2005 2010 2015 2020
2000-2020 (%
growth/year)
2005-2020 (%
growth/year)
Cow milk
Production 1,000 tonne 5,389 5,200 5,464 5,464 5,462 0.1% 0.3%
Dairy cows ending stock 1,000 head 1,153 1,043 1,051 1,007 966 -0.9% -0.5%
Yield/cow kg/cow 4,674 4,986 5,199 5,428 5,656 1.0% 0.8%
Consumption/head kg/head 161.5 155.8 148.9 141.3 134.1 -0.9% -1.0%
Price euro/100kg 27.2 25.2 28.2 29.3 29.7 0.4% 1.1%
Butter
Production 1,000 tonne 149 135 149 148 148 0.0% 0.6%
Domestic use 1,000 tonne 16 14 15 16 17 0.4% 1.2%
Consumption/head kg/head 4.2 3.5 3.5 3.5 3.5 -1.0% 0.0%
Price a) euro/100kg 294.5 310.7 325.9 339.3 355.5 0.9% 0.9%
SMP
Production 1,000 tonne 79 77 98 92 87 0.5% 0.8%
Domestic use 1,000 tonne 16 10 10 10 10 -2.3% 0.0%
Consumption/head kg/head 4.2 2.5 2.5 2.5 2.5 -2.6% 0.0%
Price a) euro/100kg 230.1 198.4 237.5 242.0 237.8 0.2% 1.2%
WMP
Production 1,000 tonne 42 33 33 33 33 -1.2% 0.0%
Domestic use 1,000 tonne 0 0 0 0 0 0.0% 0.0%
Consumption/head kg/head 0.0 0.0 0.0 0.0 0.0 0.0% 0.0%
Price a) euro/100kg 285.0 255.8 267.8 275.2 280.7 -0.1% 0.6%
Cheese
Production 1,000 tonne 90 119 118 119 119 1.4% 0.0%
Domestic use 1,000 tonne 22 30 36 40 45 3.7% 2.7%
Consumption/head kg/head 5.8 7.4 8.1 8.5 9.1 2.3% 1.4%
Price a) euro/100kg 514.5 512.2 553.4 579.7 593.5 0.7% 1.0%
Cream
Production 1,000 tonne 21 22 22 22 22 0.3% 0.1%
Domestic use 1,000 tonne 31 22 23 24 25 -1.1% 0.8%
Consumption/head kg/head 8.2 5.4 5.2 5.1 5.0 -2.4% -0.5%
Price euro/100kg NA NA NA NA NA NA NA
Other fresh products
Production 1,000 tonne 13 15 16 18 19 2.1% 1.9%
Domestic use 1,000 tonne 10 12 14 16 18 2.8% 2.6%
Consumption/head kg/head 2.7 2.9 3.1 3.3 3.5 1.4% 1.3%
Price euro/100kg NA NA NA NA NA NA NA
Source: AGMEMOD combined model (2008)
a) Butter, SMP, WMP and cheese prices reflect prices in MS export markets and should not be interpreted as actual prices received by Irish processors. The prices shown should be interpreted as an indicator of the trend in Irish dairy commodity prices rather than an indicator of their level.
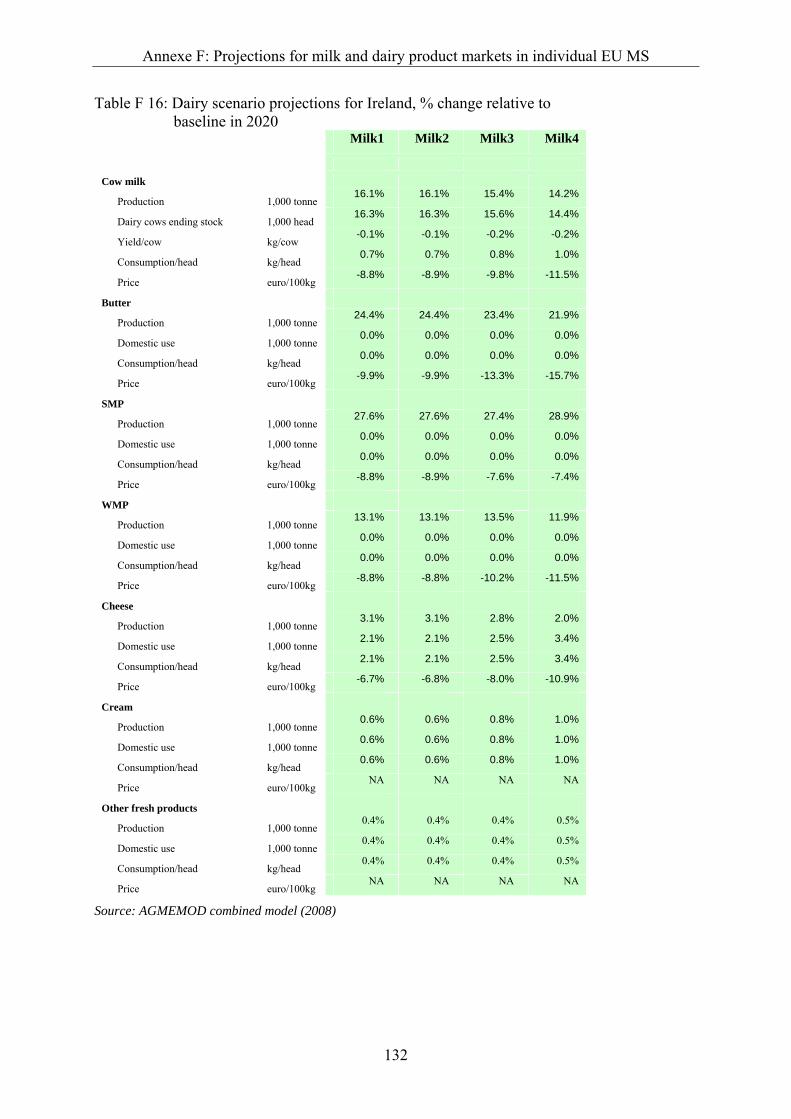
Annexe F: Projections for milk and dairy product markets in individual EU MS
132
Table F 16: Dairy scenario projections for Ireland, % change relative to baseline in 2020
Milk1 Milk2 Milk3 Milk4
Cow milk
Production 1,000 tonne 16.1% 16.1% 15.4% 14.2%
Dairy cows ending stock 1,000 head 16.3% 16.3% 15.6% 14.4%
Yield/cow kg/cow -0.1% -0.1% -0.2% -0.2%
Consumption/head kg/head 0.7% 0.7% 0.8% 1.0%
Price euro/100kg -8.8% -8.9% -9.8% -11.5%
Butter
Production 1,000 tonne 24.4% 24.4% 23.4% 21.9%
Domestic use 1,000 tonne 0.0% 0.0% 0.0% 0.0%
Consumption/head kg/head 0.0% 0.0% 0.0% 0.0%
Price euro/100kg -9.9% -9.9% -13.3% -15.7%
SMP
Production 1,000 tonne 27.6% 27.6% 27.4% 28.9%
Domestic use 1,000 tonne 0.0% 0.0% 0.0% 0.0%
Consumption/head kg/head 0.0% 0.0% 0.0% 0.0%
Price euro/100kg -8.8% -8.9% -7.6% -7.4%
WMP
Production 1,000 tonne 13.1% 13.1% 13.5% 11.9%
Domestic use 1,000 tonne 0.0% 0.0% 0.0% 0.0%
Consumption/head kg/head 0.0% 0.0% 0.0% 0.0%
Price euro/100kg -8.8% -8.8% -10.2% -11.5%
Cheese
Production 1,000 tonne 3.1% 3.1% 2.8% 2.0%
Domestic use 1,000 tonne 2.1% 2.1% 2.5% 3.4%
Consumption/head kg/head 2.1% 2.1% 2.5% 3.4%
Price euro/100kg -6.7% -6.8% -8.0% -10.9%
Cream
Production 1,000 tonne 0.6% 0.6% 0.8% 1.0%
Domestic use 1,000 tonne 0.6% 0.6% 0.8% 1.0%
Consumption/head kg/head 0.6% 0.6% 0.8% 1.0%
Price euro/100kg NA NA NA NA
Other fresh products
Production 1,000 tonne 0.4% 0.4% 0.4% 0.5%
Domestic use 1,000 tonne 0.4% 0.4% 0.4% 0.5%
Consumption/head kg/head 0.4% 0.4% 0.4% 0.5%
Price euro/100kg NA NA NA NA
Source: AGMEMOD combined model (2008)
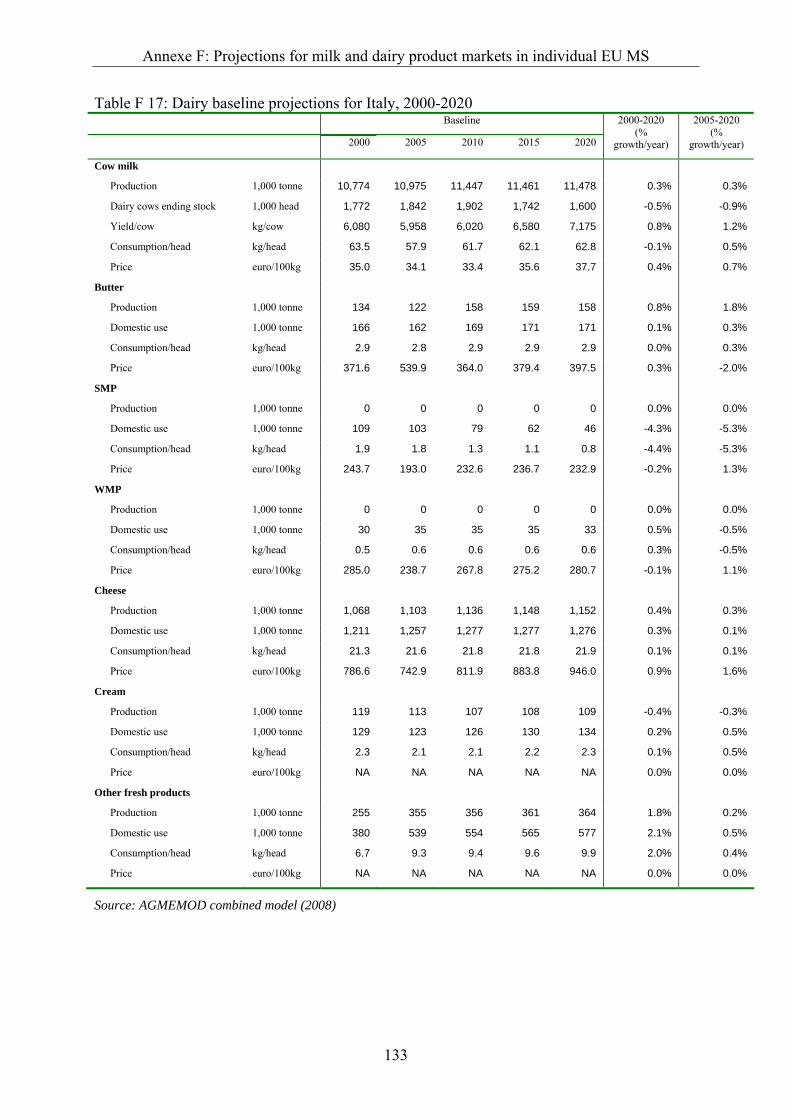
Annexe F: Projections for milk and dairy product markets in individual EU MS
133
Table F 17: Dairy baseline projections for Italy, 2000-2020 Baseline
2000 2005 2010 2015 2020
2000-2020 (%
growth/year)
2005-2020 (%
growth/year)
Cow milk
Production 1,000 tonne 10,774 10,975 11,447 11,461 11,478 0.3% 0.3%
Dairy cows ending stock 1,000 head 1,772 1,842 1,902 1,742 1,600 -0.5% -0.9%
Yield/cow kg/cow 6,080 5,958 6,020 6,580 7,175 0.8% 1.2%
Consumption/head kg/head 63.5 57.9 61.7 62.1 62.8 -0.1% 0.5%
Price euro/100kg 35.0 34.1 33.4 35.6 37.7 0.4% 0.7%
Butter
Production 1,000 tonne 134 122 158 159 158 0.8% 1.8%
Domestic use 1,000 tonne 166 162 169 171 171 0.1% 0.3%
Consumption/head kg/head 2.9 2.8 2.9 2.9 2.9 0.0% 0.3%
Price euro/100kg 371.6 539.9 364.0 379.4 397.5 0.3% -2.0%
SMP
Production 1,000 tonne 0 0 0 0 0 0.0% 0.0%
Domestic use 1,000 tonne 109 103 79 62 46 -4.3% -5.3%
Consumption/head kg/head 1.9 1.8 1.3 1.1 0.8 -4.4% -5.3%
Price euro/100kg 243.7 193.0 232.6 236.7 232.9 -0.2% 1.3%
WMP
Production 1,000 tonne 0 0 0 0 0 0.0% 0.0%
Domestic use 1,000 tonne 30 35 35 35 33 0.5% -0.5%
Consumption/head kg/head 0.5 0.6 0.6 0.6 0.6 0.3% -0.5%
Price euro/100kg 285.0 238.7 267.8 275.2 280.7 -0.1% 1.1%
Cheese
Production 1,000 tonne 1,068 1,103 1,136 1,148 1,152 0.4% 0.3%
Domestic use 1,000 tonne 1,211 1,257 1,277 1,277 1,276 0.3% 0.1%
Consumption/head kg/head 21.3 21.6 21.8 21.8 21.9 0.1% 0.1%
Price euro/100kg 786.6 742.9 811.9 883.8 946.0 0.9% 1.6%
Cream
Production 1,000 tonne 119 113 107 108 109 -0.4% -0.3%
Domestic use 1,000 tonne 129 123 126 130 134 0.2% 0.5%
Consumption/head kg/head 2.3 2.1 2.1 2.2 2.3 0.1% 0.5%
Price euro/100kg NA NA NA NA NA 0.0% 0.0%
Other fresh products
Production 1,000 tonne 255 355 356 361 364 1.8% 0.2%
Domestic use 1,000 tonne 380 539 554 565 577 2.1% 0.5%
Consumption/head kg/head 6.7 9.3 9.4 9.6 9.9 2.0% 0.4%
Price euro/100kg NA NA NA NA NA 0.0% 0.0%
Source: AGMEMOD combined model (2008)
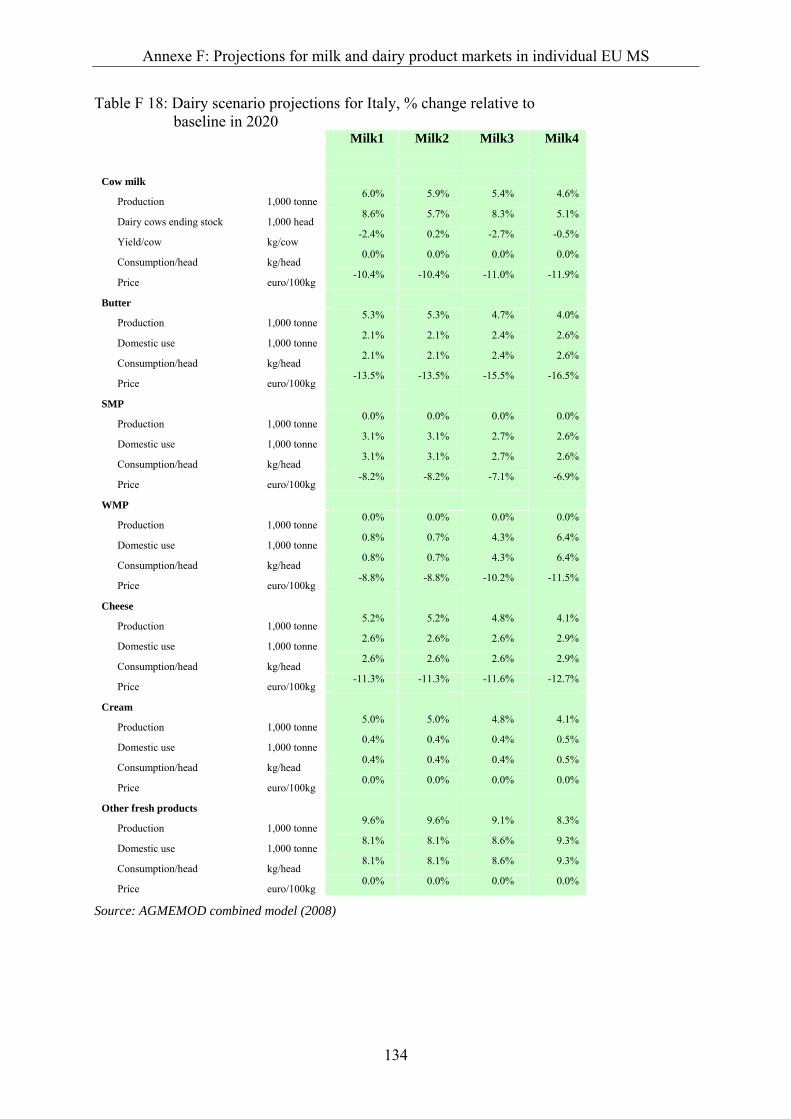
Annexe F: Projections for milk and dairy product markets in individual EU MS
134
Table F 18: Dairy scenario projections for Italy, % change relative to baseline in 2020
Milk1 Milk2 Milk3 Milk4
Cow milk
Production 1,000 tonne 6.0% 5.9% 5.4% 4.6%
Dairy cows ending stock 1,000 head 8.6% 5.7% 8.3% 5.1%
Yield/cow kg/cow -2.4% 0.2% -2.7% -0.5%
Consumption/head kg/head 0.0% 0.0% 0.0% 0.0%
Price euro/100kg -10.4% -10.4% -11.0% -11.9%
Butter
Production 1,000 tonne 5.3% 5.3% 4.7% 4.0%
Domestic use 1,000 tonne 2.1% 2.1% 2.4% 2.6%
Consumption/head kg/head 2.1% 2.1% 2.4% 2.6%
Price euro/100kg -13.5% -13.5% -15.5% -16.5%
SMP
Production 1,000 tonne 0.0% 0.0% 0.0% 0.0%
Domestic use 1,000 tonne 3.1% 3.1% 2.7% 2.6%
Consumption/head kg/head 3.1% 3.1% 2.7% 2.6%
Price euro/100kg -8.2% -8.2% -7.1% -6.9%
WMP
Production 1,000 tonne 0.0% 0.0% 0.0% 0.0%
Domestic use 1,000 tonne 0.8% 0.7% 4.3% 6.4%
Consumption/head kg/head 0.8% 0.7% 4.3% 6.4%
Price euro/100kg -8.8% -8.8% -10.2% -11.5%
Cheese
Production 1,000 tonne 5.2% 5.2% 4.8% 4.1%
Domestic use 1,000 tonne 2.6% 2.6% 2.6% 2.9%
Consumption/head kg/head 2.6% 2.6% 2.6% 2.9%
Price euro/100kg -11.3% -11.3% -11.6% -12.7%
Cream
Production 1,000 tonne 5.0% 5.0% 4.8% 4.1%
Domestic use 1,000 tonne 0.4% 0.4% 0.4% 0.5%
Consumption/head kg/head 0.4% 0.4% 0.4% 0.5%
Price euro/100kg 0.0% 0.0% 0.0% 0.0%
Other fresh products
Production 1,000 tonne 9.6% 9.6% 9.1% 8.3%
Domestic use 1,000 tonne 8.1% 8.1% 8.6% 9.3%
Consumption/head kg/head 8.1% 8.1% 8.6% 9.3%
Price euro/100kg 0.0% 0.0% 0.0% 0.0%
Source: AGMEMOD combined model (2008)
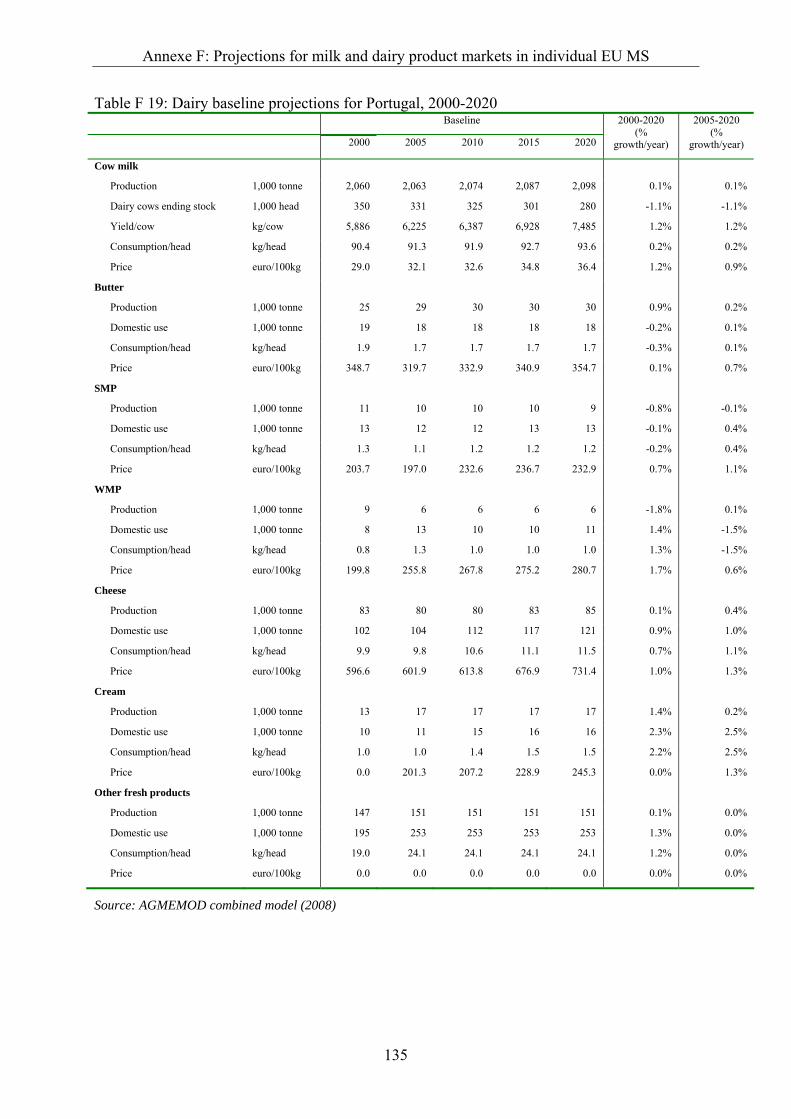
Annexe F: Projections for milk and dairy product markets in individual EU MS
135
Table F 19: Dairy baseline projections for Portugal, 2000-2020 Baseline
2000 2005 2010 2015 2020
2000-2020 (%
growth/year)
2005-2020 (%
growth/year)
Cow milk
Production 1,000 tonne 2,060 2,063 2,074 2,087 2,098 0.1% 0.1%
Dairy cows ending stock 1,000 head 350 331 325 301 280 -1.1% -1.1%
Yield/cow kg/cow 5,886 6,225 6,387 6,928 7,485 1.2% 1.2%
Consumption/head kg/head 90.4 91.3 91.9 92.7 93.6 0.2% 0.2%
Price euro/100kg 29.0 32.1 32.6 34.8 36.4 1.2% 0.9%
Butter
Production 1,000 tonne 25 29 30 30 30 0.9% 0.2%
Domestic use 1,000 tonne 19 18 18 18 18 -0.2% 0.1%
Consumption/head kg/head 1.9 1.7 1.7 1.7 1.7 -0.3% 0.1%
Price euro/100kg 348.7 319.7 332.9 340.9 354.7 0.1% 0.7%
SMP
Production 1,000 tonne 11 10 10 10 9 -0.8% -0.1%
Domestic use 1,000 tonne 13 12 12 13 13 -0.1% 0.4%
Consumption/head kg/head 1.3 1.1 1.2 1.2 1.2 -0.2% 0.4%
Price euro/100kg 203.7 197.0 232.6 236.7 232.9 0.7% 1.1%
WMP
Production 1,000 tonne 9 6 6 6 6 -1.8% 0.1%
Domestic use 1,000 tonne 8 13 10 10 11 1.4% -1.5%
Consumption/head kg/head 0.8 1.3 1.0 1.0 1.0 1.3% -1.5%
Price euro/100kg 199.8 255.8 267.8 275.2 280.7 1.7% 0.6%
Cheese
Production 1,000 tonne 83 80 80 83 85 0.1% 0.4%
Domestic use 1,000 tonne 102 104 112 117 121 0.9% 1.0%
Consumption/head kg/head 9.9 9.8 10.6 11.1 11.5 0.7% 1.1%
Price euro/100kg 596.6 601.9 613.8 676.9 731.4 1.0% 1.3%
Cream
Production 1,000 tonne 13 17 17 17 17 1.4% 0.2%
Domestic use 1,000 tonne 10 11 15 16 16 2.3% 2.5%
Consumption/head kg/head 1.0 1.0 1.4 1.5 1.5 2.2% 2.5%
Price euro/100kg 0.0 201.3 207.2 228.9 245.3 0.0% 1.3%
Other fresh products
Production 1,000 tonne 147 151 151 151 151 0.1% 0.0%
Domestic use 1,000 tonne 195 253 253 253 253 1.3% 0.0%
Consumption/head kg/head 19.0 24.1 24.1 24.1 24.1 1.2% 0.0%
Price euro/100kg 0.0 0.0 0.0 0.0 0.0 0.0% 0.0%
Source: AGMEMOD combined model (2008)
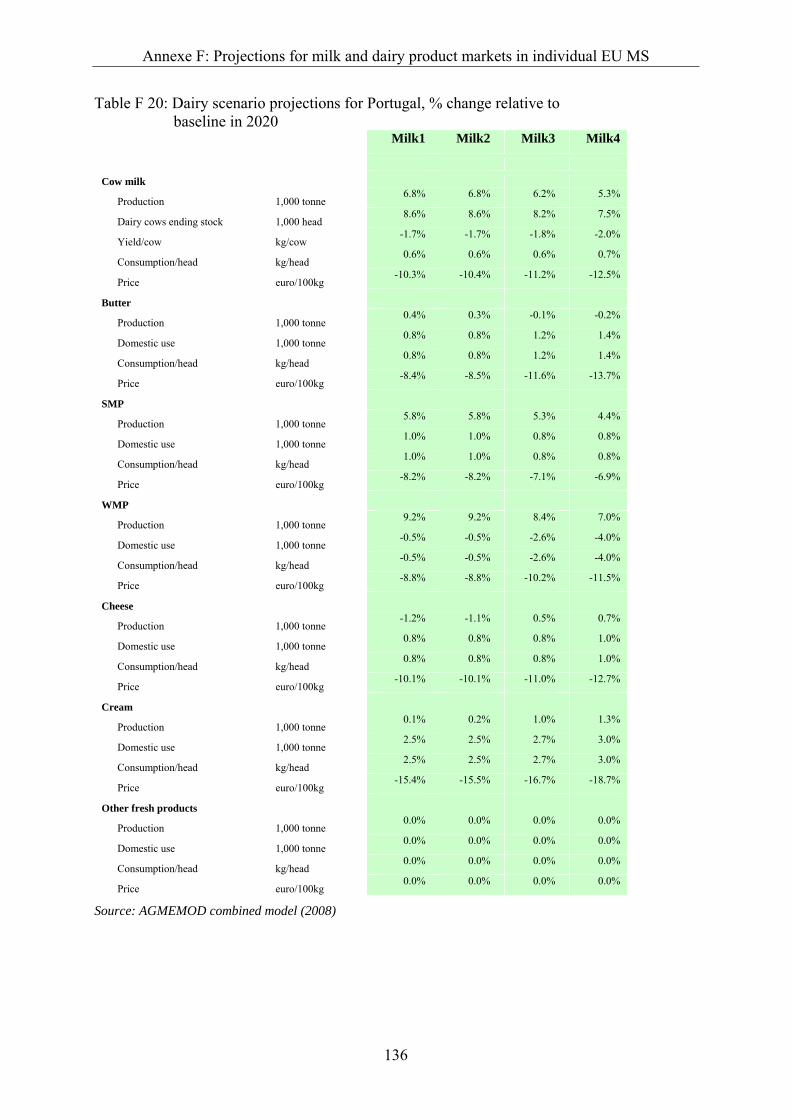
Annexe F: Projections for milk and dairy product markets in individual EU MS
136
Table F 20: Dairy scenario projections for Portugal, % change relative to baseline in 2020
Milk1 Milk2 Milk3 Milk4
Cow milk
Production 1,000 tonne 6.8% 6.8% 6.2% 5.3%
Dairy cows ending stock 1,000 head 8.6% 8.6% 8.2% 7.5%
Yield/cow kg/cow -1.7% -1.7% -1.8% -2.0%
Consumption/head kg/head 0.6% 0.6% 0.6% 0.7%
Price euro/100kg -10.3% -10.4% -11.2% -12.5%
Butter
Production 1,000 tonne 0.4% 0.3% -0.1% -0.2%
Domestic use 1,000 tonne 0.8% 0.8% 1.2% 1.4%
Consumption/head kg/head 0.8% 0.8% 1.2% 1.4%
Price euro/100kg -8.4% -8.5% -11.6% -13.7%
SMP
Production 1,000 tonne 5.8% 5.8% 5.3% 4.4%
Domestic use 1,000 tonne 1.0% 1.0% 0.8% 0.8%
Consumption/head kg/head 1.0% 1.0% 0.8% 0.8%
Price euro/100kg -8.2% -8.2% -7.1% -6.9%
WMP
Production 1,000 tonne 9.2% 9.2% 8.4% 7.0%
Domestic use 1,000 tonne -0.5% -0.5% -2.6% -4.0%
Consumption/head kg/head -0.5% -0.5% -2.6% -4.0%
Price euro/100kg -8.8% -8.8% -10.2% -11.5%
Cheese
Production 1,000 tonne -1.2% -1.1% 0.5% 0.7%
Domestic use 1,000 tonne 0.8% 0.8% 0.8% 1.0%
Consumption/head kg/head 0.8% 0.8% 0.8% 1.0%
Price euro/100kg -10.1% -10.1% -11.0% -12.7%
Cream
Production 1,000 tonne 0.1% 0.2% 1.0% 1.3%
Domestic use 1,000 tonne 2.5% 2.5% 2.7% 3.0%
Consumption/head kg/head 2.5% 2.5% 2.7% 3.0%
Price euro/100kg -15.4% -15.5% -16.7% -18.7%
Other fresh products
Production 1,000 tonne 0.0% 0.0% 0.0% 0.0%
Domestic use 1,000 tonne 0.0% 0.0% 0.0% 0.0%
Consumption/head kg/head 0.0% 0.0% 0.0% 0.0%
Price euro/100kg 0.0% 0.0% 0.0% 0.0%
Source: AGMEMOD combined model (2008)

Annexe F: Projections for milk and dairy product markets in individual EU MS
137
Table F 21: Dairy baseline projections for Spain, 2000-2020 Baseline
2000 2005 2010 2015 2020
2000-2020 (%
growth/year)
2005-2020 (%
growth/year)
Cow milk
Production 1,000 tonne 6,290 6,523 6,463 6,485 6,476 0.1% 0.0%
Dairy cows ending stock 1,000 head 1,141 1,077 961 866 788 -1.8% -2.1%
Yield/cow kg/cow 5,515 6,057 6,729 7,485 8,216 2.0% 2.1%
Consumption/head kg/head 107.1 104.9 104.3 107.3 108.1 0.0% 0.2%
Price euro/100kg 27.1 28.1 29.1 31.8 34.1 1.2% 1.3%
Butter
Production 1,000 tonne 34 68 48 42 37 0.4% -4.0%
Domestic use 1,000 tonne 37 42 43 45 47 1.2% 0.6%
Consumption/head kg/head 0.9 1.0 1.0 1.1 1.1 0.8% 0.3%
Price euro/100kg 308.3 271.9 259.3 290.8 323.4 0.2% 1.2%
SMP
Production 1,000 tonne 11 7 5 5 4 -4.9% -3.2%
Domestic use 1,000 tonne 14 21 18 18 18 1.2% -1.0%
Consumption/head kg/head 0.4 0.5 0.4 0.4 0.4 0.8% -1.3%
Price euro/100kg 246.4 197.0 232.6 236.7 232.9 -0.3% 1.1%
WMP
Production 1,000 tonne 10 14 11 10 8 -1.0% -3.6%
Domestic use 1,000 tonne 4 8 0 2 2 -4.7% -10.9%
Consumption/head kg/head 0.1 0.2 0.0 0.1 0.0 -5.1% -11.1%
Price euro/100kg 51.8 182.8 237.7 234.4 236.2 7.9% 1.7%
Cheese
Production 1,000 tonne 283 294 318 330 348 1.0% 1.1%
Domestic use 1,000 tonne 358 413 477 519 568 2.3% 2.1%
Consumption/head kg/head 8.9 10.0 11.3 12.1 13.1 1.9% 1.8%
Price euro/100kg 653.8 689.0 735.6 817.1 884.0 1.5% 1.7%
Cream
Production 1,000 tonne 95 67 67 67 67 -1.7% 0.0%
Domestic use 1,000 tonne 97 72 72 72 72 -1.5% 0.0%
Consumption/head kg/head 2.4 1.8 1.8 1.8 1.8 -1.6% 0.0%
Price euro/100kg 164.1 187.5 187.5 187.5 187.5 0.7% 0.0%
Other fresh products
Production 1,000 tonne 806 940 1,206 1,409 1,635 3.6% 3.8%
Domestic use 1,000 tonne 924 1,218 1,507 1,728 1,975 3.9% 3.3%
Consumption/head kg/head 23.0 29.4 35.6 40.1 45.5 3.5% 2.9%
Price euro/100kg NA NA NA NA NA 0.0% 0.0%
Source: AGMEMOD combined model (2008)
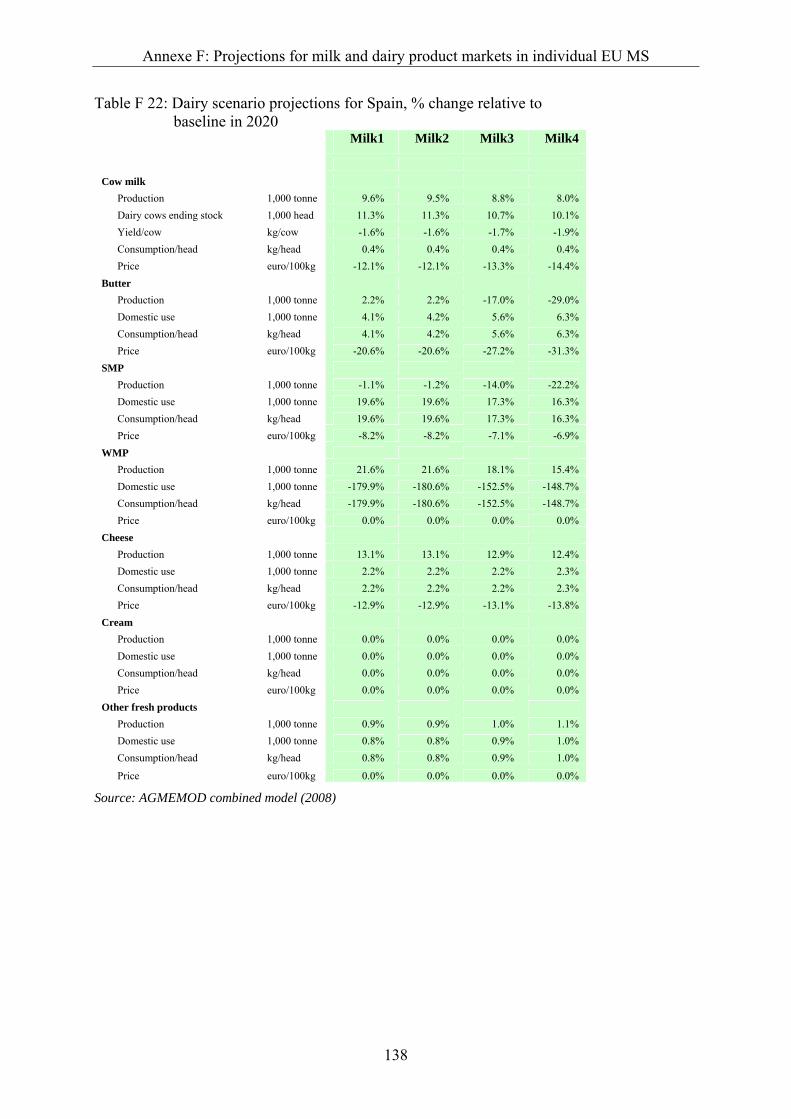
Annexe F: Projections for milk and dairy product markets in individual EU MS
138
Table F 22: Dairy scenario projections for Spain, % change relative to baseline in 2020
Milk1 Milk2 Milk3 Milk4
Cow milk Production 1,000 tonne 9.6% 9.5% 8.8% 8.0% Dairy cows ending stock 1,000 head 11.3% 11.3% 10.7% 10.1% Yield/cow kg/cow -1.6% -1.6% -1.7% -1.9% Consumption/head kg/head 0.4% 0.4% 0.4% 0.4% Price euro/100kg -12.1% -12.1% -13.3% -14.4% Butter Production 1,000 tonne 2.2% 2.2% -17.0% -29.0% Domestic use 1,000 tonne 4.1% 4.2% 5.6% 6.3% Consumption/head kg/head 4.1% 4.2% 5.6% 6.3% Price euro/100kg -20.6% -20.6% -27.2% -31.3% SMP Production 1,000 tonne -1.1% -1.2% -14.0% -22.2% Domestic use 1,000 tonne 19.6% 19.6% 17.3% 16.3% Consumption/head kg/head 19.6% 19.6% 17.3% 16.3% Price euro/100kg -8.2% -8.2% -7.1% -6.9% WMP Production 1,000 tonne 21.6% 21.6% 18.1% 15.4% Domestic use 1,000 tonne -179.9% -180.6% -152.5% -148.7% Consumption/head kg/head -179.9% -180.6% -152.5% -148.7% Price euro/100kg 0.0% 0.0% 0.0% 0.0% Cheese Production 1,000 tonne 13.1% 13.1% 12.9% 12.4% Domestic use 1,000 tonne 2.2% 2.2% 2.2% 2.3% Consumption/head kg/head 2.2% 2.2% 2.2% 2.3% Price euro/100kg -12.9% -12.9% -13.1% -13.8% Cream Production 1,000 tonne 0.0% 0.0% 0.0% 0.0% Domestic use 1,000 tonne 0.0% 0.0% 0.0% 0.0% Consumption/head kg/head 0.0% 0.0% 0.0% 0.0% Price euro/100kg 0.0% 0.0% 0.0% 0.0% Other fresh products Production 1,000 tonne 0.9% 0.9% 1.0% 1.1% Domestic use 1,000 tonne 0.8% 0.8% 0.9% 1.0% Consumption/head kg/head 0.8% 0.8% 0.9% 1.0%
Price euro/100kg 0.0% 0.0% 0.0% 0.0%
Source: AGMEMOD combined model (2008)
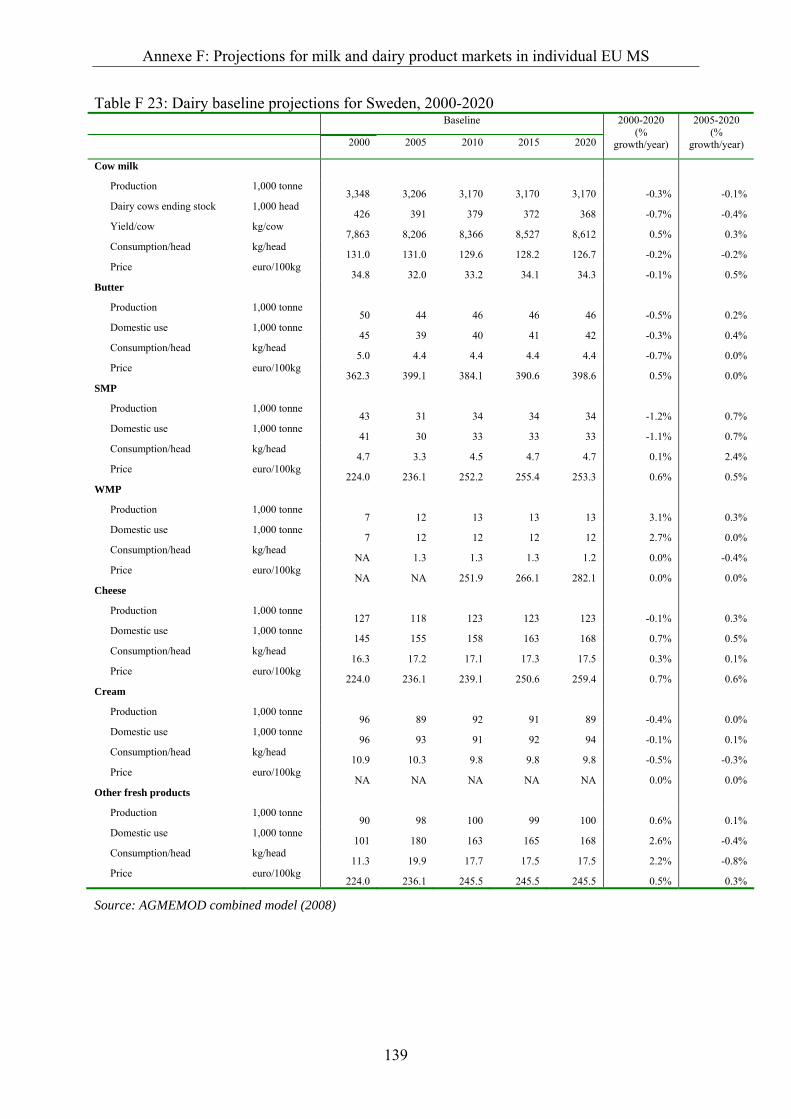
Annexe F: Projections for milk and dairy product markets in individual EU MS
139
Table F 23: Dairy baseline projections for Sweden, 2000-2020 Baseline
2000 2005 2010 2015 2020
2000-2020 (%
growth/year)
2005-2020 (%
growth/year)
Cow milk
Production 1,000 tonne 3,348 3,206 3,170 3,170 3,170 -0.3% -0.1%
Dairy cows ending stock 1,000 head 426 391 379 372 368 -0.7% -0.4%
Yield/cow kg/cow 7,863 8,206 8,366 8,527 8,612 0.5% 0.3%
Consumption/head kg/head 131.0 131.0 129.6 128.2 126.7 -0.2% -0.2%
Price euro/100kg 34.8 32.0 33.2 34.1 34.3 -0.1% 0.5%
Butter
Production 1,000 tonne 50 44 46 46 46 -0.5% 0.2%
Domestic use 1,000 tonne 45 39 40 41 42 -0.3% 0.4%
Consumption/head kg/head 5.0 4.4 4.4 4.4 4.4 -0.7% 0.0%
Price euro/100kg 362.3 399.1 384.1 390.6 398.6 0.5% 0.0%
SMP
Production 1,000 tonne 43 31 34 34 34 -1.2% 0.7%
Domestic use 1,000 tonne 41 30 33 33 33 -1.1% 0.7%
Consumption/head kg/head 4.7 3.3 4.5 4.7 4.7 0.1% 2.4%
Price euro/100kg 224.0 236.1 252.2 255.4 253.3 0.6% 0.5%
WMP
Production 1,000 tonne 7 12 13 13 13 3.1% 0.3%
Domestic use 1,000 tonne 7 12 12 12 12 2.7% 0.0%
Consumption/head kg/head NA 1.3 1.3 1.3 1.2 0.0% -0.4%
Price euro/100kg NA NA 251.9 266.1 282.1 0.0% 0.0%
Cheese
Production 1,000 tonne 127 118 123 123 123 -0.1% 0.3%
Domestic use 1,000 tonne 145 155 158 163 168 0.7% 0.5%
Consumption/head kg/head 16.3 17.2 17.1 17.3 17.5 0.3% 0.1%
Price euro/100kg 224.0 236.1 239.1 250.6 259.4 0.7% 0.6%
Cream
Production 1,000 tonne 96 89 92 91 89 -0.4% 0.0%
Domestic use 1,000 tonne 96 93 91 92 94 -0.1% 0.1%
Consumption/head kg/head 10.9 10.3 9.8 9.8 9.8 -0.5% -0.3%
Price euro/100kg NA NA NA NA NA 0.0% 0.0%
Other fresh products
Production 1,000 tonne 90 98 100 99 100 0.6% 0.1%
Domestic use 1,000 tonne 101 180 163 165 168 2.6% -0.4%
Consumption/head kg/head 11.3 19.9 17.7 17.5 17.5 2.2% -0.8%
Price euro/100kg 224.0 236.1 245.5 245.5 245.5 0.5% 0.3%
Source: AGMEMOD combined model (2008)

Annexe F: Projections for milk and dairy product markets in individual EU MS
140
Table F 24: Dairy scenario projections for Sweden, % change relative to baseline in 2020
Milk1 Milk2 Milk3 Milk4
Cow milk Production 1,000 tonne -1.4% -1.4% -1.4% -1.5% Dairy cows ending stock 1,000 head -1.4% -1.4% -1.4% -1.5% Yield/cow kg/cow 0.0% 0.0% 0.0% 0.0% Consumption/head kg/head 0.0% 0.0% 0.0% 0.0% Price euro/100kg -1.8% -1.8% -1.8% -2.0% Butter Production 1,000 tonne 0.2% 0.2% 0.2% 0.1% Domestic use 1,000 tonne 0.0% 0.0% 0.0% 0.0% Consumption/head kg/head 0.0% 0.0% 0.0% 0.0% Price euro/100kg -4.3% -4.3% -5.7% -6.8% SMP Production 1,000 tonne 0.2% 0.2% 0.2% 0.3% Domestic use 1,000 tonne 0.2% 0.2% 0.2% 0.3% Consumption/head kg/head 0.1% 0.1% 0.1% 0.1% Price euro/100kg -2.1% -2.1% -1.7% -1.7% WMP Production 1,000 tonne -0.5% -0.5% -0.6% -0.6% Domestic use 1,000 tonne 4.8% 5.1% 5.0% 5.3% Consumption/head kg/head 4.8% 5.1% 5.0% 5.3% Price euro/100kg -11.7% -11.7% -11.9% -12.0% Cheese Production 1,000 tonne -0.2% -0.2% -0.2% -0.3% Domestic use 1,000 tonne 0.1% 0.1% 0.1% 0.1% Consumption/head kg/head 0.1% 0.1% 0.1% 0.1% Price euro/100kg -3.2% -3.2% -3.3% -3.8% Cream Production 1,000 tonne 0.0% 0.0% 0.0% 0.0% Domestic use 1,000 tonne 0.0% 0.0% 0.0% 0.0% Consumption/head kg/head 0.0% 0.0% 0.0% 0.0% Price euro/100kg 0.0% 0.0% 0.0% 0.0% Other fresh products Production 1,000 tonne 0.9% 0.9% 0.9% 0.9% Domestic use 1,000 tonne 1.3% 1.3% 1.3% 1.3% Consumption/head kg/head 1.3% 1.3% 1.3% 1.3%
Price euro/100kg 0.0% 0.0% 0.0% 0.0%
Source: AGMEMOD combined model (2008)

Annexe F: Projections for milk and dairy product markets in individual EU MS
141
Table F 25: Dairy baseline projections for the Netherlands, 2000-2020 Baseline
2000 2005 2010 2015 2020
2000-2020 (%
growth/year)
2005-2020 (%
growth/year)
Cow milk
Production 1,000 tonne 10,966 10,846 11,268 11,239 11,202 0.1% 0.2%
Dairy cows ending stock 1,000 head 1,532 1,486 1,465 1,381 1,304 -0.8% -0.9%
Yield/cow kg/cow 7,158 7,298 7,690 8,141 8,591 0.9% 1.1%
Consumption/head kg/head 87.9 91.2 89.5 89.9 89.3 0.1% -0.1%
Price euro/100kg 29.2 27.4 29.4 30.9 32.0 0.5% 1.1%
Butter
Production 1,000 tonne 126 119 120 119 120 -0.3% 0.0%
Domestic use 1,000 tonne 52 53 52 51 50 -0.2% -0.4%
Consumption/head kg/head 3.3 3.2 3.1 3.1 3.0 -0.5% -0.6%
Price euro/100kg 316.7 279.5 289.0 301.3 315.8 0.0% 0.8%
SMP
Production 1,000 tonne 74 68 77 75 72 -0.1% 0.4%
Domestic use 1,000 tonne 188 165 120 118 121 -2.2% -2.1%
Consumption/head kg/head 11.8 10.1 7.3 7.1 7.2 -2.4% -2.2%
Price euro/100kg 243.7 197.0 232.6 236.7 232.9 -0.2% 1.1%
WMP
Production 1,000 tonne 96 67 75 57 43 -4.0% -2.9%
Domestic use 1,000 tonne 64 12 38 38 38 -2.6% 7.9%
Consumption/head kg/head 4.0 0.7 2.3 2.3 2.2 -2.9% 7.7%
Price euro/100kg 285.0 255.8 267.8 275.2 280.7 -0.1% 0.6%
Cheese
Production 1,000 tonne 663 672 717 741 761 0.7% 0.8%
Domestic use 1,000 tonne 269 366 356 378 404 2.0% 0.7%
Consumption/head kg/head 16.9 22.4 21.6 22.8 24.1 1.8% 0.5%
Price euro/100kg 293.3 308.9 312.4 339.7 362.9 1.1% 1.1%
Cream
Production 1,000 tonne 58 36 45 43 43 -1.5% 1.2%
Domestic use 1,000 tonne 46 37 25 21 18 -4.5% -4.6%
Consumption/head kg/head 2.9 2.3 1.5 1.2 1.1 -4.8% -4.8%
Price euro/100kg 276.2 284.6 271.6 262.4 264.5 -0.2% -0.5%
Other fresh products
Production 1,000 tonne 412 460 460 460 460 0.6% 0.0%
Domestic use 1,000 tonne 548 601 601 601 601 0.5% 0.0%
Consumption/head kg/head 34.4 36.8 36.8 36.8 36.8 0.3% 0.0%
Price euro/100kg NA NA NA NA NA 0.0% 0.0%
Source: AGMEMOD combined model (2008)
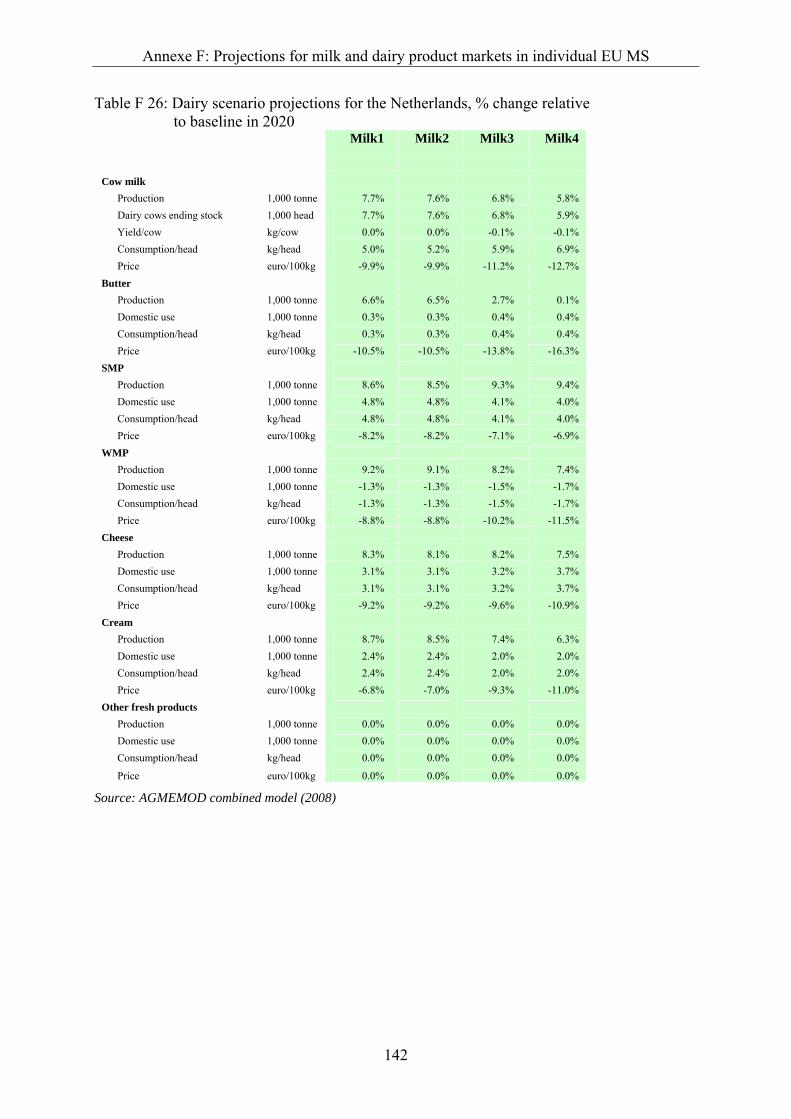
Annexe F: Projections for milk and dairy product markets in individual EU MS
142
Table F 26: Dairy scenario projections for the Netherlands, % change relative to baseline in 2020
Milk1 Milk2 Milk3 Milk4
Cow milk Production 1,000 tonne 7.7% 7.6% 6.8% 5.8% Dairy cows ending stock 1,000 head 7.7% 7.6% 6.8% 5.9% Yield/cow kg/cow 0.0% 0.0% -0.1% -0.1% Consumption/head kg/head 5.0% 5.2% 5.9% 6.9% Price euro/100kg -9.9% -9.9% -11.2% -12.7% Butter Production 1,000 tonne 6.6% 6.5% 2.7% 0.1% Domestic use 1,000 tonne 0.3% 0.3% 0.4% 0.4% Consumption/head kg/head 0.3% 0.3% 0.4% 0.4% Price euro/100kg -10.5% -10.5% -13.8% -16.3% SMP Production 1,000 tonne 8.6% 8.5% 9.3% 9.4% Domestic use 1,000 tonne 4.8% 4.8% 4.1% 4.0% Consumption/head kg/head 4.8% 4.8% 4.1% 4.0% Price euro/100kg -8.2% -8.2% -7.1% -6.9% WMP Production 1,000 tonne 9.2% 9.1% 8.2% 7.4% Domestic use 1,000 tonne -1.3% -1.3% -1.5% -1.7% Consumption/head kg/head -1.3% -1.3% -1.5% -1.7% Price euro/100kg -8.8% -8.8% -10.2% -11.5% Cheese Production 1,000 tonne 8.3% 8.1% 8.2% 7.5% Domestic use 1,000 tonne 3.1% 3.1% 3.2% 3.7% Consumption/head kg/head 3.1% 3.1% 3.2% 3.7% Price euro/100kg -9.2% -9.2% -9.6% -10.9% Cream Production 1,000 tonne 8.7% 8.5% 7.4% 6.3% Domestic use 1,000 tonne 2.4% 2.4% 2.0% 2.0% Consumption/head kg/head 2.4% 2.4% 2.0% 2.0% Price euro/100kg -6.8% -7.0% -9.3% -11.0% Other fresh products Production 1,000 tonne 0.0% 0.0% 0.0% 0.0% Domestic use 1,000 tonne 0.0% 0.0% 0.0% 0.0% Consumption/head kg/head 0.0% 0.0% 0.0% 0.0%
Price euro/100kg 0.0% 0.0% 0.0% 0.0%
Source: AGMEMOD combined model (2008)

Annexe F: Projections for milk and dairy product markets in individual EU MS
143
Table F 27: Dairy baseline projections for UK, 2000-2020 Baseline
2000 2005 2010 2015 2020
2000-2020 (%
growth/year)
2005-2020 (%
growth/year)
Cow milk
Production 1,000 tonne 14,078 14,682 15,126 15,031 14,936 0.3% 0.1%
Dairy cows ending stock 1,000 head 2,339 2,069 2,091 1,911 1,755 -1.4% -1.1%
Yield/cow kg/cow 6,197 7,096 7,235 7,863 8,511 1.6% 1.2%
Consumption/head kg/head 119.4 112.3 110.6 109.2 107.7 -0.5% -0.3%
Price euro/100kg 25.6 25.5 28.4 29.0 29.1 0.6% 0.9%
Butter
Production 1,000 tonne 132 128 131 127 123 -0.3% -0.2%
Domestic use 1,000 tonne 175 248 228 227 228 1.3% -0.6%
Consumption/head kg/head 2.9 4.1 3.7 3.6 3.5 0.9% -0.9%
Price euro/100kg 300.2 258.8 274.2 287.4 303.4 0.1% 1.1%
SMP
Production 1,000 tonne 89 135 146 125 102 0.7% -1.9%
Domestic use 1,000 tonne 155 79 114 113 124 -1.1% 3.0%
Consumption/head kg/head 2.6 1.3 1.8 1.8 1.9 -1.5% 2.6%
Price euro/100kg 274.4 217.6 251.2 255.2 251.5 -0.4% 1.0%
WMP
Production 1,000 tonne 105 85 115 130 145 1.6% 3.6%
Domestic use 1,000 tonne 98 105 114 128 144 1.9% 2.1%
Consumption/head kg/head 1.6 1.7 1.8 2.0 2.2 1.5% 1.7%
Price euro/100kg 274.4 223.5 251.1 254.5 251.2 -0.4% 0.8%
Cheese
Production 1,000 tonne 310 327 324 328 331 0.3% 0.1%
Domestic use 1,000 tonne 483 578 641 709 778 2.4% 2.0%
Consumption/head kg/head 8.1 9.5 10.3 11.2 12.1 2.0% 1.6%
Price euro/100kg 312.3 281.7 292.8 319.4 341.7 0.5% 1.3%
Cream
Production 1,000 tonne 270 310 331 353 374 1.6% 1.3%
Domestic use 1,000 tonne 271 354 389 428 470 2.8% 1.9%
Consumption/head kg/head 4.5 5.8 6.3 6.8 7.3 2.4% 1.5%
Price euro/100kg NA 395.7 419.3 439.5 464.0 0.0% 1.1%
Other fresh products
Production 1,000 tonne 243 239 287 338 387 2.4% 3.3%
Domestic use 1,000 tonne 464 668 813 968 1,126 4.5% 3.5%
Consumption/head kg/head 7.8 11.0 13.1 15.3 17.5 4.1% 3.1%
Price euro/100kg NA NA NA NA NA 0.0% 0.0%
Source: AGMEMOD combined model (2008)
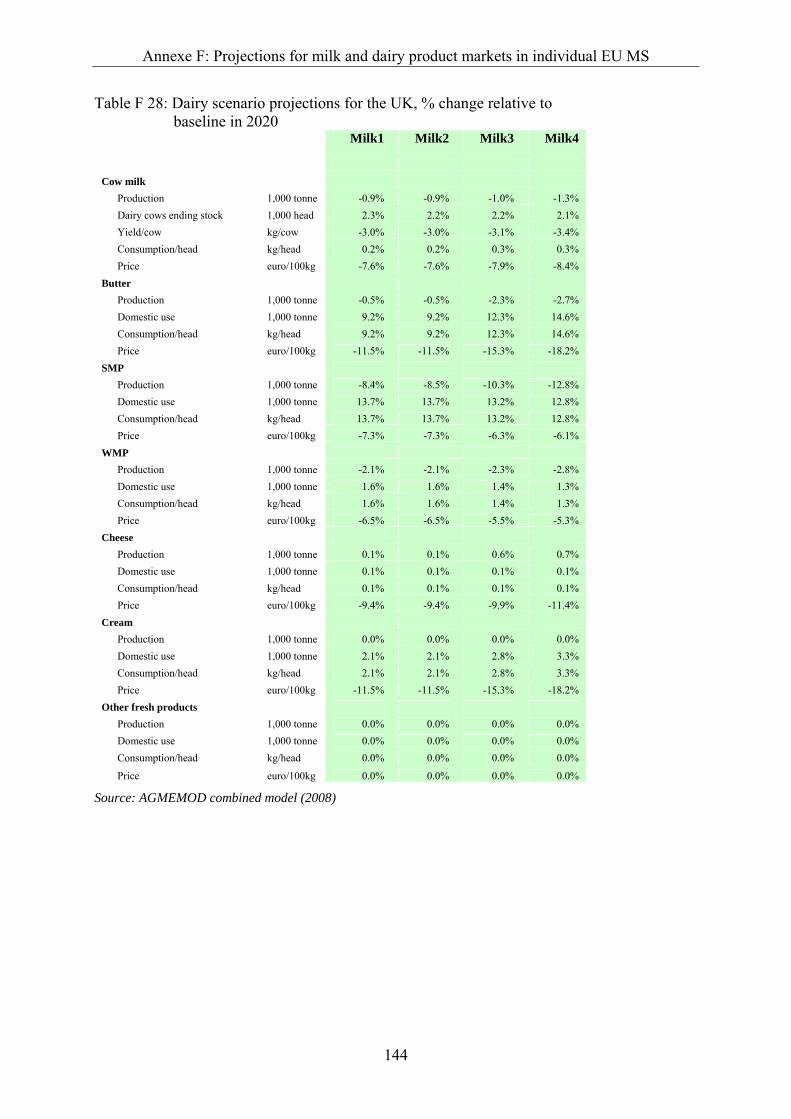
Annexe F: Projections for milk and dairy product markets in individual EU MS
144
Table F 28: Dairy scenario projections for the UK, % change relative to baseline in 2020
Milk1 Milk2 Milk3 Milk4
Cow milk Production 1,000 tonne -0.9% -0.9% -1.0% -1.3% Dairy cows ending stock 1,000 head 2.3% 2.2% 2.2% 2.1% Yield/cow kg/cow -3.0% -3.0% -3.1% -3.4% Consumption/head kg/head 0.2% 0.2% 0.3% 0.3% Price euro/100kg -7.6% -7.6% -7.9% -8.4% Butter Production 1,000 tonne -0.5% -0.5% -2.3% -2.7% Domestic use 1,000 tonne 9.2% 9.2% 12.3% 14.6% Consumption/head kg/head 9.2% 9.2% 12.3% 14.6% Price euro/100kg -11.5% -11.5% -15.3% -18.2% SMP Production 1,000 tonne -8.4% -8.5% -10.3% -12.8% Domestic use 1,000 tonne 13.7% 13.7% 13.2% 12.8% Consumption/head kg/head 13.7% 13.7% 13.2% 12.8% Price euro/100kg -7.3% -7.3% -6.3% -6.1% WMP Production 1,000 tonne -2.1% -2.1% -2.3% -2.8% Domestic use 1,000 tonne 1.6% 1.6% 1.4% 1.3% Consumption/head kg/head 1.6% 1.6% 1.4% 1.3% Price euro/100kg -6.5% -6.5% -5.5% -5.3% Cheese Production 1,000 tonne 0.1% 0.1% 0.6% 0.7% Domestic use 1,000 tonne 0.1% 0.1% 0.1% 0.1% Consumption/head kg/head 0.1% 0.1% 0.1% 0.1% Price euro/100kg -9.4% -9.4% -9.9% -11.4% Cream Production 1,000 tonne 0.0% 0.0% 0.0% 0.0% Domestic use 1,000 tonne 2.1% 2.1% 2.8% 3.3% Consumption/head kg/head 2.1% 2.1% 2.8% 3.3% Price euro/100kg -11.5% -11.5% -15.3% -18.2% Other fresh products Production 1,000 tonne 0.0% 0.0% 0.0% 0.0% Domestic use 1,000 tonne 0.0% 0.0% 0.0% 0.0% Consumption/head kg/head 0.0% 0.0% 0.0% 0.0%
Price euro/100kg 0.0% 0.0% 0.0% 0.0%
Source: AGMEMOD combined model (2008)
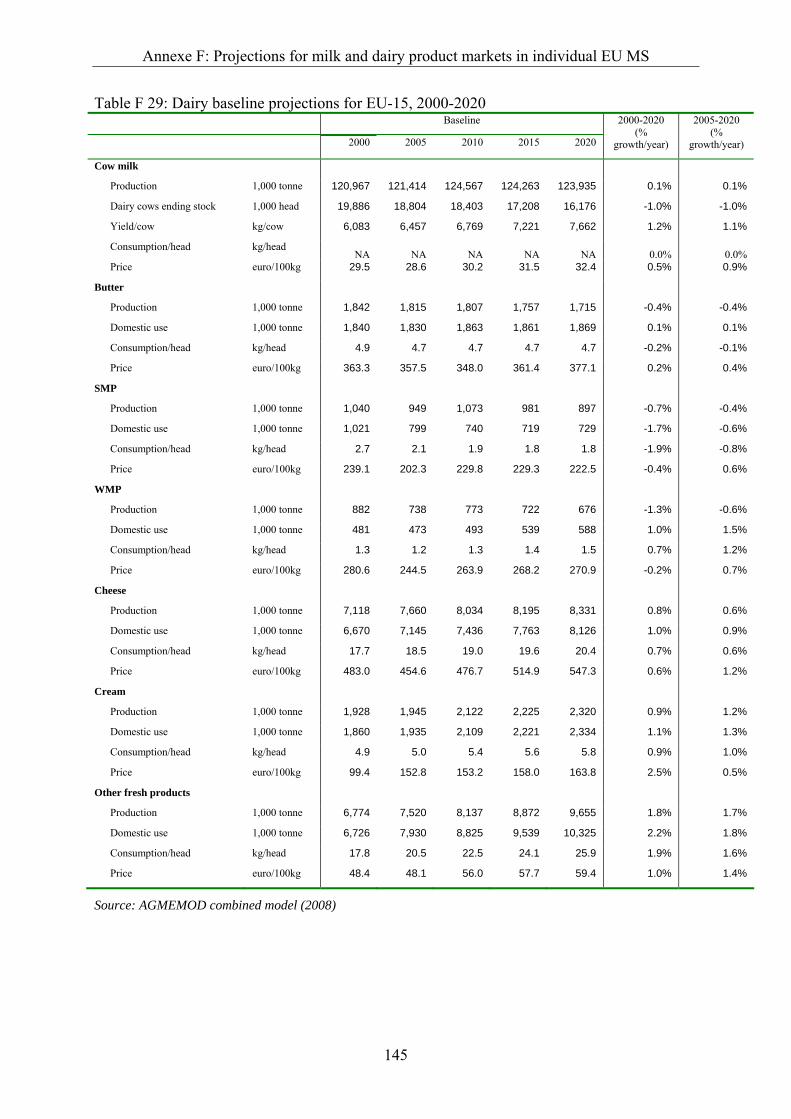
Annexe F: Projections for milk and dairy product markets in individual EU MS
145
Table F 29: Dairy baseline projections for EU-15, 2000-2020 Baseline
2000 2005 2010 2015 2020
2000-2020 (%
growth/year)
2005-2020 (%
growth/year)
Cow milk
Production 1,000 tonne 120,967 121,414 124,567 124,263 123,935 0.1% 0.1%
Dairy cows ending stock 1,000 head 19,886 18,804 18,403 17,208 16,176 -1.0% -1.0%
Yield/cow kg/cow 6,083 6,457 6,769 7,221 7,662 1.2% 1.1%
Consumption/head kg/head NA NA NA NA NA 0.0% 0.0%
Price euro/100kg 29.5 28.6 30.2 31.5 32.4 0.5% 0.9%
Butter
Production 1,000 tonne 1,842 1,815 1,807 1,757 1,715 -0.4% -0.4%
Domestic use 1,000 tonne 1,840 1,830 1,863 1,861 1,869 0.1% 0.1%
Consumption/head kg/head 4.9 4.7 4.7 4.7 4.7 -0.2% -0.1%
Price euro/100kg 363.3 357.5 348.0 361.4 377.1 0.2% 0.4%
SMP
Production 1,000 tonne 1,040 949 1,073 981 897 -0.7% -0.4%
Domestic use 1,000 tonne 1,021 799 740 719 729 -1.7% -0.6%
Consumption/head kg/head 2.7 2.1 1.9 1.8 1.8 -1.9% -0.8%
Price euro/100kg 239.1 202.3 229.8 229.3 222.5 -0.4% 0.6%
WMP
Production 1,000 tonne 882 738 773 722 676 -1.3% -0.6%
Domestic use 1,000 tonne 481 473 493 539 588 1.0% 1.5%
Consumption/head kg/head 1.3 1.2 1.3 1.4 1.5 0.7% 1.2%
Price euro/100kg 280.6 244.5 263.9 268.2 270.9 -0.2% 0.7%
Cheese
Production 1,000 tonne 7,118 7,660 8,034 8,195 8,331 0.8% 0.6%
Domestic use 1,000 tonne 6,670 7,145 7,436 7,763 8,126 1.0% 0.9%
Consumption/head kg/head 17.7 18.5 19.0 19.6 20.4 0.7% 0.6%
Price euro/100kg 483.0 454.6 476.7 514.9 547.3 0.6% 1.2%
Cream
Production 1,000 tonne 1,928 1,945 2,122 2,225 2,320 0.9% 1.2%
Domestic use 1,000 tonne 1,860 1,935 2,109 2,221 2,334 1.1% 1.3%
Consumption/head kg/head 4.9 5.0 5.4 5.6 5.8 0.9% 1.0%
Price euro/100kg 99.4 152.8 153.2 158.0 163.8 2.5% 0.5%
Other fresh products
Production 1,000 tonne 6,774 7,520 8,137 8,872 9,655 1.8% 1.7%
Domestic use 1,000 tonne 6,726 7,930 8,825 9,539 10,325 2.2% 1.8%
Consumption/head kg/head 17.8 20.5 22.5 24.1 25.9 1.9% 1.6%
Price euro/100kg 48.4 48.1 56.0 57.7 59.4 1.0% 1.4%
Source: AGMEMOD combined model (2008)

Annexe F: Projections for milk and dairy product markets in individual EU MS
146
Table F 30: Dairy scenario projections for EU-15, % change relative to baseline in 2020
Source: AGMEMOD combined model (2008)
Milk1 Milk2 Milk3 Milk4
Cow milk
Production 1,000 tonne 5.5% 5.5% 5.0% 4.4%
Dairy cows ending stock 1,000 head 6.2% 5.9% 5.7% 4.8%
Yield/cow kg/cow -0.7% -0.4% -0.6% -0.4%
Consumption/head kg/head 0.0% 0.0% 0.0% 0.0%
Price euro/100kg -7.1% -7.1% -7.9% -8.8%
Butter
Production 1,000 tonne 7.5% 7.5% 5.7% 4.5%
Domestic use 1,000 tonne 2.5% 2.5% 3.3% 3.8%
Consumption/head kg/head 2.5% 2.5% 3.3% 3.8%
Price euro/100kg -9.8% -9.8% -12.6% -14.6%
SMP
Production 1,000 tonne 16.0% 15.9% 13.4% 12.2%
Domestic use 1,000 tonne 8.5% 8.5% 7.5% 7.1%
Consumption/head kg/head 8.5% 8.5% 7.5% 7.1%
Price euro/100kg -5.2% -5.3% -4.5% -4.4%
WMP
Production 1,000 tonne 7.0% 7.0% 6.0% 5.1%
Domestic use 1,000 tonne -0.5% -0.5% -0.4% -0.4%
Consumption/head kg/head -0.5% -0.5% -0.4% -0.4%
Price euro/100kg -6.7% -6.7% -6.7% -6.9%
Cheese
Production 1,000 tonne 5.3% 5.3% 5.0% 4.4%
Domestic use 1,000 tonne 1.6% 1.6% 1.6% 1.7%
Consumption/head kg/head 1.6% 1.6% 1.6% 1.7%
Price euro/100kg -9.2% -9.2% -9.5% -10.4%
Cream
Production 1,000 tonne 2.1% 2.1% 2.7% 3.1%
Domestic use 1,000 tonne 2.1% 2.1% 2.7% 3.2%
Consumption/head kg/head 2.1% 2.1% 2.7% 3.2%
Price euro/100kg -9.8% -9.8% -12.1% -13.8%
Other fresh products
Production 1,000 tonne 0.7% 0.7% 0.8% 0.8%
Domestic use 1,000 tonne 1.2% 1.2% 1.3% 1.5%
Consumption/head kg/head 1.2% 1.2% 1.3% 1.5%
Price euro/100kg -2.1% -2.1% -2.5% -2.7%
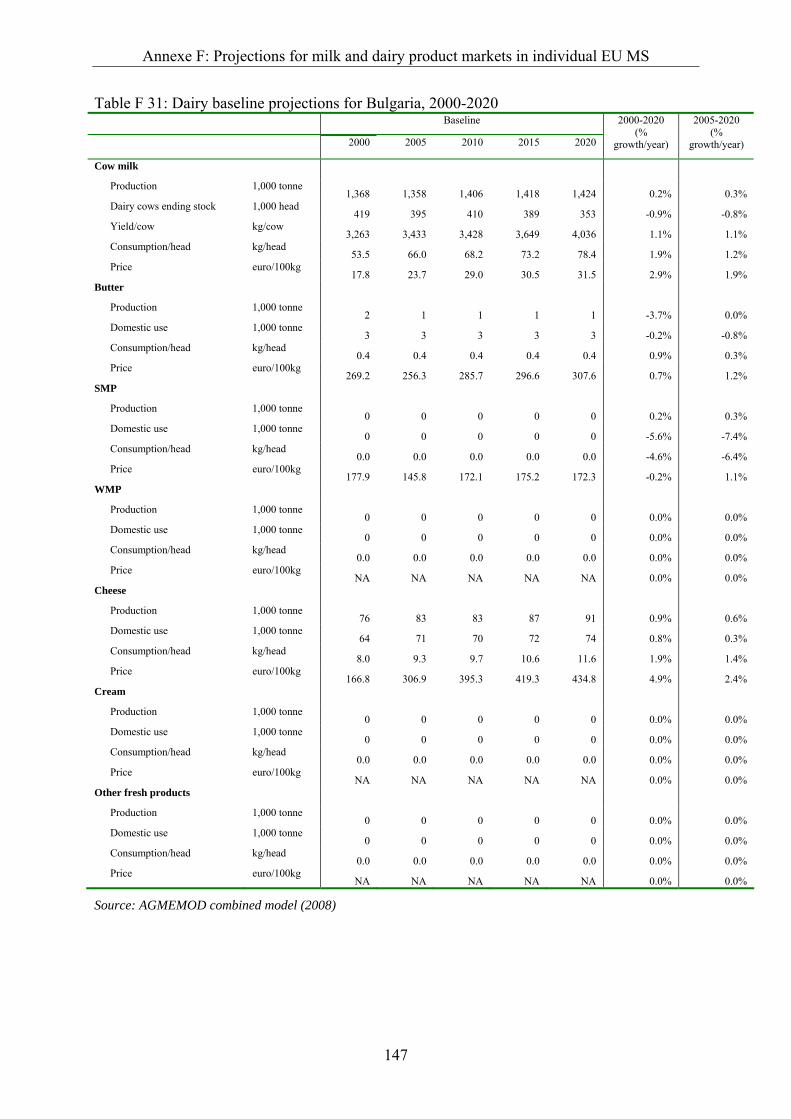
Annexe F: Projections for milk and dairy product markets in individual EU MS
147
Table F 31: Dairy baseline projections for Bulgaria, 2000-2020 Baseline
2000 2005 2010 2015 2020
2000-2020 (%
growth/year)
2005-2020 (%
growth/year)
Cow milk
Production 1,000 tonne 1,368 1,358 1,406 1,418 1,424 0.2% 0.3%
Dairy cows ending stock 1,000 head 419 395 410 389 353 -0.9% -0.8%
Yield/cow kg/cow 3,263 3,433 3,428 3,649 4,036 1.1% 1.1%
Consumption/head kg/head 53.5 66.0 68.2 73.2 78.4 1.9% 1.2%
Price euro/100kg 17.8 23.7 29.0 30.5 31.5 2.9% 1.9%
Butter
Production 1,000 tonne 2 1 1 1 1 -3.7% 0.0%
Domestic use 1,000 tonne 3 3 3 3 3 -0.2% -0.8%
Consumption/head kg/head 0.4 0.4 0.4 0.4 0.4 0.9% 0.3%
Price euro/100kg 269.2 256.3 285.7 296.6 307.6 0.7% 1.2%
SMP
Production 1,000 tonne 0 0 0 0 0 0.2% 0.3%
Domestic use 1,000 tonne 0 0 0 0 0 -5.6% -7.4%
Consumption/head kg/head 0.0 0.0 0.0 0.0 0.0 -4.6% -6.4%
Price euro/100kg 177.9 145.8 172.1 175.2 172.3 -0.2% 1.1%
WMP
Production 1,000 tonne 0 0 0 0 0 0.0% 0.0%
Domestic use 1,000 tonne 0 0 0 0 0 0.0% 0.0%
Consumption/head kg/head 0.0 0.0 0.0 0.0 0.0 0.0% 0.0%
Price euro/100kg NA NA NA NA NA 0.0% 0.0%
Cheese
Production 1,000 tonne 76 83 83 87 91 0.9% 0.6%
Domestic use 1,000 tonne 64 71 70 72 74 0.8% 0.3%
Consumption/head kg/head 8.0 9.3 9.7 10.6 11.6 1.9% 1.4%
Price euro/100kg 166.8 306.9 395.3 419.3 434.8 4.9% 2.4%
Cream
Production 1,000 tonne 0 0 0 0 0 0.0% 0.0%
Domestic use 1,000 tonne 0 0 0 0 0 0.0% 0.0%
Consumption/head kg/head 0.0 0.0 0.0 0.0 0.0 0.0% 0.0%
Price euro/100kg NA NA NA NA NA 0.0% 0.0%
Other fresh products
Production 1,000 tonne 0 0 0 0 0 0.0% 0.0%
Domestic use 1,000 tonne 0 0 0 0 0 0.0% 0.0%
Consumption/head kg/head 0.0 0.0 0.0 0.0 0.0 0.0% 0.0%
Price euro/100kg NA NA NA NA NA 0.0% 0.0%
Source: AGMEMOD combined model (2008)
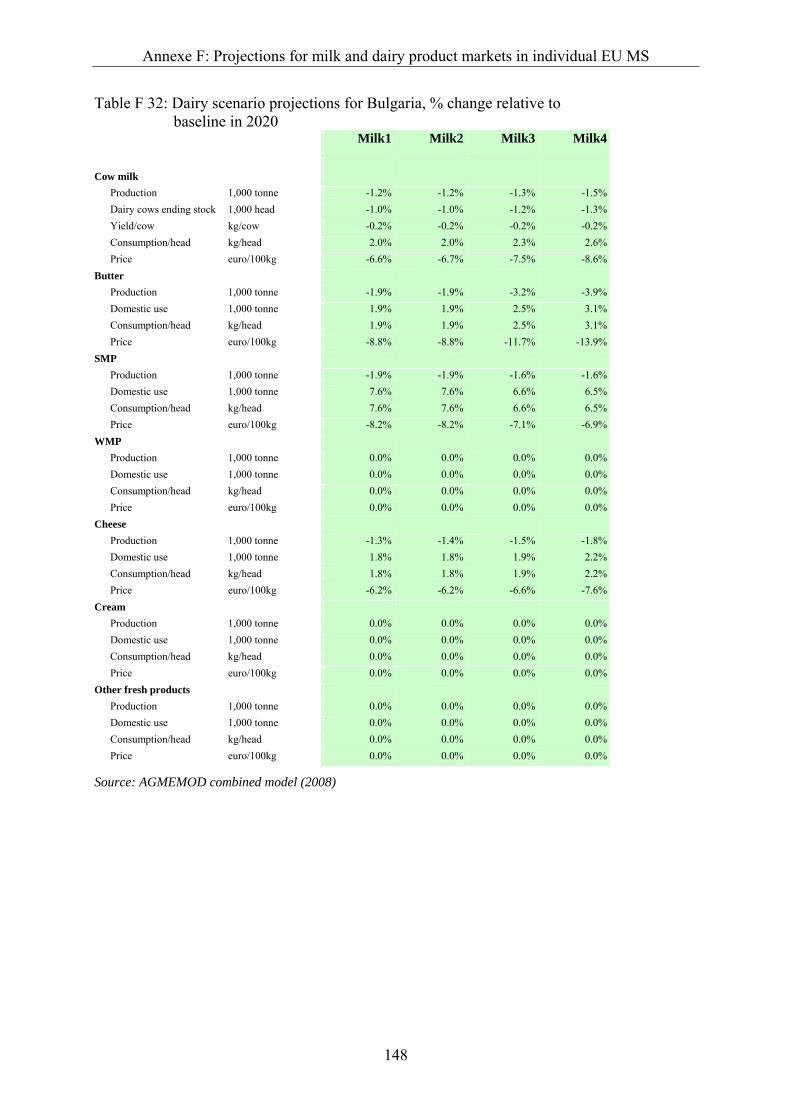
Annexe F: Projections for milk and dairy product markets in individual EU MS
148
Table F 32: Dairy scenario projections for Bulgaria, % change relative to baseline in 2020
Milk1 Milk2 Milk3 Milk4
Cow milk Production 1,000 tonne -1.2% -1.2% -1.3% -1.5% Dairy cows ending stock 1,000 head -1.0% -1.0% -1.2% -1.3% Yield/cow kg/cow -0.2% -0.2% -0.2% -0.2% Consumption/head kg/head 2.0% 2.0% 2.3% 2.6% Price euro/100kg -6.6% -6.7% -7.5% -8.6% Butter Production 1,000 tonne -1.9% -1.9% -3.2% -3.9% Domestic use 1,000 tonne 1.9% 1.9% 2.5% 3.1% Consumption/head kg/head 1.9% 1.9% 2.5% 3.1% Price euro/100kg -8.8% -8.8% -11.7% -13.9% SMP Production 1,000 tonne -1.9% -1.9% -1.6% -1.6% Domestic use 1,000 tonne 7.6% 7.6% 6.6% 6.5% Consumption/head kg/head 7.6% 7.6% 6.6% 6.5% Price euro/100kg -8.2% -8.2% -7.1% -6.9% WMP Production 1,000 tonne 0.0% 0.0% 0.0% 0.0% Domestic use 1,000 tonne 0.0% 0.0% 0.0% 0.0% Consumption/head kg/head 0.0% 0.0% 0.0% 0.0% Price euro/100kg 0.0% 0.0% 0.0% 0.0% Cheese Production 1,000 tonne -1.3% -1.4% -1.5% -1.8% Domestic use 1,000 tonne 1.8% 1.8% 1.9% 2.2% Consumption/head kg/head 1.8% 1.8% 1.9% 2.2% Price euro/100kg -6.2% -6.2% -6.6% -7.6% Cream Production 1,000 tonne 0.0% 0.0% 0.0% 0.0% Domestic use 1,000 tonne 0.0% 0.0% 0.0% 0.0% Consumption/head kg/head 0.0% 0.0% 0.0% 0.0% Price euro/100kg 0.0% 0.0% 0.0% 0.0% Other fresh products Production 1,000 tonne 0.0% 0.0% 0.0% 0.0% Domestic use 1,000 tonne 0.0% 0.0% 0.0% 0.0% Consumption/head kg/head 0.0% 0.0% 0.0% 0.0% Price euro/100kg 0.0% 0.0% 0.0% 0.0%
Source: AGMEMOD combined model (2008)
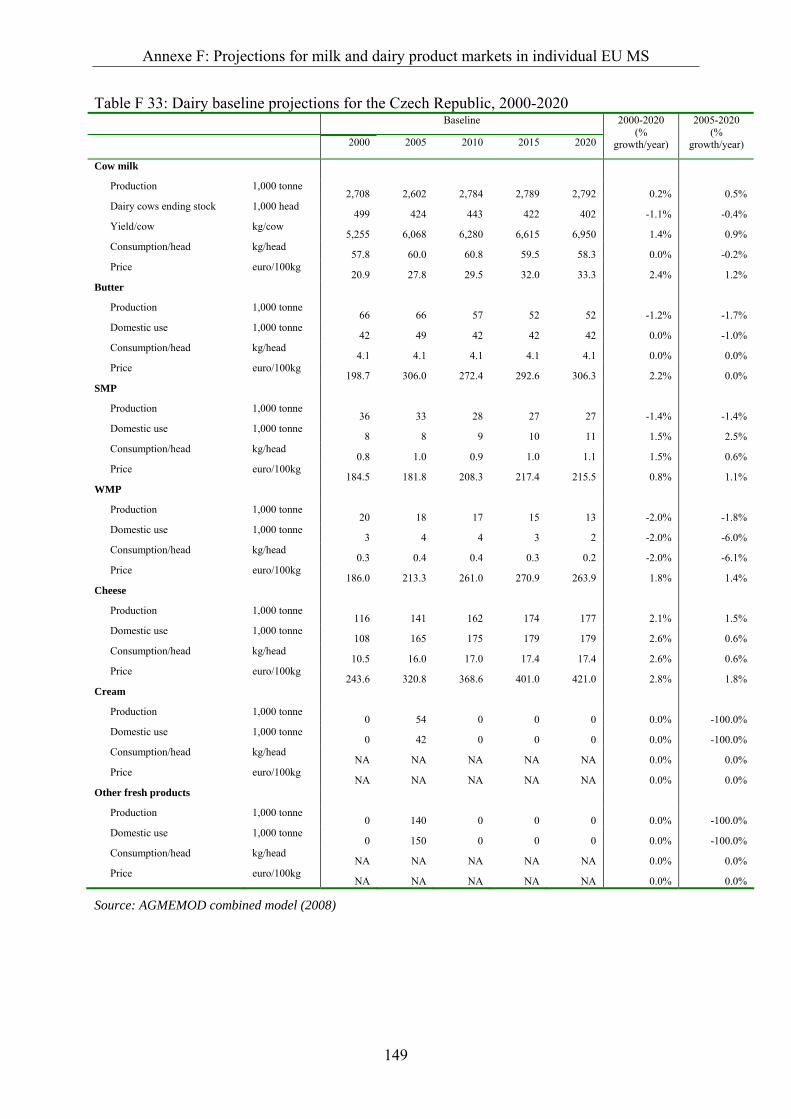
Annexe F: Projections for milk and dairy product markets in individual EU MS
149
Table F 33: Dairy baseline projections for the Czech Republic, 2000-2020 Baseline
2000 2005 2010 2015 2020
2000-2020 (%
growth/year)
2005-2020 (%
growth/year)
Cow milk
Production 1,000 tonne 2,708 2,602 2,784 2,789 2,792 0.2% 0.5%
Dairy cows ending stock 1,000 head 499 424 443 422 402 -1.1% -0.4%
Yield/cow kg/cow 5,255 6,068 6,280 6,615 6,950 1.4% 0.9%
Consumption/head kg/head 57.8 60.0 60.8 59.5 58.3 0.0% -0.2%
Price euro/100kg 20.9 27.8 29.5 32.0 33.3 2.4% 1.2%
Butter
Production 1,000 tonne 66 66 57 52 52 -1.2% -1.7%
Domestic use 1,000 tonne 42 49 42 42 42 0.0% -1.0%
Consumption/head kg/head 4.1 4.1 4.1 4.1 4.1 0.0% 0.0%
Price euro/100kg 198.7 306.0 272.4 292.6 306.3 2.2% 0.0%
SMP
Production 1,000 tonne 36 33 28 27 27 -1.4% -1.4%
Domestic use 1,000 tonne 8 8 9 10 11 1.5% 2.5%
Consumption/head kg/head 0.8 1.0 0.9 1.0 1.1 1.5% 0.6%
Price euro/100kg 184.5 181.8 208.3 217.4 215.5 0.8% 1.1%
WMP
Production 1,000 tonne 20 18 17 15 13 -2.0% -1.8%
Domestic use 1,000 tonne 3 4 4 3 2 -2.0% -6.0%
Consumption/head kg/head 0.3 0.4 0.4 0.3 0.2 -2.0% -6.1%
Price euro/100kg 186.0 213.3 261.0 270.9 263.9 1.8% 1.4%
Cheese
Production 1,000 tonne 116 141 162 174 177 2.1% 1.5%
Domestic use 1,000 tonne 108 165 175 179 179 2.6% 0.6%
Consumption/head kg/head 10.5 16.0 17.0 17.4 17.4 2.6% 0.6%
Price euro/100kg 243.6 320.8 368.6 401.0 421.0 2.8% 1.8%
Cream
Production 1,000 tonne 0 54 0 0 0 0.0% -100.0%
Domestic use 1,000 tonne 0 42 0 0 0 0.0% -100.0%
Consumption/head kg/head NA NA NA NA NA 0.0% 0.0%
Price euro/100kg NA NA NA NA NA 0.0% 0.0%
Other fresh products
Production 1,000 tonne 0 140 0 0 0 0.0% -100.0%
Domestic use 1,000 tonne 0 150 0 0 0 0.0% -100.0%
Consumption/head kg/head NA NA NA NA NA 0.0% 0.0%
Price euro/100kg NA NA NA NA NA 0.0% 0.0%
Source: AGMEMOD combined model (2008)
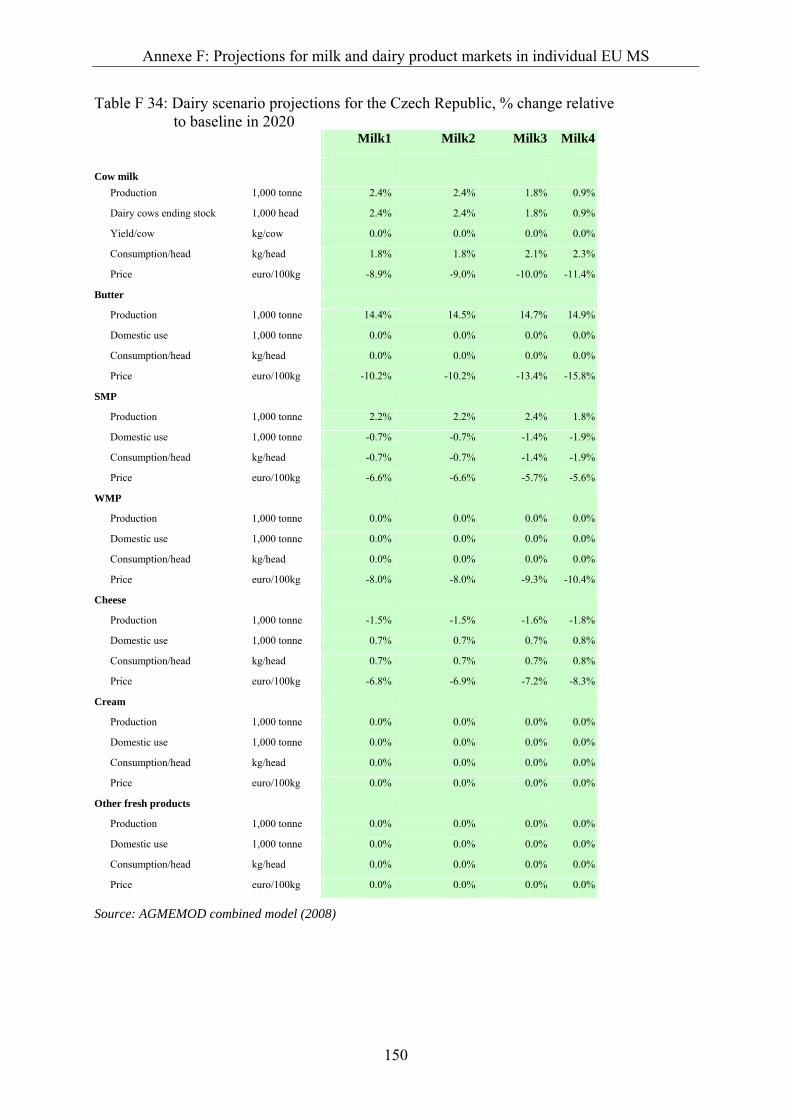
Annexe F: Projections for milk and dairy product markets in individual EU MS
150
Table F 34: Dairy scenario projections for the Czech Republic, % change relative to baseline in 2020
Milk1 Milk2 Milk3 Milk4
Cow milk Production 1,000 tonne 2.4% 2.4% 1.8% 0.9%
Dairy cows ending stock 1,000 head 2.4% 2.4% 1.8% 0.9%
Yield/cow kg/cow 0.0% 0.0% 0.0% 0.0%
Consumption/head kg/head 1.8% 1.8% 2.1% 2.3%
Price euro/100kg -8.9% -9.0% -10.0% -11.4%
Butter
Production 1,000 tonne 14.4% 14.5% 14.7% 14.9%
Domestic use 1,000 tonne 0.0% 0.0% 0.0% 0.0%
Consumption/head kg/head 0.0% 0.0% 0.0% 0.0%
Price euro/100kg -10.2% -10.2% -13.4% -15.8%
SMP
Production 1,000 tonne 2.2% 2.2% 2.4% 1.8%
Domestic use 1,000 tonne -0.7% -0.7% -1.4% -1.9%
Consumption/head kg/head -0.7% -0.7% -1.4% -1.9%
Price euro/100kg -6.6% -6.6% -5.7% -5.6%
WMP
Production 1,000 tonne 0.0% 0.0% 0.0% 0.0%
Domestic use 1,000 tonne 0.0% 0.0% 0.0% 0.0%
Consumption/head kg/head 0.0% 0.0% 0.0% 0.0%
Price euro/100kg -8.0% -8.0% -9.3% -10.4%
Cheese
Production 1,000 tonne -1.5% -1.5% -1.6% -1.8%
Domestic use 1,000 tonne 0.7% 0.7% 0.7% 0.8%
Consumption/head kg/head 0.7% 0.7% 0.7% 0.8%
Price euro/100kg -6.8% -6.9% -7.2% -8.3%
Cream
Production 1,000 tonne 0.0% 0.0% 0.0% 0.0%
Domestic use 1,000 tonne 0.0% 0.0% 0.0% 0.0%
Consumption/head kg/head 0.0% 0.0% 0.0% 0.0%
Price euro/100kg 0.0% 0.0% 0.0% 0.0%
Other fresh products
Production 1,000 tonne 0.0% 0.0% 0.0% 0.0%
Domestic use 1,000 tonne 0.0% 0.0% 0.0% 0.0%
Consumption/head kg/head 0.0% 0.0% 0.0% 0.0%
Price euro/100kg 0.0% 0.0% 0.0% 0.0%
Source: AGMEMOD combined model (2008)
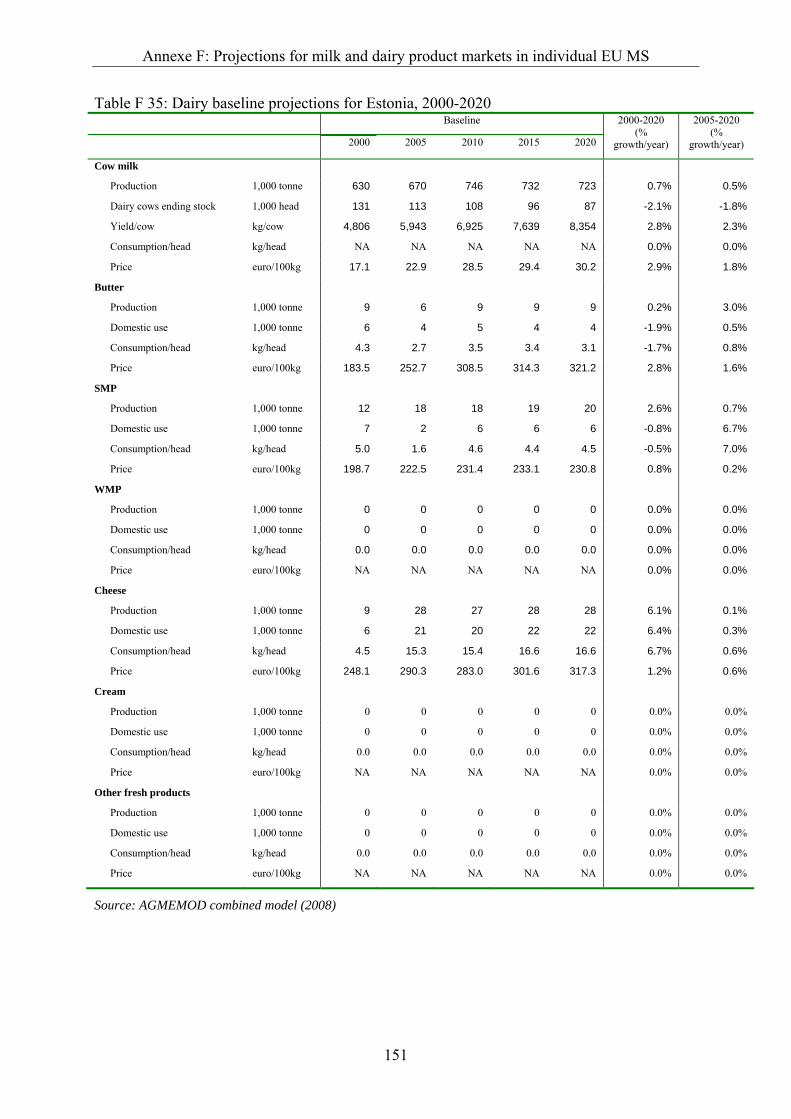
Annexe F: Projections for milk and dairy product markets in individual EU MS
151
Table F 35: Dairy baseline projections for Estonia, 2000-2020 Baseline
2000 2005 2010 2015 2020
2000-2020 (%
growth/year)
2005-2020 (%
growth/year)
Cow milk
Production 1,000 tonne 630 670 746 732 723 0.7% 0.5%
Dairy cows ending stock 1,000 head 131 113 108 96 87 -2.1% -1.8%
Yield/cow kg/cow 4,806 5,943 6,925 7,639 8,354 2.8% 2.3%
Consumption/head kg/head NA NA NA NA NA 0.0% 0.0%
Price euro/100kg 17.1 22.9 28.5 29.4 30.2 2.9% 1.8%
Butter
Production 1,000 tonne 9 6 9 9 9 0.2% 3.0%
Domestic use 1,000 tonne 6 4 5 4 4 -1.9% 0.5%
Consumption/head kg/head 4.3 2.7 3.5 3.4 3.1 -1.7% 0.8%
Price euro/100kg 183.5 252.7 308.5 314.3 321.2 2.8% 1.6%
SMP
Production 1,000 tonne 12 18 18 19 20 2.6% 0.7%
Domestic use 1,000 tonne 7 2 6 6 6 -0.8% 6.7%
Consumption/head kg/head 5.0 1.6 4.6 4.4 4.5 -0.5% 7.0%
Price euro/100kg 198.7 222.5 231.4 233.1 230.8 0.8% 0.2%
WMP
Production 1,000 tonne 0 0 0 0 0 0.0% 0.0%
Domestic use 1,000 tonne 0 0 0 0 0 0.0% 0.0%
Consumption/head kg/head 0.0 0.0 0.0 0.0 0.0 0.0% 0.0%
Price euro/100kg NA NA NA NA NA 0.0% 0.0%
Cheese
Production 1,000 tonne 9 28 27 28 28 6.1% 0.1%
Domestic use 1,000 tonne 6 21 20 22 22 6.4% 0.3%
Consumption/head kg/head 4.5 15.3 15.4 16.6 16.6 6.7% 0.6%
Price euro/100kg 248.1 290.3 283.0 301.6 317.3 1.2% 0.6%
Cream
Production 1,000 tonne 0 0 0 0 0 0.0% 0.0%
Domestic use 1,000 tonne 0 0 0 0 0 0.0% 0.0%
Consumption/head kg/head 0.0 0.0 0.0 0.0 0.0 0.0% 0.0%
Price euro/100kg NA NA NA NA NA 0.0% 0.0%
Other fresh products
Production 1,000 tonne 0 0 0 0 0 0.0% 0.0%
Domestic use 1,000 tonne 0 0 0 0 0 0.0% 0.0%
Consumption/head kg/head 0.0 0.0 0.0 0.0 0.0 0.0% 0.0%
Price euro/100kg NA NA NA NA NA 0.0% 0.0%
Source: AGMEMOD combined model (2008)

Annexe F: Projections for milk and dairy product markets in individual EU MS
152
Table F 36: Dairy scenario projections for Estonia, % change relative to baseline in 2020
Milk1 Milk2 Milk3 Milk4
Cow milk
Production 1,000 tonne 0.9% 0.9% 0.5% 0.1%
Dairy cows ending stock 1,000 head 0.9% 0.9% 0.5% 0.1%
Yield/cow kg/cow -0.1% -0.1% -0.1% -0.1%
Consumption/head kg/head 0.8% 0.8% 0.9% 1.1%
Price euro/100kg -4.2% -4.2% -4.9% -5.7%
Butter
Production 1,000 tonne 1.6% 1.6% 1.3% 1.3%
Domestic use 1,000 tonne 2.2% 2.2% 3.4% 4.3%
Consumption/head kg/head 2.2% 2.2% 3.4% 4.3%
Price euro/100kg -2.8% -2.8% -4.2% -5.3%
SMP
Production 1,000 tonne -4.2% -4.2% -3.7% -3.6%
Domestic use 1,000 tonne -1.7% -1.7% -1.5% -1.5%
Consumption/head kg/head -1.7% -1.7% -1.5% -1.5%
Price euro/100kg -5.4% -5.4% -4.8% -4.6%
WMP
Production 1,000 tonne 0.0% 0.0% 0.0% 0.0%
Domestic use 1,000 tonne 0.0% 0.0% 0.0% 0.0%
Consumption/head kg/head 0.0% 0.0% 0.0% 0.0%
Price euro/100kg 0.0% 0.0% 0.0% 0.0%
Cheese
Production 1,000 tonne -0.3% -0.3% -0.3% -0.3%
Domestic use 1,000 tonne 2.3% 2.3% 2.4% 2.7%
Consumption/head kg/head 2.3% 2.3% 2.4% 2.7%
Price euro/100kg -8.8% -8.8% -9.2% -10.3%
Cream
Production 1,000 tonne 0.0% 0.0% 0.0% 0.0%
Domestic use 1,000 tonne 0.0% 0.0% 0.0% 0.0%
Consumption/head kg/head 0.0% 0.0% 0.0% 0.0%
Price euro/100kg 0.0% 0.0% 0.0% 0.0%
Other fresh products
Production 1,000 tonne 0.0% 0.0% 0.0% 0.0%
Domestic use 1,000 tonne 0.0% 0.0% 0.0% 0.0%
Consumption/head kg/head 0.0% 0.0% 0.0% 0.0%
Price euro/100kg 0.0% 0.0% 0.0% 0.0%
Source: AGMEMOD combined model (2008)
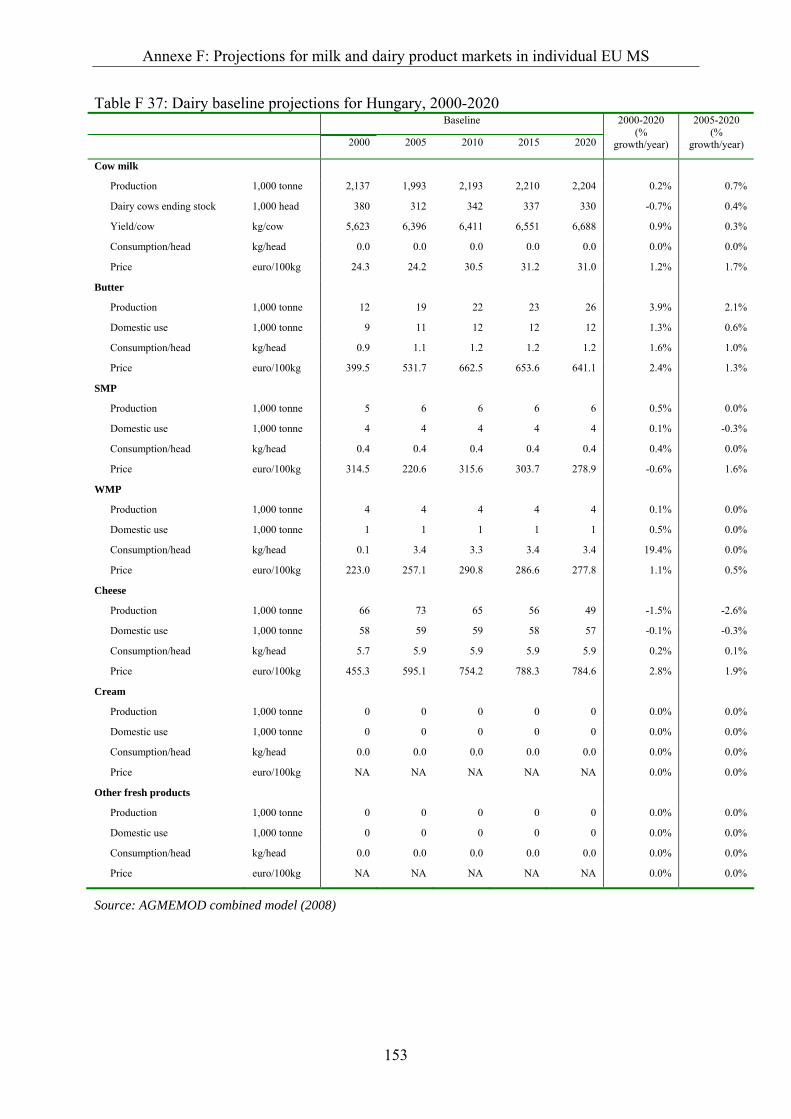
Annexe F: Projections for milk and dairy product markets in individual EU MS
153
Table F 37: Dairy baseline projections for Hungary, 2000-2020 Baseline
2000 2005 2010 2015 2020
2000-2020 (%
growth/year)
2005-2020 (%
growth/year)
Cow milk
Production 1,000 tonne 2,137 1,993 2,193 2,210 2,204 0.2% 0.7%
Dairy cows ending stock 1,000 head 380 312 342 337 330 -0.7% 0.4%
Yield/cow kg/cow 5,623 6,396 6,411 6,551 6,688 0.9% 0.3%
Consumption/head kg/head 0.0 0.0 0.0 0.0 0.0 0.0% 0.0%
Price euro/100kg 24.3 24.2 30.5 31.2 31.0 1.2% 1.7%
Butter
Production 1,000 tonne 12 19 22 23 26 3.9% 2.1%
Domestic use 1,000 tonne 9 11 12 12 12 1.3% 0.6%
Consumption/head kg/head 0.9 1.1 1.2 1.2 1.2 1.6% 1.0%
Price euro/100kg 399.5 531.7 662.5 653.6 641.1 2.4% 1.3%
SMP
Production 1,000 tonne 5 6 6 6 6 0.5% 0.0%
Domestic use 1,000 tonne 4 4 4 4 4 0.1% -0.3%
Consumption/head kg/head 0.4 0.4 0.4 0.4 0.4 0.4% 0.0%
Price euro/100kg 314.5 220.6 315.6 303.7 278.9 -0.6% 1.6%
WMP
Production 1,000 tonne 4 4 4 4 4 0.1% 0.0%
Domestic use 1,000 tonne 1 1 1 1 1 0.5% 0.0%
Consumption/head kg/head 0.1 3.4 3.3 3.4 3.4 19.4% 0.0%
Price euro/100kg 223.0 257.1 290.8 286.6 277.8 1.1% 0.5%
Cheese
Production 1,000 tonne 66 73 65 56 49 -1.5% -2.6%
Domestic use 1,000 tonne 58 59 59 58 57 -0.1% -0.3%
Consumption/head kg/head 5.7 5.9 5.9 5.9 5.9 0.2% 0.1%
Price euro/100kg 455.3 595.1 754.2 788.3 784.6 2.8% 1.9%
Cream
Production 1,000 tonne 0 0 0 0 0 0.0% 0.0%
Domestic use 1,000 tonne 0 0 0 0 0 0.0% 0.0%
Consumption/head kg/head 0.0 0.0 0.0 0.0 0.0 0.0% 0.0%
Price euro/100kg NA NA NA NA NA 0.0% 0.0%
Other fresh products
Production 1,000 tonne 0 0 0 0 0 0.0% 0.0%
Domestic use 1,000 tonne 0 0 0 0 0 0.0% 0.0%
Consumption/head kg/head 0.0 0.0 0.0 0.0 0.0 0.0% 0.0%
Price euro/100kg NA NA NA NA NA 0.0% 0.0%
Source: AGMEMOD combined model (2008)
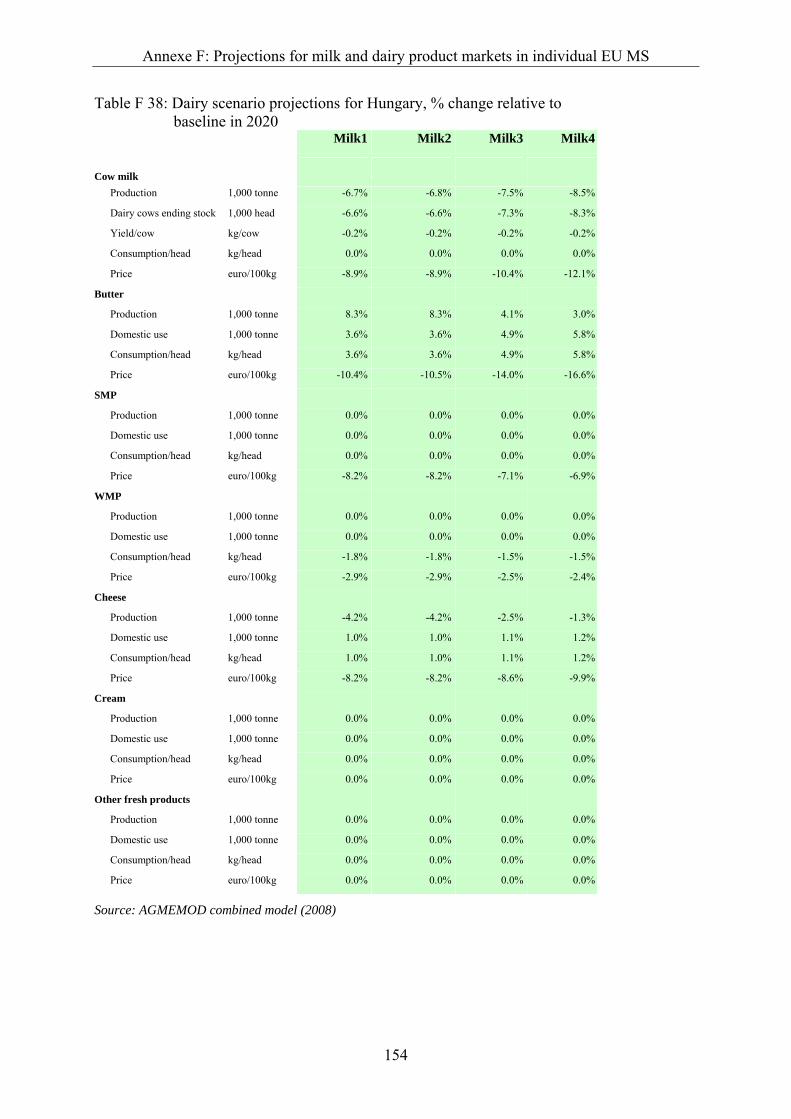
Annexe F: Projections for milk and dairy product markets in individual EU MS
154
Table F 38: Dairy scenario projections for Hungary, % change relative to baseline in 2020
Milk1 Milk2 Milk3 Milk4
Cow milk Production 1,000 tonne -6.7% -6.8% -7.5% -8.5%
Dairy cows ending stock 1,000 head -6.6% -6.6% -7.3% -8.3%
Yield/cow kg/cow -0.2% -0.2% -0.2% -0.2%
Consumption/head kg/head 0.0% 0.0% 0.0% 0.0%
Price euro/100kg -8.9% -8.9% -10.4% -12.1%
Butter
Production 1,000 tonne 8.3% 8.3% 4.1% 3.0%
Domestic use 1,000 tonne 3.6% 3.6% 4.9% 5.8%
Consumption/head kg/head 3.6% 3.6% 4.9% 5.8%
Price euro/100kg -10.4% -10.5% -14.0% -16.6%
SMP
Production 1,000 tonne 0.0% 0.0% 0.0% 0.0%
Domestic use 1,000 tonne 0.0% 0.0% 0.0% 0.0%
Consumption/head kg/head 0.0% 0.0% 0.0% 0.0%
Price euro/100kg -8.2% -8.2% -7.1% -6.9%
WMP
Production 1,000 tonne 0.0% 0.0% 0.0% 0.0%
Domestic use 1,000 tonne 0.0% 0.0% 0.0% 0.0%
Consumption/head kg/head -1.8% -1.8% -1.5% -1.5%
Price euro/100kg -2.9% -2.9% -2.5% -2.4%
Cheese
Production 1,000 tonne -4.2% -4.2% -2.5% -1.3%
Domestic use 1,000 tonne 1.0% 1.0% 1.1% 1.2%
Consumption/head kg/head 1.0% 1.0% 1.1% 1.2%
Price euro/100kg -8.2% -8.2% -8.6% -9.9%
Cream
Production 1,000 tonne 0.0% 0.0% 0.0% 0.0%
Domestic use 1,000 tonne 0.0% 0.0% 0.0% 0.0%
Consumption/head kg/head 0.0% 0.0% 0.0% 0.0%
Price euro/100kg 0.0% 0.0% 0.0% 0.0%
Other fresh products
Production 1,000 tonne 0.0% 0.0% 0.0% 0.0%
Domestic use 1,000 tonne 0.0% 0.0% 0.0% 0.0%
Consumption/head kg/head 0.0% 0.0% 0.0% 0.0%
Price euro/100kg 0.0% 0.0% 0.0% 0.0%
Source: AGMEMOD combined model (2008)
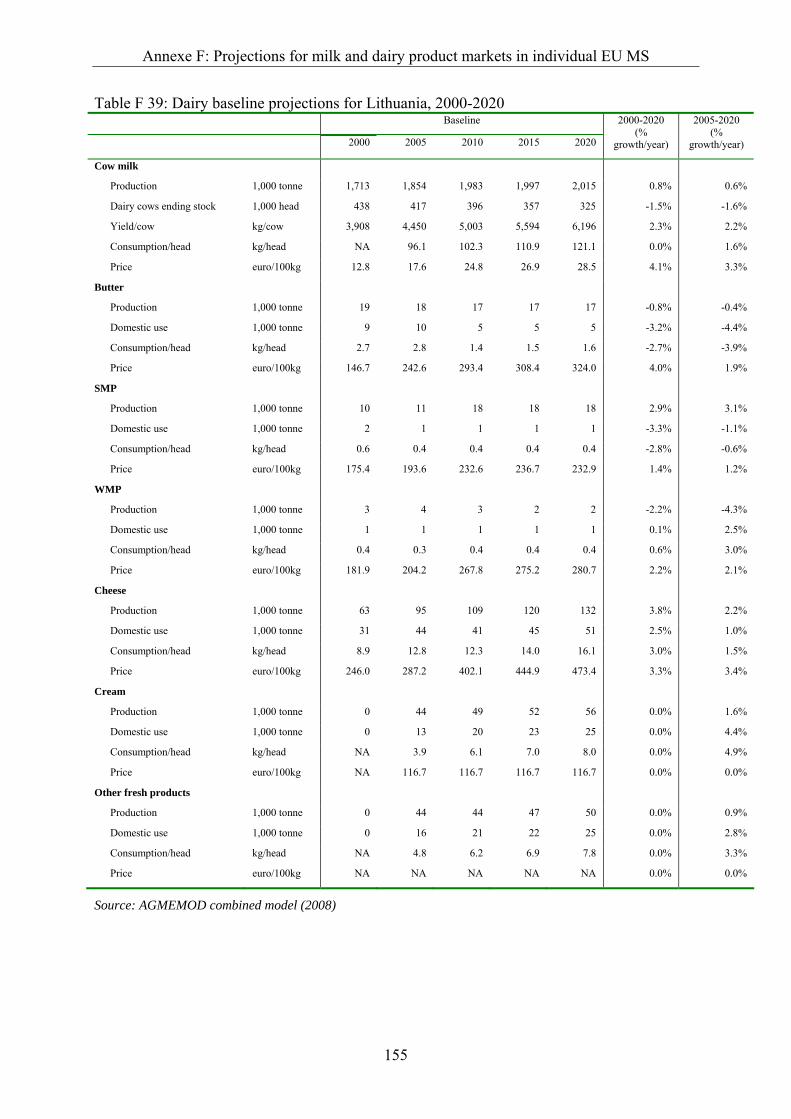
Annexe F: Projections for milk and dairy product markets in individual EU MS
155
Table F 39: Dairy baseline projections for Lithuania, 2000-2020 Baseline
2000 2005 2010 2015 2020
2000-2020 (%
growth/year)
2005-2020 (%
growth/year)
Cow milk
Production 1,000 tonne 1,713 1,854 1,983 1,997 2,015 0.8% 0.6%
Dairy cows ending stock 1,000 head 438 417 396 357 325 -1.5% -1.6%
Yield/cow kg/cow 3,908 4,450 5,003 5,594 6,196 2.3% 2.2%
Consumption/head kg/head NA 96.1 102.3 110.9 121.1 0.0% 1.6%
Price euro/100kg 12.8 17.6 24.8 26.9 28.5 4.1% 3.3%
Butter
Production 1,000 tonne 19 18 17 17 17 -0.8% -0.4%
Domestic use 1,000 tonne 9 10 5 5 5 -3.2% -4.4%
Consumption/head kg/head 2.7 2.8 1.4 1.5 1.6 -2.7% -3.9%
Price euro/100kg 146.7 242.6 293.4 308.4 324.0 4.0% 1.9%
SMP
Production 1,000 tonne 10 11 18 18 18 2.9% 3.1%
Domestic use 1,000 tonne 2 1 1 1 1 -3.3% -1.1%
Consumption/head kg/head 0.6 0.4 0.4 0.4 0.4 -2.8% -0.6%
Price euro/100kg 175.4 193.6 232.6 236.7 232.9 1.4% 1.2%
WMP
Production 1,000 tonne 3 4 3 2 2 -2.2% -4.3%
Domestic use 1,000 tonne 1 1 1 1 1 0.1% 2.5%
Consumption/head kg/head 0.4 0.3 0.4 0.4 0.4 0.6% 3.0%
Price euro/100kg 181.9 204.2 267.8 275.2 280.7 2.2% 2.1%
Cheese
Production 1,000 tonne 63 95 109 120 132 3.8% 2.2%
Domestic use 1,000 tonne 31 44 41 45 51 2.5% 1.0%
Consumption/head kg/head 8.9 12.8 12.3 14.0 16.1 3.0% 1.5%
Price euro/100kg 246.0 287.2 402.1 444.9 473.4 3.3% 3.4%
Cream
Production 1,000 tonne 0 44 49 52 56 0.0% 1.6%
Domestic use 1,000 tonne 0 13 20 23 25 0.0% 4.4%
Consumption/head kg/head NA 3.9 6.1 7.0 8.0 0.0% 4.9%
Price euro/100kg NA 116.7 116.7 116.7 116.7 0.0% 0.0%
Other fresh products
Production 1,000 tonne 0 44 44 47 50 0.0% 0.9%
Domestic use 1,000 tonne 0 16 21 22 25 0.0% 2.8%
Consumption/head kg/head NA 4.8 6.2 6.9 7.8 0.0% 3.3%
Price euro/100kg NA NA NA NA NA 0.0% 0.0%
Source: AGMEMOD combined model (2008)

Annexe F: Projections for milk and dairy product markets in individual EU MS
156
Table F 40: Dairy scenario projections for Lithuania, % change relative to baseline in 2020
Milk1 Milk2 Milk3 Milk4
Cow milk Production 1,000 tonne 9.1% 9.1% 7.5% 6.0%
Dairy cows ending stock 1,000 head 11.0% 11.0% 9.9% 8.7%
Yield/cow kg/cow -1.8% -1.8% -2.1% -2.5%
Consumption/head kg/head 2.2% 2.3% 2.7% 3.2%
Price euro/100kg -10.4% -10.4% -12.7% -14.9%
Butter
Production 1,000 tonne 2.8% 2.8% 1.7% 0.9%
Domestic use 1,000 tonne 4.7% 4.7% 6.3% 7.4%
Consumption/head kg/head 4.7% 4.7% 6.3% 7.4%
Price euro/100kg -10.5% -10.5% -14.0% -16.6%
SMP
Production 1,000 tonne 4.0% 4.0% 3.3% 2.7%
Domestic use 1,000 tonne 1.3% 1.3% 1.1% 1.1%
Consumption/head kg/head 1.3% 1.3% 1.1% 1.1%
Price euro/100kg -8.2% -8.2% -7.1% -6.9%
WMP
Production 1,000 tonne 0.4% 0.4% 0.2% 0.1%
Domestic use 1,000 tonne 0.8% 0.8% 0.9% 1.0%
Consumption/head kg/head 0.8% 0.8% 0.9% 1.0%
Price euro/100kg -8.8% -8.8% -10.2% -11.5%
Cheese
Production 1,000 tonne 1.3% 1.3% 1.0% 0.4%
Domestic use 1,000 tonne 4.0% 4.0% 4.2% 4.9%
Consumption/head kg/head 4.0% 4.0% 4.2% 4.9%
Price euro/100kg -8.7% -8.7% -9.1% -10.5%
Cream
Production 1,000 tonne 1.1% 1.1% 0.4% -0.3%
Domestic use 1,000 tonne 2.8% 2.9% 3.8% 4.5%
Consumption/head kg/head 2.8% 2.9% 3.8% 4.5%
Price euro/100kg 0.0% 0.0% 0.0% 0.0%
Other fresh products
Production 1,000 tonne 7.6% 7.6% 4.9% 2.5%
Domestic use 1,000 tonne 3.0% 3.0% 3.6% 4.2%
Consumption/head kg/head 3.0% 3.0% 3.6% 4.2%
Price euro/100kg 0.0% 0.0% 0.0% 0.0%
Source: AGMEMOD combined model (2008)
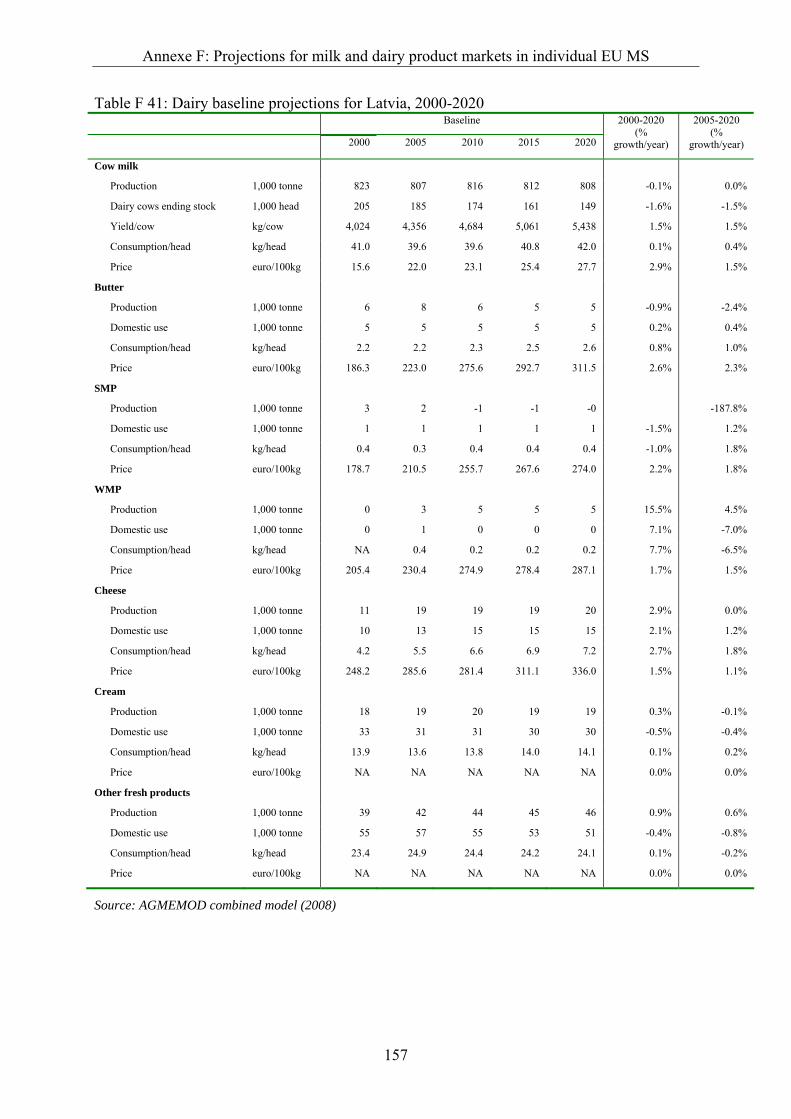
Annexe F: Projections for milk and dairy product markets in individual EU MS
157
Table F 41: Dairy baseline projections for Latvia, 2000-2020 Baseline
2000 2005 2010 2015 2020
2000-2020 (%
growth/year)
2005-2020 (%
growth/year)
Cow milk
Production 1,000 tonne 823 807 816 812 808 -0.1% 0.0%
Dairy cows ending stock 1,000 head 205 185 174 161 149 -1.6% -1.5%
Yield/cow kg/cow 4,024 4,356 4,684 5,061 5,438 1.5% 1.5%
Consumption/head kg/head 41.0 39.6 39.6 40.8 42.0 0.1% 0.4%
Price euro/100kg 15.6 22.0 23.1 25.4 27.7 2.9% 1.5%
Butter
Production 1,000 tonne 6 8 6 5 5 -0.9% -2.4%
Domestic use 1,000 tonne 5 5 5 5 5 0.2% 0.4%
Consumption/head kg/head 2.2 2.2 2.3 2.5 2.6 0.8% 1.0%
Price euro/100kg 186.3 223.0 275.6 292.7 311.5 2.6% 2.3%
SMP
Production 1,000 tonne 3 2 -1 -1 -0 -187.8%
Domestic use 1,000 tonne 1 1 1 1 1 -1.5% 1.2%
Consumption/head kg/head 0.4 0.3 0.4 0.4 0.4 -1.0% 1.8%
Price euro/100kg 178.7 210.5 255.7 267.6 274.0 2.2% 1.8%
WMP
Production 1,000 tonne 0 3 5 5 5 15.5% 4.5%
Domestic use 1,000 tonne 0 1 0 0 0 7.1% -7.0%
Consumption/head kg/head NA 0.4 0.2 0.2 0.2 7.7% -6.5%
Price euro/100kg 205.4 230.4 274.9 278.4 287.1 1.7% 1.5%
Cheese
Production 1,000 tonne 11 19 19 19 20 2.9% 0.0%
Domestic use 1,000 tonne 10 13 15 15 15 2.1% 1.2%
Consumption/head kg/head 4.2 5.5 6.6 6.9 7.2 2.7% 1.8%
Price euro/100kg 248.2 285.6 281.4 311.1 336.0 1.5% 1.1%
Cream
Production 1,000 tonne 18 19 20 19 19 0.3% -0.1%
Domestic use 1,000 tonne 33 31 31 30 30 -0.5% -0.4%
Consumption/head kg/head 13.9 13.6 13.8 14.0 14.1 0.1% 0.2%
Price euro/100kg NA NA NA NA NA 0.0% 0.0%
Other fresh products
Production 1,000 tonne 39 42 44 45 46 0.9% 0.6%
Domestic use 1,000 tonne 55 57 55 53 51 -0.4% -0.8%
Consumption/head kg/head 23.4 24.9 24.4 24.2 24.1 0.1% -0.2%
Price euro/100kg NA NA NA NA NA 0.0% 0.0%
Source: AGMEMOD combined model (2008)
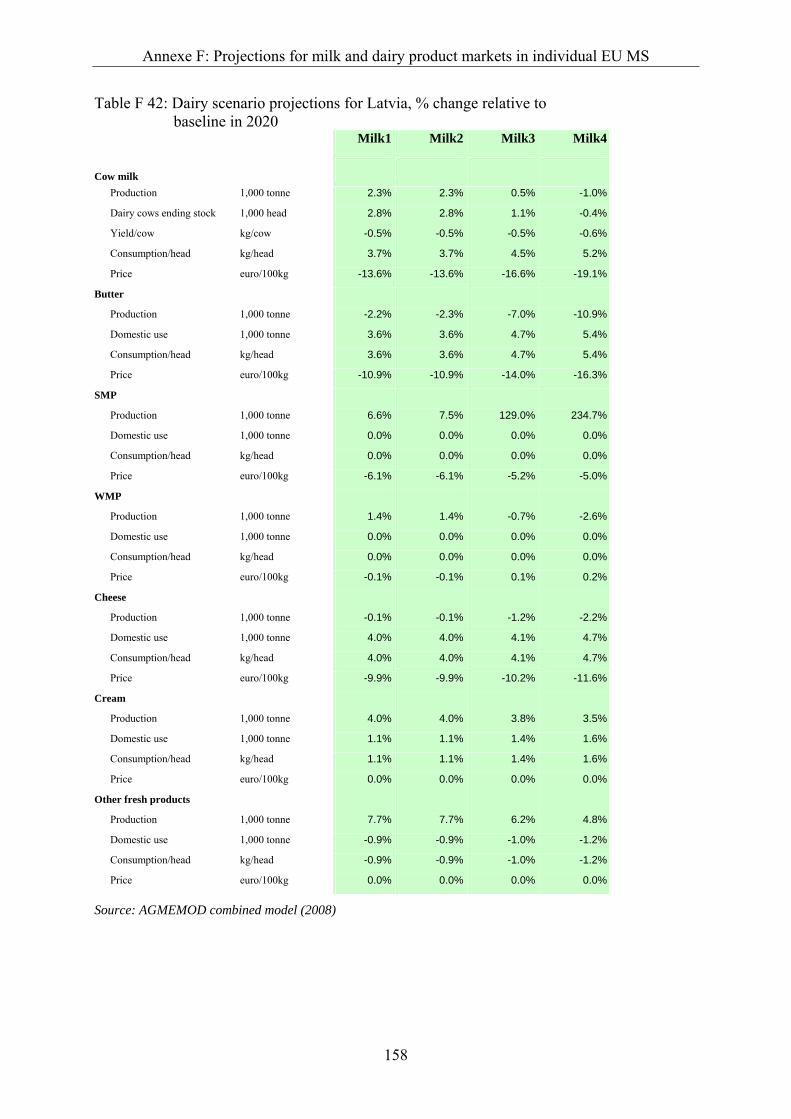
Annexe F: Projections for milk and dairy product markets in individual EU MS
158
Table F 42: Dairy scenario projections for Latvia, % change relative to baseline in 2020
Milk1 Milk2 Milk3 Milk4
Cow milk Production 1,000 tonne 2.3% 2.3% 0.5% -1.0%
Dairy cows ending stock 1,000 head 2.8% 2.8% 1.1% -0.4%
Yield/cow kg/cow -0.5% -0.5% -0.5% -0.6%
Consumption/head kg/head 3.7% 3.7% 4.5% 5.2%
Price euro/100kg -13.6% -13.6% -16.6% -19.1%
Butter
Production 1,000 tonne -2.2% -2.3% -7.0% -10.9%
Domestic use 1,000 tonne 3.6% 3.6% 4.7% 5.4%
Consumption/head kg/head 3.6% 3.6% 4.7% 5.4%
Price euro/100kg -10.9% -10.9% -14.0% -16.3%
SMP
Production 1,000 tonne 6.6% 7.5% 129.0% 234.7%
Domestic use 1,000 tonne 0.0% 0.0% 0.0% 0.0%
Consumption/head kg/head 0.0% 0.0% 0.0% 0.0%
Price euro/100kg -6.1% -6.1% -5.2% -5.0%
WMP
Production 1,000 tonne 1.4% 1.4% -0.7% -2.6%
Domestic use 1,000 tonne 0.0% 0.0% 0.0% 0.0%
Consumption/head kg/head 0.0% 0.0% 0.0% 0.0%
Price euro/100kg -0.1% -0.1% 0.1% 0.2%
Cheese
Production 1,000 tonne -0.1% -0.1% -1.2% -2.2%
Domestic use 1,000 tonne 4.0% 4.0% 4.1% 4.7%
Consumption/head kg/head 4.0% 4.0% 4.1% 4.7%
Price euro/100kg -9.9% -9.9% -10.2% -11.6%
Cream
Production 1,000 tonne 4.0% 4.0% 3.8% 3.5%
Domestic use 1,000 tonne 1.1% 1.1% 1.4% 1.6%
Consumption/head kg/head 1.1% 1.1% 1.4% 1.6%
Price euro/100kg 0.0% 0.0% 0.0% 0.0%
Other fresh products
Production 1,000 tonne 7.7% 7.7% 6.2% 4.8%
Domestic use 1,000 tonne -0.9% -0.9% -1.0% -1.2%
Consumption/head kg/head -0.9% -0.9% -1.0% -1.2%
Price euro/100kg 0.0% 0.0% 0.0% 0.0%
Source: AGMEMOD combined model (2008)

Annexe F: Projections for milk and dairy product markets in individual EU MS
159
Table F 43: Dairy baseline projections for Poland, 2000-2020 Baseline
2000 2005 2010 2015 2020
2000-2020 (%
growth/year)
2005-2020 (%
growth/year)
Cow milk
Production 1,000 tonne 11,889 11,923 11,819 11,403 11,046 -0.4% -0.5%
Dairy cows ending stock 1,000 head 2,982 2,755 2,446 2,158 1,925 -2.2% -2.4%
Yield/cow kg/cow 3,986 4,328 4,832 5,283 5,738 1.8% 1.9%
Consumption/head kg/head 36.9 56.1 57.4 60.6 63.6 2.8% 0.8%
Price euro/100kg 19.5 23.1 26.0 27.6 28.8 2.0% 1.5%
Butter
Production 1,000 tonne 139 180 185 183 184 1.4% 0.2%
Domestic use 1,000 tonne 133 150 155 167 175 1.4% 1.0%
Consumption/head kg/head 3.5 3.9 4.1 4.4 4.7 1.5% 1.2%
Price euro/100kg 264.9 271.1 278.1 293.7 310.5 0.8% 0.9%
SMP
Production 1,000 tonne 128 142 142 145 148 0.7% 0.3%
Domestic use 1,000 tonne 50 40 40 50 59 0.8% 2.6%
Consumption/head kg/head 1.3 1.1 1.1 1.3 1.6 1.0% 2.8%
Price euro/100kg 193.9 204.4 225.4 231.2 229.5 0.8% 0.8%
WMP
Production 1,000 tonne 30 50 39 35 31 0.1% -3.1%
Domestic use 1,000 tonne 32 16 20 22 23 -1.5% 2.5%
Consumption/head kg/head 0.8 0.4 0.5 0.6 0.6 -1.4% 2.6%
Price euro/100kg 232.8 259.2 267.1 275.6 276.4 0.9% 0.4%
Cheese
Production 1,000 tonne 422 534 574 563 550 1.3% 0.2%
Domestic use 1,000 tonne 395 443 452 480 504 1.2% 0.9%
Consumption/head kg/head 10.3 11.6 11.9 12.8 13.5 1.4% 1.0%
Price euro/100kg 302.9 301.0 307.8 339.6 367.4 1.0% 1.3%
Cream
Production 1,000 tonne 198 314 375 373 369 3.2% 1.1%
Domestic use 1,000 tonne 198 313 355 363 370 3.2% 1.1%
Consumption/head kg/head 5.2 8.2 9.4 9.7 9.9 3.3% 1.3%
Price euro/100kg 113.9 117.7 129.0 138.5 148.7 1.3% 1.6%
Other fresh products
Production 1,000 tonne 345 510 542 575 600 2.8% 1.1%
Domestic use 1,000 tonne 359 438 474 525 564 2.3% 1.7%
Consumption/head kg/head 9.4 11.5 12.5 14.0 15.2 2.4% 1.9%
Price euro/100kg 0.0 0.0 0.0 0.0 0.0 0.0% 0.0%
Source: AGMEMOD combined model (2008)
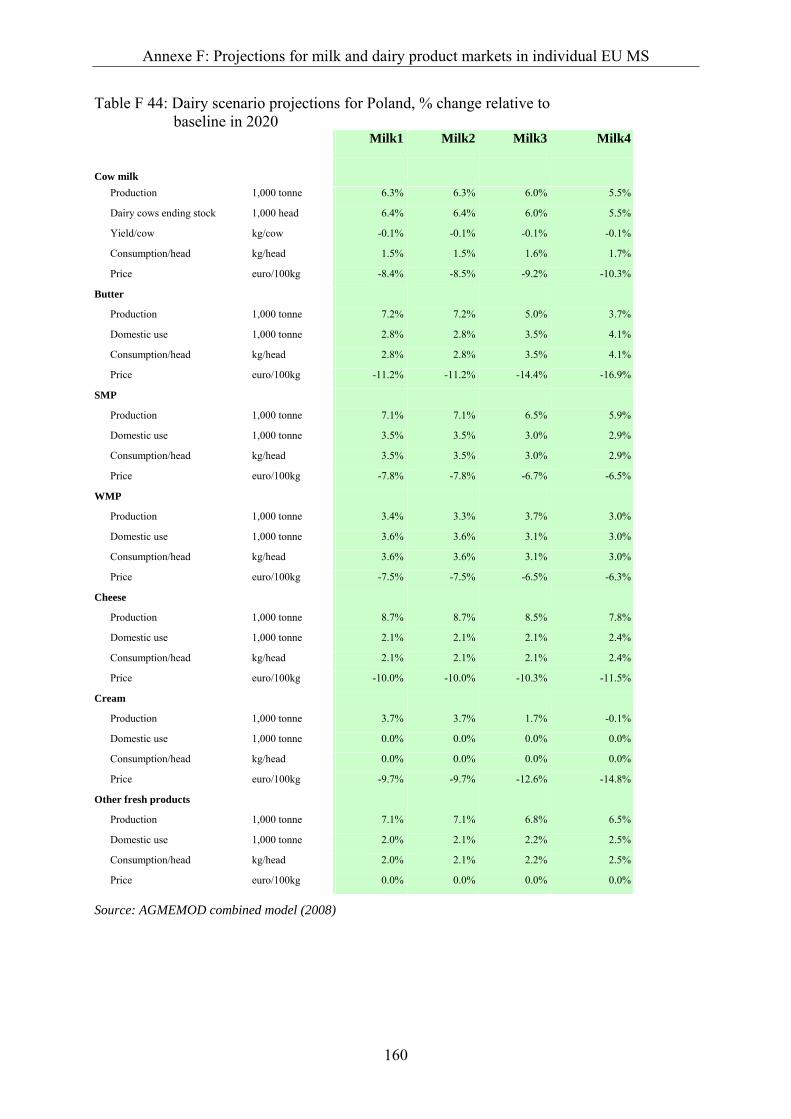
Annexe F: Projections for milk and dairy product markets in individual EU MS
160
Table F 44: Dairy scenario projections for Poland, % change relative to baseline in 2020
Milk1 Milk2 Milk3 Milk4
Cow milk Production 1,000 tonne 6.3% 6.3% 6.0% 5.5%
Dairy cows ending stock 1,000 head 6.4% 6.4% 6.0% 5.5%
Yield/cow kg/cow -0.1% -0.1% -0.1% -0.1%
Consumption/head kg/head 1.5% 1.5% 1.6% 1.7%
Price euro/100kg -8.4% -8.5% -9.2% -10.3%
Butter
Production 1,000 tonne 7.2% 7.2% 5.0% 3.7%
Domestic use 1,000 tonne 2.8% 2.8% 3.5% 4.1%
Consumption/head kg/head 2.8% 2.8% 3.5% 4.1%
Price euro/100kg -11.2% -11.2% -14.4% -16.9%
SMP
Production 1,000 tonne 7.1% 7.1% 6.5% 5.9%
Domestic use 1,000 tonne 3.5% 3.5% 3.0% 2.9%
Consumption/head kg/head 3.5% 3.5% 3.0% 2.9%
Price euro/100kg -7.8% -7.8% -6.7% -6.5%
WMP
Production 1,000 tonne 3.4% 3.3% 3.7% 3.0%
Domestic use 1,000 tonne 3.6% 3.6% 3.1% 3.0%
Consumption/head kg/head 3.6% 3.6% 3.1% 3.0%
Price euro/100kg -7.5% -7.5% -6.5% -6.3%
Cheese
Production 1,000 tonne 8.7% 8.7% 8.5% 7.8%
Domestic use 1,000 tonne 2.1% 2.1% 2.1% 2.4%
Consumption/head kg/head 2.1% 2.1% 2.1% 2.4%
Price euro/100kg -10.0% -10.0% -10.3% -11.5%
Cream
Production 1,000 tonne 3.7% 3.7% 1.7% -0.1%
Domestic use 1,000 tonne 0.0% 0.0% 0.0% 0.0%
Consumption/head kg/head 0.0% 0.0% 0.0% 0.0%
Price euro/100kg -9.7% -9.7% -12.6% -14.8%
Other fresh products
Production 1,000 tonne 7.1% 7.1% 6.8% 6.5%
Domestic use 1,000 tonne 2.0% 2.1% 2.2% 2.5%
Consumption/head kg/head 2.0% 2.1% 2.2% 2.5%
Price euro/100kg 0.0% 0.0% 0.0% 0.0%
Source: AGMEMOD combined model (2008)

Annexe F: Projections for milk and dairy product markets in individual EU MS
161
Table F 45: Dairy baseline projections for Romania, 2000-2020 Baseline
2000 2005 2010 2015 2020
2000-2020 (%
growth/year)
2005-2020 (%
growth/year)
Cow milk
Production 1,000 tonne 5,002 5,705 5,319 5,231 5,137 0.1% -0.7%
Dairy cows ending stock 1,000 head 1,775 1,625 1,430 1,277 1,156 -2.1% -2.2%
Yield/cow kg/cow 2,818 3,511 3,719 4,097 4,445 2.3% 1.6%
Consumption/head kg/head 114.6 125.5 125.7 126.5 127.9 0.6% 0.1%
Price euro/100kg 13.2 18.2 16.9 17.4 17.8 1.5% -0.2%
Butter
Production 1,000 tonne 6 12 22 20 18 5.8% 2.9%
Domestic use 1,000 tonne 9 14 9 9 9 0.1% -2.9%
Consumption/head kg/head 0.4 0.7 0.4 0.4 0.4 0.5% -2.7%
Price euro/100kg 265.1 419.9 230.1 241.8 255.8 -0.2% -3.3%
SMP
Production 1,000 tonne 1 1 1 1 1 2.8% 0.5%
Domestic use 1,000 tonne 2 4 3 3 3 1.0% -1.2%
Consumption/head kg/head 0.1 0.2 0.1 0.1 0.1 1.4% -1.0%
Price euro/100kg 206.8 222.8 221.0 224.9 221.2 0.3% 0.0%
WMP
Production 1,000 tonne 7 11 11 11 11 2.3% 0.0%
Domestic use 1,000 tonne 11 13 13 13 12 0.5% -0.5%
Consumption/head kg/head 0.5 0.6 0.6 0.6 0.6 0.9% -0.3%
Price euro/100kg 242.2 277.1 328.3 334.1 338.3 1.7% 1.3%
Cheese
Production 1,000 tonne 204 260 323 326 332 2.5% 1.6%
Domestic use 1,000 tonne 203 259 302 316 332 2.5% 1.7%
Consumption/head kg/head 9.0 12.0 14.1 14.9 15.9 2.9% 1.9%
Price euro/100kg 264.0 435.8 295.2 320.0 342.2 1.3% -1.6%
Cream
Production 1,000 tonne 30 38 45 48 61 3.7% 3.2%
Domestic use 1,000 tonne 34 42 43 52 60 2.9% 2.5%
Consumption/head kg/head 1.5 1.9 2.0 2.4 2.9 3.3% 2.7%
Price euro/100kg 145.8 182.3 206.0 206.0 206.0 1.7% 0.8%
Other fresh products
Production 1,000 tonne 164 275 262 289 359 4.0% 1.8%
Domestic use 1,000 tonne 173 277 262 308 361 3.7% 1.8%
Consumption/head kg/head 7.7 12.8 12.2 14.5 17.2 4.1% 2.0%
Price euro/100kg 48.1 60.2 68.0 68.0 68.0 1.7% 0.8%
Source: AGMEMOD combined model (2008)
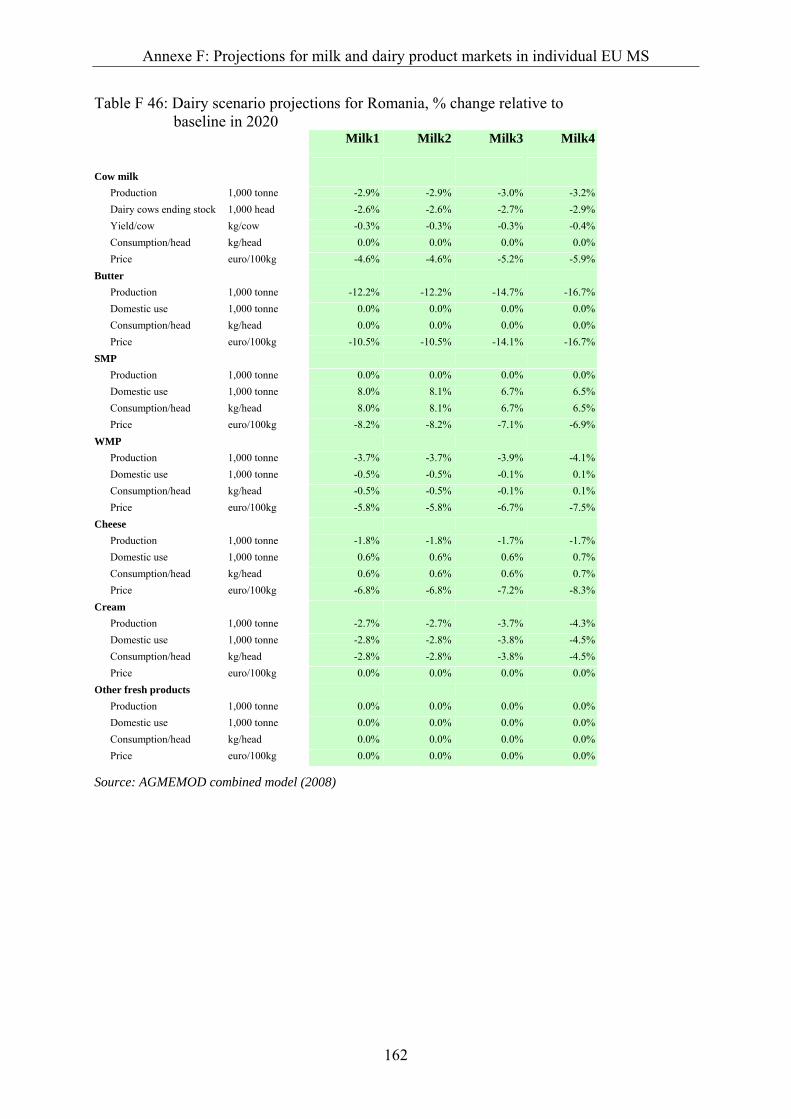
Annexe F: Projections for milk and dairy product markets in individual EU MS
162
Table F 46: Dairy scenario projections for Romania, % change relative to baseline in 2020
Milk1 Milk2 Milk3 Milk4
Cow milk Production 1,000 tonne -2.9% -2.9% -3.0% -3.2% Dairy cows ending stock 1,000 head -2.6% -2.6% -2.7% -2.9% Yield/cow kg/cow -0.3% -0.3% -0.3% -0.4% Consumption/head kg/head 0.0% 0.0% 0.0% 0.0% Price euro/100kg -4.6% -4.6% -5.2% -5.9% Butter Production 1,000 tonne -12.2% -12.2% -14.7% -16.7% Domestic use 1,000 tonne 0.0% 0.0% 0.0% 0.0% Consumption/head kg/head 0.0% 0.0% 0.0% 0.0% Price euro/100kg -10.5% -10.5% -14.1% -16.7% SMP Production 1,000 tonne 0.0% 0.0% 0.0% 0.0% Domestic use 1,000 tonne 8.0% 8.1% 6.7% 6.5% Consumption/head kg/head 8.0% 8.1% 6.7% 6.5% Price euro/100kg -8.2% -8.2% -7.1% -6.9% WMP Production 1,000 tonne -3.7% -3.7% -3.9% -4.1% Domestic use 1,000 tonne -0.5% -0.5% -0.1% 0.1% Consumption/head kg/head -0.5% -0.5% -0.1% 0.1% Price euro/100kg -5.8% -5.8% -6.7% -7.5% Cheese Production 1,000 tonne -1.8% -1.8% -1.7% -1.7% Domestic use 1,000 tonne 0.6% 0.6% 0.6% 0.7% Consumption/head kg/head 0.6% 0.6% 0.6% 0.7% Price euro/100kg -6.8% -6.8% -7.2% -8.3% Cream Production 1,000 tonne -2.7% -2.7% -3.7% -4.3% Domestic use 1,000 tonne -2.8% -2.8% -3.8% -4.5% Consumption/head kg/head -2.8% -2.8% -3.8% -4.5% Price euro/100kg 0.0% 0.0% 0.0% 0.0% Other fresh products Production 1,000 tonne 0.0% 0.0% 0.0% 0.0% Domestic use 1,000 tonne 0.0% 0.0% 0.0% 0.0% Consumption/head kg/head 0.0% 0.0% 0.0% 0.0% Price euro/100kg 0.0% 0.0% 0.0% 0.0%
Source: AGMEMOD combined model (2008)
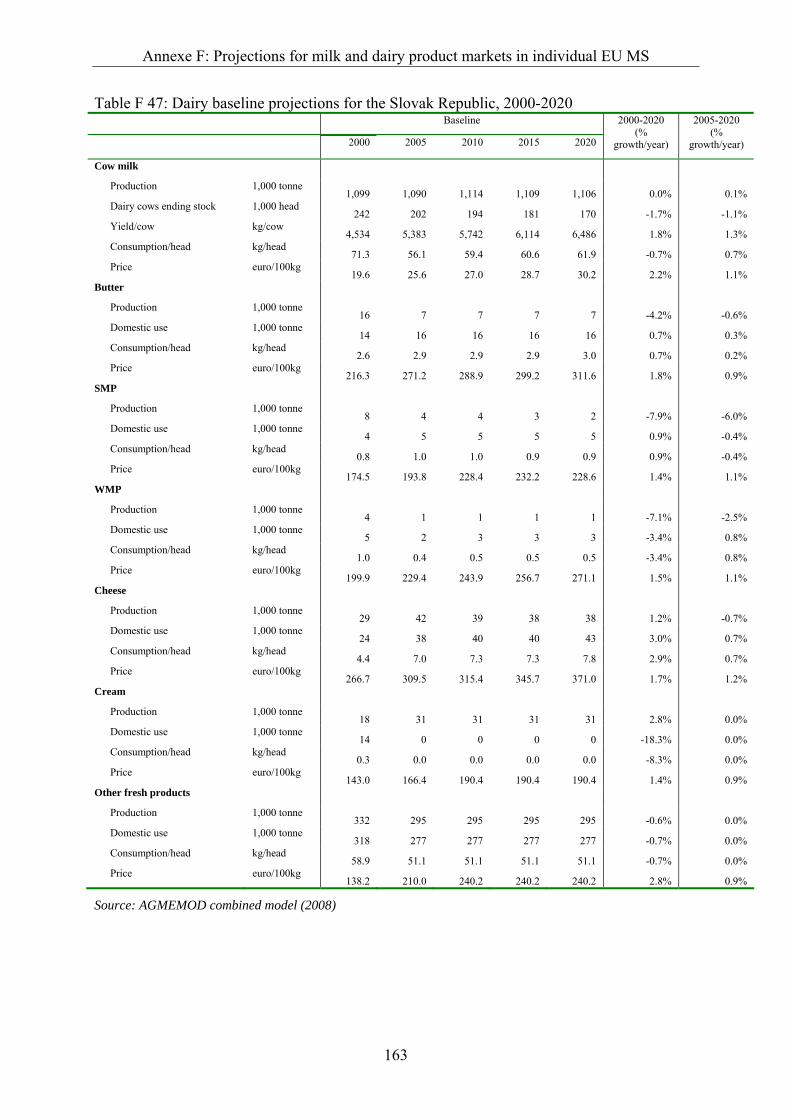
Annexe F: Projections for milk and dairy product markets in individual EU MS
163
Table F 47: Dairy baseline projections for the Slovak Republic, 2000-2020 Baseline
2000 2005 2010 2015 2020
2000-2020 (%
growth/year)
2005-2020 (%
growth/year)
Cow milk
Production 1,000 tonne 1,099 1,090 1,114 1,109 1,106 0.0% 0.1%
Dairy cows ending stock 1,000 head 242 202 194 181 170 -1.7% -1.1%
Yield/cow kg/cow 4,534 5,383 5,742 6,114 6,486 1.8% 1.3%
Consumption/head kg/head 71.3 56.1 59.4 60.6 61.9 -0.7% 0.7%
Price euro/100kg 19.6 25.6 27.0 28.7 30.2 2.2% 1.1%
Butter
Production 1,000 tonne 16 7 7 7 7 -4.2% -0.6%
Domestic use 1,000 tonne 14 16 16 16 16 0.7% 0.3%
Consumption/head kg/head 2.6 2.9 2.9 2.9 3.0 0.7% 0.2%
Price euro/100kg 216.3 271.2 288.9 299.2 311.6 1.8% 0.9%
SMP
Production 1,000 tonne 8 4 4 3 2 -7.9% -6.0%
Domestic use 1,000 tonne 4 5 5 5 5 0.9% -0.4%
Consumption/head kg/head 0.8 1.0 1.0 0.9 0.9 0.9% -0.4%
Price euro/100kg 174.5 193.8 228.4 232.2 228.6 1.4% 1.1%
WMP
Production 1,000 tonne 4 1 1 1 1 -7.1% -2.5%
Domestic use 1,000 tonne 5 2 3 3 3 -3.4% 0.8%
Consumption/head kg/head 1.0 0.4 0.5 0.5 0.5 -3.4% 0.8%
Price euro/100kg 199.9 229.4 243.9 256.7 271.1 1.5% 1.1%
Cheese
Production 1,000 tonne 29 42 39 38 38 1.2% -0.7%
Domestic use 1,000 tonne 24 38 40 40 43 3.0% 0.7%
Consumption/head kg/head 4.4 7.0 7.3 7.3 7.8 2.9% 0.7%
Price euro/100kg 266.7 309.5 315.4 345.7 371.0 1.7% 1.2%
Cream
Production 1,000 tonne 18 31 31 31 31 2.8% 0.0%
Domestic use 1,000 tonne 14 0 0 0 0 -18.3% 0.0%
Consumption/head kg/head 0.3 0.0 0.0 0.0 0.0 -8.3% 0.0%
Price euro/100kg 143.0 166.4 190.4 190.4 190.4 1.4% 0.9%
Other fresh products
Production 1,000 tonne 332 295 295 295 295 -0.6% 0.0%
Domestic use 1,000 tonne 318 277 277 277 277 -0.7% 0.0%
Consumption/head kg/head 58.9 51.1 51.1 51.1 51.1 -0.7% 0.0%
Price euro/100kg 138.2 210.0 240.2 240.2 240.2 2.8% 0.9%
Source: AGMEMOD combined model (2008)
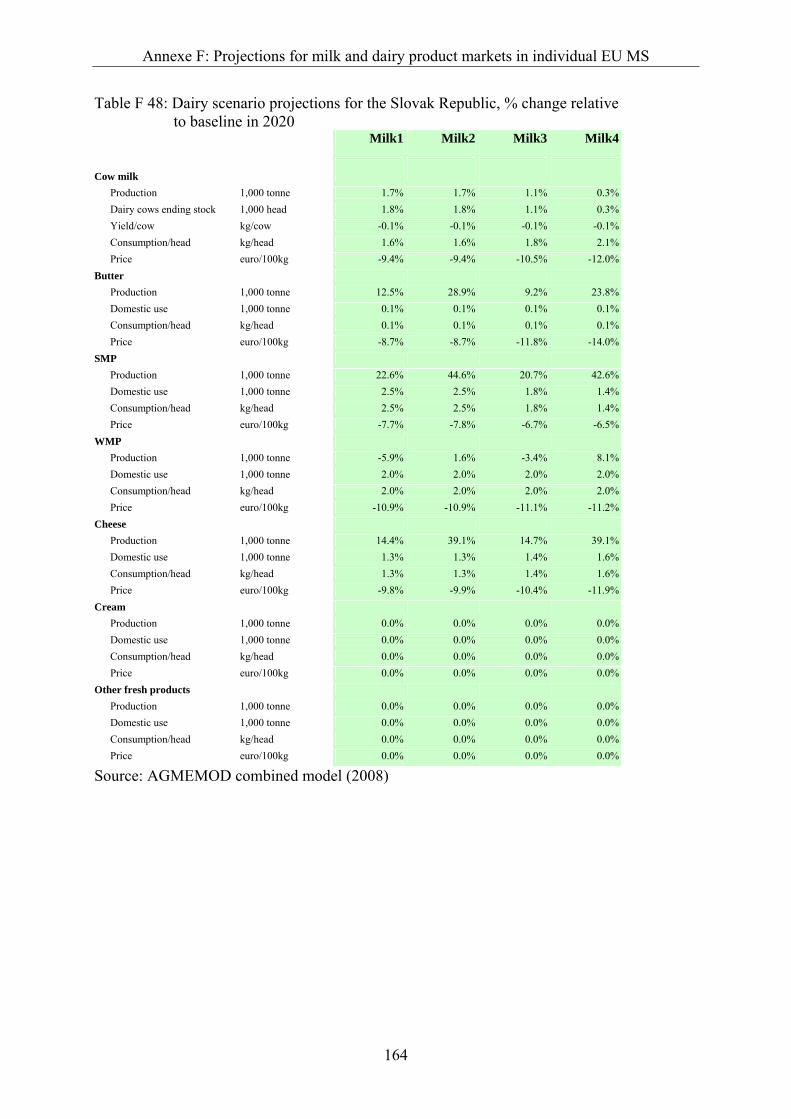
Annexe F: Projections for milk and dairy product markets in individual EU MS
164
Table F 48: Dairy scenario projections for the Slovak Republic, % change relative to baseline in 2020
Milk1 Milk2 Milk3 Milk4
Cow milk Production 1,000 tonne 1.7% 1.7% 1.1% 0.3% Dairy cows ending stock 1,000 head 1.8% 1.8% 1.1% 0.3% Yield/cow kg/cow -0.1% -0.1% -0.1% -0.1% Consumption/head kg/head 1.6% 1.6% 1.8% 2.1% Price euro/100kg -9.4% -9.4% -10.5% -12.0% Butter Production 1,000 tonne 12.5% 28.9% 9.2% 23.8% Domestic use 1,000 tonne 0.1% 0.1% 0.1% 0.1% Consumption/head kg/head 0.1% 0.1% 0.1% 0.1% Price euro/100kg -8.7% -8.7% -11.8% -14.0% SMP Production 1,000 tonne 22.6% 44.6% 20.7% 42.6% Domestic use 1,000 tonne 2.5% 2.5% 1.8% 1.4% Consumption/head kg/head 2.5% 2.5% 1.8% 1.4% Price euro/100kg -7.7% -7.8% -6.7% -6.5% WMP Production 1,000 tonne -5.9% 1.6% -3.4% 8.1% Domestic use 1,000 tonne 2.0% 2.0% 2.0% 2.0% Consumption/head kg/head 2.0% 2.0% 2.0% 2.0% Price euro/100kg -10.9% -10.9% -11.1% -11.2% Cheese Production 1,000 tonne 14.4% 39.1% 14.7% 39.1% Domestic use 1,000 tonne 1.3% 1.3% 1.4% 1.6% Consumption/head kg/head 1.3% 1.3% 1.4% 1.6% Price euro/100kg -9.8% -9.9% -10.4% -11.9% Cream Production 1,000 tonne 0.0% 0.0% 0.0% 0.0% Domestic use 1,000 tonne 0.0% 0.0% 0.0% 0.0% Consumption/head kg/head 0.0% 0.0% 0.0% 0.0% Price euro/100kg 0.0% 0.0% 0.0% 0.0% Other fresh products Production 1,000 tonne 0.0% 0.0% 0.0% 0.0% Domestic use 1,000 tonne 0.0% 0.0% 0.0% 0.0% Consumption/head kg/head 0.0% 0.0% 0.0% 0.0% Price euro/100kg 0.0% 0.0% 0.0% 0.0%
Source: AGMEMOD combined model (2008)
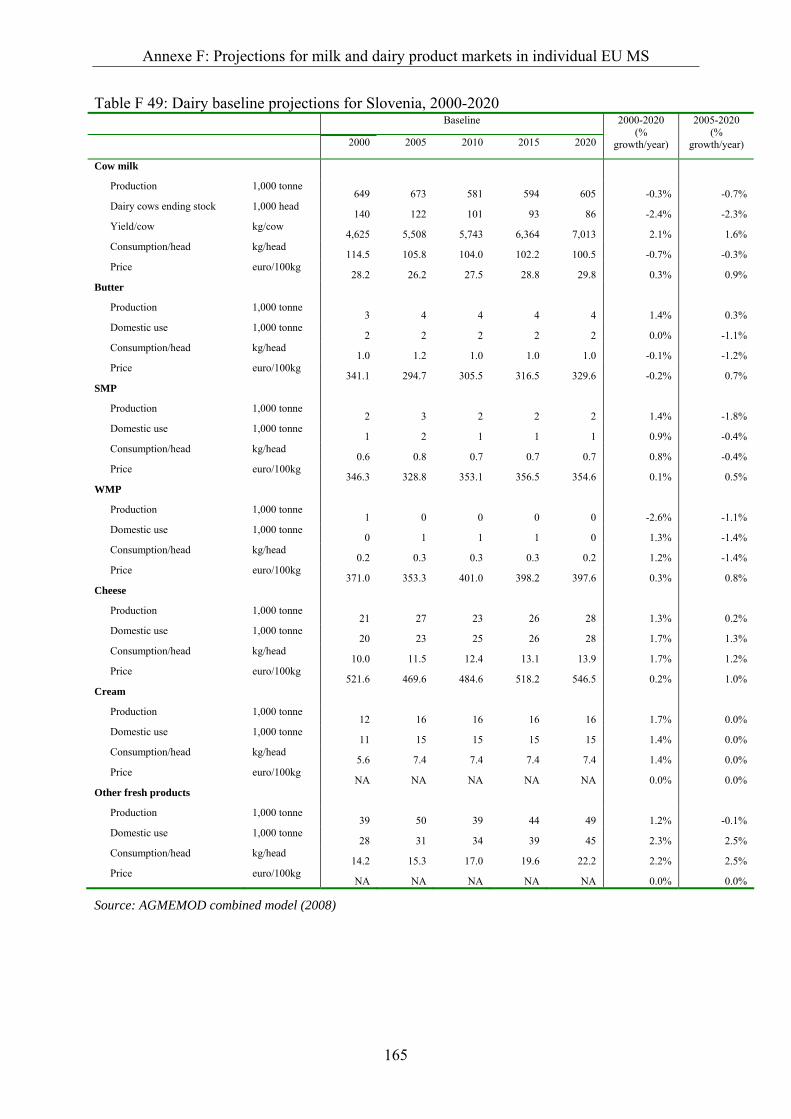
Annexe F: Projections for milk and dairy product markets in individual EU MS
165
Table F 49: Dairy baseline projections for Slovenia, 2000-2020 Baseline
2000 2005 2010 2015 2020
2000-2020 (%
growth/year)
2005-2020 (%
growth/year)
Cow milk
Production 1,000 tonne 649 673 581 594 605 -0.3% -0.7%
Dairy cows ending stock 1,000 head 140 122 101 93 86 -2.4% -2.3%
Yield/cow kg/cow 4,625 5,508 5,743 6,364 7,013 2.1% 1.6%
Consumption/head kg/head 114.5 105.8 104.0 102.2 100.5 -0.7% -0.3%
Price euro/100kg 28.2 26.2 27.5 28.8 29.8 0.3% 0.9%
Butter
Production 1,000 tonne 3 4 4 4 4 1.4% 0.3%
Domestic use 1,000 tonne 2 2 2 2 2 0.0% -1.1%
Consumption/head kg/head 1.0 1.2 1.0 1.0 1.0 -0.1% -1.2%
Price euro/100kg 341.1 294.7 305.5 316.5 329.6 -0.2% 0.7%
SMP
Production 1,000 tonne 2 3 2 2 2 1.4% -1.8%
Domestic use 1,000 tonne 1 2 1 1 1 0.9% -0.4%
Consumption/head kg/head 0.6 0.8 0.7 0.7 0.7 0.8% -0.4%
Price euro/100kg 346.3 328.8 353.1 356.5 354.6 0.1% 0.5%
WMP
Production 1,000 tonne 1 0 0 0 0 -2.6% -1.1%
Domestic use 1,000 tonne 0 1 1 1 0 1.3% -1.4%
Consumption/head kg/head 0.2 0.3 0.3 0.3 0.2 1.2% -1.4%
Price euro/100kg 371.0 353.3 401.0 398.2 397.6 0.3% 0.8%
Cheese
Production 1,000 tonne 21 27 23 26 28 1.3% 0.2%
Domestic use 1,000 tonne 20 23 25 26 28 1.7% 1.3%
Consumption/head kg/head 10.0 11.5 12.4 13.1 13.9 1.7% 1.2%
Price euro/100kg 521.6 469.6 484.6 518.2 546.5 0.2% 1.0%
Cream
Production 1,000 tonne 12 16 16 16 16 1.7% 0.0%
Domestic use 1,000 tonne 11 15 15 15 15 1.4% 0.0%
Consumption/head kg/head 5.6 7.4 7.4 7.4 7.4 1.4% 0.0%
Price euro/100kg NA NA NA NA NA 0.0% 0.0%
Other fresh products
Production 1,000 tonne 39 50 39 44 49 1.2% -0.1%
Domestic use 1,000 tonne 28 31 34 39 45 2.3% 2.5%
Consumption/head kg/head 14.2 15.3 17.0 19.6 22.2 2.2% 2.5%
Price euro/100kg NA NA NA NA NA 0.0% 0.0%
Source: AGMEMOD combined model (2008)
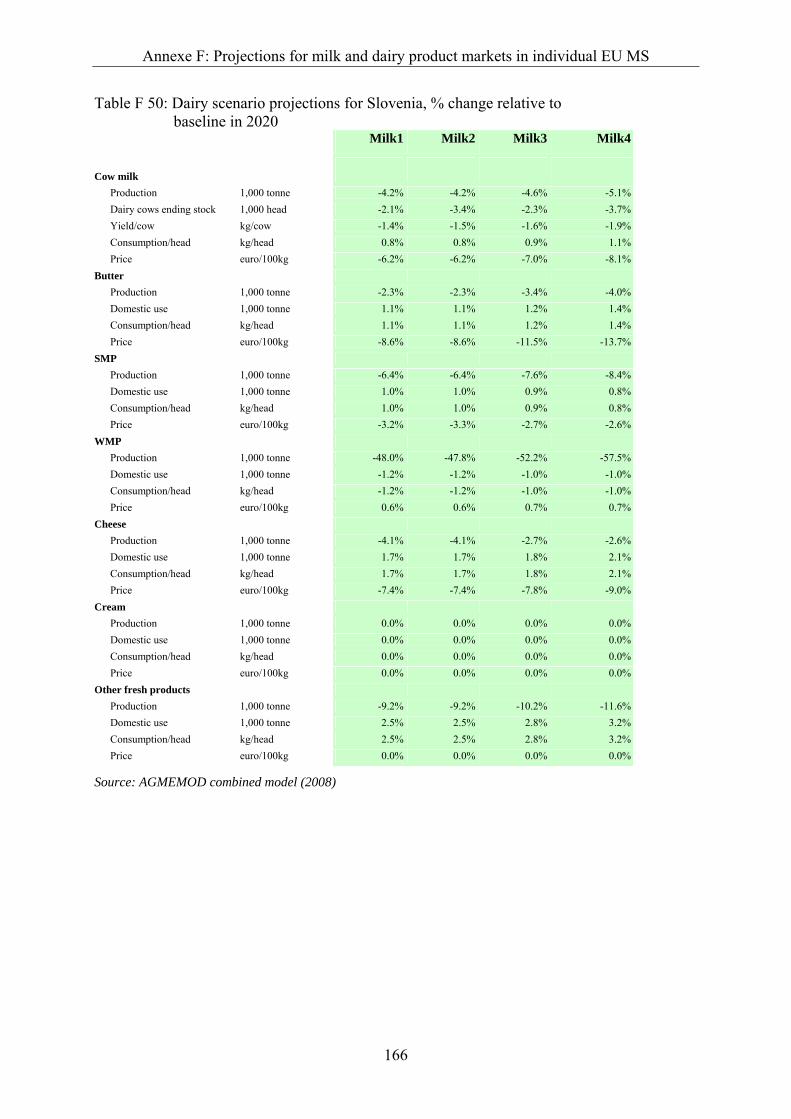
Annexe F: Projections for milk and dairy product markets in individual EU MS
166
Table F 50: Dairy scenario projections for Slovenia, % change relative to baseline in 2020
Milk1 Milk2 Milk3 Milk4
Cow milk Production 1,000 tonne -4.2% -4.2% -4.6% -5.1% Dairy cows ending stock 1,000 head -2.1% -3.4% -2.3% -3.7% Yield/cow kg/cow -1.4% -1.5% -1.6% -1.9% Consumption/head kg/head 0.8% 0.8% 0.9% 1.1% Price euro/100kg -6.2% -6.2% -7.0% -8.1% Butter Production 1,000 tonne -2.3% -2.3% -3.4% -4.0% Domestic use 1,000 tonne 1.1% 1.1% 1.2% 1.4% Consumption/head kg/head 1.1% 1.1% 1.2% 1.4% Price euro/100kg -8.6% -8.6% -11.5% -13.7% SMP Production 1,000 tonne -6.4% -6.4% -7.6% -8.4% Domestic use 1,000 tonne 1.0% 1.0% 0.9% 0.8% Consumption/head kg/head 1.0% 1.0% 0.9% 0.8% Price euro/100kg -3.2% -3.3% -2.7% -2.6% WMP Production 1,000 tonne -48.0% -47.8% -52.2% -57.5% Domestic use 1,000 tonne -1.2% -1.2% -1.0% -1.0% Consumption/head kg/head -1.2% -1.2% -1.0% -1.0% Price euro/100kg 0.6% 0.6% 0.7% 0.7% Cheese Production 1,000 tonne -4.1% -4.1% -2.7% -2.6% Domestic use 1,000 tonne 1.7% 1.7% 1.8% 2.1% Consumption/head kg/head 1.7% 1.7% 1.8% 2.1% Price euro/100kg -7.4% -7.4% -7.8% -9.0% Cream Production 1,000 tonne 0.0% 0.0% 0.0% 0.0% Domestic use 1,000 tonne 0.0% 0.0% 0.0% 0.0% Consumption/head kg/head 0.0% 0.0% 0.0% 0.0% Price euro/100kg 0.0% 0.0% 0.0% 0.0% Other fresh products Production 1,000 tonne -9.2% -9.2% -10.2% -11.6% Domestic use 1,000 tonne 2.5% 2.5% 2.8% 3.2% Consumption/head kg/head 2.5% 2.5% 2.8% 3.2% Price euro/100kg 0.0% 0.0% 0.0% 0.0%
Source: AGMEMOD combined model (2008)
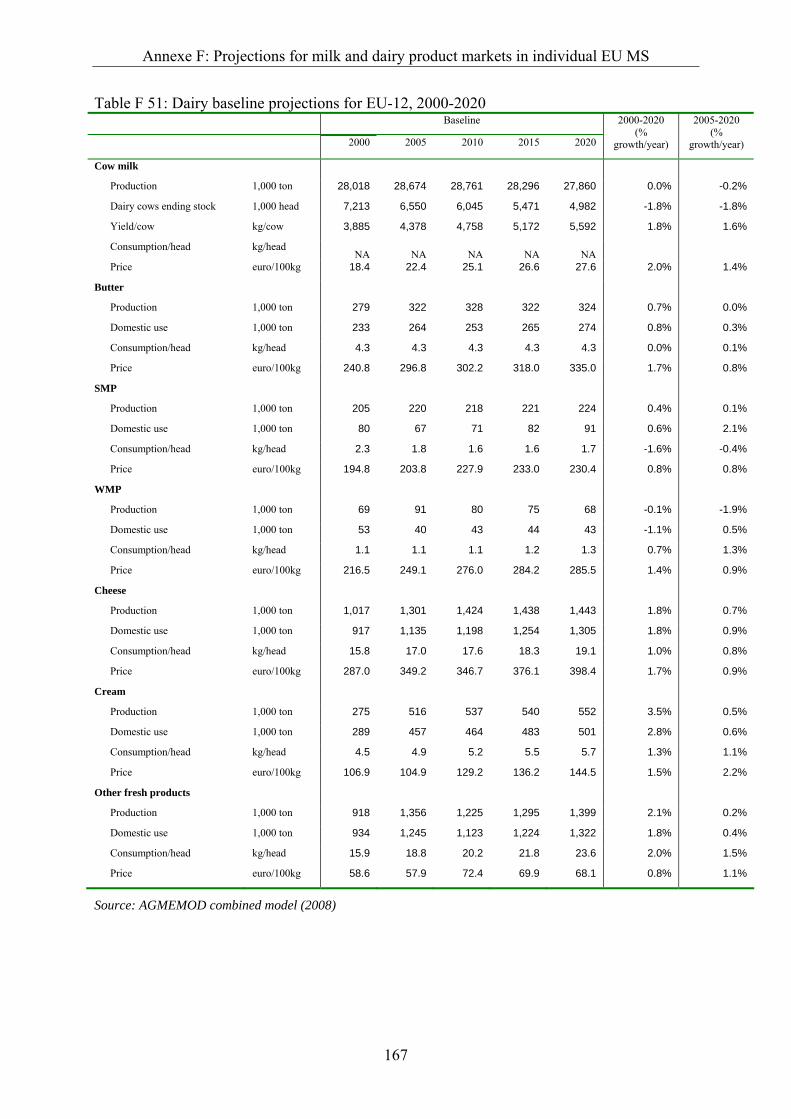
Annexe F: Projections for milk and dairy product markets in individual EU MS
167
Table F 51: Dairy baseline projections for EU-12, 2000-2020 Baseline
2000 2005 2010 2015 2020
2000-2020 (%
growth/year)
2005-2020 (%
growth/year)
Cow milk
Production 1,000 ton 28,018 28,674 28,761 28,296 27,860 0.0% -0.2%
Dairy cows ending stock 1,000 head 7,213 6,550 6,045 5,471 4,982 -1.8% -1.8%
Yield/cow kg/cow 3,885 4,378 4,758 5,172 5,592 1.8% 1.6%
Consumption/head kg/head NA NA NA NA NA
Price euro/100kg 18.4 22.4 25.1 26.6 27.6 2.0% 1.4%
Butter
Production 1,000 ton 279 322 328 322 324 0.7% 0.0%
Domestic use 1,000 ton 233 264 253 265 274 0.8% 0.3%
Consumption/head kg/head 4.3 4.3 4.3 4.3 4.3 0.0% 0.1%
Price euro/100kg 240.8 296.8 302.2 318.0 335.0 1.7% 0.8%
SMP
Production 1,000 ton 205 220 218 221 224 0.4% 0.1%
Domestic use 1,000 ton 80 67 71 82 91 0.6% 2.1%
Consumption/head kg/head 2.3 1.8 1.6 1.6 1.7 -1.6% -0.4%
Price euro/100kg 194.8 203.8 227.9 233.0 230.4 0.8% 0.8%
WMP
Production 1,000 ton 69 91 80 75 68 -0.1% -1.9%
Domestic use 1,000 ton 53 40 43 44 43 -1.1% 0.5%
Consumption/head kg/head 1.1 1.1 1.1 1.2 1.3 0.7% 1.3%
Price euro/100kg 216.5 249.1 276.0 284.2 285.5 1.4% 0.9%
Cheese
Production 1,000 ton 1,017 1,301 1,424 1,438 1,443 1.8% 0.7%
Domestic use 1,000 ton 917 1,135 1,198 1,254 1,305 1.8% 0.9%
Consumption/head kg/head 15.8 17.0 17.6 18.3 19.1 1.0% 0.8%
Price euro/100kg 287.0 349.2 346.7 376.1 398.4 1.7% 0.9%
Cream
Production 1,000 ton 275 516 537 540 552 3.5% 0.5%
Domestic use 1,000 ton 289 457 464 483 501 2.8% 0.6%
Consumption/head kg/head 4.5 4.9 5.2 5.5 5.7 1.3% 1.1%
Price euro/100kg 106.9 104.9 129.2 136.2 144.5 1.5% 2.2%
Other fresh products
Production 1,000 ton 918 1,356 1,225 1,295 1,399 2.1% 0.2%
Domestic use 1,000 ton 934 1,245 1,123 1,224 1,322 1.8% 0.4%
Consumption/head kg/head 15.9 18.8 20.2 21.8 23.6 2.0% 1.5%
Price euro/100kg 58.6 57.9 72.4 69.9 68.1 0.8% 1.1%
Source: AGMEMOD combined model (2008)

Annexe F: Projections for milk and dairy product markets in individual EU MS
168
Table F 52: Dairy scenario projections for EU-12, % change relative to baseline in 2020
Milk1 Milk2 Milk3 Milk4
Cow milk Production 1,000 ton 2.4% 2.3% 1.8% 1.2%
Dairy cows ending stock 1,000 head 2.4% 2.4% 2.0% 1.4%
Yield/cow kg/cow 0.0% 0.0% -0.1% -0.2%
Consumption/head kg/head 0.6% 0.6% 0.6% 0.6%
Price euro/100kg -7.9% -7.9% -9.0% -10.3%
Butter
Production 1,000 ton 6.8% 7.1% 4.8% 4.1%
Domestic use 1,000 ton 2.1% 2.1% 2.8% 3.2%
Consumption/head kg/head 2.4% 2.4% 2.4% 2.4%
Price euro/100kg -10.3% -10.3% -13.7% -16.2%
SMP
Production 1,000 ton 5.0% 5.2% 4.4% 3.9%
Domestic use 1,000 ton 2.5% 2.5% 2.0% 1.9%
Consumption/head kg/head 7.8% 7.8% 7.8% 7.8%
Price euro/100kg -7.5% -7.6% -6.6% -6.4%
WMP
Production 1,000 ton 0.7% 0.8% 0.7% 0.4%
Domestic use 1,000 ton 1.9% 1.9% 1.8% 1.8%
Consumption/head kg/head -0.4% -0.4% -0.4% -0.4%
Price euro/100kg -6.7% -6.7% -6.6% -7.0%
Cheese
Production 1,000 ton 2.9% 3.6% 2.9% 3.2%
Domestic use 1,000 ton 1.5% 1.5% 1.6% 1.8%
Consumption/head kg/head 1.6% 1.6% 1.6% 1.6%
Price euro/100kg -8.7% -8.8% -9.1% -10.2%
Cream
Production 1,000 ton 2.4% 2.4% 0.9% -0.5%
Domestic use 1,000 ton -0.1% -0.1% -0.2% -0.2%
Consumption/head kg/head 1.7% 1.7% 1.7% 1.7%
Price euro/100kg -7.0% -7.0% -9.0% -10.6%
Other fresh products
Production 1,000 ton 3.2% 3.2% 3.0% 2.6%
Domestic use 1,000 ton 1.0% 1.0% 1.1% 1.2%
Consumption/head kg/head 1.2% 1.2% 1.2% 1.2%
Price euro/100kg -3.1% -3.1% -2.9% -2.6%
Source: AGMEMOD combined model (2008)
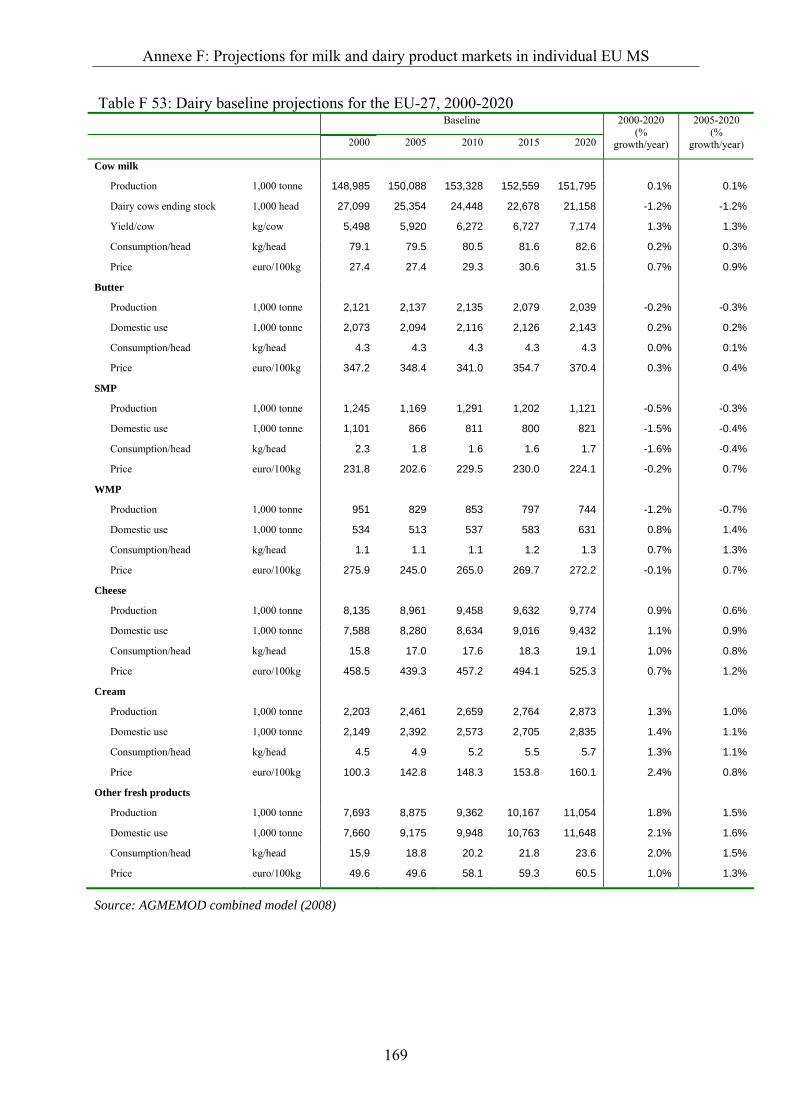
Annexe F: Projections for milk and dairy product markets in individual EU MS
169
Table F 53: Dairy baseline projections for the EU-27, 2000-2020 Baseline
2000 2005 2010 2015 2020
2000-2020 (%
growth/year)
2005-2020 (%
growth/year)
Cow milk
Production 1,000 tonne 148,985 150,088 153,328 152,559 151,795 0.1% 0.1%
Dairy cows ending stock 1,000 head 27,099 25,354 24,448 22,678 21,158 -1.2% -1.2%
Yield/cow kg/cow 5,498 5,920 6,272 6,727 7,174 1.3% 1.3%
Consumption/head kg/head 79.1 79.5 80.5 81.6 82.6 0.2% 0.3%
Price euro/100kg 27.4 27.4 29.3 30.6 31.5 0.7% 0.9%
Butter
Production 1,000 tonne 2,121 2,137 2,135 2,079 2,039 -0.2% -0.3%
Domestic use 1,000 tonne 2,073 2,094 2,116 2,126 2,143 0.2% 0.2%
Consumption/head kg/head 4.3 4.3 4.3 4.3 4.3 0.0% 0.1%
Price euro/100kg 347.2 348.4 341.0 354.7 370.4 0.3% 0.4%
SMP
Production 1,000 tonne 1,245 1,169 1,291 1,202 1,121 -0.5% -0.3%
Domestic use 1,000 tonne 1,101 866 811 800 821 -1.5% -0.4%
Consumption/head kg/head 2.3 1.8 1.6 1.6 1.7 -1.6% -0.4%
Price euro/100kg 231.8 202.6 229.5 230.0 224.1 -0.2% 0.7%
WMP
Production 1,000 tonne 951 829 853 797 744 -1.2% -0.7%
Domestic use 1,000 tonne 534 513 537 583 631 0.8% 1.4%
Consumption/head kg/head 1.1 1.1 1.1 1.2 1.3 0.7% 1.3%
Price euro/100kg 275.9 245.0 265.0 269.7 272.2 -0.1% 0.7%
Cheese
Production 1,000 tonne 8,135 8,961 9,458 9,632 9,774 0.9% 0.6%
Domestic use 1,000 tonne 7,588 8,280 8,634 9,016 9,432 1.1% 0.9%
Consumption/head kg/head 15.8 17.0 17.6 18.3 19.1 1.0% 0.8%
Price euro/100kg 458.5 439.3 457.2 494.1 525.3 0.7% 1.2%
Cream
Production 1,000 tonne 2,203 2,461 2,659 2,764 2,873 1.3% 1.0%
Domestic use 1,000 tonne 2,149 2,392 2,573 2,705 2,835 1.4% 1.1%
Consumption/head kg/head 4.5 4.9 5.2 5.5 5.7 1.3% 1.1%
Price euro/100kg 100.3 142.8 148.3 153.8 160.1 2.4% 0.8%
Other fresh products
Production 1,000 tonne 7,693 8,875 9,362 10,167 11,054 1.8% 1.5%
Domestic use 1,000 tonne 7,660 9,175 9,948 10,763 11,648 2.1% 1.6%
Consumption/head kg/head 15.9 18.8 20.2 21.8 23.6 2.0% 1.5%
Price euro/100kg 49.6 49.6 58.1 59.3 60.5 1.0% 1.3%
Source: AGMEMOD combined model (2008)

Annexe F: Projections for milk and dairy product markets in individual EU MS
170
Table F 54: Dairy scenario projections for the EU-27, % change relative to baseline in 2020
Milk1 Milk2 Milk3 Milk4
Cow milk Production 1,000 tonne 5.0% 4.9% 4.5% 3.9%
Dairy cows ending stock 1,000 head 5.3% 5.1% 4.8% 4.0%
Yield/cow kg/cow -0.4% -0.1% -0.4% -0.2%
Consumption/head kg/head 0.6% 0.6% 0.6% 0.7%
Price euro/100kg -7.2% -7.2% -8.0% -9.0%
Butter
Production 1,000 tonne 7.4% 7.4% 5.6% 4.4%
Domestic use 1,000 tonne 2.4% 2.4% 3.2% 3.8%
Consumption/head kg/head 2.4% 2.5% 3.2% 3.8%
Price euro/100kg -9.9% -9.9% -12.7% -14.8%
SMP
Production 1,000 tonne 13.8% 13.8% 11.6% 10.6%
Domestic use 1,000 tonne 7.9% 7.9% 6.9% 6.5%
Consumption/head kg/head 7.8% 7.8% 6.9% 6.5%
Price euro/100kg -5.7% -5.7% -4.9% -4.8%
WMP
Production 1,000 tonne 6.4% 6.4% 5.5% 4.6%
Domestic use 1,000 tonne -0.4% -0.4% -0.3% -0.3%
Consumption/head kg/head -0.4% -0.4% -0.3% -0.3%
Price euro/100kg -6.7% -6.7% -6.7% -6.9%
Cheese
Production 1,000 tonne 5.0% 5.0% 4.7% 4.2%
Domestic use 1,000 tonne 1.6% 1.6% 1.6% 1.7%
Consumption/head kg/head 1.6% 1.6% 1.6% 1.7%
Price euro/100kg -9.0% -9.1% -9.3% -10.4%
Cream
Production 1,000 tonne 2.2% 2.2% 2.4% 2.4%
Domestic use 1,000 tonne 1.7% 1.7% 2.2% 2.6%
Consumption/head kg/head 1.7% 1.7% 2.2% 2.6%
Price euro/100kg -9.3% -9.3% -11.5% -13.2%
Other fresh products
Production 1,000 tonne 1.1% 1.1% 1.1% 1.0%
Domestic use 1,000 tonne 1.2% 1.2% 1.3% 1.4%
Consumption/head kg/head 1.2% 1.2% 1.3% 1.4%
Price euro/100kg -2.2% -2.2% -2.5% -2.7%
Source: AGMEMOD combined model (2008)
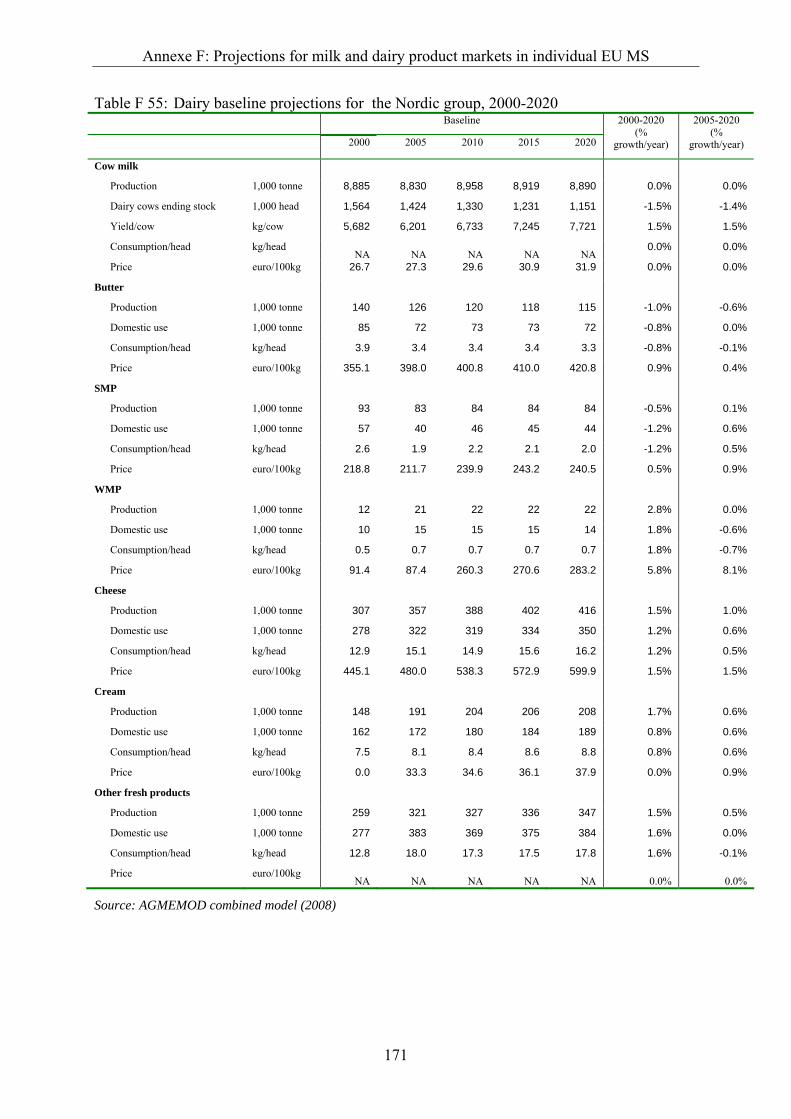
Annexe F: Projections for milk and dairy product markets in individual EU MS
171
Table F 55: Dairy baseline projections for the Nordic group, 2000-2020 Baseline
2000 2005 2010 2015 2020
2000-2020 (%
growth/year)
2005-2020 (%
growth/year)
Cow milk
Production 1,000 tonne 8,885 8,830 8,958 8,919 8,890 0.0% 0.0%
Dairy cows ending stock 1,000 head 1,564 1,424 1,330 1,231 1,151 -1.5% -1.4%
Yield/cow kg/cow 5,682 6,201 6,733 7,245 7,721 1.5% 1.5%
Consumption/head kg/head NA NA NA NA NA
0.0% 0.0%
Price euro/100kg 26.7 27.3 29.6 30.9 31.9 0.0% 0.0%
Butter
Production 1,000 tonne 140 126 120 118 115 -1.0% -0.6%
Domestic use 1,000 tonne 85 72 73 73 72 -0.8% 0.0%
Consumption/head kg/head 3.9 3.4 3.4 3.4 3.3 -0.8% -0.1%
Price euro/100kg 355.1 398.0 400.8 410.0 420.8 0.9% 0.4%
SMP
Production 1,000 tonne 93 83 84 84 84 -0.5% 0.1%
Domestic use 1,000 tonne 57 40 46 45 44 -1.2% 0.6%
Consumption/head kg/head 2.6 1.9 2.2 2.1 2.0 -1.2% 0.5%
Price euro/100kg 218.8 211.7 239.9 243.2 240.5 0.5% 0.9%
WMP
Production 1,000 tonne 12 21 22 22 22 2.8% 0.0%
Domestic use 1,000 tonne 10 15 15 15 14 1.8% -0.6%
Consumption/head kg/head 0.5 0.7 0.7 0.7 0.7 1.8% -0.7%
Price euro/100kg 91.4 87.4 260.3 270.6 283.2 5.8% 8.1%
Cheese
Production 1,000 tonne 307 357 388 402 416 1.5% 1.0%
Domestic use 1,000 tonne 278 322 319 334 350 1.2% 0.6%
Consumption/head kg/head 12.9 15.1 14.9 15.6 16.2 1.2% 0.5%
Price euro/100kg 445.1 480.0 538.3 572.9 599.9 1.5% 1.5%
Cream
Production 1,000 tonne 148 191 204 206 208 1.7% 0.6%
Domestic use 1,000 tonne 162 172 180 184 189 0.8% 0.6%
Consumption/head kg/head 7.5 8.1 8.4 8.6 8.8 0.8% 0.6%
Price euro/100kg 0.0 33.3 34.6 36.1 37.9 0.0% 0.9%
Other fresh products
Production 1,000 tonne 259 321 327 336 347 1.5% 0.5%
Domestic use 1,000 tonne 277 383 369 375 384 1.6% 0.0%
Consumption/head kg/head 12.8 18.0 17.3 17.5 17.8 1.6% -0.1%
Price euro/100kg NA NA NA NA NA 0.0% 0.0%
Source: AGMEMOD combined model (2008)

Annexe F: Projections for milk and dairy product markets in individual EU MS
172
Table F 56: Dairy scenario projections for the Nordic Group, % change relative to baseline in 2020
Milk1 Milk2 Milk3 Milk4
Cow milk Production 1,000 tonne 2.2% 2.2% 1.5% 0.7%
Dairy cows ending stock 1,000 head 3.5% 3.5% 2.8% 2.1%
Yield/cow kg/cow -1.3% -1.3% -1.3% -1.4%
Consumption/head kg/head 0.0% 0.0% 0.0% 0.0%
Price euro/100kg -6.3% -6.3% -7.4% -8.5%
Butter
Production 1,000 tonne 1.5% 1.5% 0.2% -0.8%
Domestic use 1,000 tonne 0.9% 0.9% 1.2% 1.5%
Consumption/head kg/head 0.9% 0.9% 1.2% 1.5%
Price euro/100kg -6.3% -6.3% -8.5% -10.2%
SMP
Production 1,000 tonne 0.6% 0.5% -0.7% -1.9%
Domestic use 1,000 tonne 0.3% 0.3% 0.3% 0.3%
Consumption/head kg/head 0.3% 0.3% 0.3% 0.3%
Price euro/100kg -5.0% -5.0% -4.3% -4.2%
WMP
Production 1,000 tonne 0.2% 0.2% -0.5% -1.2%
Domestic use 1,000 tonne 4.5% 4.7% 4.7% 5.0%
Consumption/head kg/head 4.5% 4.7% 4.7% 5.0%
Price euro/100kg -8.2% -8.2% -8.6% -8.8%
Cheese
Production 1,000 tonne 0.5% 0.5% 0.4% 0.2%
Domestic use 1,000 tonne 1.4% 1.4% 1.5% 1.7%
Consumption/head kg/head 1.4% 1.4% 1.5% 1.7%
Price euro/100kg -6.5% -6.5% -6.7% -7.7%
Cream
Production 1,000 tonne 0.7% 0.7% 0.4% 0.2%
Domestic use 1,000 tonne 0.6% 0.6% 0.7% 0.9%
Consumption/head kg/head 0.6% 0.6% 0.7% 0.9%
Price euro/100kg 0.2% 0.2% -0.1% -0.5%
Other fresh products
Production 1,000 tonne 2.6% 2.6% 2.1% 1.6%
Domestic use 1,000 tonne 0.9% 0.9% 1.0% 1.1%
Consumption/head kg/head 0.9% 0.9% 1.0% 1.1%
Price euro/100kg 0.0% 0.0% 0.0% 0.0%
Source: AGMEMOD combined model (2008)

Annexe F: Projections for milk and dairy product markets in individual EU MS
173
Table F 57: Dairy baseline projections for the Western group, 2000-2020 Baseline
2000 2005 2010 2015 2020
2000-2020 (%
growth/year)
2005-2020 (%
growth/year)
Cow milk
Production 1,000 tonne 63,771 63,338 65,257 65,105 64,912 0.1% 0.2%
Dairy cows ending stock 1,000 head 10,494 9,640 9,555 8,997 8,517 -1.0% -0.8%
Yield/cow kg/cow 6,077 6,570 6,830 7,236 7,622 1.1% 1.0%
Consumption/head kg/head NA NA NA NA NA 0.0% 0.0%
Price euro/100kg 28.1 27.5 29.3 30.5 31.4 0.6% 0.9%
Butter
Production 1,000 tonne 1,078 1,028 1,015 987 966 -0.5% -0.4%
Domestic use 1,000 tonne 962 980 988 985 988 0.1% 0.1%
Consumption/head kg/head 6.2 6.1 6.0 5.9 5.8 -0.3% -0.3%
Price euro/100kg 375.3 368.1 365.9 378.6 393.5 0.2% 0.4%
SMP
Production 1,000 tonne 602 615 696 643 590 -0.1% -0.3%
Domestic use 1,000 tonne 663 510 457 465 500 -1.4% -0.1%
Consumption/head kg/head 4.3 3.2 2.8 2.8 3.0 -1.8% -0.5%
Price euro/100kg 238.1 210.0 229.9 232.1 226.0 -0.3% 0.5%
WMP
Production 1,000 tonne 666 545 577 566 554 -0.9% 0.1%
Domestic use 1,000 tonne 268 222 244 268 297 0.5% 2.0%
Consumption/head kg/head 1.7 1.4 1.5 1.6 1.8 0.1% 1.6%
Price euro/100kg 287.0 254.9 260.8 267.9 271.7 -0.3% 0.4%
Cheese
Production 1,000 tonne 3,174 3,378 3,559 3,606 3,635 0.7% 0.5%
Domestic use 1,000 tonne 2,592 2,886 2,972 3,202 3,470 1.5% 1.2%
Consumption/head kg/head 16.7 18.0 18.2 19.2 20.5 1.0% 0.9%
Price euro/100kg 411.7 396.1 405.7 438.8 466.7 0.6% 1.1%
Cream
Production 1,000 tonne 832 893 1,026 1,091 1,153 1.6% 1.7%
Domestic use 1,000 tonne 777 901 1,027 1,105 1,183 2.1% 1.8%
Consumption/head kg/head 5.0 5.6 6.3 6.6 7.0 1.7% 1.5%
Price euro/100kg 29.3 157.7 154.6 159.4 167.1 9.1% 0.4%
Other fresh products
Production 1,000 tonne 2,640 3,016 3,200 3,514 3,836 1.9% 1.6%
Domestic use 1,000 tonne 2,730 3,225 3,579 3,818 4,079 2.0% 1.6%
Consumption/head kg/head 17.6 20.1 21.9 22.9 24.1 1.6% 1.2%
Price euro/100kg 2.8 3.7 3.5 3.1 2.9 0.2% -1.6%
Source: AGMEMOD combined model (2008)
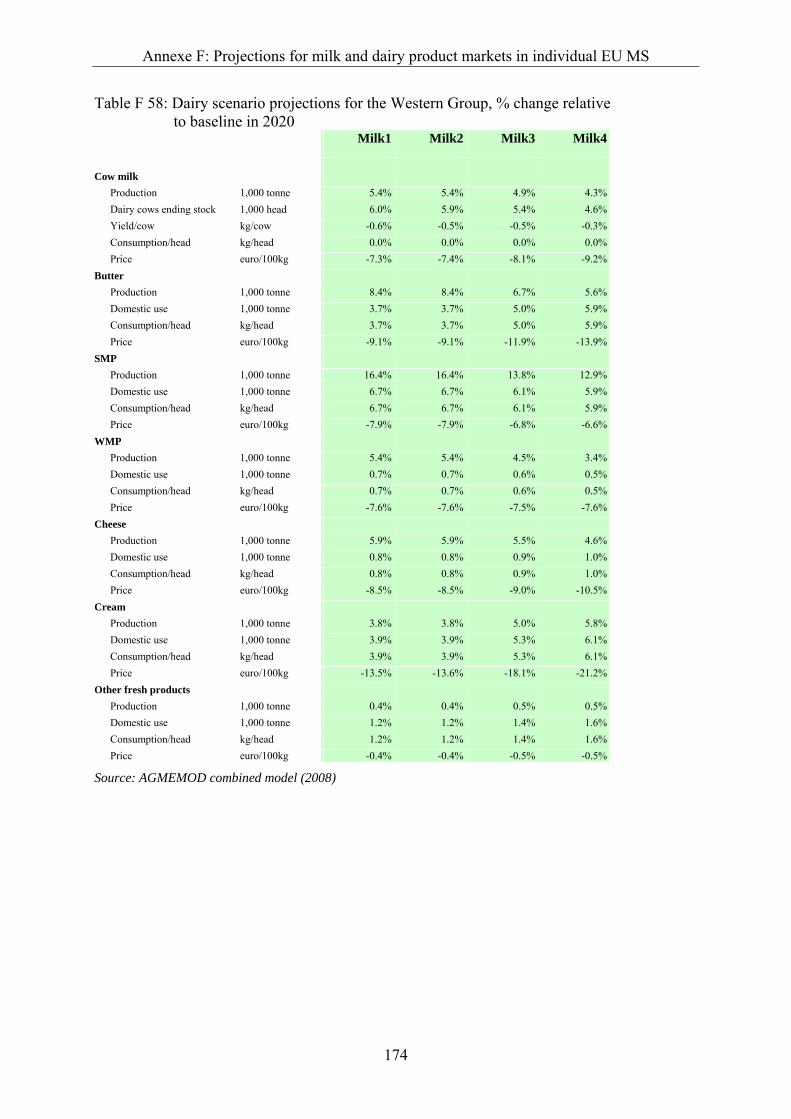
Annexe F: Projections for milk and dairy product markets in individual EU MS
174
Table F 58: Dairy scenario projections for the Western Group, % change relative to baseline in 2020
Milk1 Milk2 Milk3 Milk4
Cow milk Production 1,000 tonne 5.4% 5.4% 4.9% 4.3% Dairy cows ending stock 1,000 head 6.0% 5.9% 5.4% 4.6% Yield/cow kg/cow -0.6% -0.5% -0.5% -0.3% Consumption/head kg/head 0.0% 0.0% 0.0% 0.0% Price euro/100kg -7.3% -7.4% -8.1% -9.2% Butter Production 1,000 tonne 8.4% 8.4% 6.7% 5.6% Domestic use 1,000 tonne 3.7% 3.7% 5.0% 5.9% Consumption/head kg/head 3.7% 3.7% 5.0% 5.9% Price euro/100kg -9.1% -9.1% -11.9% -13.9% SMP Production 1,000 tonne 16.4% 16.4% 13.8% 12.9% Domestic use 1,000 tonne 6.7% 6.7% 6.1% 5.9% Consumption/head kg/head 6.7% 6.7% 6.1% 5.9% Price euro/100kg -7.9% -7.9% -6.8% -6.6% WMP Production 1,000 tonne 5.4% 5.4% 4.5% 3.4% Domestic use 1,000 tonne 0.7% 0.7% 0.6% 0.5% Consumption/head kg/head 0.7% 0.7% 0.6% 0.5% Price euro/100kg -7.6% -7.6% -7.5% -7.6% Cheese Production 1,000 tonne 5.9% 5.9% 5.5% 4.6% Domestic use 1,000 tonne 0.8% 0.8% 0.9% 1.0% Consumption/head kg/head 0.8% 0.8% 0.9% 1.0% Price euro/100kg -8.5% -8.5% -9.0% -10.5% Cream Production 1,000 tonne 3.8% 3.8% 5.0% 5.8% Domestic use 1,000 tonne 3.9% 3.9% 5.3% 6.1% Consumption/head kg/head 3.9% 3.9% 5.3% 6.1% Price euro/100kg -13.5% -13.6% -18.1% -21.2% Other fresh products Production 1,000 tonne 0.4% 0.4% 0.5% 0.5% Domestic use 1,000 tonne 1.2% 1.2% 1.4% 1.6% Consumption/head kg/head 1.2% 1.2% 1.4% 1.6% Price euro/100kg -0.4% -0.4% -0.5% -0.5%
Source: AGMEMOD combined model (2008)

Annexe F: Projections for milk and dairy product markets in individual EU MS
175
Table F 59: Dairy baseline projections for the Mid-East group, 2000-2020 Baseline
2000 2005 2010 2015 2020
2000-2020 (%
growth/year)
2005-2020 (%
growth/year)
Cow milk
Production 1,000 tonne 46,164 46,384 47,367 46,786 46,278 0.0% 0.0%
Dairy cows ending stock 1,000 head 8,643 8,122 7,679 7,076 6,562 -1.4% -1.4%
Yield/cow kg/cow 5,341 5,711 6,168 6,612 7,053 1.4% 1.4%
Consumption/head kg/head NA NA NA NA NA 0.0% 0.0%
Price euro/100kg 26.3 26.3 29.4 30.4 31.1 0.8% 1.1%
Butter
Production 1,000 tonne 659 715 710 692 684 0.2% -0.3%
Domestic use 1,000 tonne 743 752 754 762 772 0.2% 0.2%
Consumption/head kg/head 5.1 5.1 5.2 5.2 5.3 0.2% 0.2%
Price euro/100kg 297.8 287.4 300.6 314.9 331.1 0.5% 0.9%
SMP
Production 1,000 tonne 512 441 483 450 424 -0.9% -0.3%
Domestic use 1,000 tonne 232 156 177 173 171 -1.5% 0.6%
Consumption/head kg/head 1.6 1.1 1.2 1.2 1.2 -1.5% 0.7%
Price euro/100kg 226.2 189.7 226.2 223.3 217.1 -0.2% 0.9%
WMP
Production 1,000 tonne 244 226 221 179 139 -2.8% -3.2%
Domestic use 1,000 tonne 184 185 198 219 241 1.4% 1.8%
Consumption/head kg/head 1.3 1.3 1.3 1.5 1.7 1.4% 1.9%
Price euro/100kg 267.4 237.2 273.4 272.0 268.0 0.0% 0.8%
Cheese
Production 1,000 tonne 2,576 3,006 3,109 3,145 3,165 1.0% 0.3%
Domestic use 1,000 tonne 2,358 2,511 2,619 2,658 2,687 0.7% 0.5%
Consumption/head kg/head 16.1 17.1 17.9 18.2 18.5 0.7% 0.5%
Price euro/100kg 376.5 339.9 357.1 386.0 409.3 0.4% 1.2%
Cream
Production 1,000 tonne 887 1,054 1,099 1,126 1,152 1.3% 0.6%
Domestic use 1,000 tonne 855 971 1,000 1,029 1,055 1.1% 0.6%
Consumption/head kg/head 5.8 6.6 6.8 7.0 7.3 1.1% 0.6%
Price euro/100kg 196.6 169.7 182.8 190.7 197.7 0.0% 1.0%
Other fresh products
Production 1,000 tonne 3,290 3,674 3,729 3,970 4,220 1.3% 0.9%
Domestic use 1,000 tonne 2,853 3,150 3,290 3,577 3,875 1.5% 1.4%
Consumption/head kg/head 19.5 21.5 22.5 24.5 26.7 1.6% 1.4%
Price euro/100kg 97.9 96.7 122.6 129.4 136.1 1.7% 2.3%
Source: AGMEMOD combined model (2008)
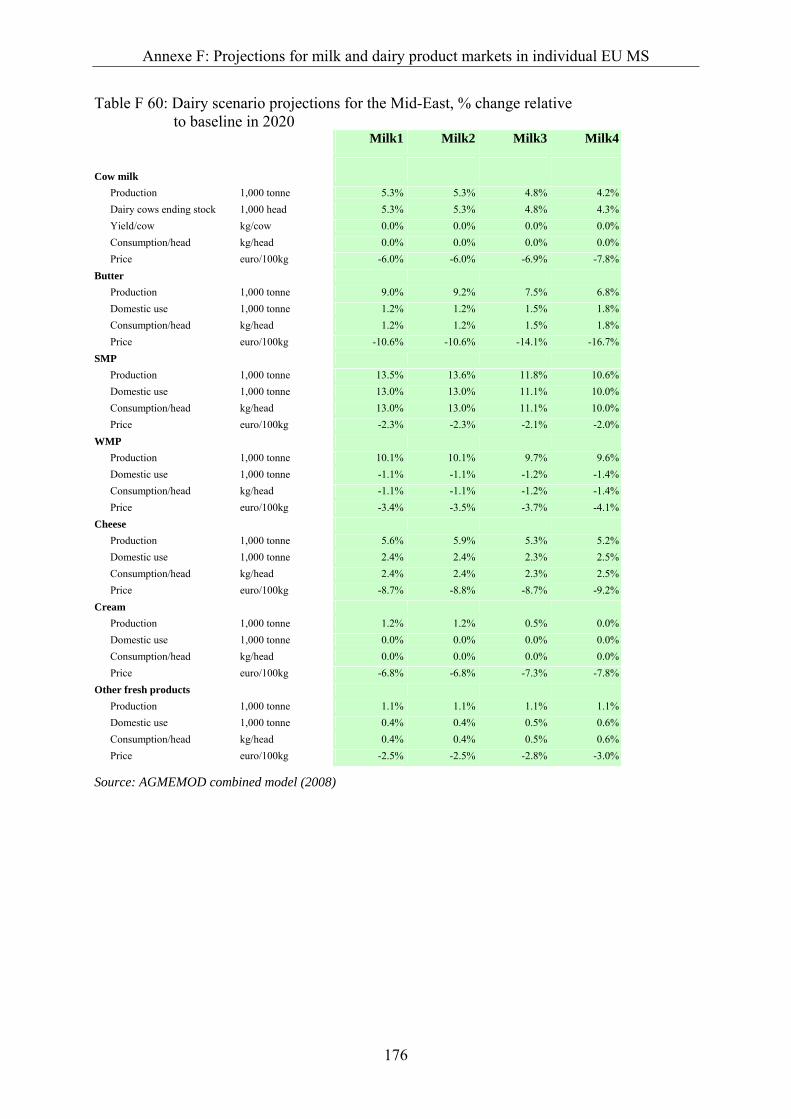
Annexe F: Projections for milk and dairy product markets in individual EU MS
176
Table F 60: Dairy scenario projections for the Mid-East, % change relative to baseline in 2020
Milk1 Milk2 Milk3 Milk4
Cow milk Production 1,000 tonne 5.3% 5.3% 4.8% 4.2% Dairy cows ending stock 1,000 head 5.3% 5.3% 4.8% 4.3% Yield/cow kg/cow 0.0% 0.0% 0.0% 0.0% Consumption/head kg/head 0.0% 0.0% 0.0% 0.0% Price euro/100kg -6.0% -6.0% -6.9% -7.8% Butter Production 1,000 tonne 9.0% 9.2% 7.5% 6.8% Domestic use 1,000 tonne 1.2% 1.2% 1.5% 1.8% Consumption/head kg/head 1.2% 1.2% 1.5% 1.8% Price euro/100kg -10.6% -10.6% -14.1% -16.7% SMP Production 1,000 tonne 13.5% 13.6% 11.8% 10.6% Domestic use 1,000 tonne 13.0% 13.0% 11.1% 10.0% Consumption/head kg/head 13.0% 13.0% 11.1% 10.0% Price euro/100kg -2.3% -2.3% -2.1% -2.0% WMP Production 1,000 tonne 10.1% 10.1% 9.7% 9.6% Domestic use 1,000 tonne -1.1% -1.1% -1.2% -1.4% Consumption/head kg/head -1.1% -1.1% -1.2% -1.4% Price euro/100kg -3.4% -3.5% -3.7% -4.1% Cheese Production 1,000 tonne 5.6% 5.9% 5.3% 5.2% Domestic use 1,000 tonne 2.4% 2.4% 2.3% 2.5% Consumption/head kg/head 2.4% 2.4% 2.3% 2.5% Price euro/100kg -8.7% -8.8% -8.7% -9.2% Cream Production 1,000 tonne 1.2% 1.2% 0.5% 0.0% Domestic use 1,000 tonne 0.0% 0.0% 0.0% 0.0% Consumption/head kg/head 0.0% 0.0% 0.0% 0.0% Price euro/100kg -6.8% -6.8% -7.3% -7.8% Other fresh products Production 1,000 tonne 1.1% 1.1% 1.1% 1.1% Domestic use 1,000 tonne 0.4% 0.4% 0.5% 0.6% Consumption/head kg/head 0.4% 0.4% 0.5% 0.6% Price euro/100kg -2.5% -2.5% -2.8% -3.0%
Source: AGMEMOD combined model (2008)
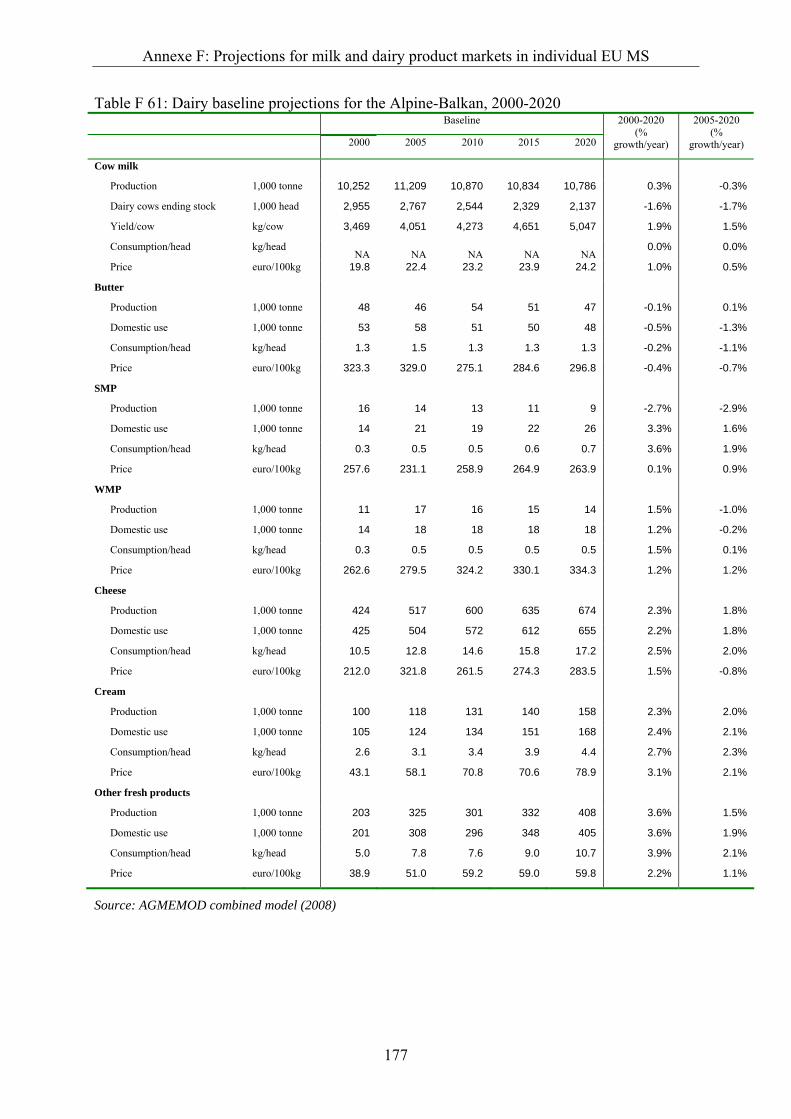
Annexe F: Projections for milk and dairy product markets in individual EU MS
177
Table F 61: Dairy baseline projections for the Alpine-Balkan, 2000-2020 Baseline
2000 2005 2010 2015 2020
2000-2020 (%
growth/year)
2005-2020 (%
growth/year)
Cow milk
Production 1,000 tonne 10,252 11,209 10,870 10,834 10,786 0.3% -0.3%
Dairy cows ending stock 1,000 head 2,955 2,767 2,544 2,329 2,137 -1.6% -1.7%
Yield/cow kg/cow 3,469 4,051 4,273 4,651 5,047 1.9% 1.5%
Consumption/head kg/head NA NA NA NA NA
0.0% 0.0%
Price euro/100kg 19.8 22.4 23.2 23.9 24.2 1.0% 0.5%
Butter
Production 1,000 tonne 48 46 54 51 47 -0.1% 0.1%
Domestic use 1,000 tonne 53 58 51 50 48 -0.5% -1.3%
Consumption/head kg/head 1.3 1.5 1.3 1.3 1.3 -0.2% -1.1%
Price euro/100kg 323.3 329.0 275.1 284.6 296.8 -0.4% -0.7%
SMP
Production 1,000 tonne 16 14 13 11 9 -2.7% -2.9%
Domestic use 1,000 tonne 14 21 19 22 26 3.3% 1.6%
Consumption/head kg/head 0.3 0.5 0.5 0.6 0.7 3.6% 1.9%
Price euro/100kg 257.6 231.1 258.9 264.9 263.9 0.1% 0.9%
WMP
Production 1,000 tonne 11 17 16 15 14 1.5% -1.0%
Domestic use 1,000 tonne 14 18 18 18 18 1.2% -0.2%
Consumption/head kg/head 0.3 0.5 0.5 0.5 0.5 1.5% 0.1%
Price euro/100kg 262.6 279.5 324.2 330.1 334.3 1.2% 1.2%
Cheese
Production 1,000 tonne 424 517 600 635 674 2.3% 1.8%
Domestic use 1,000 tonne 425 504 572 612 655 2.2% 1.8%
Consumption/head kg/head 10.5 12.8 14.6 15.8 17.2 2.5% 2.0%
Price euro/100kg 212.0 321.8 261.5 274.3 283.5 1.5% -0.8%
Cream
Production 1,000 tonne 100 118 131 140 158 2.3% 2.0%
Domestic use 1,000 tonne 105 124 134 151 168 2.4% 2.1%
Consumption/head kg/head 2.6 3.1 3.4 3.9 4.4 2.7% 2.3%
Price euro/100kg 43.1 58.1 70.8 70.6 78.9 3.1% 2.1%
Other fresh products
Production 1,000 tonne 203 325 301 332 408 3.6% 1.5%
Domestic use 1,000 tonne 201 308 296 348 405 3.6% 1.9%
Consumption/head kg/head 5.0 7.8 7.6 9.0 10.7 3.9% 2.1%
Price euro/100kg 38.9 51.0 59.2 59.0 59.8 2.2% 1.1%
Source: AGMEMOD combined model (2008)
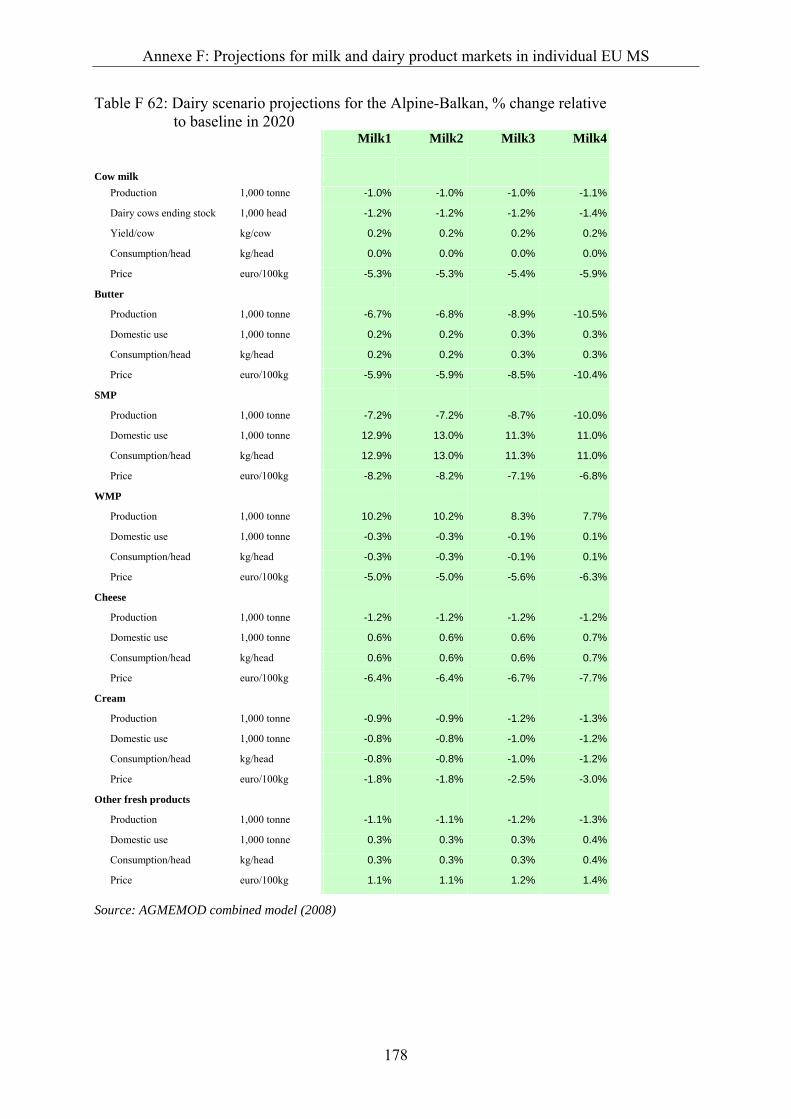
Annexe F: Projections for milk and dairy product markets in individual EU MS
178
Table F 62: Dairy scenario projections for the Alpine-Balkan, % change relative to baseline in 2020
Milk1 Milk2 Milk3 Milk4
Cow milk Production 1,000 tonne -1.0% -1.0% -1.0% -1.1%
Dairy cows ending stock 1,000 head -1.2% -1.2% -1.2% -1.4%
Yield/cow kg/cow 0.2% 0.2% 0.2% 0.2%
Consumption/head kg/head 0.0% 0.0% 0.0% 0.0%
Price euro/100kg -5.3% -5.3% -5.4% -5.9%
Butter
Production 1,000 tonne -6.7% -6.8% -8.9% -10.5%
Domestic use 1,000 tonne 0.2% 0.2% 0.3% 0.3%
Consumption/head kg/head 0.2% 0.2% 0.3% 0.3%
Price euro/100kg -5.9% -5.9% -8.5% -10.4%
SMP
Production 1,000 tonne -7.2% -7.2% -8.7% -10.0%
Domestic use 1,000 tonne 12.9% 13.0% 11.3% 11.0%
Consumption/head kg/head 12.9% 13.0% 11.3% 11.0%
Price euro/100kg -8.2% -8.2% -7.1% -6.8%
WMP
Production 1,000 tonne 10.2% 10.2% 8.3% 7.7%
Domestic use 1,000 tonne -0.3% -0.3% -0.1% 0.1%
Consumption/head kg/head -0.3% -0.3% -0.1% 0.1%
Price euro/100kg -5.0% -5.0% -5.6% -6.3%
Cheese
Production 1,000 tonne -1.2% -1.2% -1.2% -1.2%
Domestic use 1,000 tonne 0.6% 0.6% 0.6% 0.7%
Consumption/head kg/head 0.6% 0.6% 0.6% 0.7%
Price euro/100kg -6.4% -6.4% -6.7% -7.7%
Cream
Production 1,000 tonne -0.9% -0.9% -1.2% -1.3%
Domestic use 1,000 tonne -0.8% -0.8% -1.0% -1.2%
Consumption/head kg/head -0.8% -0.8% -1.0% -1.2%
Price euro/100kg -1.8% -1.8% -2.5% -3.0%
Other fresh products
Production 1,000 tonne -1.1% -1.1% -1.2% -1.3%
Domestic use 1,000 tonne 0.3% 0.3% 0.3% 0.4%
Consumption/head kg/head 0.3% 0.3% 0.3% 0.4%
Price euro/100kg 1.1% 1.1% 1.2% 1.4%
Source: AGMEMOD combined model (2008)

Annexe F: Projections for milk and dairy product markets in individual EU MS
179
Table F 63: Dairy baseline projections for the South Group, 2000-2020 Baseline
2000 2005 2010 2015 2020
2000-2020 (%
growth/year)
2005-2020 (%
growth/year)
Cow milk
Production 1,000 tonne 19,913 20,327 20,876 20,916 20,928 0.2% 0.2%
Dairy cows ending stock 1,000 head 3,443 3,400 3,339 3,045 2,791 -1.0% -1.3%
Yield/cow kg/cow 5,784 5,978 6,251 6,868 7,498 1.3% 1.5%
Consumption/head kg/head NA NA NA NA NA 0.0% 0.0%
Price euro/100kg 32.0 32.2 32.2 34.5 36.6 0.7% 0.8%
Butter
Production 1,000 tonne 196 222 237 232 226 0.7% 0.1%
Domestic use 1,000 tonne 229 232 250 257 263 0.7% 0.8%
Consumption/head kg/head 1.9 1.9 2.0 2.1 2.1 0.5% 0.7%
Price euro/100kg 359.0 429.5 339.6 358.8 380.2 0.3% -0.8%
SMP
Production 1,000 tonne 22 16 15 14 14 -2.4% -1.2%
Domestic use 1,000 tonne 137 138 112 95 79 -2.7% -3.7%
Consumption/head kg/head 1.2 1.1 0.9 0.8 0.6 -2.9% -3.8%
Price euro/100kg 225.3 197.0 232.6 236.7 232.9 0.2% 1.1%
WMP
Production 1,000 tonne 19 20 17 16 14 -1.4% -2.3%
Domestic use 1,000 tonne 58 73 62 63 61 0.2% -1.2%
Consumption/head kg/head 0.5 0.6 0.5 0.5 0.5 0.0% -1.4%
Price euro/100kg 122.1 204.9 248.4 250.5 255.4 3.8% 1.5%
Cheese
Production 1,000 tonne 1,653 1,703 1,802 1,845 1,883 0.7% 0.7%
Domestic use 1,000 tonne 1,936 2,058 2,152 2,211 2,269 0.8% 0.7%
Consumption/head kg/head 16.4 17.0 17.5 17.9 18.4 0.6% 0.5%
Price euro/100kg 741.7 727.6 779.3 845.2 903.3 1.0% 1.5%
Cream
Production 1,000 tonne 236 205 199 201 202 -0.8% -0.1%
Domestic use 1,000 tonne 251 225 232 236 240 -0.2% 0.4%
Consumption/head kg/head 2.1 1.9 1.9 1.9 1.9 -0.5% 0.3%
Price euro/100kg 76.0 89.8 93.3 94.6 95.8 1.2% 0.4%
Other fresh products
Production 1,000 tonne 1,301 1,540 1,806 2,014 2,244 2.8% 2.5%
Domestic use 1,000 tonne 1,599 2,110 2,414 2,646 2,905 3.0% 2.2%
Consumption/head kg/head 13.5 17.4 19.7 21.4 23.5 2.8% 2.0%
Price euro/100kg 18.6 19.2 16.4 14.7 13.2 -1.7% -2.5%
Source: AGMEMOD combined model (2008)
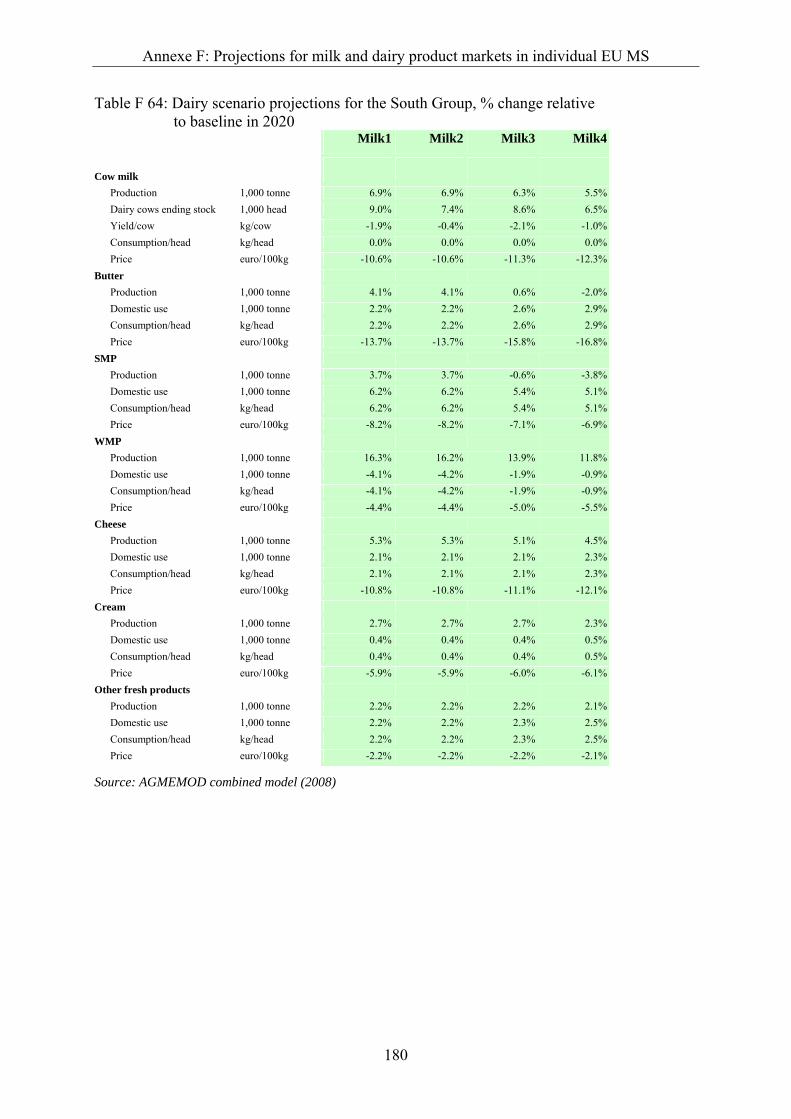
Annexe F: Projections for milk and dairy product markets in individual EU MS
180
Table F 64: Dairy scenario projections for the South Group, % change relative to baseline in 2020
Milk1 Milk2 Milk3 Milk4
Cow milk Production 1,000 tonne 6.9% 6.9% 6.3% 5.5% Dairy cows ending stock 1,000 head 9.0% 7.4% 8.6% 6.5% Yield/cow kg/cow -1.9% -0.4% -2.1% -1.0% Consumption/head kg/head 0.0% 0.0% 0.0% 0.0% Price euro/100kg -10.6% -10.6% -11.3% -12.3% Butter Production 1,000 tonne 4.1% 4.1% 0.6% -2.0% Domestic use 1,000 tonne 2.2% 2.2% 2.6% 2.9% Consumption/head kg/head 2.2% 2.2% 2.6% 2.9% Price euro/100kg -13.7% -13.7% -15.8% -16.8% SMP Production 1,000 tonne 3.7% 3.7% -0.6% -3.8% Domestic use 1,000 tonne 6.2% 6.2% 5.4% 5.1% Consumption/head kg/head 6.2% 6.2% 5.4% 5.1% Price euro/100kg -8.2% -8.2% -7.1% -6.9% WMP Production 1,000 tonne 16.3% 16.2% 13.9% 11.8% Domestic use 1,000 tonne -4.1% -4.2% -1.9% -0.9% Consumption/head kg/head -4.1% -4.2% -1.9% -0.9% Price euro/100kg -4.4% -4.4% -5.0% -5.5% Cheese Production 1,000 tonne 5.3% 5.3% 5.1% 4.5% Domestic use 1,000 tonne 2.1% 2.1% 2.1% 2.3% Consumption/head kg/head 2.1% 2.1% 2.1% 2.3% Price euro/100kg -10.8% -10.8% -11.1% -12.1% Cream Production 1,000 tonne 2.7% 2.7% 2.7% 2.3% Domestic use 1,000 tonne 0.4% 0.4% 0.4% 0.5% Consumption/head kg/head 0.4% 0.4% 0.4% 0.5% Price euro/100kg -5.9% -5.9% -6.0% -6.1% Other fresh products Production 1,000 tonne 2.2% 2.2% 2.2% 2.1% Domestic use 1,000 tonne 2.2% 2.2% 2.3% 2.5% Consumption/head kg/head 2.2% 2.2% 2.3% 2.5% Price euro/100kg -2.2% -2.2% -2.2% -2.1%
Source: AGMEMOD combined model (2008)
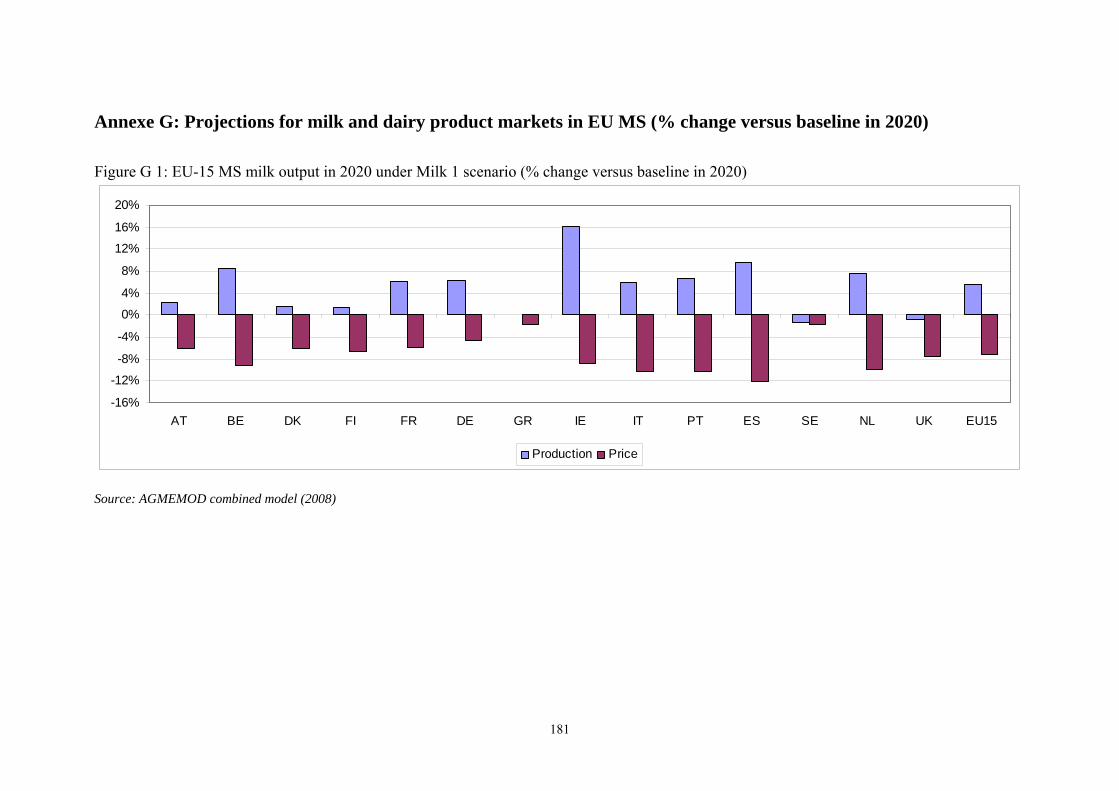
181
Annexe G: Projections for milk and dairy product markets in EU MS (% change versus baseline in 2020)
Figure G 1: EU-15 MS milk output in 2020 under Milk 1 scenario (% change versus baseline in 2020)
-16%
-12%
-8%
-4%
0%
4%
8%
12%
16%
20%
AT BE DK FI FR DE GR IE IT PT ES SE NL UK EU15
Production Price
Source: AGMEMOD combined model (2008)
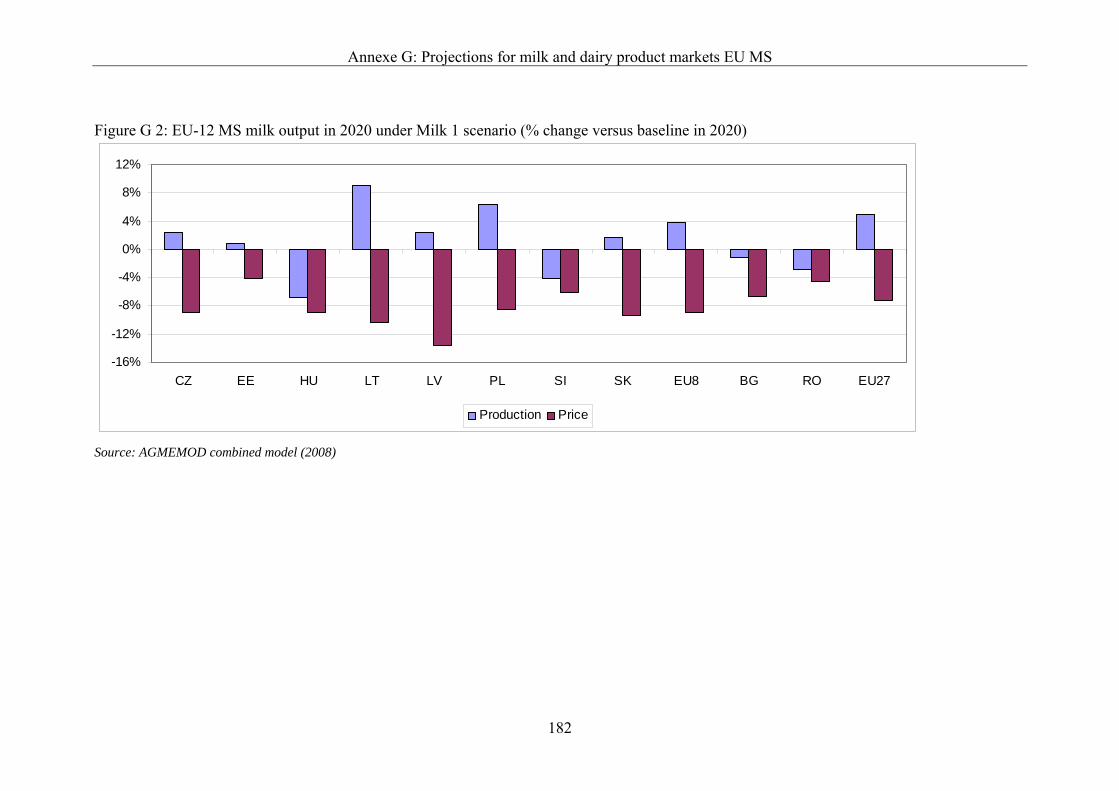
Annexe G: Projections for milk and dairy product markets EU MS
182
Figure G 2: EU-12 MS milk output in 2020 under Milk 1 scenario (% change versus baseline in 2020)
-16%
-12%
-8%
-4%
0%
4%
8%
12%
CZ EE HU LT LV PL SI SK EU8 BG RO EU27
Production Price
Source: AGMEMOD combined model (2008)
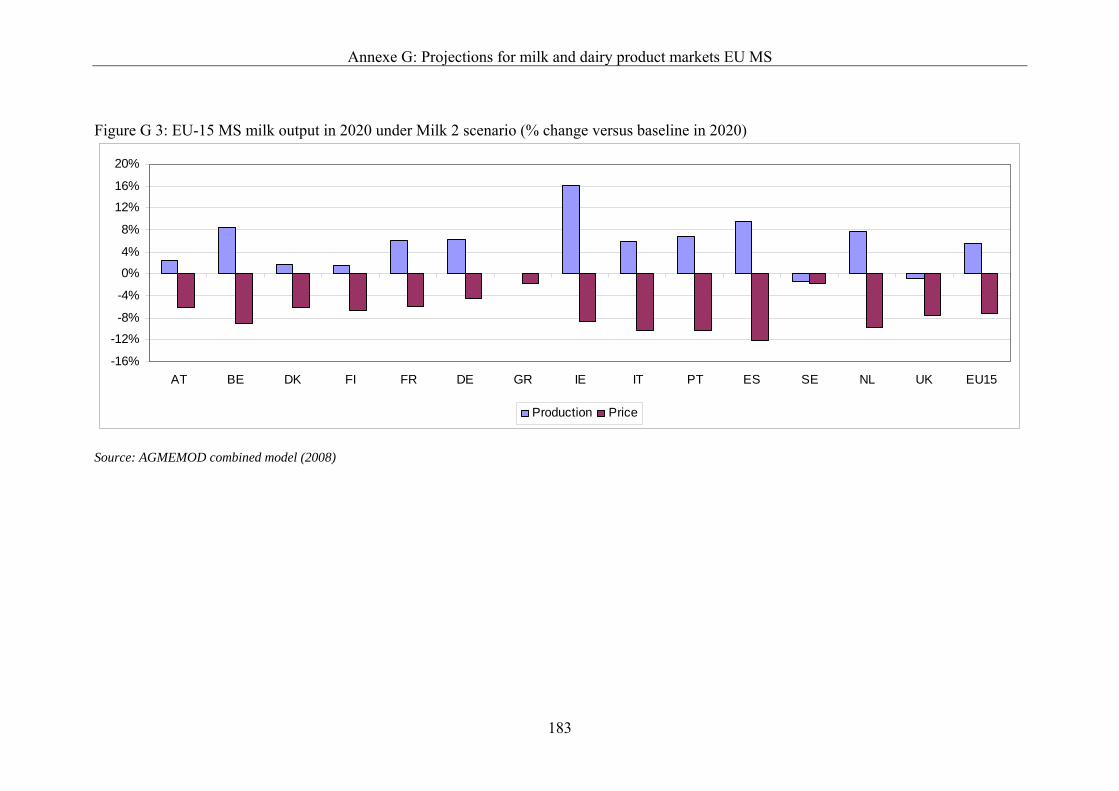
Annexe G: Projections for milk and dairy product markets EU MS
183
Figure G 3: EU-15 MS milk output in 2020 under Milk 2 scenario (% change versus baseline in 2020)
-16%
-12%
-8%
-4%
0%
4%
8%
12%
16%
20%
AT BE DK FI FR DE GR IE IT PT ES SE NL UK EU15
Production Price
Source: AGMEMOD combined model (2008)
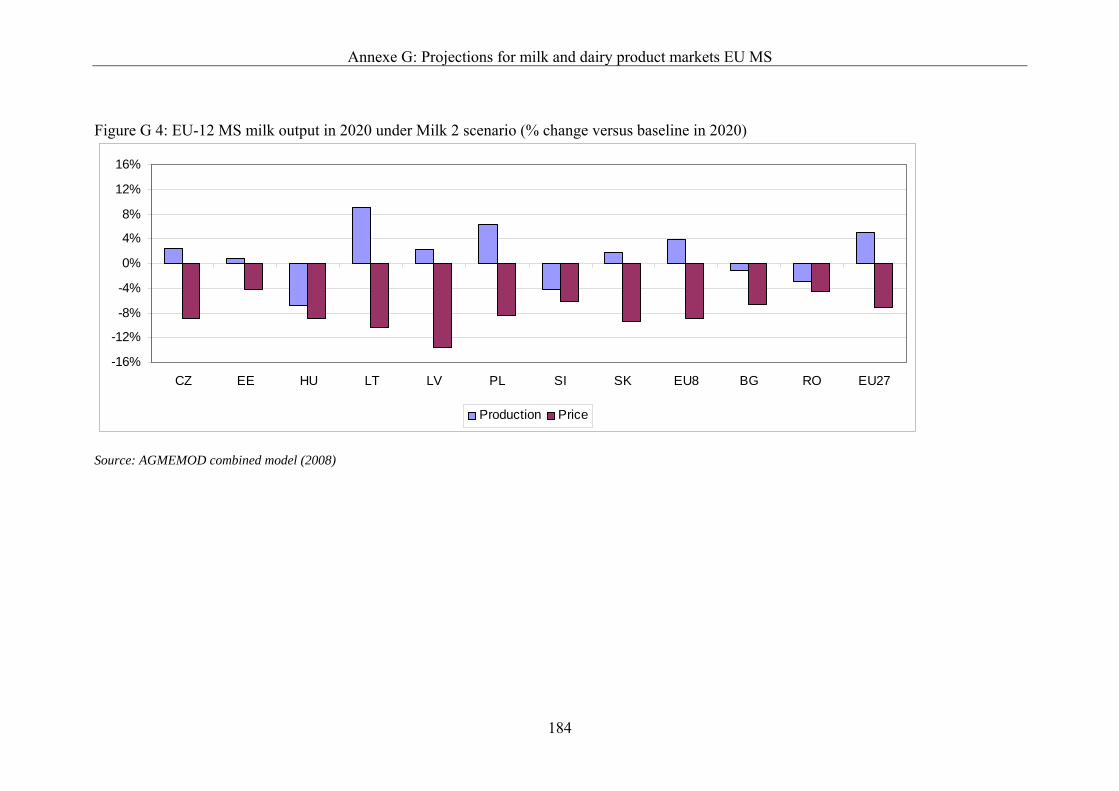
Annexe G: Projections for milk and dairy product markets EU MS
184
Figure G 4: EU-12 MS milk output in 2020 under Milk 2 scenario (% change versus baseline in 2020)
-16%
-12%
-8%
-4%
0%
4%
8%
12%
16%
CZ EE HU LT LV PL SI SK EU8 BG RO EU27
Production Price
Source: AGMEMOD combined model (2008)
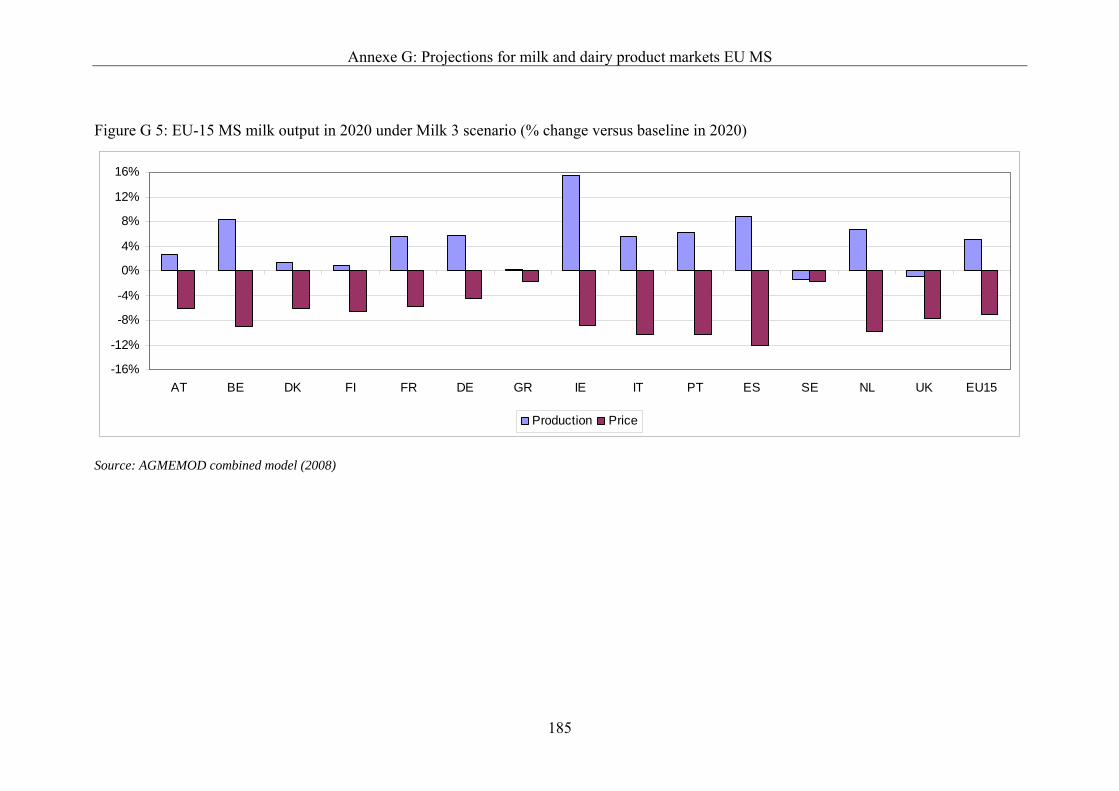
Annexe G: Projections for milk and dairy product markets EU MS
185
Figure G 5: EU-15 MS milk output in 2020 under Milk 3 scenario (% change versus baseline in 2020)
-16%
-12%
-8%
-4%
0%
4%
8%
12%
16%
AT BE DK FI FR DE GR IE IT PT ES SE NL UK EU15
Production Price
Source: AGMEMOD combined model (2008)
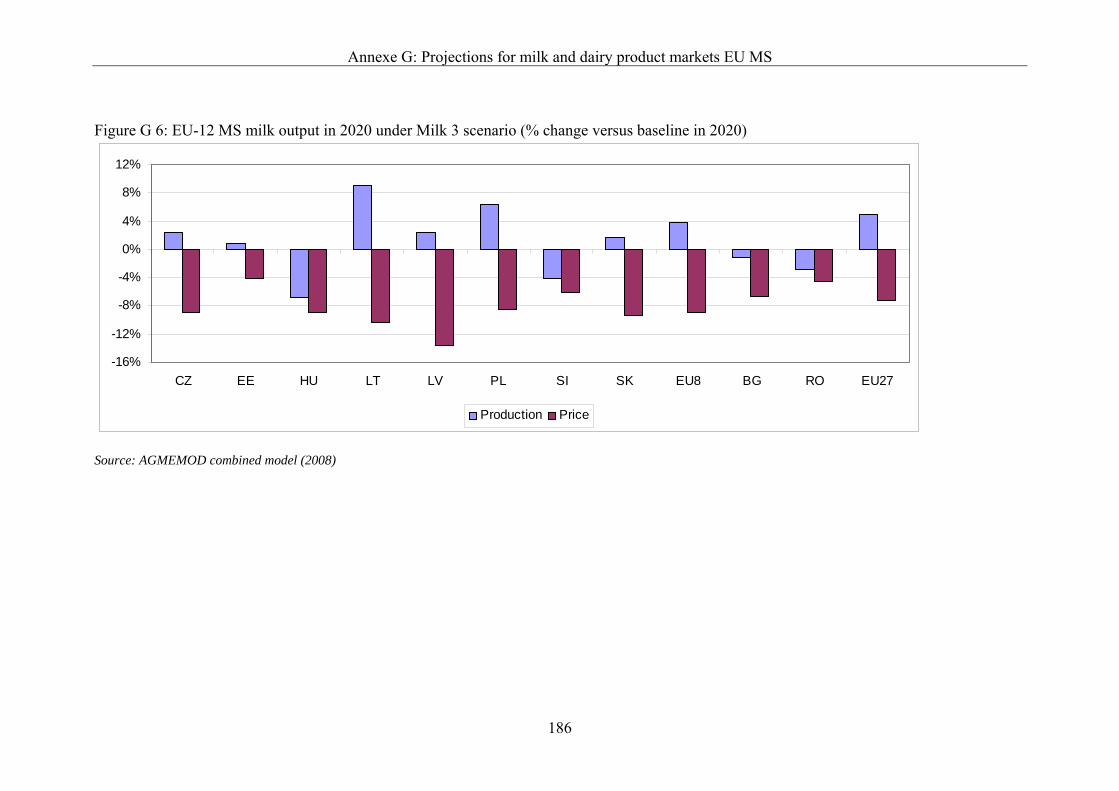
Annexe G: Projections for milk and dairy product markets EU MS
186
Figure G 6: EU-12 MS milk output in 2020 under Milk 3 scenario (% change versus baseline in 2020)
-16%
-12%
-8%
-4%
0%
4%
8%
12%
CZ EE HU LT LV PL SI SK EU8 BG RO EU27
Production Price
Source: AGMEMOD combined model (2008)
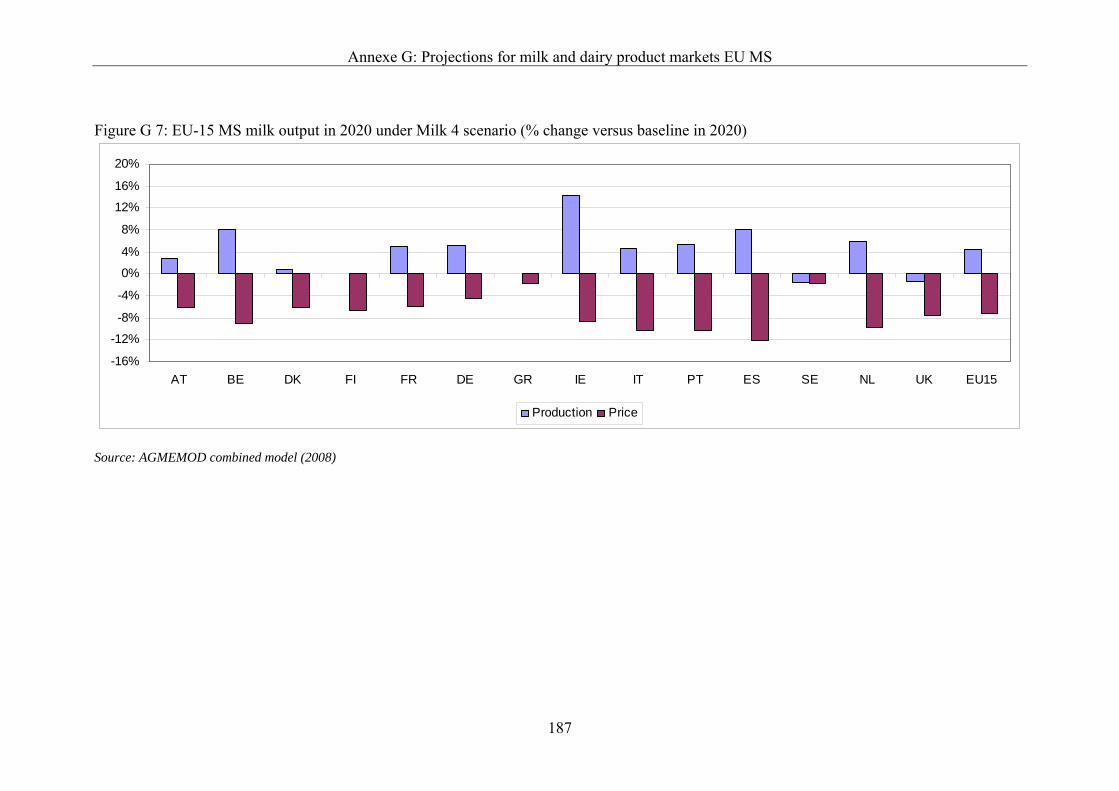
Annexe G: Projections for milk and dairy product markets EU MS
187
Figure G 7: EU-15 MS milk output in 2020 under Milk 4 scenario (% change versus baseline in 2020)
-16%
-12%
-8%
-4%
0%
4%
8%
12%
16%
20%
AT BE DK FI FR DE GR IE IT PT ES SE NL UK EU15
Production Price
Source: AGMEMOD combined model (2008)
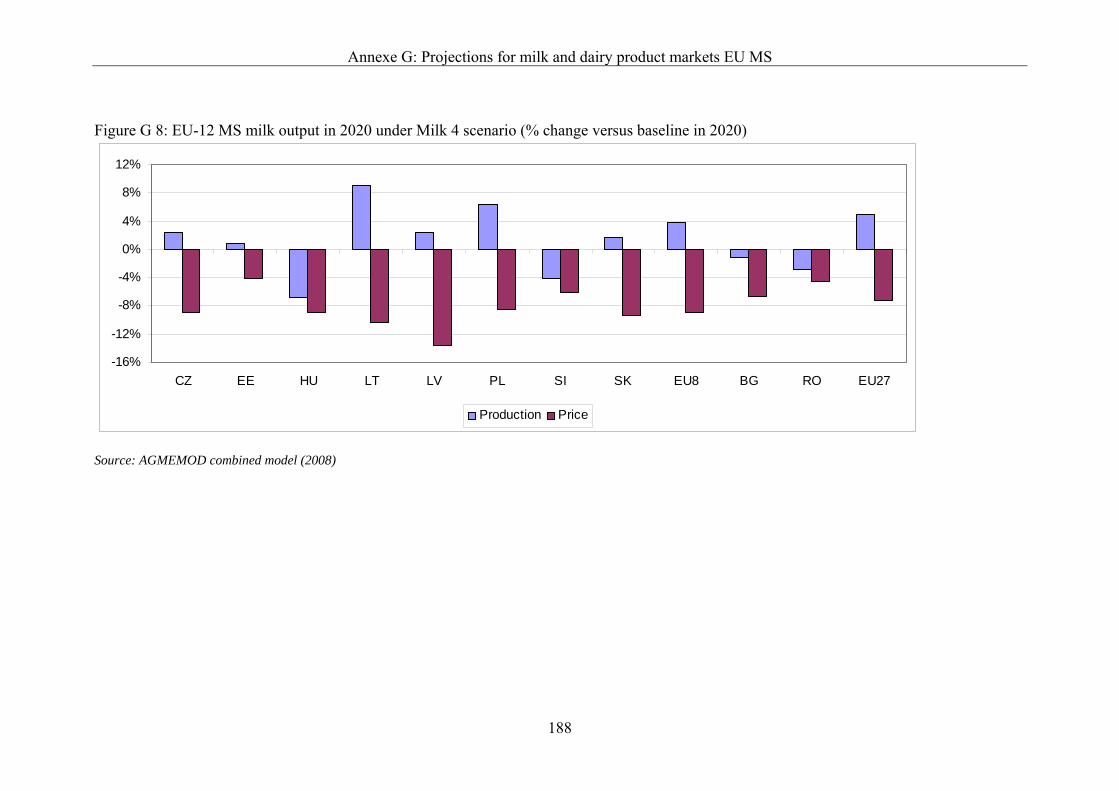
Annexe G: Projections for milk and dairy product markets EU MS
188
Figure G 8: EU-12 MS milk output in 2020 under Milk 4 scenario (% change versus baseline in 2020)
-16%
-12%
-8%
-4%
0%
4%
8%
12%
CZ EE HU LT LV PL SI SK EU8 BG RO EU27
Production Price
Source: AGMEMOD combined model (2008)
European Commission
EUR 23833 EN/1 – Joint Research Centre – Institute for Prospective Technological Studies
Title: Modelling and Analysis of the European Milk and Dairy Market
Authors: AGMEMOD Consortium
Editors: Lubica Bartova, Thomas Fellmann and Robert M'barek
Luxembourg: Office for Official Publications of the European Communities
2009
EUR – Scientific and Technical Research series – ISSN 1018-5593
ISBN 978-92-79-12487-7
DOI 10.2791/10843
Abstract
This report is based on the outcome of a study carried out by the AGMEMOD Consortium under the management of the Agricultural Economics Research Institute (LEI), in cooperation with the European Commission's Joint Research Centre – Institute for Prospective Technological Studies (JRC-IPTS).
The report provides a quantitative assessment of possible implications of a dairy policy reform and other policy adjustments on the milk and dairy market as well as on other agricultural markets in the EU-27, EU-15, EU-12, the individual Member States and their regional groupings using the AGMEMOD model.
How to obtain EU publications
Our priced publications are available from EU Bookshop (http://bookshop.europa.eu), where you can place an order with the sales agent of your choice.
The Publications Office has a worldwide network of sales agents. You can obtain their contact details by sending a fax to (352) 29 29-42758.
The mission of the JRC is to provide customer-driven scientific and technical support for the conception, development, implementation and monitoring of EU policies. As aservice of the European Commission, the JRC functions as a reference centre of science and technology for the Union. Close to the policy-making process, it serves the common interest of the Member States, while being independent of specialinterests, whether private or national.
LF N
A 23833 EN
C