Embed Size (px)
Citation preview
Department of Mechanical and Aerospace Engineering
Modelling & Analysis of a Vortex Micro-Hydro Plant
& Solar PV Hybrid System for Off-grid Rural
Electrification in India
Author: Evelin Kurian
Supervisor: Daniel Costola
A thesis submitted in partial fulfilment for the requirement of the degree
Master of Science
Sustainable Engineering: Renewable Energy Systems and the Environment
2019

Copyright Declaration
This thesis is the result of the author’s original research. It has been composed by the
author and has not been previously submitted for examination which has led to the
award of a degree.
The copyright of this thesis belongs to the author under the terms of the United
Kingdom Copyright Acts as qualified by University of Strathclyde Regulation 3.50.
Due acknowledgement must always be made of the use of any material contained in,
or derived from, this thesis.
Signed: Evelin Kurian Date: 23/09/19
3
Abstract
In developing countries especially India and Africa, electrifying the sparsely remote
rural communities is still a challenging issue for the power sector. This is mainly
because of the huge costs involved due to inaccessibility, interrupted power supply,
and high transmission losses. Hence, establishing that the dependence on a
decentralized power system is better than grid power.
In order to meet with the energy requirements of the unelectrified rural communities,
the project focusses on a renewable hybrid solution for a village, located along the
banks of a perennial river in Central India. The chosen system configuration consists
of a low cost, highly efficient and easily installable micro-hydro vortex turbine, that
harnesses electricity from the flowing water. This damless run off river scheme
technology suitable for low-flow and low-head sites is combined with PV and energy
storage since the area receives high annual solar energy.
This system is modelled using HOMER and validated through financial analysis, for
both household and community loads of the village. It is modelled based on certain
assumptions from previous studies and existing projects, ensuring the results obtained
to meet the energy needs, with only a negligible proportion of unmet electricity/year.
An economic analysis conducted from the results proved the feasibility of the project.
If the energy demands of the system are increased in the future, more vortex micro
hydro-turbines can be installed at different locations of the same river, to meet the
requirements.
The optimized system enhances the autonomy of renewables with its robust
methodology, which can be applied to other similar unelectrified remote rural villages
in developing countries, located along the banks of the river.
A solar energy plan is also proposed for the village that takes into account other
requirements, such as street lighting, cooking for household and community level,
irrigation needs, water supply, and household lighting.

4
Acknowledgement
I am extremely grateful to my project supervisor, Dr Daniel Costola, for his valuable
feedbacks and meticulous methods of evaluation. I thank you for your accurate
observations and complete support throughout the length of the project.
I would like to express my sincere appreciation and gratitude to Dr Paul Tuohy for his
guidance and assistance. I thank you for giving me opportunities to enhance my skills
on the practical applications of the course.
Furthermore, I would like to extend my acknowledgement to the exceptional faculty
in the Department of Mechanical and Aerospace Engineering.
I would like to thank all my fellow classmates and friends for their help and ideas in
the term of my studies.
A special thanks to my family for their tremendous support and encouragement
throughout my academic career and above all, I would like to thank God Almighty for
his blessings.
5
Table of Contents
Abstract .......................................................................................................................... 3
Acknowledgement ......................................................................................................... 4
Table of Contents ........................................................................................................... 5
List of Figures ................................................................................................................ 8
1. List of Tables ........................................................................................................ 10
List of Equations .......................................................................................................... 11
Chapter 1: Introduction ............................................................................................... 12
1.1. Problem Definition ........................................................................................ 12
1.2. Overall Aim & Objectives............................................................................. 14
1.3. Methodology ................................................................................................... 14
1.4. Thesis outline .................................................................................................. 15
Chapter 2: Literature Review ....................................................................................... 16
2.1. Challenges of Rural Electrification in Developing Countries ....................... 16
2.2. Rural Electrification using Renewable Sources ............................................ 18
2.3. Energy statistics of India ............................................................................... 20
2.3.1. Electrification Scenario .......................................................................... 24
2.3.2. Scope of renewables .............................................................................. 26
2.4. A Study of Micro-hydro & Solar Systems .................................................... 28
Chapter 3: Methodology .............................................................................................. 32
3.1. Introduction ....................................................................................................... 32
3.1.1. Design of Vortex Micro-Hydro Plant .................................................... 33
3.1.2. Working ................................................................................................. 35
6
3.1.3. Vortex Micro-Hydro Power Plant Projects ................................................. 36
3.1.4. Advantages & Disadvantages of the Technology....................................... 37
3.2. Proposed Location of the System .................................................................. 38
3.3. Energy Plan ................................................................................................... 38
3.3.1. Solar Lantern .......................................................................................... 39
3.3.2. Solar Water Pump .................................................................................. 39
3.3.3. Solar Street Light ................................................................................... 41
3.3.4. Solar Box Cooker for Households ......................................................... 42
Chapter 4: Energy Modelling....................................................................................... 45
4.1. Energy Demand of the Village ...................................................................... 45
4.1.1. Household Energy Demand ................................................................... 45
4.1.2 Community Energy Demand .................................................................. 47
4.2. Modelling System Using Software ............................................................... 50
4.2.1. System Configuration ............................................................................. 51
4.2.2. Input Components...................................................................................... 52
Ⅰ. AC Load ............................................................................................................ 52
Ⅱ.Vortex Micro-Hydro Turbine…………………………………………………54
Ⅲ. Solar PV………………………………………………………………………55
Ⅳ. Energy Storage ................................................................................................. 56
Ⅴ. Power Converter ............................................................................................... 57
4.3. Simulation Results & Discussion .................................................................. 57
4.3.1. Vortex Micro- Hydro Turbine ............................................................... 58
4.3.2. Solar PV & Lead Acid Battery .............................................................. 59
4.3.3. Overall System ....................................................................................... 59
Chapter 5: Economic Analysis..................................................................................... 61
7
Chapter 6: Conclusion & Future Scope ....................................................................... 64
6.1. Conclusion ........................................................................................................ 64
6.2. Future Scope .................................................................................................. 65
References .................................................................................................................... 67
8
List of Figures
Figure 1: World Population with Electricity Access ................................................... 12
Figure 2: Status of Electrification in India ................................................................... 13
Figure 3: Household Electrification Rate .................................................................... 13
Figure 4: Total Installed Capacity in India ................................................................. 21
Figure 5: Total Installed Capacity of Renewables in India .......................................... 23
Figure 6: Total CO2 Emissions ................................................................................... 25
Figure 7: Sector wise Energy Division in India .......................................................... 28
Figure 8: Components of a Vortex Micro-Hydro Model ............................................. 34
Figure 9: Working of a Vortex Turbulent Turbine ..................................................... 35
Figure 10: Location of Degalras Village in Chattisgarh, India .................................... 38
Figure 11: Solar Lantern ............................................................................................. 39
Figure 12: Solar Water Pump to be Installed Down the Basin of River…….……….40
Figure 13: Conversion of solar energy to pump water …………………..………… 41
Figure 14: Schematic of Water Solar Pump …………………………..……………..41
Figure 15: Solar Box Cooker ………………………………………………………. 43
Figure 16: Working of a Solar Cooker ………………………………………………43
Figure 17: Assumed Appliances Wattage expressed in %...........................................45
Figure 18: Total Hourly Usage of Appliances/day for a Household ………………...46
Figure 19: Hourly Load Analysis of a Household/Day………………………………47
Figure 20: Entities Wattage expressed in %.................................................................47
Figure 21: Total Commercial Hourly Operation/day ………………………………..48
Figure 22: Commercial Load Analysis of the Village/Day………………………….49
Figure 23: Schematic of Design Layout……………………………………………..51
Figure 24: Renewable Hybrid Model Proposed for Village…………………..……..52
Figure 25: Calculating Available Head for the Vortex Turbine……………………..53
Figure 26: PV Power Output from Panels……………………….…….…………….56
9
Figure 27: Capacity Curve of Deep Cycle Lead Acid Battery……………………….57
Figure 28: Vortex Micro-Hydro Turbine Output Serving Ac Load………………….58
Figure 29: Solar PV + Energy Storage Serving AC Load……………………………59
Figure 30: Monthly Electricity Production of the Model serving the Load………….60
Figure 31: Cost Distribution of System (%)…………………………………………62
10
List of Tables
Table 1: Energy Plan for Degalras Village .................................................................. 39
Table 2: Solar Street Light Specifications .................................................................. 42
Table 3: Solar Cooker Specifications ......................................................................... 44
Table 4: Energy Consumption of Rural Households .................................................. 46
Table 5: Entity Count of the Village ............................................................................ 48
Table 6: Load Input for the System ............................................................................. 52
Table 7: Off-grid Hybrid Renewable Model ............................................................... 60
Table 8: System Components and Quantity ................................................................ 61
Table 9: System Cost Breakdown ................................................................................ 61
Table 10: Total Cost of the Off-grid Hybrid Renewable Model ................................. 62
11
List of Equations
Equation 1: Levelized Cost of Electricity .................................................................... 50
Equation 2: Net Present Cost ....................................................................................... 50
Equation 3: Levelized Cost of Electricity. ……………………………...…………...54
Equation 4: Gross Head Equation……………………………………………………54
Equation 5: Cross-Sectional Area of River………………………………………..…55
Equation 6: Velocity of River………………..……………………………………....55
Equation 7: Rate of Flow of River…………….…………………………………......55
12
Chapter 1: Introduction
1.1. Problem Definition
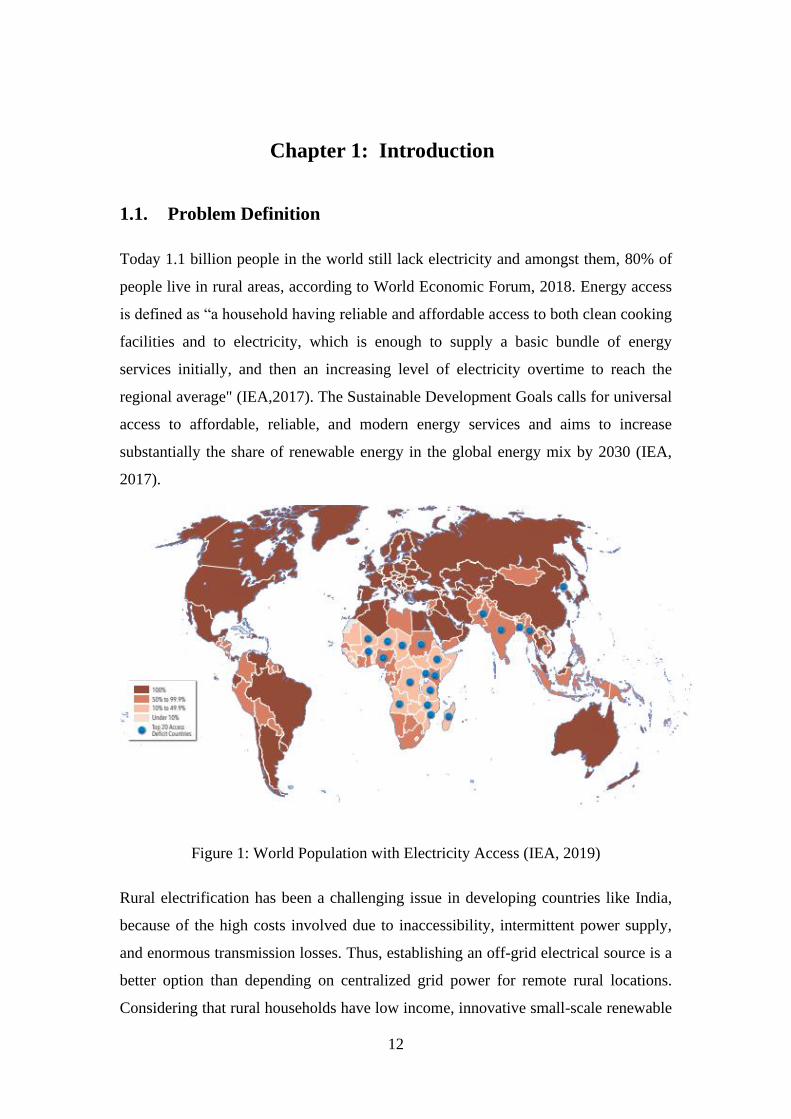
Today 1.1 billion people in the world still lack electricity and amongst them, 80% of
people live in rural areas, according to World Economic Forum, 2018. Energy access
is defined as “a household having reliable and affordable access to both clean cooking
facilities and to electricity, which is enough to supply a basic bundle of energy
services initially, and then an increasing level of electricity overtime to reach the
regional average" (IEA,2017). The Sustainable Development Goals calls for universal
access to affordable, reliable, and modern energy services and aims to increase
substantially the share of renewable energy in the global energy mix by 2030 (IEA,
2017).
Figure 1: World Population with Electricity Access (IEA, 2019)
Rural electrification has been a challenging issue in developing countries like India,
because of the high costs involved due to inaccessibility, intermittent power supply,
and enormous transmission losses. Thus, establishing an off-grid electrical source is a
better option than depending on centralized grid power for remote rural locations.
Considering that rural households have low income, innovative small-scale renewable
13
projects must be designed, making use of the subsidies normally available from the
government, for rural electrification and renewable energy. On the demand side, by
integrating local communities into the decision-making process and developing
ownership within themselves, the off-grid rural electrification projects can be made
more sustainable (Reiche, Covarrubias and Martinot, 2000).
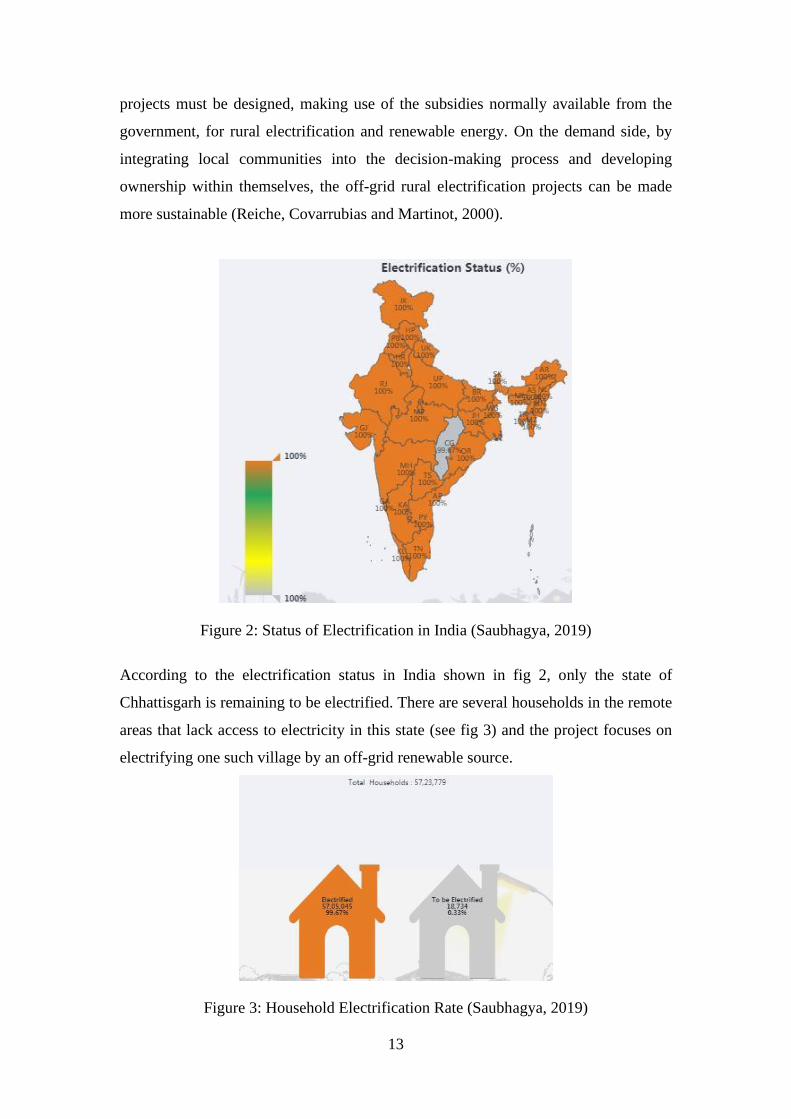
Figure 2: Status of Electrification in India (Saubhagya, 2019)
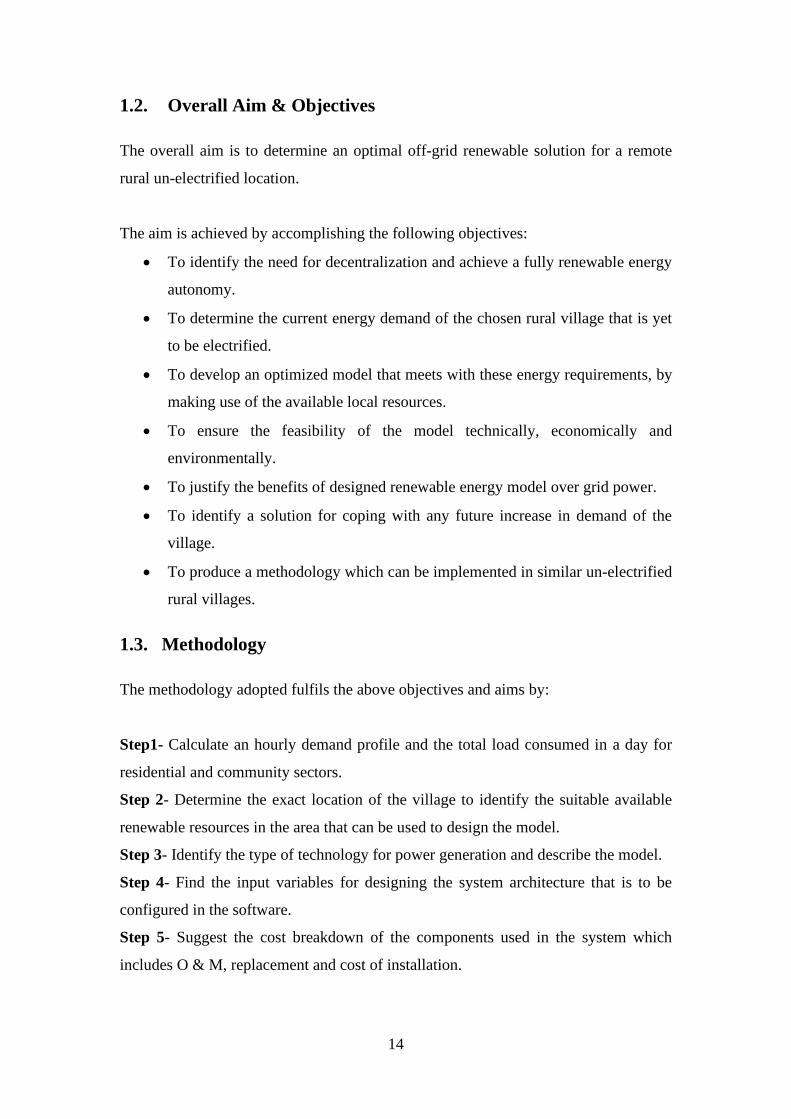
According to the electrification status in India shown in fig 2, only the state of
Chhattisgarh is remaining to be electrified. There are several households in the remote
areas that lack access to electricity in this state (see fig 3) and the project focuses on
electrifying one such village by an off-grid renewable source.
Figure 3: Household Electrification Rate (Saubhagya, 2019)
14
1.2. Overall Aim & Objectives
The overall aim is to determine an optimal off-grid renewable solution for a remote
rural un-electrified location.
The aim is achieved by accomplishing the following objectives:
• To identify the need for decentralization and achieve a fully renewable energy
autonomy.
• To determine the current energy demand of the chosen rural village that is yet
to be electrified.
• To develop an optimized model that meets with these energy requirements, by
making use of the available local resources.
• To ensure the feasibility of the model technically, economically and
environmentally.
• To justify the benefits of designed renewable energy model over grid power.
• To identify a solution for coping with any future increase in demand of the
village.
• To produce a methodology which can be implemented in similar un-electrified
rural villages.
1.3. Methodology
The methodology adopted fulfils the above objectives and aims by:
Step1- Calculate an hourly demand profile and the total load consumed in a day for
residential and community sectors.
Step 2- Determine the exact location of the village to identify the suitable available
renewable resources in the area that can be used to design the model.
Step 3- Identify the type of technology for power generation and describe the model.
Step 4- Find the input variables for designing the system architecture that is to be
configured in the software.
Step 5- Suggest the cost breakdown of the components used in the system which
includes O & M, replacement and cost of installation.
15
Step 6- Determine the best-optimized model from HOMER ensuring the energy
requirements are met and it is economically feasible, with the highest renewable
fraction and lowest carbon emissions.
Step 8- Conclude with discussion from the results, challenges and future scope of the
project.
1.4. Thesis outline
This thesis includes the following five chapters:
Chapter 1 – Introduction
This chapter gives an insight into the background of the thesis formulation and
problems which are to be investigated. The overall aim and specific objectives are
established along with the thesis outline.
Chapter 2 – Literature Reviews
A range of papers and researches regarding the challenges of rural electrification,
electrifying using renewables, energy statistics of India - current scenario and the
scope of renewables. Further, an insight into micro-hydro and solar technologies.
Chapter 3 – Methodology
An introduction to the vortex micro-hydro technology along with design, working,
advantages & disadvantages of the system is explained. The various projects and the
proposed location of implementing is also investigated. The chapter concludes with
energy plan that is proposed for the chosen site location.
Chapter 4 – Energy Modelling
The energy requirements of the village including residential and community loads are
calculated and modelling is carried out using software HOMER for analysing the off-
grid hybrid model. Input parameters, simulation results, discussion and conclusion for
the overall design is explained.
Chapter 5 – Economic Analysis
From the software model developed in HOMER, an economic analysis is performed
to calculate the net present cost and levelized cost of the proposed system and to
check the level of feasibility.
Chapter 6 – Conclusion & Future Scope
The report is concluded by mentioning that, the objectives of the project are met and
the scope of the project in the future is discussed.
16
Chapter 2: Literature Review
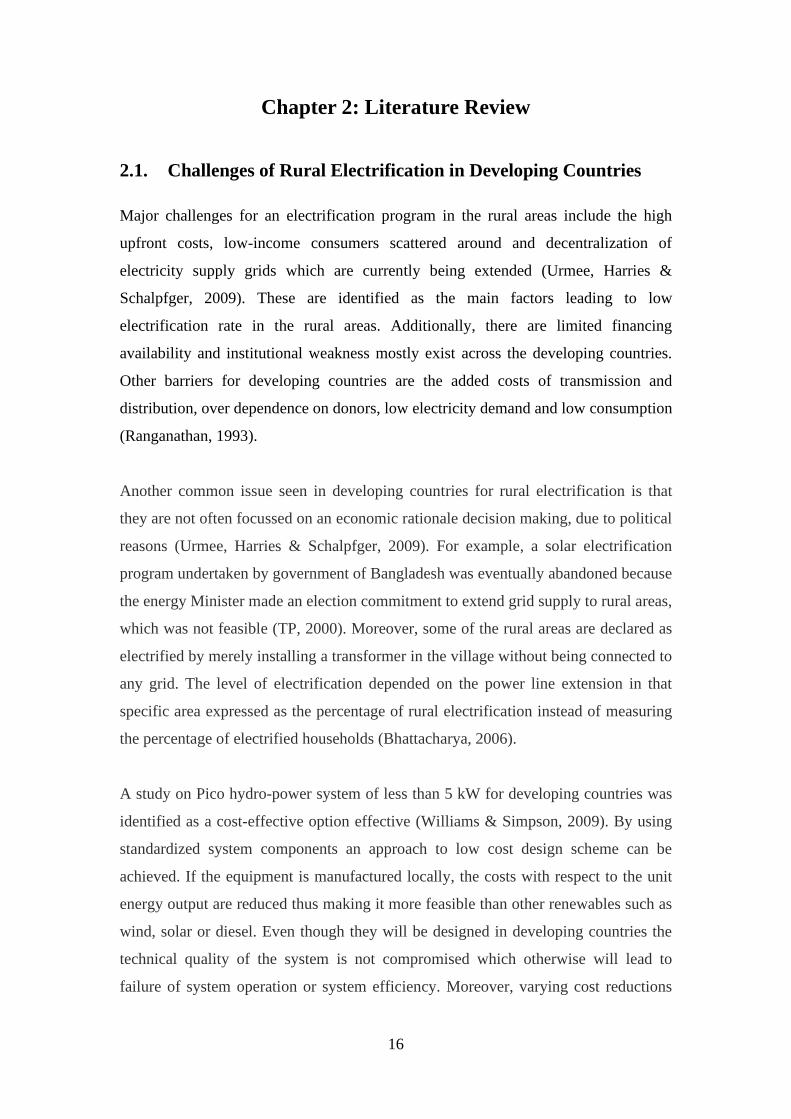
2.1. Challenges of Rural Electrification in Developing Countries
Major challenges for an electrification program in the rural areas include the high
upfront costs, low-income consumers scattered around and decentralization of
electricity supply grids which are currently being extended (Urmee, Harries &
Schalpfger, 2009). These are identified as the main factors leading to low
electrification rate in the rural areas. Additionally, there are limited financing
availability and institutional weakness mostly exist across the developing countries.
Other barriers for developing countries are the added costs of transmission and
distribution, over dependence on donors, low electricity demand and low consumption
(Ranganathan, 1993).
Another common issue seen in developing countries for rural electrification is that
they are not often focussed on an economic rationale decision making, due to political
reasons (Urmee, Harries & Schalpfger, 2009). For example, a solar electrification
program undertaken by government of Bangladesh was eventually abandoned because
the energy Minister made an election commitment to extend grid supply to rural areas,
which was not feasible (TP, 2000). Moreover, some of the rural areas are declared as
electrified by merely installing a transformer in the village without being connected to
any grid. The level of electrification depended on the power line extension in that
specific area expressed as the percentage of rural electrification instead of measuring
the percentage of electrified households (Bhattacharya, 2006).
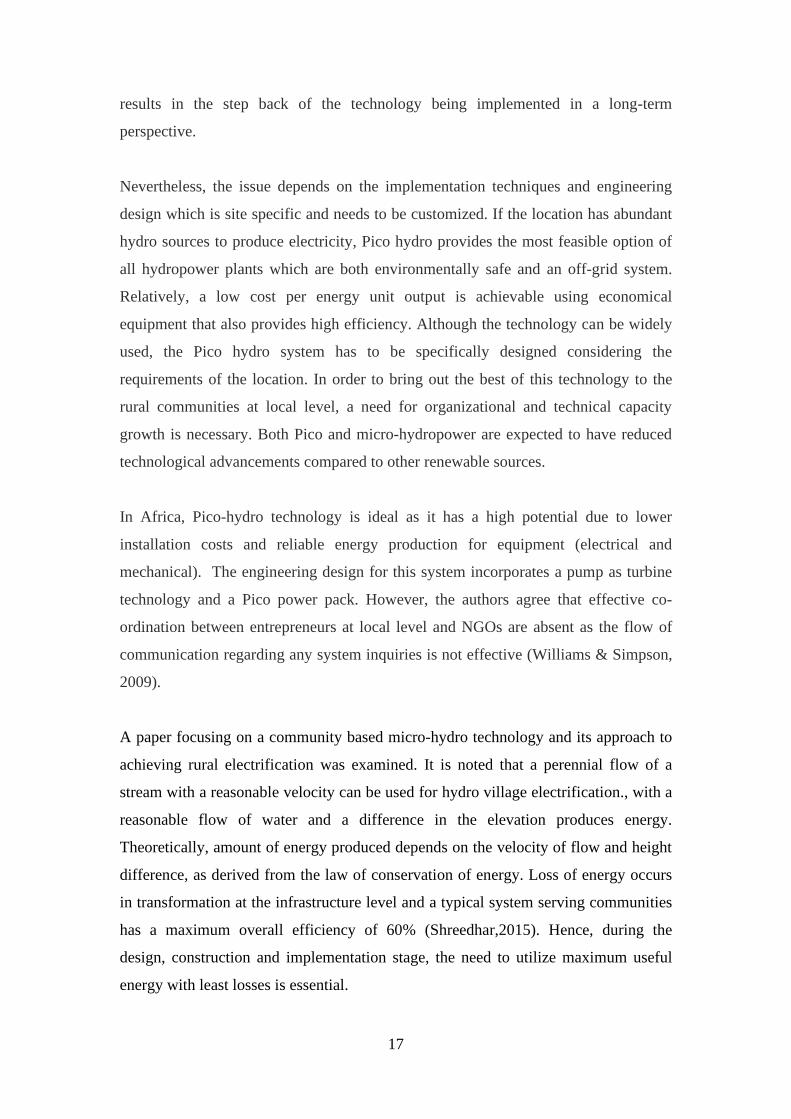
A study on Pico hydro-power system of less than 5 kW for developing countries was
identified as a cost-effective option effective (Williams & Simpson, 2009). By using
standardized system components an approach to low cost design scheme can be
achieved. If the equipment is manufactured locally, the costs with respect to the unit
energy output are reduced thus making it more feasible than other renewables such as
wind, solar or diesel. Even though they will be designed in developing countries the
technical quality of the system is not compromised which otherwise will lead to
failure of system operation or system efficiency. Moreover, varying cost reductions
17
results in the step back of the technology being implemented in a long-term
perspective.
Nevertheless, the issue depends on the implementation techniques and engineering
design which is site specific and needs to be customized. If the location has abundant
hydro sources to produce electricity, Pico hydro provides the most feasible option of
all hydropower plants which are both environmentally safe and an off-grid system.
Relatively, a low cost per energy unit output is achievable using economical
equipment that also provides high efficiency. Although the technology can be widely
used, the Pico hydro system has to be specifically designed considering the
requirements of the location. In order to bring out the best of this technology to the
rural communities at local level, a need for organizational and technical capacity
growth is necessary. Both Pico and micro-hydropower are expected to have reduced
technological advancements compared to other renewable sources.
In Africa, Pico-hydro technology is ideal as it has a high potential due to lower
installation costs and reliable energy production for equipment (electrical and
mechanical). The engineering design for this system incorporates a pump as turbine
technology and a Pico power pack. However, the authors agree that effective co-
ordination between entrepreneurs at local level and NGOs are absent as the flow of
communication regarding any system inquiries is not effective (Williams & Simpson,
2009).
A paper focusing on a community based micro-hydro technology and its approach to
achieving rural electrification was examined. It is noted that a perennial flow of a
stream with a reasonable velocity can be used for hydro village electrification., with a
reasonable flow of water and a difference in the elevation produces energy.
Theoretically, amount of energy produced depends on the velocity of flow and height
difference, as derived from the law of conservation of energy. Loss of energy occurs
in transformation at the infrastructure level and a typical system serving communities
has a maximum overall efficiency of 60% (Shreedhar,2015). Hence, during the
design, construction and implementation stage, the need to utilize maximum useful
energy with least losses is essential.
18
A weak policy framework is also a barrier to a low rate of renewable programs as
seen in many studies. High capital cost, lack of subsidies and financing, low-income
users, dependency on a donor, political reasons and lack of technical know-how, the
major factors concerned with electrification (Urmee, Harries & Schalpfger, 2009).
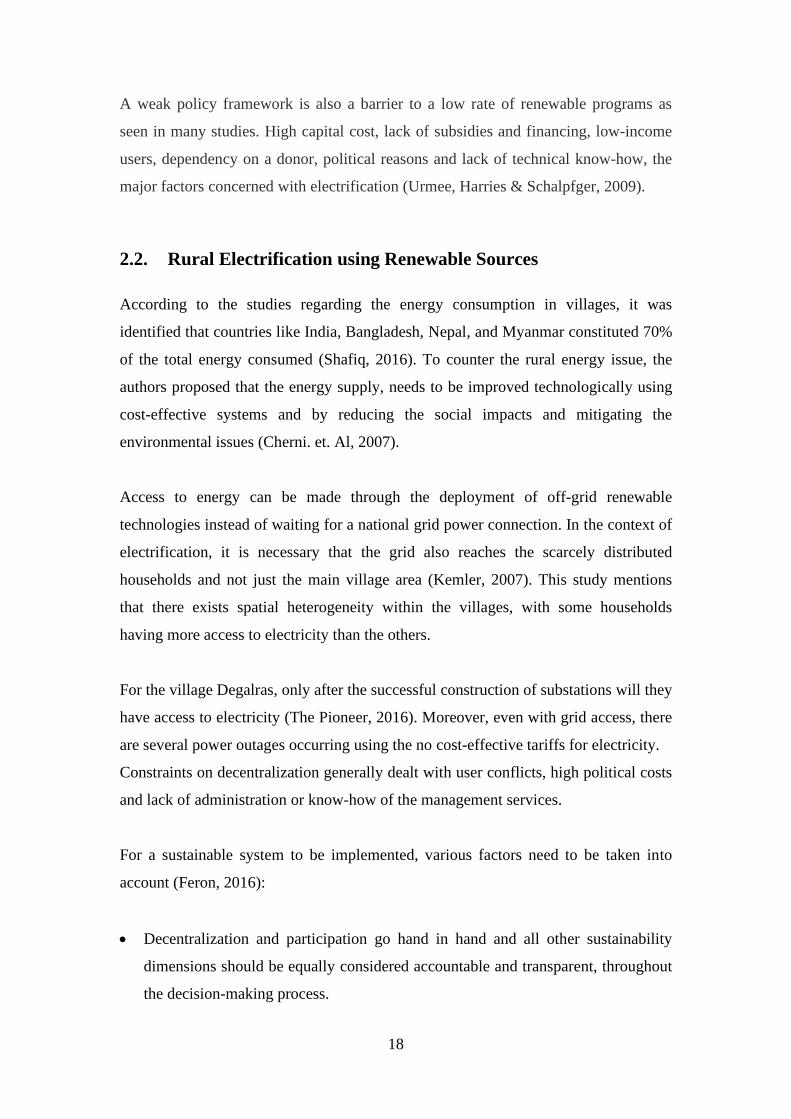
2.2. Rural Electrification using Renewable Sources
According to the studies regarding the energy consumption in villages, it was
identified that countries like India, Bangladesh, Nepal, and Myanmar constituted 70%
of the total energy consumed (Shafiq, 2016). To counter the rural energy issue, the
authors proposed that the energy supply, needs to be improved technologically using
cost-effective systems and by reducing the social impacts and mitigating the
environmental issues (Cherni. et. Al, 2007).
Access to energy can be made through the deployment of off-grid renewable
technologies instead of waiting for a national grid power connection. In the context of
electrification, it is necessary that the grid also reaches the scarcely distributed
households and not just the main village area (Kemler, 2007). This study mentions
that there exists spatial heterogeneity within the villages, with some households
having more access to electricity than the others.
For the village Degalras, only after the successful construction of substations will they
have access to electricity (The Pioneer, 2016). Moreover, even with grid access, there
are several power outages occurring using the no cost-effective tariffs for electricity.
Constraints on decentralization generally dealt with user conflicts, high political costs
and lack of administration or know-how of the management services.
For a sustainable system to be implemented, various factors need to be taken into
account (Feron, 2016):
• Decentralization and participation go hand in hand and all other sustainability
dimensions should be equally considered accountable and transparent, throughout
the decision-making process.
19
• Reliability of the system and its cost-effectiveness are essential indicators for an
economically sustainable electrification solution, ensuring the affordability of the
system from the initial investments to the lifetime operation and maintenance.
• Enforcing environmental policies and regulations requires the awareness of the
civil society to minimize and mitigate the issues on the environment. Energy
solutions should address the environmental concerns such as GHG emissions,
biodiversity loss, deforestation, air quality or noise needs to be raised.
• Socio-cultural conditions have to be met for the successful implementation taking
into account the accuracy of technology and increased accountability within the
local community through an inclusive approach.
Adopting a regulatory framework and standards favours electrification of rural
households for a sustainable system. Technological enhancement through effective
participation and adaptable process to meet needs of the population also lead to a
strengthened formal institution. Electricity generation not only has benefits in
agriculture such as irrigation and crop processing but also improves the standard of
living in rural villages.
Availability of renewable energy sources is variable depending on the site location
because different areas possess variable types of energy sources. The output can be
controlled either with the installation of individual large renewable plant or using an
integrated renewable energy system. The latter option is widely used in the world
today for a decentralized model of rural electrification.
The renewable-powered isolated grid connections for the rural areas are identified as
clean energy as well as a sustainable solution for Indonesia (Blum, Wakeling &
Schmidt, 2013). Although the conventional rural electrification challenges are met by
the expensive grid extension or diesel-powered villages, both of these options are
characterized by their greenhouse gas emissions and high operating costs. One of the
main reasons for not selecting renewables despite its advantages is that private sector
fails to provide investments for clean energy-based village grid and instead leave the
responsibility for the governments. Governments, on the other hand, commit to a
conventional and centralized solution leading to low diffusion of renewable systems.
The paper focusses on the economics of rural renewable systems and analyses the

20
average cost of electricity in Indonesia for solar and micro-hydro powered villages to
the conventional diesel operated villages, in order to identify the difference in cost
(Blum, Wakeling & Schmidt, 2013). It also takes into account abatement costs of
CO2 emissions and mitigation strategies.
The results from the paper indicated, micro-hydro is used over diesel for powering,
which makes it more competitive. Moreover, micro-hydro plays a positive role in the
carbon emission abatement costs with potential for carbon reduction. Further, it has
the lowest generation costs compared to all sources while attracting subsidies from the
government. The deployment of this system can lead to a substantial improvement in
the electrification rate with zero carbon emissions. The village technology sector will
be improved eventually with scalable and high quality micro-hydro powered
manufacturing. This leads to economically developed rural areas in the country. In
this study, a methodology pattern similar to this paper is used (Sahoo, 2016).
Another model consisted of an off-grid renewable technology optimized with grid
extension for rural electrification, using life cycle cost analysis (LCC). In this case,
solar PV and biomass gasifiers were used for generating electricity, combined with
the conventional grid connections. An economical distance limit is a distance from the
existing grid point which is related to the renewable systems and the model developed
produced a match between the grid supply and the renewable energy systems. The
working hours of solar and biomass and also the grid availability were taken into
account for identifying the LCC of the energy fed into the system. From the results on
this study it was determined that biomass systems are most competitive for the low
demand areas which are situated far away from an existing grid connection, compared
to a solar PV or grid extension (Mahapatra & Dasappa, 2012).
2.3. Energy statistics of India
India holds a share of 4.9% of the total global consumption accounting as the fourth-
largest energy consumer in the world (British Petroleum, 2015). Contributing 17% to
the world population exceeding 1.2 billion inhabitants, India stands in the South Asian
Association for Regional Cooperation (SAARC) as the largest country in terms of
21
gross domestic product (United Nations, 2015). Relatively, the demand for electricity
also grows with a high population growth rate and the rising GDP which is expected
to increase at 8% per annum until 2030 and beyond that at 6% (Energy Report, 2011).
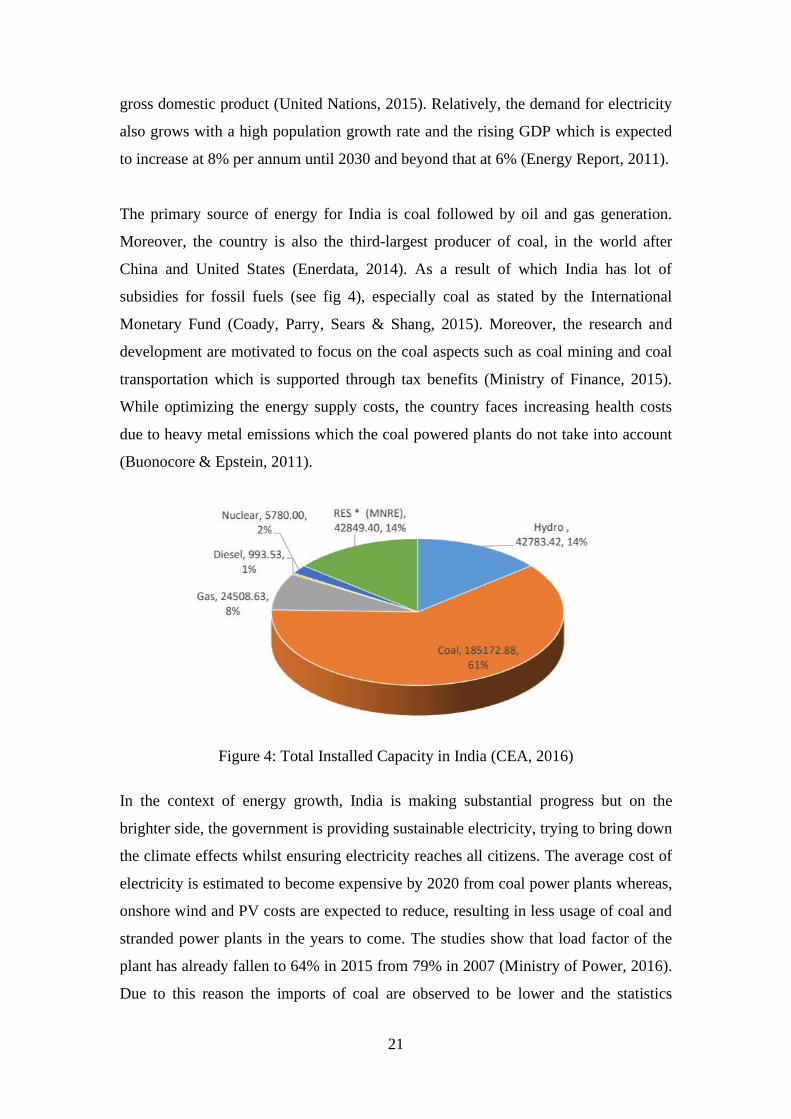
The primary source of energy for India is coal followed by oil and gas generation.
Moreover, the country is also the third-largest producer of coal, in the world after
China and United States (Enerdata, 2014). As a result of which India has lot of
subsidies for fossil fuels (see fig 4), especially coal as stated by the International
Monetary Fund (Coady, Parry, Sears & Shang, 2015). Moreover, the research and
development are motivated to focus on the coal aspects such as coal mining and coal
transportation which is supported through tax benefits (Ministry of Finance, 2015).
While optimizing the energy supply costs, the country faces increasing health costs
due to heavy metal emissions which the coal powered plants do not take into account
(Buonocore & Epstein, 2011).
Figure 4: Total Installed Capacity in India (CEA, 2016)
In the context of energy growth, India is making substantial progress but on the
brighter side, the government is providing sustainable electricity, trying to bring down
the climate effects whilst ensuring electricity reaches all citizens. The average cost of
electricity is estimated to become expensive by 2020 from coal power plants whereas,
onshore wind and PV costs are expected to reduce, resulting in less usage of coal and
stranded power plants in the years to come. The studies show that load factor of the
plant has already fallen to 64% in 2015 from 79% in 2007 (Ministry of Power, 2016).
Due to this reason the imports of coal are observed to be lower and the statistics
22
indicate a drop in 15% compared to the previous year in 2016 (Buckley, 2016). The
stakeholders at ministry of energy in India has identified that an idea of new coal
powered plant is expensive option compared to solar plant for which the country has
abundant solar energy and, along with solar PV prices expected to fall further in the
next decade (Buckley, 2016). The Central Electricity Authority in India proposes that
no new coal plants should be added to the current levels as there is already sufficient
capacity which will meet the energy requirements until 2022 according to the
National Electricity Plan (CEA, 2016).
If the production of coal is expected to rise 5% each year, the studies indicate that the
coal reserves will last only up to another 30-40 years. According to the World
Institute of Sustainable Energy, a study conducted regarding the electricity production
from coal, that has a capacity of 400 TW, is predicted to end by 2032. India is
estimated to produce up to 84,000 MW installed capacity of hydroelectric power
running at load factors of 60 % efficiency, focussing on renewable energy. The
government aims at accelerating a plan for the development of hydro to install 50,000
MW capacity installed by 2026, most of which will be concentrated in the southern
regions of the country, approximately by the finish of the 14th- Five Year Plan
(Planning Commission, 2006).
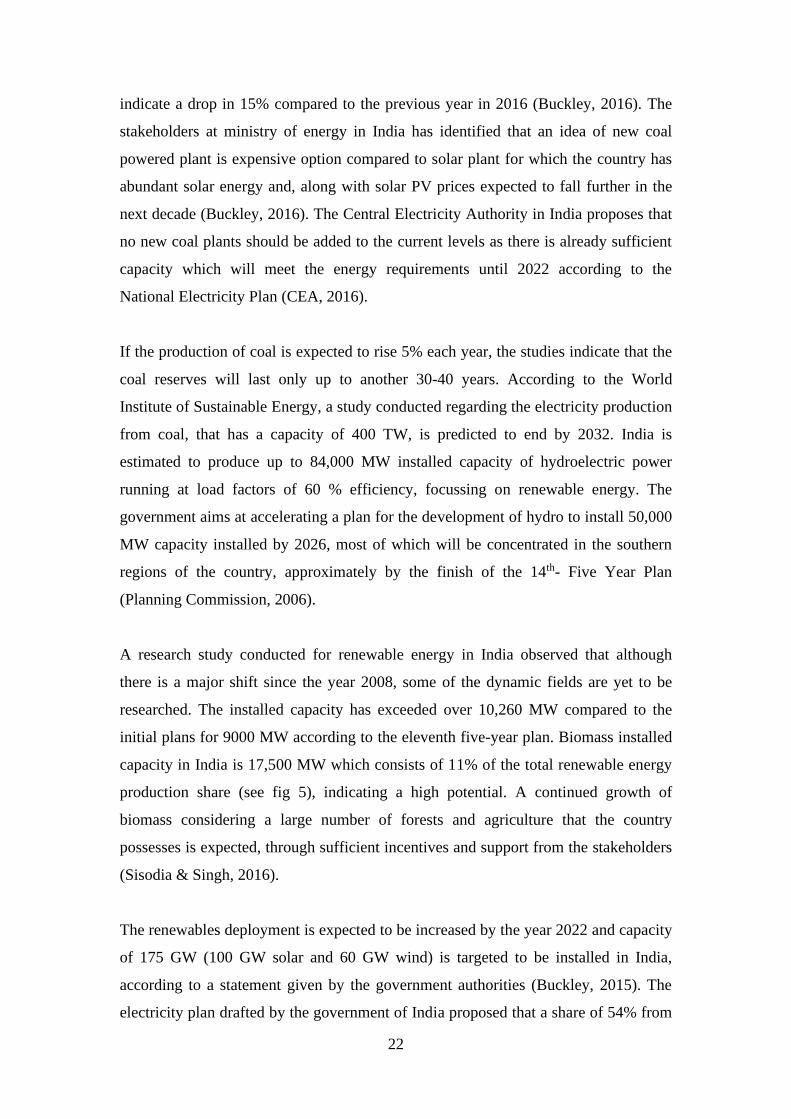
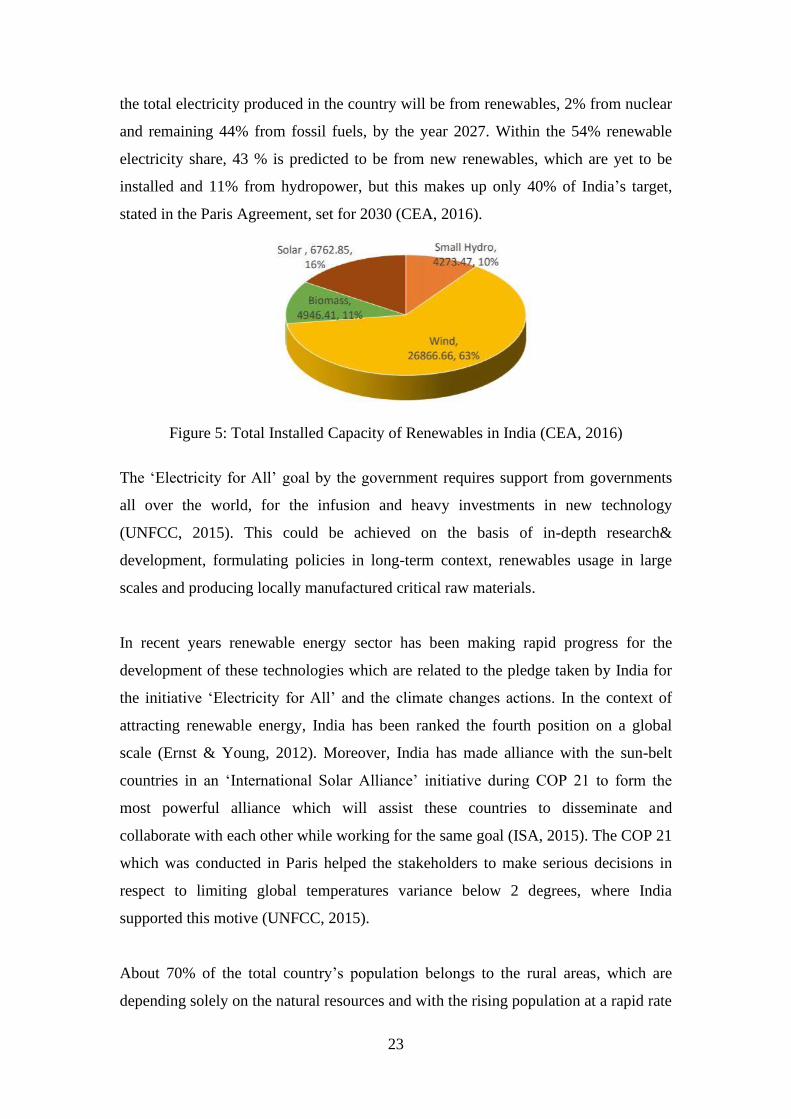
A research study conducted for renewable energy in India observed that although
there is a major shift since the year 2008, some of the dynamic fields are yet to be
researched. The installed capacity has exceeded over 10,260 MW compared to the
initial plans for 9000 MW according to the eleventh five-year plan. Biomass installed
capacity in India is 17,500 MW which consists of 11% of the total renewable energy
production share (see fig 5), indicating a high potential. A continued growth of
biomass considering a large number of forests and agriculture that the country
possesses is expected, through sufficient incentives and support from the stakeholders
(Sisodia & Singh, 2016).
The renewables deployment is expected to be increased by the year 2022 and capacity
of 175 GW (100 GW solar and 60 GW wind) is targeted to be installed in India,
according to a statement given by the government authorities (Buckley, 2015). The
electricity plan drafted by the government of India proposed that a share of 54% from
23
the total electricity produced in the country will be from renewables, 2% from nuclear
and remaining 44% from fossil fuels, by the year 2027. Within the 54% renewable
electricity share, 43 % is predicted to be from new renewables, which are yet to be
installed and 11% from hydropower, but this makes up only 40% of India’s target,
stated in the Paris Agreement, set for 2030 (CEA, 2016).
Figure 5: Total Installed Capacity of Renewables in India (CEA, 2016)
The ‘Electricity for All’ goal by the government requires support from governments
all over the world, for the infusion and heavy investments in new technology
(UNFCC, 2015). This could be achieved on the basis of in-depth research&
development, formulating policies in long-term context, renewables usage in large
scales and producing locally manufactured critical raw materials.
In recent years renewable energy sector has been making rapid progress for the
development of these technologies which are related to the pledge taken by India for
the initiative ‘Electricity for All’ and the climate changes actions. In the context of
attracting renewable energy, India has been ranked the fourth position on a global
scale (Ernst & Young, 2012). Moreover, India has made alliance with the sun-belt
countries in an ‘International Solar Alliance’ initiative during COP 21 to form the
most powerful alliance which will assist these countries to disseminate and
collaborate with each other while working for the same goal (ISA, 2015). The COP 21
which was conducted in Paris helped the stakeholders to make serious decisions in
respect to limiting global temperatures variance below 2 degrees, where India
supported this motive (UNFCC, 2015).
About 70% of the total country’s population belongs to the rural areas, which are
depending solely on the natural resources and with the rising population at a rapid rate
24
can lead to complete exploitation of these natural resources. As the demand for energy
increases in the coming years, temperatures rise, unpredictable monsoon causing
droughts and floods and the rising sea levels will altogether impact the population of
India negatively (WBGU, 2007).
The clean energy sector in India offers a wide range of sustainable models. Even if the
grid expands there is always a need for modern technologies as the demand increases.
In order to meet the energy gaps of the poor, innovative ideas which are simple and
easy to implement are encouraged by the government. Moreover, India is offering
support for a reliable and adequate power supply, increase the intake of cleaner
energy sources, improving the use of resources efficiently, energy security,
employment, and entrepreneurship at local levels (SAGE, 2015).
2.3.1. Electrification Scenario
In today’s context, electricity means having an infrastructure for rural electricity,
connections to households, providing sufficient amount of power to meet the
demands, ensuring the rate of electricity is economical and an efficient sustainable
method used for reliable supply.
A study specifically stated that among the countries in the South Asian Association
for Regional Development, India especially needs to focus on improving the intake of
renewables deployment to maximize the energy sector even to the remote rural areas,
eventually promoting economic growth and human lifestyle. As in the case of India,
the number of unelectrified houses is related to the economics of nation hence, more
the households are out in the light, with clean and continuous electricity supply, the
faster the country develops (Breyer, Bogdanov, Choudhary & Gulagi, 2017).
The power sector in India however, is facing challenges over the past few years due to
the lack of appropriate fuel, unsuccessful policies related to environmental issues,
reluctant financial aids from banks, high distribution and transmission losses,
insufficient tariffs, low rate of the economy leading to reduction in the demand of
power.
25
Some of the issues faced in India for a low rate of electrification is summarised in the
following points (Electrification in India, 2010):
• Location of villages are in the range of 3 to 80 km from a grid supply,
• Remote areas such as hills, deserts, and forests,
• Dispersed households with around 2 to 200 units of distributed loads,
• consumption during peak hours,
• rural demand for power is low,
• a poor load factor of 0.2 - 0.3 and
• low income consumers with less paying capacity.
The idea of implementing renewable technologies will impact the imports and
manufacturing sector. Therefore, if dependence on imports is reduced, then
competition within the local markets increases and the research and development of
energy storage and their targeted investments also increases. There is another option
of innovation, aside from importing and manufacturing strategies. By the method of
process innovation, a choice that could be made by the renewable sector can lead to
creating efficient models using technologies (solar, wind, micro-hydro) across a wide
scale of operations including a village, district or households, available to invent
decentralized clean energy system.
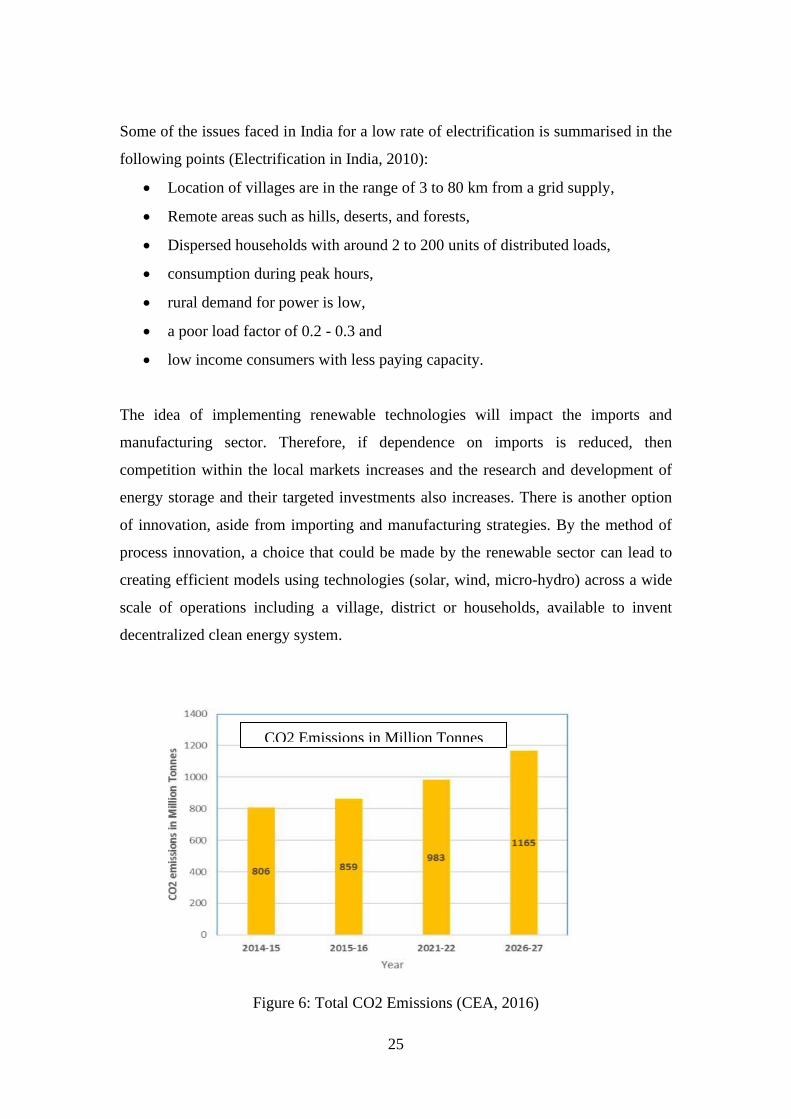
Figure 6: Total CO2 Emissions (CEA, 2016)
CO2 Emissions in Million Tonnes
26
Climate change and global warming threats to the environment is another perspective
for increasing the deployment of renewable projects globally (see fig 6). Over
dependence on fossil fuels and dwindling coal and petroleum resources to meet
energy demands are prompting countries to opt for internal resources. Micro-hydro is
a local technology which is being used over decades to meet energy demands of the
poor. For communities that are yet to be connected to the electricity grid can select
micro-hydro solutions which have been a proven successful technology. They are
usually operated and owned by the communities itself which provides a better
standard of living for the poor with increased education time for children and better
safety. The productivity can be extended with more operating hours and all of this
achieved on a low budget scheme (Shreedhar, 2015).
2.3.2. Scope of renewables
Decentralized off-grid renewable systems are one of the options looked at by the
government to meet basic needs in rural areas (Planning Commission, 2011) (WWF,
2013). Those locations, where connection to the grid or extension of a power supply is
difficult to achieve either technically or economically, the solution would be
decentralized operation of the power systems. This will mitigate the issue of common
power outages which occurs in the grid systems and meet the basic needs of the
communities or households in the far away locations. This can be achieved through
long term successful planning required for securing energy, where the resources from
renewables will be split into centralized and decentralized sections, minimizing the
carbon footprints and reaching the sustainable goals.
For an entire rural community to be electrified, Ministry of New and Renewable
Energy (MNRE) in India aimed to introduce renewable technologies such as solar,
wind, biomass and small hydro (MNRE, 2017). This was aimed to achieve by using
grid extension and franchisee models connected to the tail, hence feeding it into the
grid. DDG for diesel power operation for local level generation and, household
generation using micro-hydro or solar to meet the basic and primary demands. The
27
rural communities in India still lack extension and interconnection of the grid system
and battle of the poor still continues for the demand of power (Kamalapur &
Udaykumar, 2011).
Ministry of New and Renewable Energy in India according to the author is in the final
process of access to rural electricity all over the country. Considering the current
situation of these areas, grid extension is an expensive option but on the other hand
almost all parts of the country possess an abundant source of solar energy which will
act as an efficient and reliable source for electricity production in the long-term
process. Integrating it with biomass can help produce clean energy for cooking gas as
well. Thus, the government needs to redefine and incline more renewable schemes to
meet the energy gap and provide more incentives from the government for successful
implementation.
A study suggested the policies of governments towards MHP systems be redefined by
including appropriate construction techniques, replacing conventional technology
with the modern system, providing technical training for the local communities and
provision of better financial aids (Drinkwaard, Kirkels & Romijn, 2010). In return, the
sector will provide improved learning processes over time, to overcome the lack of
appropriate technical information lost during the manpower turnover. The
organizations in charge of implementing this technology must introduce long-term
management structures, focussing on its importance and link efficiently with the local
communities periodically post the project completion as well, in order to analyze and
monitor the data regularly. This not only benefits a community but indirectly the
national economy is improved.
In a case study of MHP system installed in Nepal, it is concluded that an appropriate
corporate methodological approach, minimizing political issues and sufficient
financial aids for the success of a renewable project (Gurung, Gurung & Oh, 2011).
Some of the factors that relate to this are coverage, affordability, quality, profitability,
and sustainability of the households. The site faces grid extensions and connection
issues as its mountainous area and lacks technical abilities. The demand is rising (see
fig 7) and economy is poor making it more challenging to solve the issue. The
expensive grid extension has resulted in the isolation of communities in rural areas
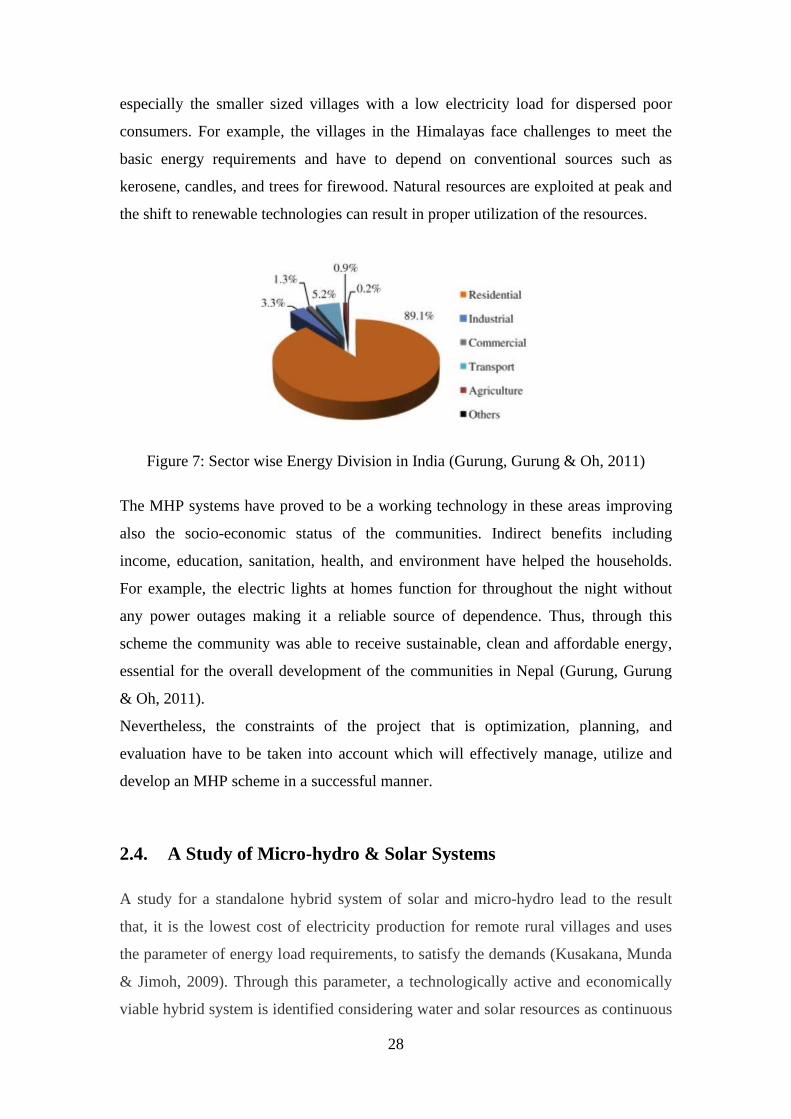
28
especially the smaller sized villages with a low electricity load for dispersed poor
consumers. For example, the villages in the Himalayas face challenges to meet the
basic energy requirements and have to depend on conventional sources such as
kerosene, candles, and trees for firewood. Natural resources are exploited at peak and
the shift to renewable technologies can result in proper utilization of the resources.
Figure 7: Sector wise Energy Division in India (Gurung, Gurung & Oh, 2011)
The MHP systems have proved to be a working technology in these areas improving
also the socio-economic status of the communities. Indirect benefits including
income, education, sanitation, health, and environment have helped the households.
For example, the electric lights at homes function for throughout the night without
any power outages making it a reliable source of dependence. Thus, through this
scheme the community was able to receive sustainable, clean and affordable energy,
essential for the overall development of the communities in Nepal (Gurung, Gurung
& Oh, 2011).
Nevertheless, the constraints of the project that is optimization, planning, and
evaluation have to be taken into account which will effectively manage, utilize and
develop an MHP scheme in a successful manner.
2.4. A Study of Micro-hydro & Solar Systems
A study for a standalone hybrid system of solar and micro-hydro lead to the result
that, it is the lowest cost of electricity production for remote rural villages and uses
the parameter of energy load requirements, to satisfy the demands (Kusakana, Munda
& Jimoh, 2009). Through this parameter, a technologically active and economically
viable hybrid system is identified considering water and solar resources as continuous
29
supply of energy. The software HOMER created optimization models according to the
load requirements, operating and installation costs, input system component costs,
solar radiation and streamflow (Kusakana, Munda & Jimoh, 2009). This output
compared to the conventional electrification methods, diesel powering and grid-
extensions was proved to be more viable.
A micro-hydro system implemented successfully in Bolivia provides the results from
the insights of various cases, which were analyzed, resulting in positive feedback on
the usage of micro-hydropower (MHP) durable (Drinkwaard, Kirkels & Romijn,
2010). Despite MHP being a renewable source, it has several more advantages over
the other renewable sources. Rivers are the more concentrated form of energy, unlike
solar or wind. The perennial run-off rivers provide electricity all year round
irrespective of seasonal changes and can predict the generation of electricity
throughout the year. The GHG emissions calculated for the system lifetime is found to
be extremely low and practically nil. It is concluded that the operation and
maintenance costs are low for this system (Paish, 2002) moreover, the frequency of
maintenance is also less, making it more durable.
Once the location of implementing micro-hydro technology is identified through
surveying, the equipment with optimum efficiency is selected and different
combinations are studied. Using the parameters such as cost, distance, the capacity of
overall scheme, safety, environmental aspects, land use, and maintenance are used for
the basis of selecting a model for the scheme. The survey aids to design the system
using the flow rate, head from the drop of flow, civil works for the location,
distribution lines and the demand of electricity of the rural community. Although,
design flow rate of the system depends on two factors which are climate changes and
pattern of water usage that changes continuously (Shreedhar,2015).
Among all the off-grid systems the micro-hydro technology is identified to be the
cheapest. A strategic niche management approach was introduced in the paper to
overcome the challenges for the success of MHP systems to provide solutions beyond
the common issues. The underlying factors provided an insight into the various
aspects responsible for the eradication of the problems faced by this technology not
30
just for the case of Bolivia, but for rural electrification in developing countries as
well.
An MHP installed in the villages of Bawan Valley, Indonesia is focussed on an
instantaneous system approach, excluding the electricity demand fluctuations required
for a robust assessment. As a result of which, during the peak demand times, mostly
in the evening, power outages in the system occurred. One of the villages even
experienced overloading but current limiting devices were installed and it was not a
significant technical issue. With increase in demand for electricity in the households,
fluctuations result in the limiting devices to face a by-passing behavioral
phenomenon. The demand management of the electricity distribution is varied with
the set limits. Thus, this approach of current-limiting is moderated by the electricity
distribution companies (Murni, Whale, Urmee, Davies & Hariees, 2012). The local
communities have a lower cost of electricity production system compared to the
conventional kerosene lamps and generators (diesel & petrol) even though availability
of water is variable and a reduction in water level could affect the water supply, this
system is preferred by the communities. The operation and maintenance which are
efficient social factors, also crucial for the project
The results from micro-hydro system installed in the Bawan Valley villages of
Indonesia where hydro resources are promising, indicated a successful production of
electricity for the villages all year round (Murni, Whale, Urmee, Davies & Hariees,
2012). The challenges of the system starting from its initial deployment to the impacts
of this system in the local communities was ignored due to this. As a result, they are
built not only by the private sectors but also by the communities and even the
government. Various surveys and energy audits conducted in these villages revolved
around the findings that the success of this renewable system not only depended on
the technological aspects including system design and O&M but also on appropriate
planning strategies and involvement of the community as a whole including
stakeholders.
The social factor develops a strong village capacity in rural areas resulting in a
successful project. From the several surveys conducted, proper design of a micro-
hydro system is crucial although, it doesn’t mention about the river flow data for
31
long-term in this case. Hence, the highly variable and unpredictable output was used
for the capacity calculation of the system on the basis of spot readings. The climate
changes on rivers are uncertain and according to the researches in developing
countries such as Vietnam, India and Sri Lanka, the impacts vary on a regional and
global scale (Iimi, 2007). In the rainy season it is expected that the hydrological
discharges increase. On the other hand, with the expected global climate changes in
the coming years, the overall temperatures are predicted to rise with lower rainfalls.
The need of precise data for hydrology considering the varying climate changes is
crucial.
Points that are to be considered for successful implementation of micro-hydro
technology:
The following aspects needs to be considered for the development and planning of a
micro-hydro plant which includes: manufacturing and installation of the system,
involvement of local communities, financing aids using subsidies or reduced tariffs,
proper maintenance and follow up of the project after completion, and the study of
socio-economic aspects of the new implemented technology. These factors can lead to
a successful operation of hydro-electric plant and if monitored periodically can help
the local communities reach the electrification goals. This eventually leads to better
lifestyle and economic developments in the remote rural communities (Fulford,
Mosley & Gill, 2000).
A scheme needs to be developed from the hydro data collected over a period of time
to design a system for specific power requirement and if the system uses spontaneous
data to predict the power of the system it will result in its failure. For example, a
cumulative year’s streamflow is the duration used by designers to assist in the
designing of flow rate for the scheme. Various methods can be used to determine this
including enquiring with the local communities, estimating flow rate in the catchment
area using rainfall data or by simply calculating the flow rate at periodic interval for
all year round (Shreedhar, 2015).
32
Chapter 3: Methodology
3.1. Introduction
A run-off river plant is also known as a dam less hydro plant is the technology
selected for meeting the demands of the village chosen, as it is located along the
banks of river. All over the world especially countries like China, Brazil, and Canada,
who have high potential in hydr0-power and installed large hydropower plants, are
implementing more of this technology due to the various advantages of this system.
On the other hand, countries such as Austria, Norway, Nepal with uneven topography,
have also been on the rise for this run-off river scheme. There are various positives to
this system mainly it’s environmentally friendly nature.
The qualities of the system are listed below:
• The system requires very less maintenance throughout the system lifetime
since there is only a single moving component. Moreover, as a means of
protecting the system from debris small or large, a trash rack has been
incorporated into the system.
• Due to the advantage of low maintenance, the system lifetime is extended to
30 years (Turbulent, 2017), consisting of much longer operation compared to
other technologies.
• Regarding the system installation, the turbine can be assembled prior to its
delivery, due to the easy and simple structure. The vortex turbine can be
transported to the site location easily. This turbine is also the smallest when
compared to the others in terms of specific energy levels.
• Usually, a micro-hydro dam power plant has flood risks due to an
unsuccessful sedimentation passage causing threat to life, whereas, in this
technology, the system does not restrict the flow of water which eliminates
this issue.
33
• Moreover, being a small-scale technology, it can be installed at any site such
as a creek, river or stream, ensuring there is enough height (works for low
height). The project consumes only very little land space or sometimes even
nil, improving the flexibility of the system.
3.1.1. Design of Vortex Micro-Hydro Plant
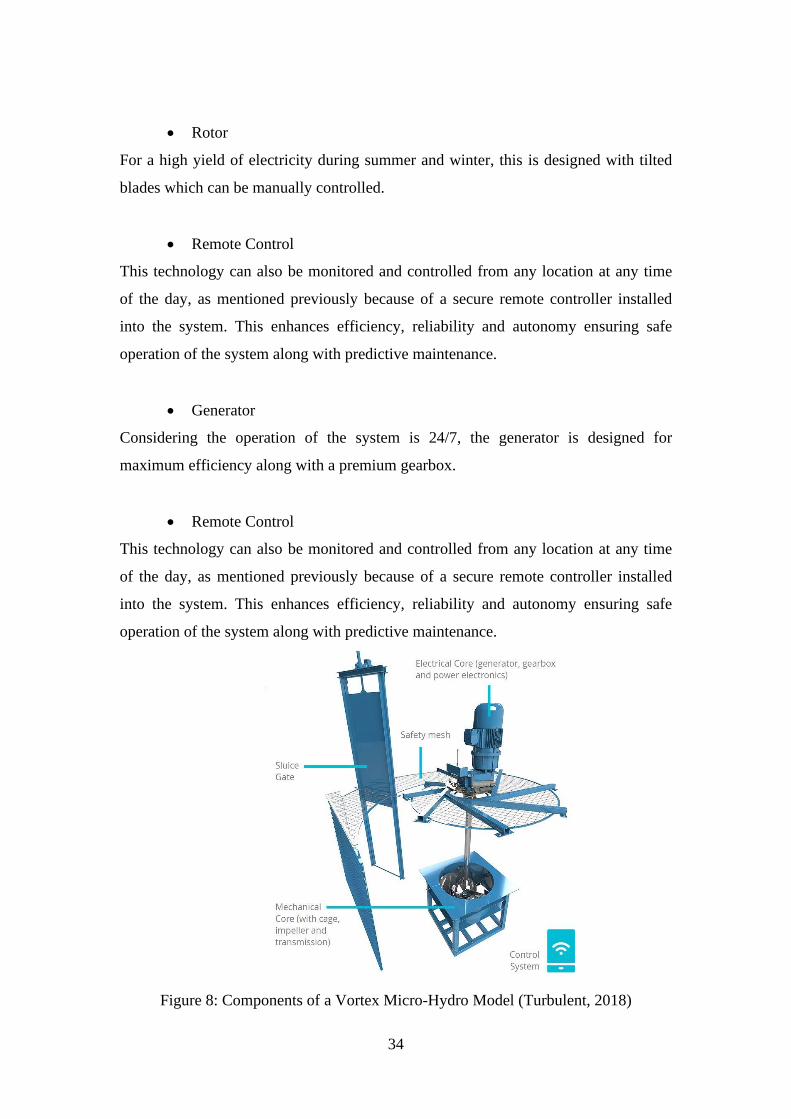
The vortex turbine as shown in figure 8 consists of the following components
(Turbulent,2018):
• Power Point Tracker
Identifies the maximum flow of water for maximum electricity production using a
controller developed using algorithms for optimization.
• Trash Rack
To allow in the smooth passage of water, a trash rack is included which will clear
blockage due to any debris materials.
• Vortex
The shape of the basin is designed specifically to ensure the safe passage of the fishes
and aquatic life, producing a low-pressure vortex for the inlet water. The basin is
made of concrete has a lifetime of 100 years.
• Sluice Gate
The flow of water is controlled automatically using sluice gates.
• Hub
Has an anti-corrosive coated impeller hub which is made of cast iron and consists of
blades made of stainless steel.
• Electronics
The power electronics devices used in the system have high efficiency and improved
reliability, providing long life for more than 15 years of uninterrupted power supply.
34
• Rotor
For a high yield of electricity during summer and winter, this is designed with tilted
blades which can be manually controlled.
• Remote Control
This technology can also be monitored and controlled from any location at any time
of the day, as mentioned previously because of a secure remote controller installed
into the system. This enhances efficiency, reliability and autonomy ensuring safe
operation of the system along with predictive maintenance.
• Generator
Considering the operation of the system is 24/7, the generator is designed for
maximum efficiency along with a premium gearbox.
• Remote Control
This technology can also be monitored and controlled from any location at any time
of the day, as mentioned previously because of a secure remote controller installed
into the system. This enhances efficiency, reliability and autonomy ensuring safe
operation of the system along with predictive maintenance.
Figure 8: Components of a Vortex Micro-Hydro Model (Turbulent, 2018)
35
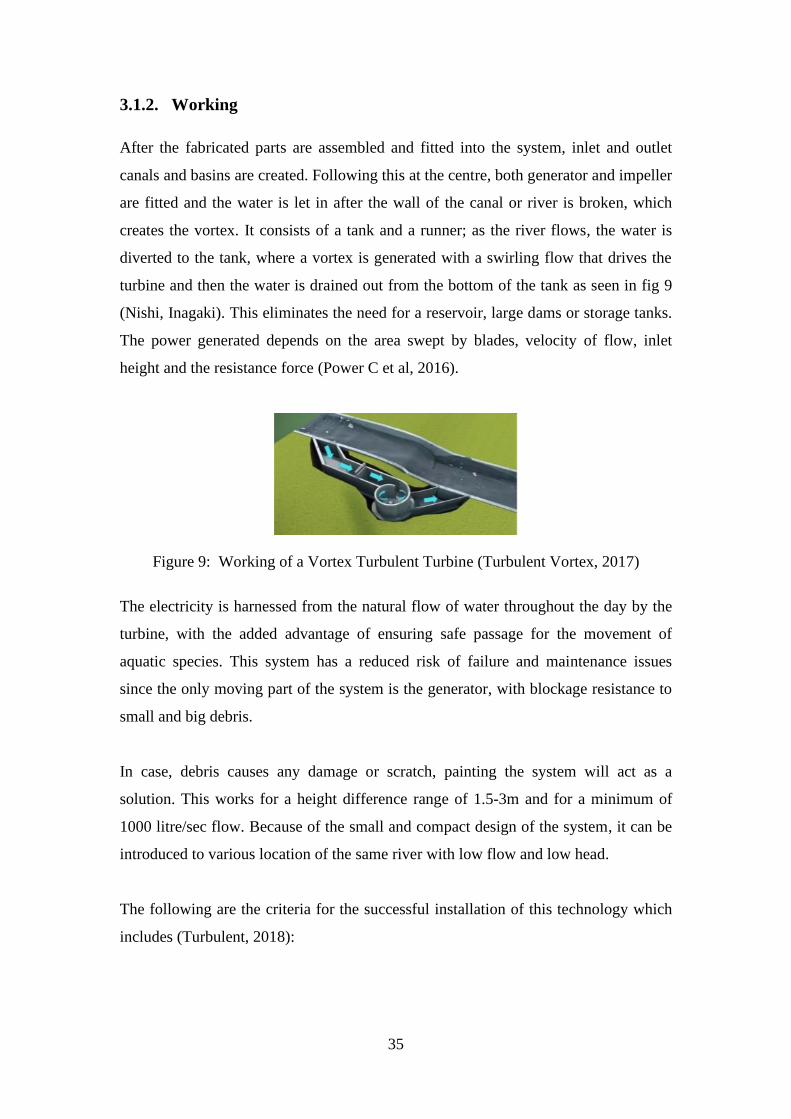
3.1.2. Working
After the fabricated parts are assembled and fitted into the system, inlet and outlet
canals and basins are created. Following this at the centre, both generator and impeller
are fitted and the water is let in after the wall of the canal or river is broken, which
creates the vortex. It consists of a tank and a runner; as the river flows, the water is
diverted to the tank, where a vortex is generated with a swirling flow that drives the
turbine and then the water is drained out from the bottom of the tank as seen in fig 9
(Nishi, Inagaki). This eliminates the need for a reservoir, large dams or storage tanks.
The power generated depends on the area swept by blades, velocity of flow, inlet
height and the resistance force (Power C et al, 2016).
Figure 9: Working of a Vortex Turbulent Turbine (Turbulent Vortex, 2017)
The electricity is harnessed from the natural flow of water throughout the day by the
turbine, with the added advantage of ensuring safe passage for the movement of
aquatic species. This system has a reduced risk of failure and maintenance issues
since the only moving part of the system is the generator, with blockage resistance to
small and big debris.
In case, debris causes any damage or scratch, painting the system will act as a
solution. This works for a height difference range of 1.5-3m and for a minimum of
1000 litre/sec flow. Because of the small and compact design of the system, it can be
introduced to various location of the same river with low flow and low head.
The following are the criteria for the successful installation of this technology which
includes (Turbulent, 2018):
36
• The minimum required level of drop lies in the range of 1.5 to 3m and in
the case of a drop higher than 5m and for proportionally higher flow, two
turbines can even be installed sequentially.
• The flow is expected to be at the least 1 m3/s which has to be preferably a
perennial source or with a minimum consistency of nine months.
• In case of the turbine being installed on land, ideally, the location needs to
have a road nearby, as that can prevent any unnecessary damage to the
environment or road works.
• For remote controlling of the system (optional), for the best operation
would be in a location with good receptions ideally.
3.1.3. Vortex Micro-Hydro Power Plant Projects
• For instance, Donhiue village in Chile was installed with a vortex turbine
of capacity 15 kW in 2018 (Turbulent, 2018). The civil works of the entire
system took less than a week after a concrete basin was installed in two
weeks. The available head was 170 cm and the river flow were estimated
to be around 16200 L/s (Turbulent, 2018). This installed system is capable
of taking up to .1 m diameter of debris and sand, allowing a smooth
operation 24/7 providing electricity to their farmland.
• A 15kW vortex turbine project was successfully implemented in Chile in
2017 (Cooke, 2018), delivering power to 300 households and working
with an efficiency of 70%. Thus, ensuring the electricity demands of the
villages are met through this MHP system
• Similarly, these vortex turbines have been installed in other places as well,
such as a 5kW turbine in Chile that provides sufficient electricity for six
households and even for a school in Indonesia with a 15-kW vortex turbine
(Turbulent, 2018). The operation of this technology has proven to be
successful from the installations so far.
37
3.1.4. Advantages & Disadvantages of the Technology
Some of the advantages of the system are stated below:
• Usually, a micro-hydro dam power plant has flood risks due to an
unsuccessful sedimentation passage causing threat to natural habitats and
farmlands, whereas, in this technology, the system does not restrict the flow of
water, eliminating this issue. Unlike the traditional large power plants, this
small-scale technology doesn’t require a reservoir, storage tank or a dam. It
makes use of the energy from water resulting in clean power from minimized
gas emissions, such as carbon monoxide and methane which could have been
the case for traditional systems, consisting of reservoir leading to
sedimentation build-up.
• This micro-hydro dam technology has a safe passage for the fishes and aquatic
life, causing no threat to life. This is because of the reduced stress from the
low revolution of the impeller. The design creates a low-pressure rate of the
turbine near the blades resulting in the safe passage of aquatic life.
The run-off river schemes also have the following disadvantages:
• Although they produce electricity all year round the predictability of power is
varied depending on the flow of the river and the major drawback being
unable to store energy. Depending on the seasons, adaptability to demand is
varied, for instance in the winter season if the rivers freeze (not the case for
the villages selected) no electricity will be produced, in summer season if the
area is dry the flow of water is affected resulting in a lower production of
power, but on the contrary rainy season produces results in high electricity
production.
• The run-off river scheme is best suited for locations where the flow of river is
maximum and has a sufficient head. For instance, near a waterfall or where
there is steep drop inflow of water.
The turbine technology implemented in different parts of the world as mentioned
above are functioning efficiently nulling out the challenges of system.
38
3.2. Proposed Location of the System
As discussed previously, the unelectrified remote rural communities in developing
countries like India and especially the chosen site location faces challenges like the
huge costs for building substations added to that its inaccessibility, interrupted power
supply, enormous losses in transmission and even political issues.
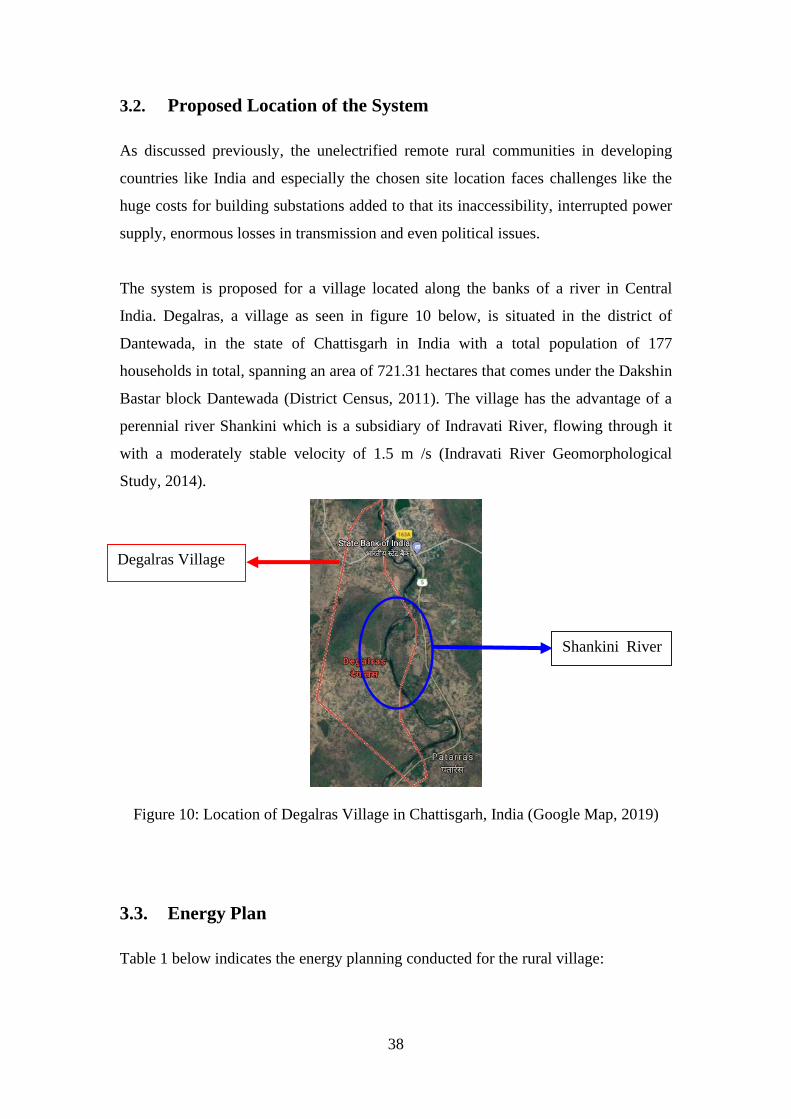
The system is proposed for a village located along the banks of a river in Central
India. Degalras, a village as seen in figure 10 below, is situated in the district of
Dantewada, in the state of Chattisgarh in India with a total population of 177
households in total, spanning an area of 721.31 hectares that comes under the Dakshin
Bastar block Dantewada (District Census, 2011). The village has the advantage of a
perennial river Shankini which is a subsidiary of Indravati River, flowing through it
with a moderately stable velocity of 1.5 m /s (Indravati River Geomorphological
Study, 2014).
Figure 10: Location of Degalras Village in Chattisgarh, India (Google Map, 2019)
3.3. Energy Plan
Table 1 below indicates the energy planning conducted for the rural village:
Shankini River
Flow
Degalras Village
39
Table 1: Energy Plan for Degalras Village
Rural Energy Requirement Proposed Energy Plan
Lighting Solar Lantern
Irrigation, Water Supply & Livestock Solar Water Pump
Street Lighting Solar Street Light
Cooking/household Solar Box Cooker
Cooking/community Community Solar Cooker
Electricity for domestic & community
loads
Micro-hydro, Solar PV & Battery
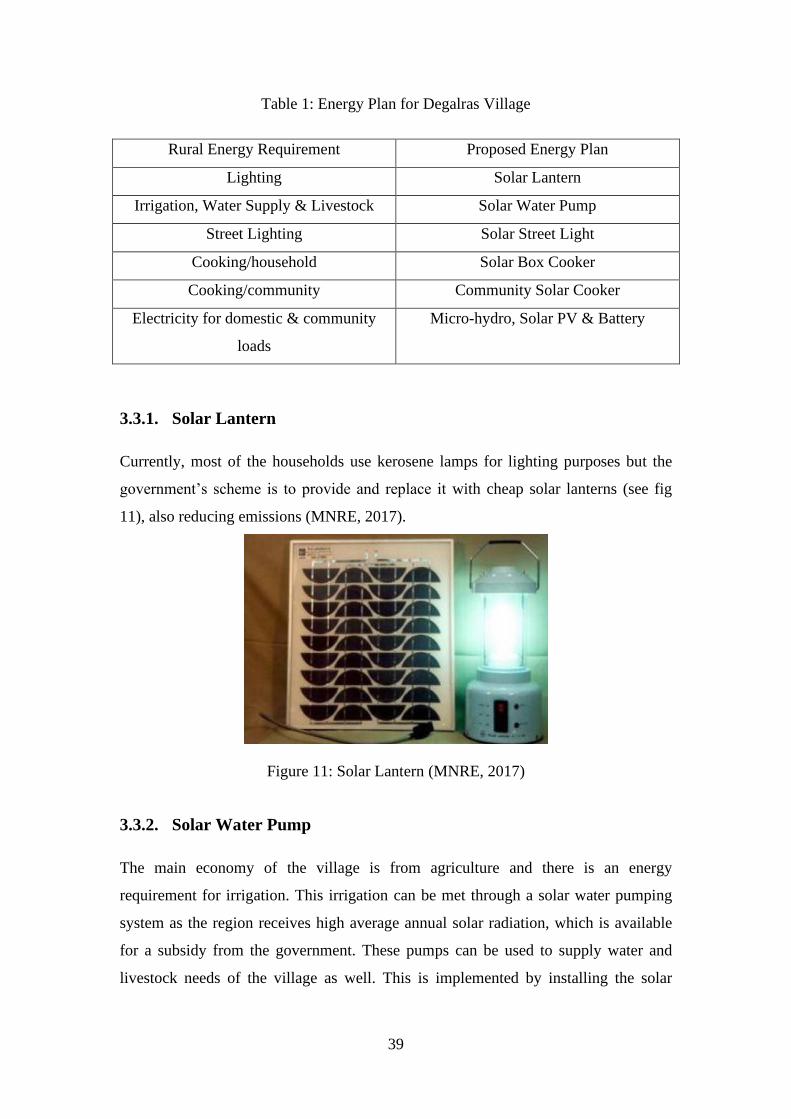
3.3.1. Solar Lantern
Currently, most of the households use kerosene lamps for lighting purposes but the
government’s scheme is to provide and replace it with cheap solar lanterns (see fig
11), also reducing emissions (MNRE, 2017).
Figure 11: Solar Lantern (MNRE, 2017)
3.3.2. Solar Water Pump
The main economy of the village is from agriculture and there is an energy
requirement for irrigation. This irrigation can be met through a solar water pumping
system as the region receives high average annual solar radiation, which is available
for a subsidy from the government. These pumps can be used to supply water and
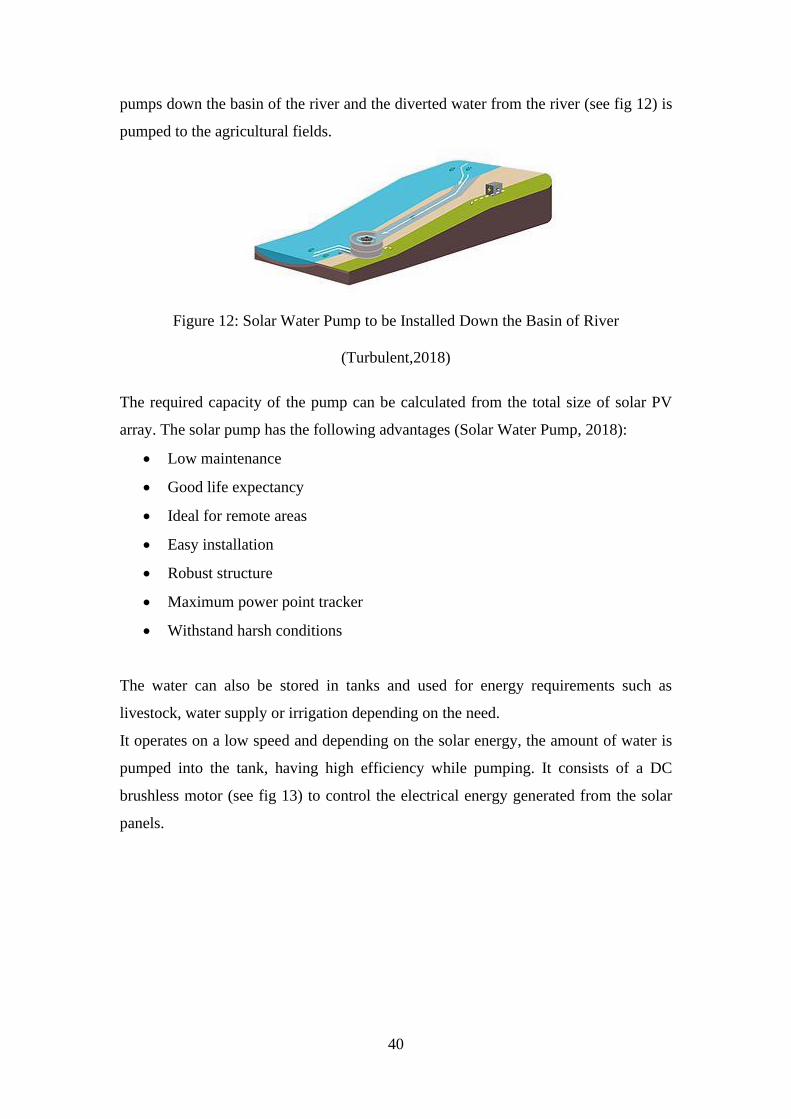
livestock needs of the village as well. This is implemented by installing the solar
40
pumps down the basin of the river and the diverted water from the river (see fig 12) is
pumped to the agricultural fields.
Figure 12: Solar Water Pump to be Installed Down the Basin of River
(Turbulent,2018)
The required capacity of the pump can be calculated from the total size of solar PV
array. The solar pump has the following advantages (Solar Water Pump, 2018):
• Low maintenance
• Good life expectancy
• Ideal for remote areas
• Easy installation
• Robust structure
• Maximum power point tracker
• Withstand harsh conditions
The water can also be stored in tanks and used for energy requirements such as
livestock, water supply or irrigation depending on the need.
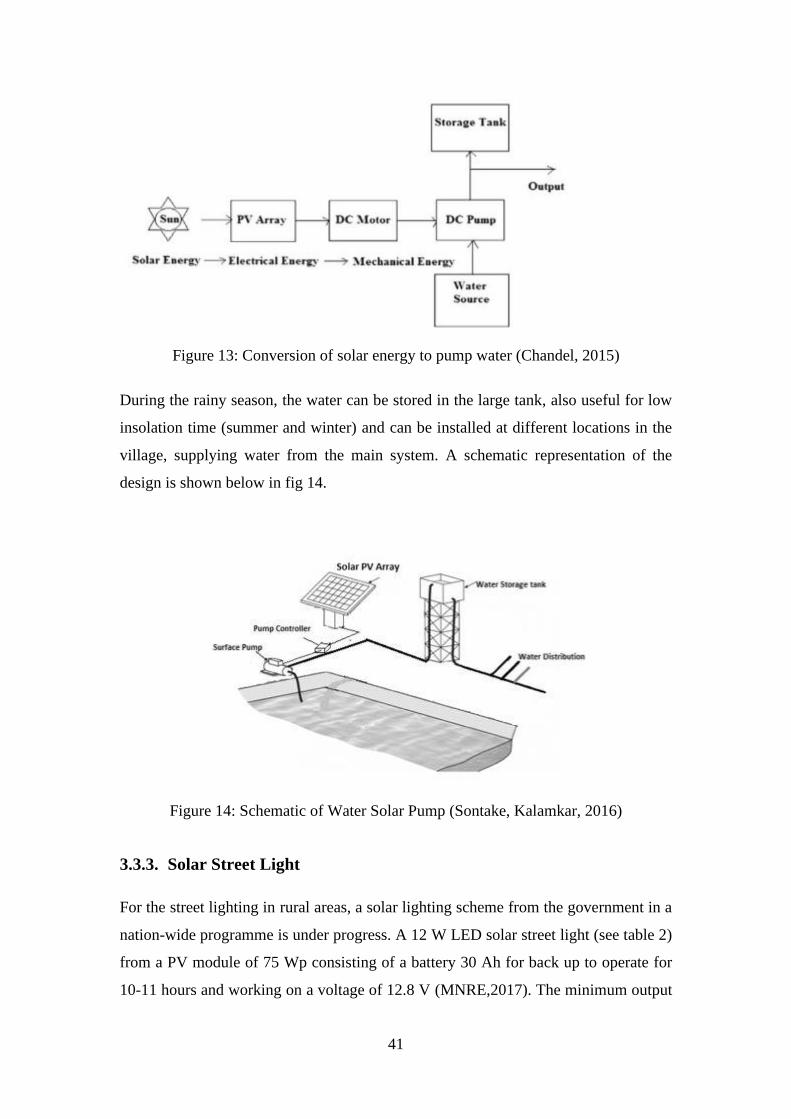
It operates on a low speed and depending on the solar energy, the amount of water is
pumped into the tank, having high efficiency while pumping. It consists of a DC
brushless motor (see fig 13) to control the electrical energy generated from the solar
panels.
41
Figure 13: Conversion of solar energy to pump water (Chandel, 2015)
During the rainy season, the water can be stored in the large tank, also useful for low
insolation time (summer and winter) and can be installed at different locations in the
village, supplying water from the main system. A schematic representation of the
design is shown below in fig 14.
Figure 14: Schematic of Water Solar Pump (Sontake, Kalamkar, 2016)
3.3.3. Solar Street Light
For the street lighting in rural areas, a solar lighting scheme from the government in a
nation-wide programme is under progress. A 12 W LED solar street light (see table 2)
from a PV module of 75 Wp consisting of a battery 30 Ah for back up to operate for
10-11 hours and working on a voltage of 12.8 V (MNRE,2017). The minimum output
42
intensity from the light is 24 lux measured 4m from under the light, for the first four
hours and rest of the time it operates at 12 lux, with an efficiency of 90 % and
autonomy of 3 hours with a fully charged Li-ion battery back-up, ideal for village
applications (MNRE, 2017). 15 street lamps are proposed for the village chosen that
are maintenance free.
Table 2: Solar Street Light Specifications (MNRE,2017)
Component Specification
Lamp 12 W
Intensity of light output 24 lux max, 12 lux min at 4m below light
Efficiency 90%
Autonomy 2-3 days if battery is with full charge
LFP Battery 12.8 V, 30 Ah
3.3.4. Solar Box Cooker for Households
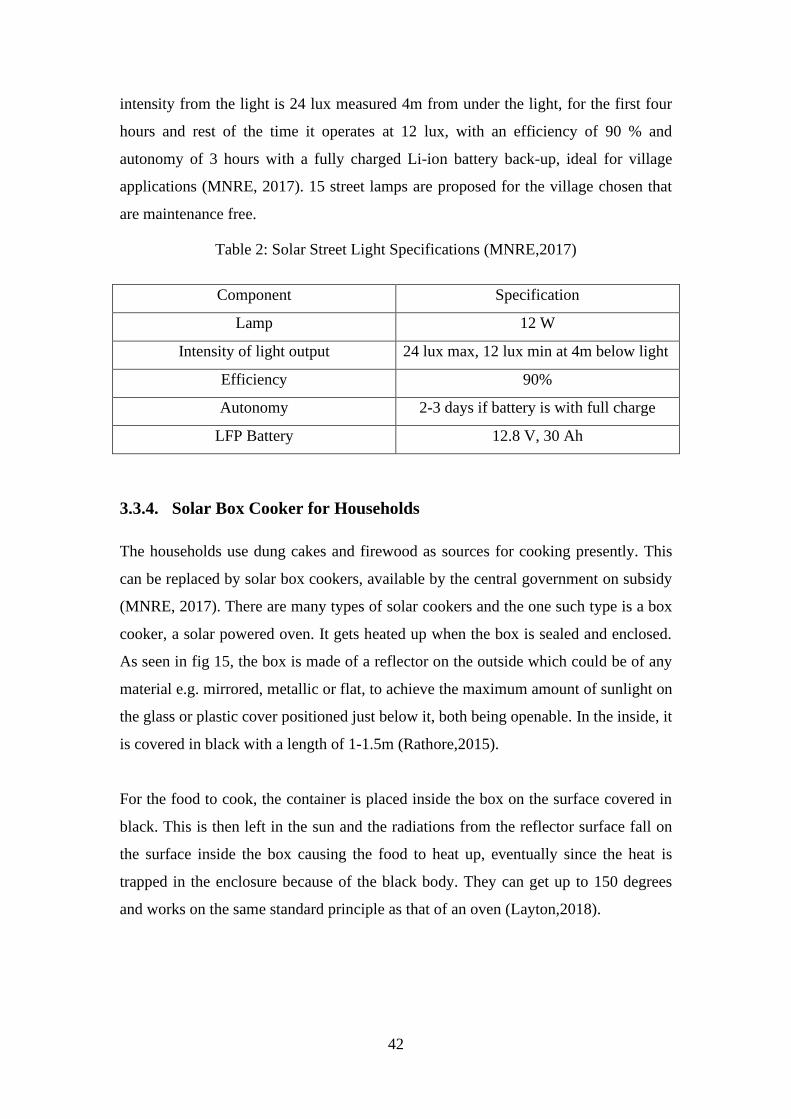
The households use dung cakes and firewood as sources for cooking presently. This
can be replaced by solar box cookers, available by the central government on subsidy
(MNRE, 2017). There are many types of solar cookers and the one such type is a box
cooker, a solar powered oven. It gets heated up when the box is sealed and enclosed.
As seen in fig 15, the box is made of a reflector on the outside which could be of any
material e.g. mirrored, metallic or flat, to achieve the maximum amount of sunlight on
the glass or plastic cover positioned just below it, both being openable. In the inside, it
is covered in black with a length of 1-1.5m (Rathore,2015).
For the food to cook, the container is placed inside the box on the surface covered in
black. This is then left in the sun and the radiations from the reflector surface fall on
the surface inside the box causing the food to heat up, eventually since the heat is
trapped in the enclosure because of the black body. They can get up to 150 degrees
and works on the same standard principle as that of an oven (Layton,2018).
43
Figure 15: Solar Box Cooker (Rathore,2015)
3.3.5. Solar Cooker for Community-Scale
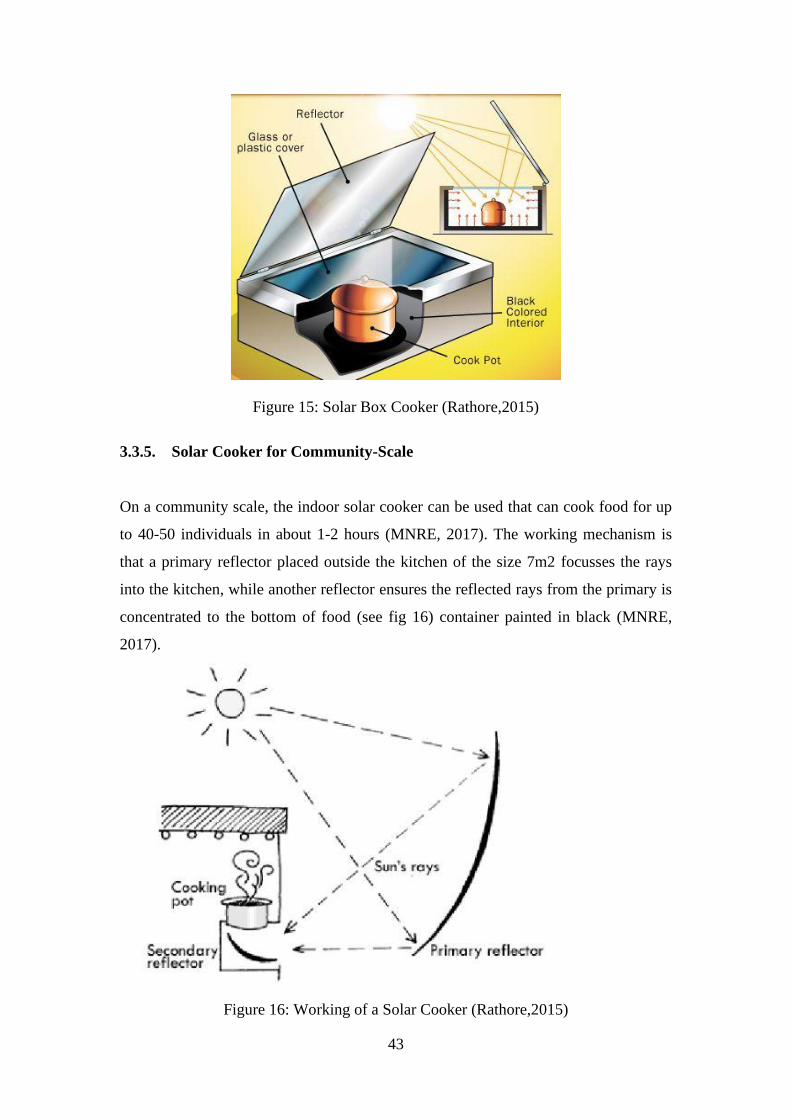
On a community scale, the indoor solar cooker can be used that can cook food for up
to 40-50 individuals in about 1-2 hours (MNRE, 2017). The working mechanism is
that a primary reflector placed outside the kitchen of the size 7m2 focusses the rays
into the kitchen, while another reflector ensures the reflected rays from the primary is
concentrated to the bottom of food (see fig 16) container painted in black (MNRE,
2017).
Figure 16: Working of a Solar Cooker (Rathore,2015)
44
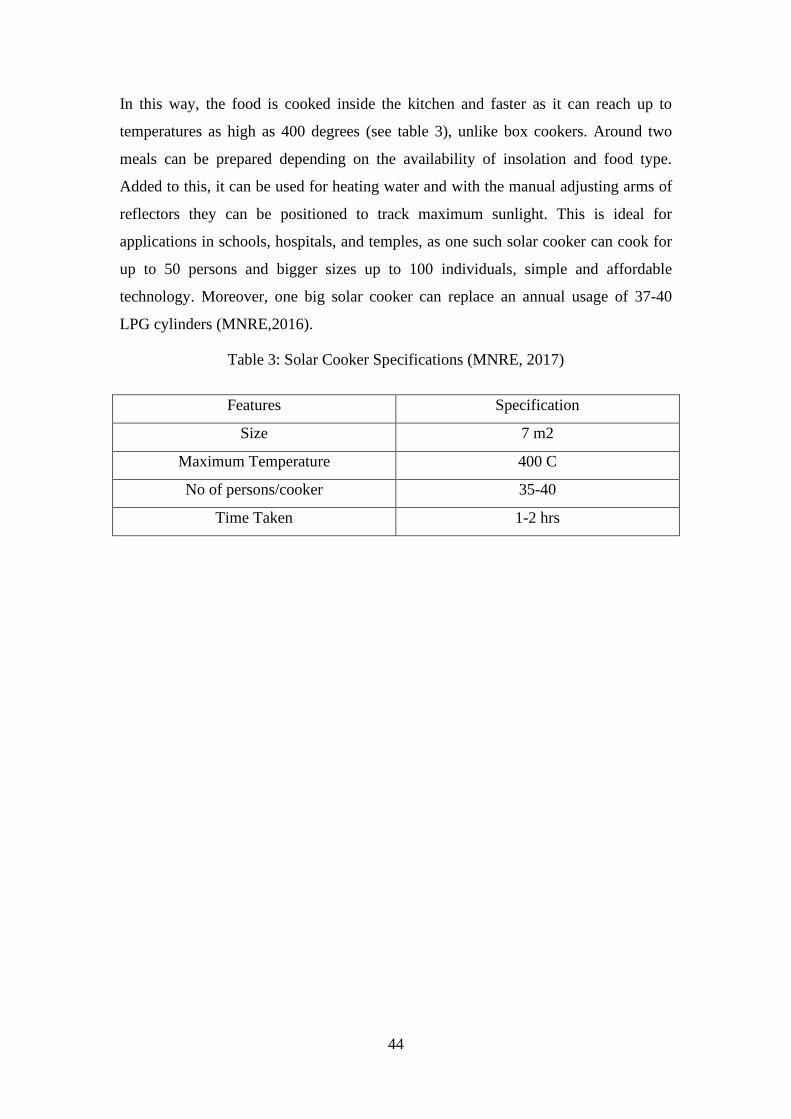
In this way, the food is cooked inside the kitchen and faster as it can reach up to
temperatures as high as 400 degrees (see table 3), unlike box cookers. Around two
meals can be prepared depending on the availability of insolation and food type.
Added to this, it can be used for heating water and with the manual adjusting arms of
reflectors they can be positioned to track maximum sunlight. This is ideal for
applications in schools, hospitals, and temples, as one such solar cooker can cook for
up to 50 persons and bigger sizes up to 100 individuals, simple and affordable
technology. Moreover, one big solar cooker can replace an annual usage of 37-40
LPG cylinders (MNRE,2016).
Table 3: Solar Cooker Specifications (MNRE, 2017)
Features Specification
Size 7 m2
Maximum Temperature 400 C
No of persons/cooker 35-40
Time Taken 1-2 hrs
45
Chapter 4: Energy Modelling
4.1. Energy Demand of the Village
The consumption of electricity in the village Degalras have been categorized into
residential and community loads. Since these villages belong to low-income
households, the load profile is created considering average demand for electricity,
similar to a rural village in Sub-Saharan Africa (NREL,2018).
4.1.1. Household Energy Demand
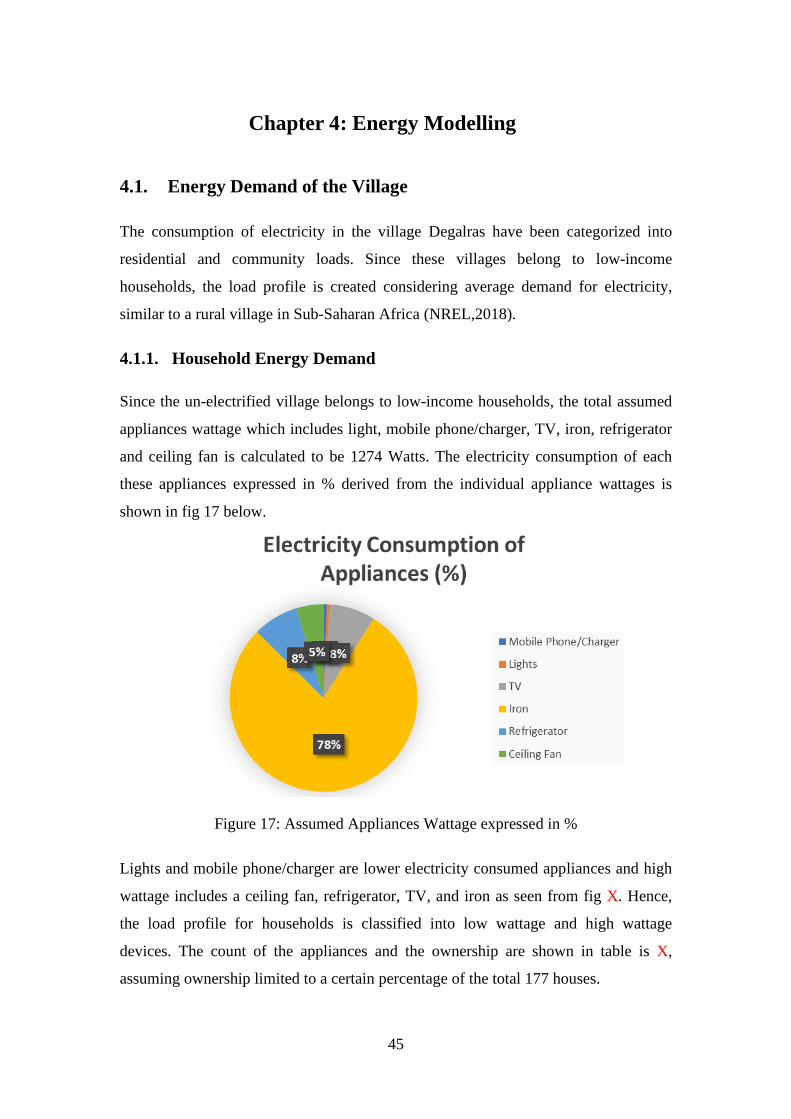
Since the un-electrified village belongs to low-income households, the total assumed
appliances wattage which includes light, mobile phone/charger, TV, iron, refrigerator
and ceiling fan is calculated to be 1274 Watts. The electricity consumption of each
these appliances expressed in % derived from the individual appliance wattages is
shown in fig 17 below.
Figure 17: Assumed Appliances Wattage expressed in %
Lights and mobile phone/charger are lower electricity consumed appliances and high
wattage includes a ceiling fan, refrigerator, TV, and iron as seen from fig X. Hence,
the load profile for households is classified into low wattage and high wattage
devices. The count of the appliances and the ownership are shown in table is X,
assuming ownership limited to a certain percentage of the total 177 houses.
46
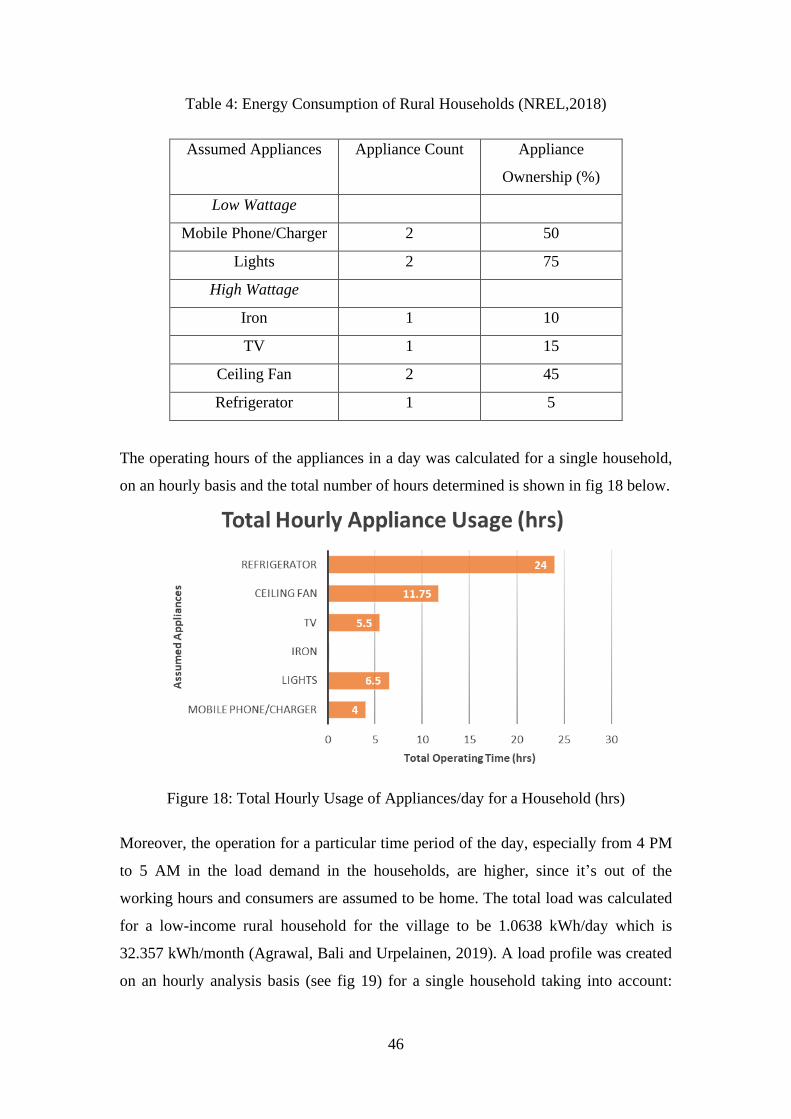
Table 4: Energy Consumption of Rural Households (NREL,2018)
Assumed Appliances Appliance Count Appliance
Ownership (%)
Low Wattage
Mobile Phone/Charger 2 50
Lights 2 75
High Wattage
Iron 1 10
TV 1 15
Ceiling Fan 2 45
Refrigerator 1 5
The operating hours of the appliances in a day was calculated for a single household,
on an hourly basis and the total number of hours determined is shown in fig 18 below.
Figure 18: Total Hourly Usage of Appliances/day for a Household (hrs)
Moreover, the operation for a particular time period of the day, especially from 4 PM
to 5 AM in the load demand in the households, are higher, since it’s out of the
working hours and consumers are assumed to be home. The total load was calculated
for a low-income rural household for the village to be 1.0638 kWh/day which is
32.357 kWh/month (Agrawal, Bali and Urpelainen, 2019). A load profile was created
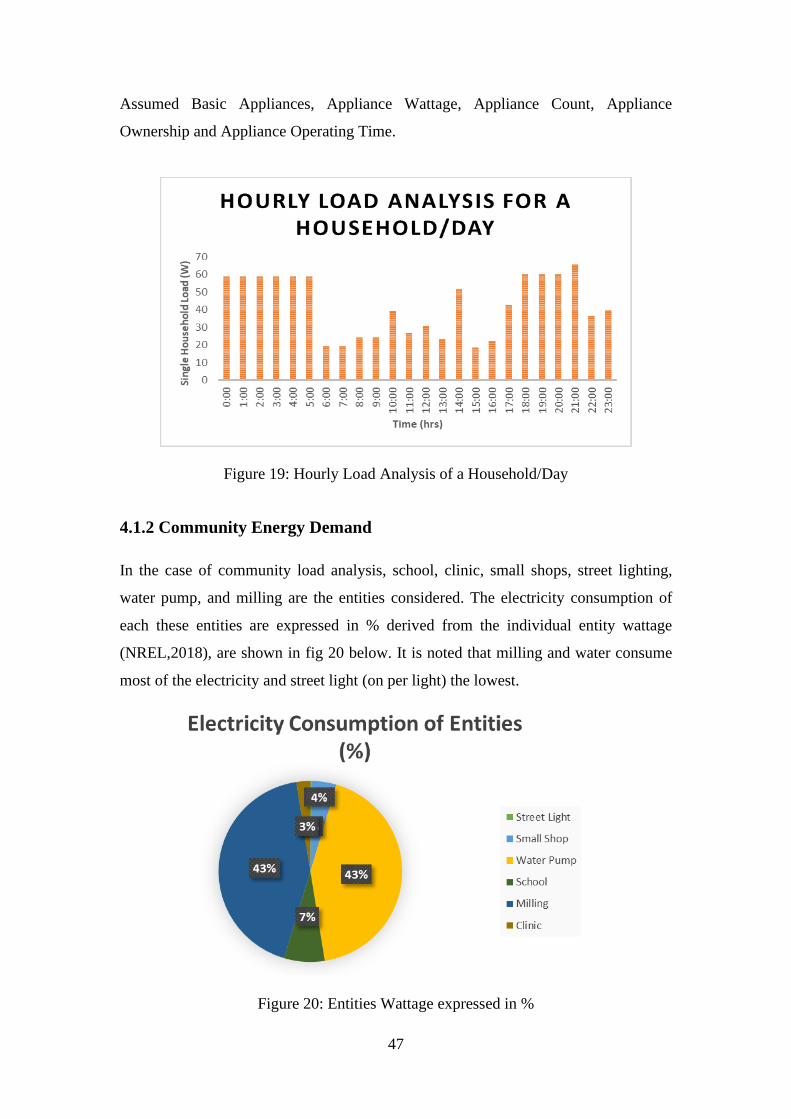
on an hourly analysis basis (see fig 19) for a single household taking into account:
47
Assumed Basic Appliances, Appliance Wattage, Appliance Count, Appliance
Ownership and Appliance Operating Time.
Figure 19: Hourly Load Analysis of a Household/Day
4.1.2 Community Energy Demand
In the case of community load analysis, school, clinic, small shops, street lighting,
water pump, and milling are the entities considered. The electricity consumption of
each these entities are expressed in % derived from the individual entity wattage
(NREL,2018), are shown in fig 20 below. It is noted that milling and water consume
most of the electricity and street light (on per light) the lowest.
Figure 20: Entities Wattage expressed in %
48
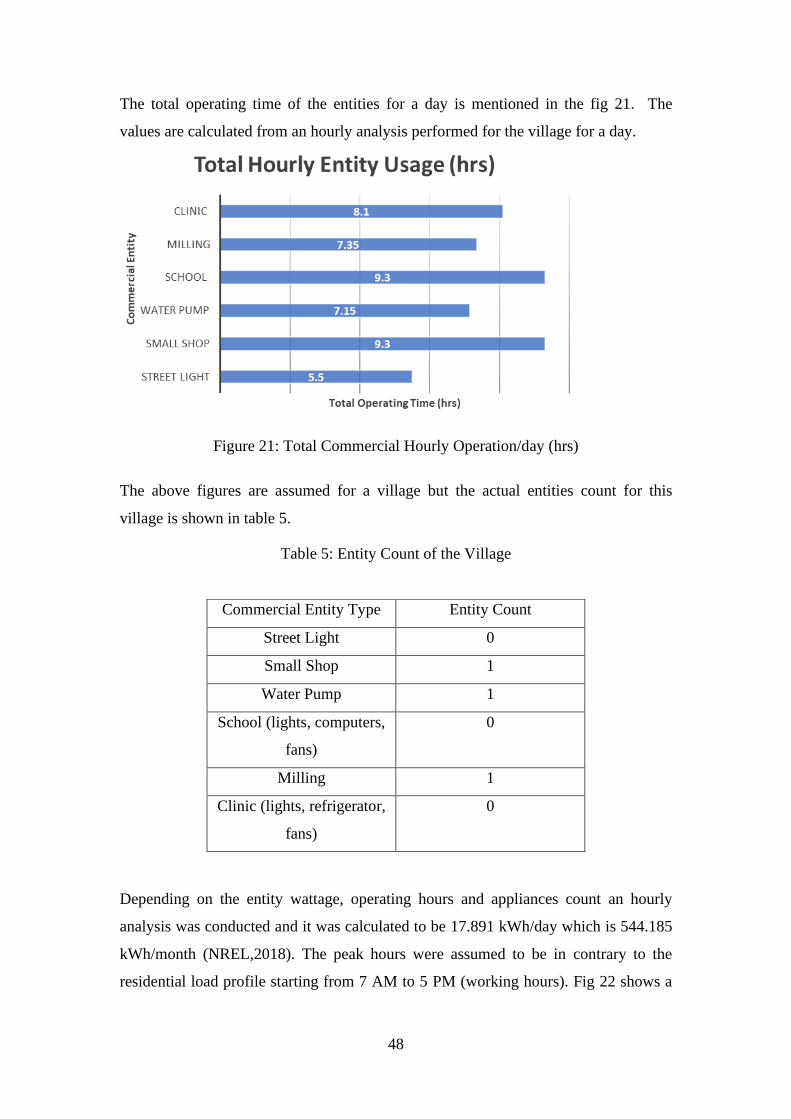
The total operating time of the entities for a day is mentioned in the fig 21. The
values are calculated from an hourly analysis performed for the village for a day.
Figure 21: Total Commercial Hourly Operation/day (hrs)
The above figures are assumed for a village but the actual entities count for this
village is shown in table 5.
Table 5: Entity Count of the Village
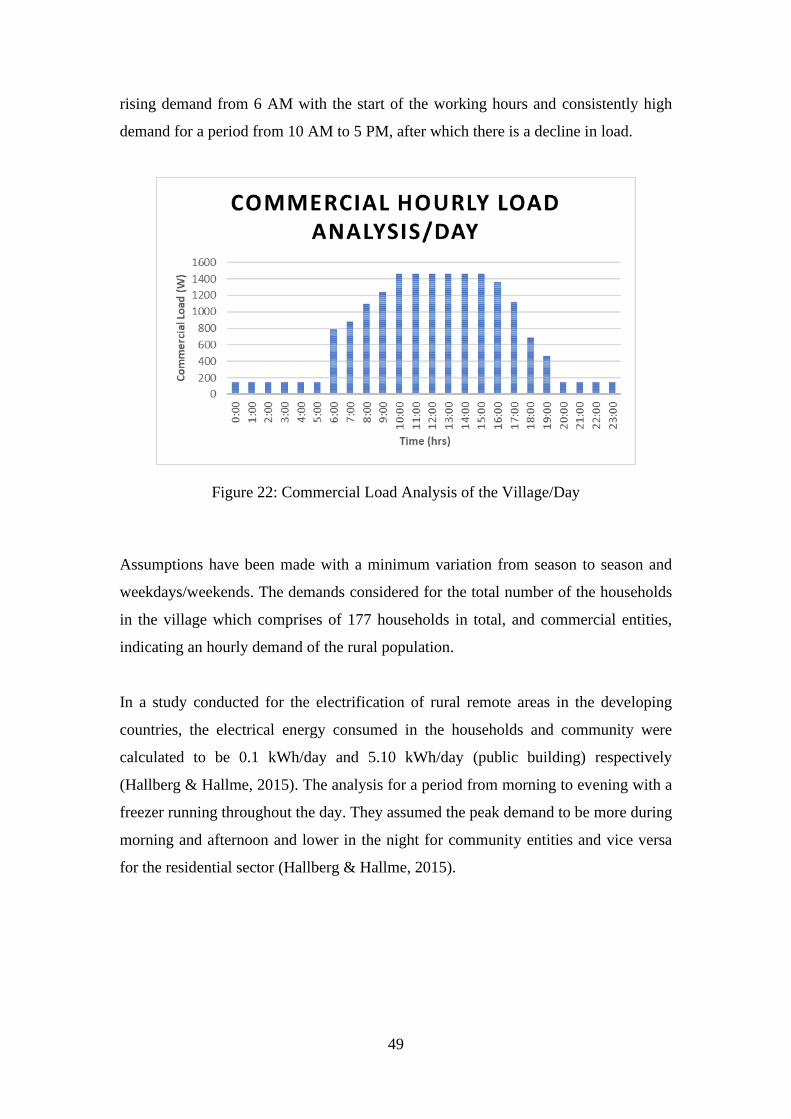
Depending on the entity wattage, operating hours and appliances count an hourly
analysis was conducted and it was calculated to be 17.891 kWh/day which is 544.185
kWh/month (NREL,2018). The peak hours were assumed to be in contrary to the
residential load profile starting from 7 AM to 5 PM (working hours). Fig 22 shows a
Commercial Entity Type Entity Count
Street Light 0
Small Shop 1
Water Pump 1
School (lights, computers,
fans)
0
Milling 1
Clinic (lights, refrigerator,
fans)
0
49
rising demand from 6 AM with the start of the working hours and consistently high
demand for a period from 10 AM to 5 PM, after which there is a decline in load.
Figure 22: Commercial Load Analysis of the Village/Day
Assumptions have been made with a minimum variation from season to season and
weekdays/weekends. The demands considered for the total number of the households
in the village which comprises of 177 households in total, and commercial entities,
indicating an hourly demand of the rural population.
In a study conducted for the electrification of rural remote areas in the developing
countries, the electrical energy consumed in the households and community were
calculated to be 0.1 kWh/day and 5.10 kWh/day (public building) respectively
(Hallberg & Hallme, 2015). The analysis for a period from morning to evening with a
freezer running throughout the day. They assumed the peak demand to be more during
morning and afternoon and lower in the night for community entities and vice versa
for the residential sector (Hallberg & Hallme, 2015).
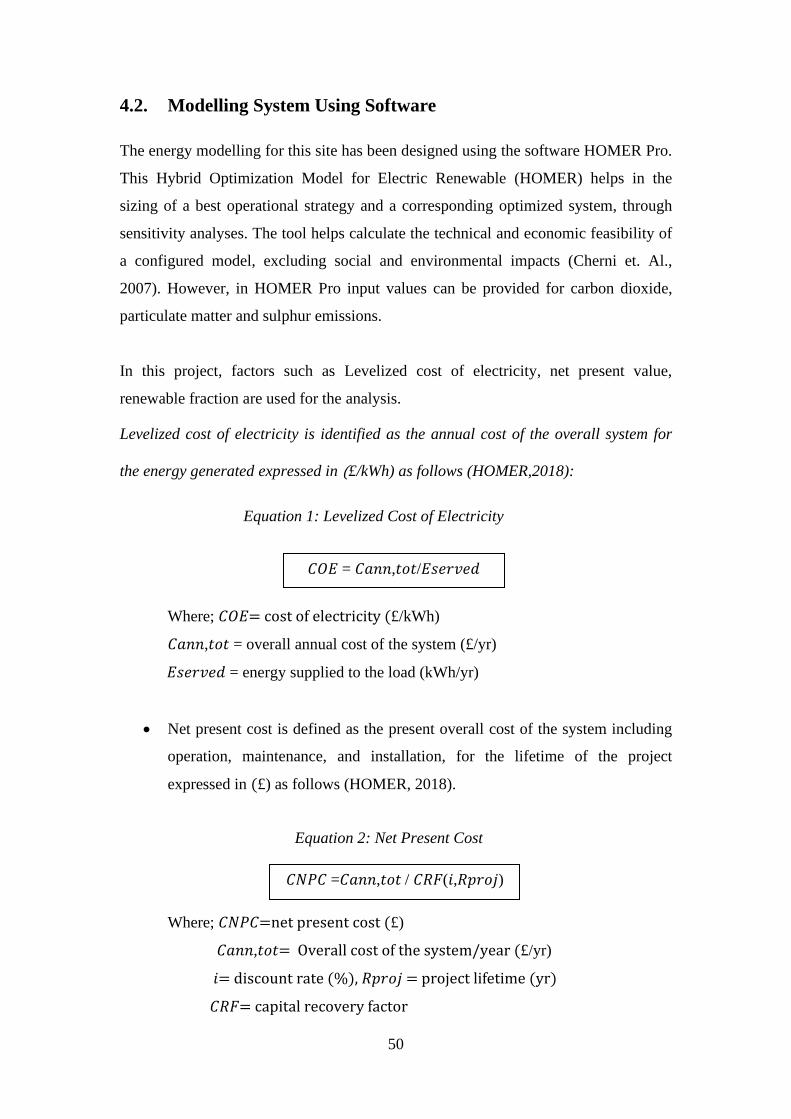
50
4.2. Modelling System Using Software
The energy modelling for this site has been designed using the software HOMER Pro.
This Hybrid Optimization Model for Electric Renewable (HOMER) helps in the
sizing of a best operational strategy and a corresponding optimized system, through
sensitivity analyses. The tool helps calculate the technical and economic feasibility of
a configured model, excluding social and environmental impacts (Cherni et. Al.,
2007). However, in HOMER Pro input values can be provided for carbon dioxide,
particulate matter and sulphur emissions.
In this project, factors such as Levelized cost of electricity, net present value,
renewable fraction are used for the analysis.
Levelized cost of electricity is identified as the annual cost of the overall system for
the energy generated expressed in (£/kWh) as follows (HOMER,2018):
Equation 1: Levelized Cost of Electricity
Where; 𝐶𝑂𝐸= cost of electricity (£/kWh)
𝐶𝑎𝑛𝑛,𝑡𝑜𝑡 = overall annual cost of the system (£/yr)
𝐸𝑠𝑒𝑟𝑣𝑒𝑑 = energy supplied to the load (kWh/yr)
• Net present cost is defined as the present overall cost of the system including
operation, maintenance, and installation, for the lifetime of the project
expressed in (£) as follows (HOMER, 2018).
Where; 𝐶𝑁𝑃𝐶=net present cost (£)
𝐶𝑎𝑛𝑛,𝑡𝑜𝑡= Overall cost of the system/year (£/yr)
𝑖= discount rate (%), 𝑅𝑝𝑟𝑜𝑗 = project lifetime (yr)
𝐶𝑅𝐹= capital recovery factor
𝐶𝑂𝐸 = 𝐶𝑎𝑛𝑛,𝑡𝑜𝑡/𝐸𝑠𝑒𝑟𝑣𝑒𝑑
𝐶𝑁𝑃𝐶 =𝐶𝑎𝑛𝑛,𝑡𝑜𝑡 / 𝐶𝑅𝐹(𝑖,𝑅𝑝𝑟𝑜𝑗)
𝐶𝑅𝐹(𝑖,𝑅𝑝𝑟𝑜𝑗)
Equation 2: Net Present Cost
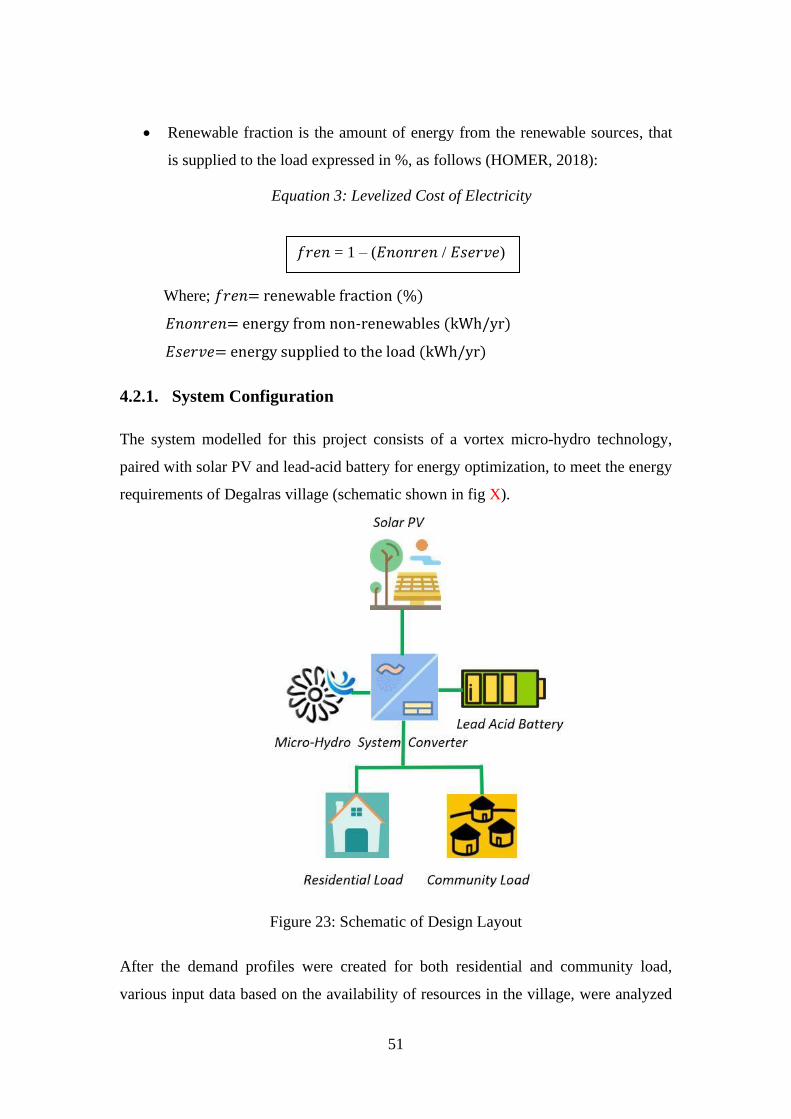
51
• Renewable fraction is the amount of energy from the renewable sources, that
is supplied to the load expressed in %, as follows (HOMER, 2018):
Equation 3: Levelized Cost of Electricity
Where; 𝑓𝑟𝑒𝑛= renewable fraction (%)
𝐸𝑛𝑜𝑛𝑟𝑒𝑛= energy from non-renewables (kWh/yr)
𝐸𝑠𝑒𝑟𝑣𝑒= energy supplied to the load (kWh/yr)
4.2.1. System Configuration
The system modelled for this project consists of a vortex micro-hydro technology,
paired with solar PV and lead-acid battery for energy optimization, to meet the energy
requirements of Degalras village (schematic shown in fig X).
Figure 23: Schematic of Design Layout
After the demand profiles were created for both residential and community load,
various input data based on the availability of resources in the village, were analyzed
𝑓𝑟𝑒𝑛 = 1 – (𝐸𝑛𝑜𝑛𝑟𝑒𝑛 / 𝐸𝑠𝑒𝑟𝑣𝑒)
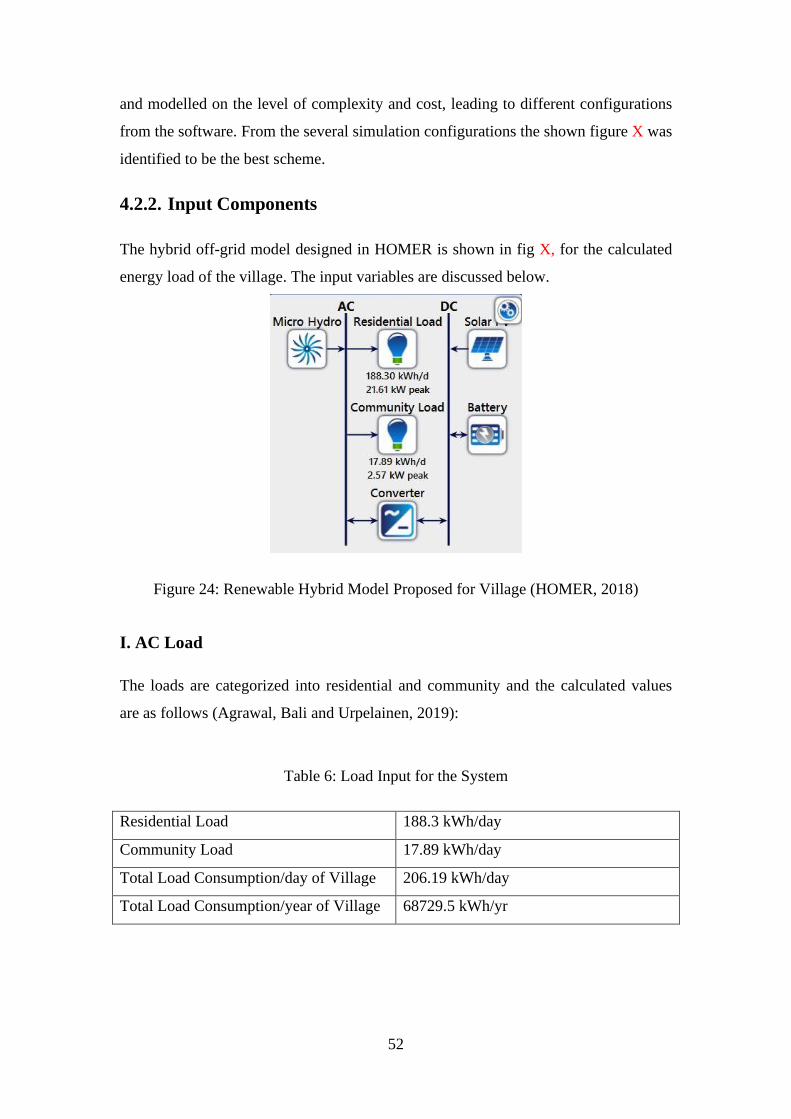
52
and modelled on the level of complexity and cost, leading to different configurations
from the software. From the several simulation configurations the shown figure X was
identified to be the best scheme.
4.2.2. Input Components
The hybrid off-grid model designed in HOMER is shown in fig X, for the calculated
energy load of the village. The input variables are discussed below.
Figure 24: Renewable Hybrid Model Proposed for Village (HOMER, 2018)
Ⅰ. AC Load
The loads are categorized into residential and community and the calculated values
are as follows (Agrawal, Bali and Urpelainen, 2019):
Table 6: Load Input for the System
Residential Load 188.3 kWh/day
Community Load 17.89 kWh/day
Total Load Consumption/day of Village 206.19 kWh/day
Total Load Consumption/year of Village 68729.5 kWh/yr
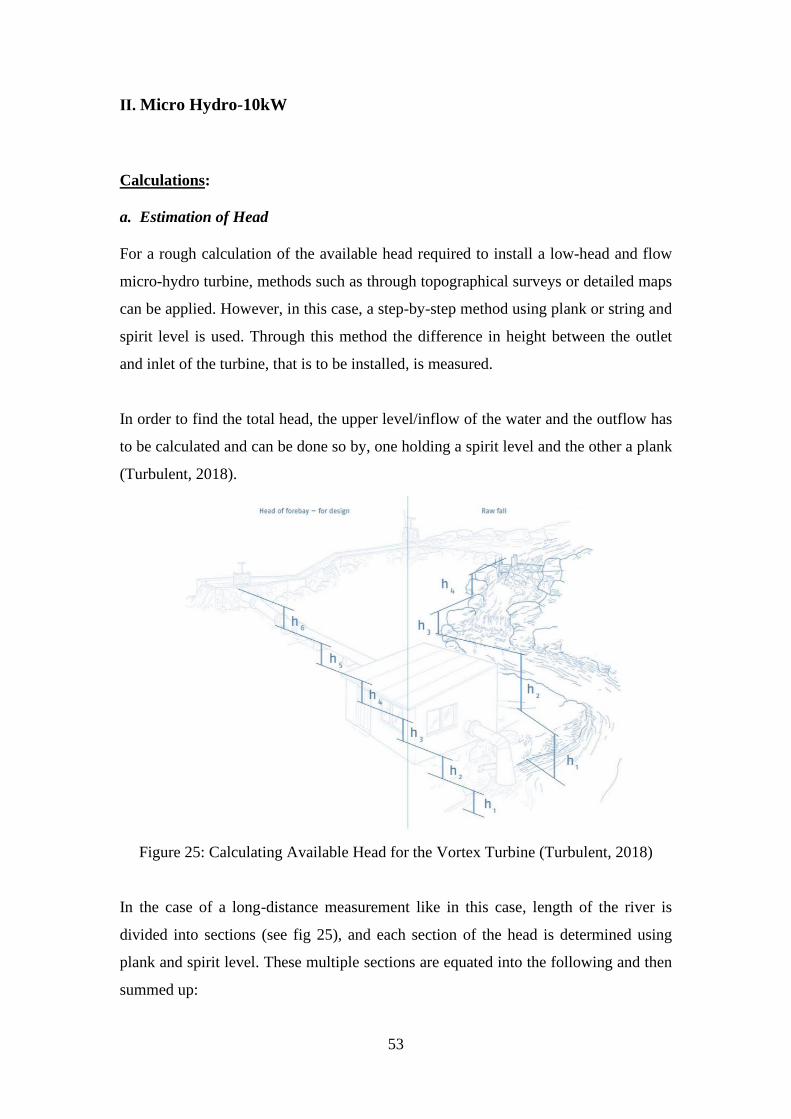
53
Ⅱ. Micro Hydro-10kW
Calculations:
a. Estimation of Head
For a rough calculation of the available head required to install a low-head and flow
micro-hydro turbine, methods such as through topographical surveys or detailed maps
can be applied. However, in this case, a step-by-step method using plank or string and
spirit level is used. Through this method the difference in height between the outlet
and inlet of the turbine, that is to be installed, is measured.
In order to find the total head, the upper level/inflow of the water and the outflow has
to be calculated and can be done so by, one holding a spirit level and the other a plank
(Turbulent, 2018).
Figure 25: Calculating Available Head for the Vortex Turbine (Turbulent, 2018)
In the case of a long-distance measurement like in this case, length of the river is
divided into sections (see fig 25), and each section of the head is determined using
plank and spirit level. These multiple sections are equated into the following and then
summed up:
54
Equation 4: Gross Head Equation (Turbulent, 2018)
Here in the case of river Indravati, gross head for each section of the river is assumed
for a particular length hence, h1=h2=h3=h4=h5= 0.5m and the total head,
Hg= h1+h2+h3+h4+h5= 0.5+0.5+0.5+0.5+0.5= 1.5m (Turbulent, 2018)
b. Estimation of Flow
For understanding the suitability of a turbine prior to its installation, flow needs to be
calculated and an accurate method is by using technical special devices but, a rough
estimation can be performed manually. This step-by-step procedure is called the float
method and the following are the steps (Turbulent, 2018):
• Step 1: Identify that length of the river/canal where the flow of water is even
or has minimum turbulence, this is taken as the length L (metres). For the river
Indravati in this case, the length L is assumed to be for 1 metre, as it has a
stable flow (Indravati River Geomorphological Study, 2014).
• Step 2: Calculate its cross-sectional area by determining the breadth B
(metres) and height H (metres) and substitute into the following equation:
area,
Hence, for a breadth of 1 metre and height also 1 metre the area of the river
will be:
A= 1 x 1= 1 metre square … (1)
Gross Head, Hg= h1+ h2 + h3 + … + hn
Gross Head, Hg = 1.5m.
A= B x H.
Equation 5: Cross-sectional Area of the River
55
• Step 3: Next, in order to calculate the velocity-V (metre/second), that length
of the float calculated previously is let to accelerate itself initially and then the
time-T (second) taken for its travel is measured and equated into:
Equation 6: Velocity of the River
Therefore, length of the float is 1 metre and for a time of 60s the calculated
velocity is (velocity of the river is known to be 1.5 m/s as mentioned
previously):
V= L/T= 1/.6= 1.5m/s… (2)
• Step 4: Finally, the flow rate-Q (metre3/second) is determined by the equation:
Then, here the velocity is 1.5 m/s and the area of cross-section is 1m and so
the rate of flow from (1) and (2) hence,
Q= 1.5 x 1= 1.5 m3/s
c. Vortex Micro-hydro Turbine Model
As mentioned above, with a flow of 1.5m3/s throughout the year (perennial river) and
an estimated available head of 1.5m, HOMER identifies the best hydro capacity of
10kW for the turbine. The result obtained was based on a minimum and maximum
flow of the turbine which is 20% and 100% respectively. According to a vortex
turbine project implemented in Chile, 2017, the efficiency was 70% for an installed
capacity of 15 kW, capable of delivering electricity to around 300 households, hence
V= L/T
Q= V x A
Equation 7: Rate of Flow of River
Q = 1.5 m3/s
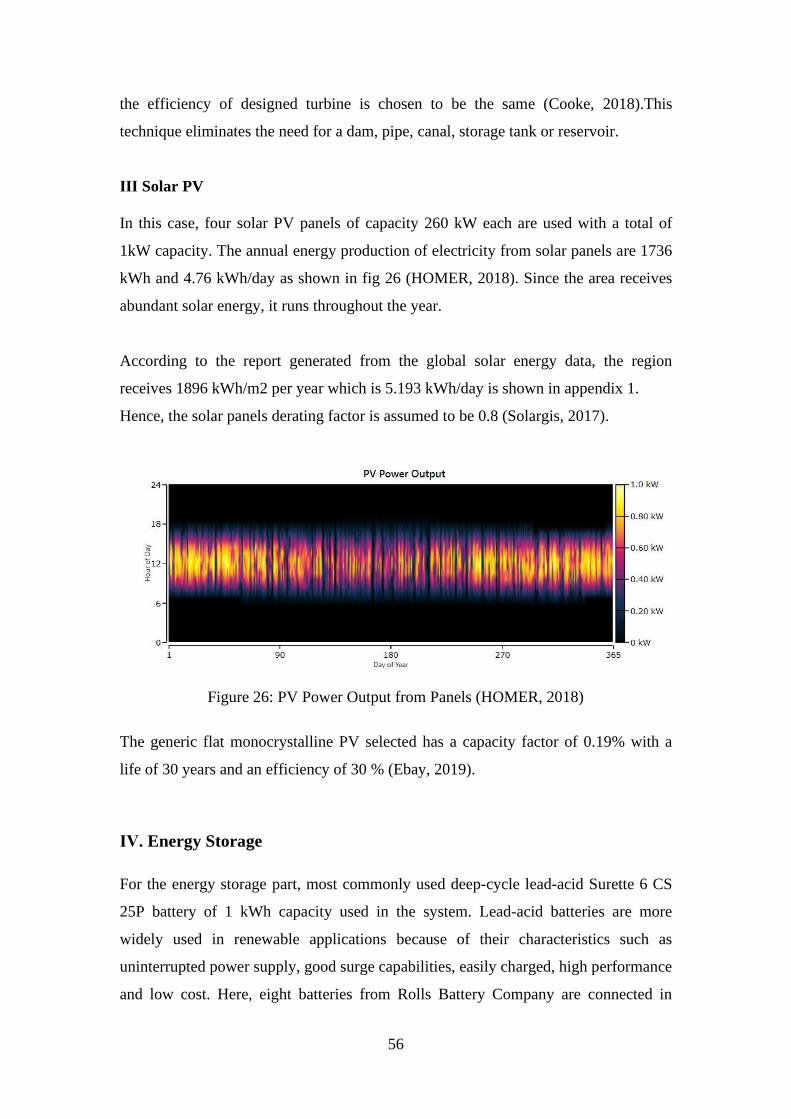
56
the efficiency of designed turbine is chosen to be the same (Cooke, 2018).This
technique eliminates the need for a dam, pipe, canal, storage tank or reservoir.
Ⅲ Solar PV
In this case, four solar PV panels of capacity 260 kW each are used with a total of
1kW capacity. The annual energy production of electricity from solar panels are 1736
kWh and 4.76 kWh/day as shown in fig 26 (HOMER, 2018). Since the area receives
abundant solar energy, it runs throughout the year.
According to the report generated from the global solar energy data, the region
receives 1896 kWh/m2 per year which is 5.193 kWh/day is shown in appendix 1.
Hence, the solar panels derating factor is assumed to be 0.8 (Solargis, 2017).
Figure 26: PV Power Output from Panels (HOMER, 2018)
The generic flat monocrystalline PV selected has a capacity factor of 0.19% with a
life of 30 years and an efficiency of 30 % (Ebay, 2019).
Ⅳ. Energy Storage
For the energy storage part, most commonly used deep-cycle lead-acid Surette 6 CS
25P battery of 1 kWh capacity used in the system. Lead-acid batteries are more
widely used in renewable applications because of their characteristics such as
uninterrupted power supply, good surge capabilities, easily charged, high performance
and low cost. Here, eight batteries from Rolls Battery Company are connected in
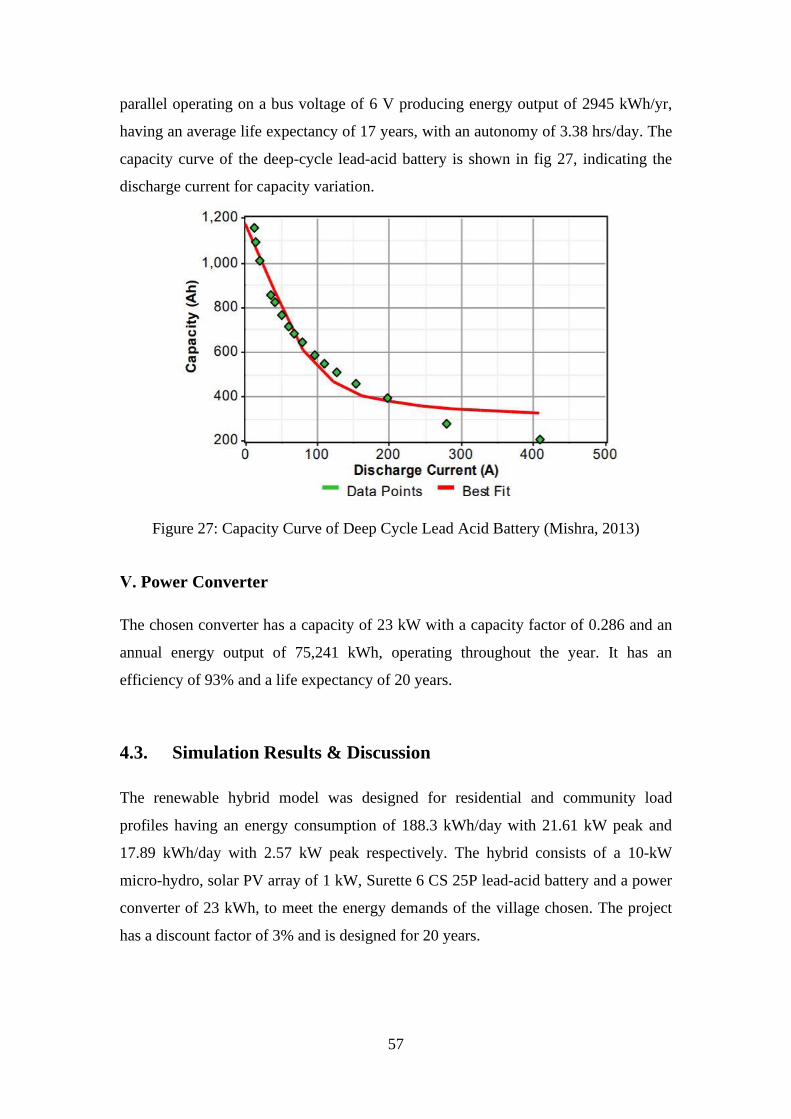
57
parallel operating on a bus voltage of 6 V producing energy output of 2945 kWh/yr,
having an average life expectancy of 17 years, with an autonomy of 3.38 hrs/day. The
capacity curve of the deep-cycle lead-acid battery is shown in fig 27, indicating the
discharge current for capacity variation.
Figure 27: Capacity Curve of Deep Cycle Lead Acid Battery (Mishra, 2013)
Ⅴ. Power Converter
The chosen converter has a capacity of 23 kW with a capacity factor of 0.286 and an
annual energy output of 75,241 kWh, operating throughout the year. It has an
efficiency of 93% and a life expectancy of 20 years.
4.3. Simulation Results & Discussion
The renewable hybrid model was designed for residential and community load
profiles having an energy consumption of 188.3 kWh/day with 21.61 kW peak and
17.89 kWh/day with 2.57 kW peak respectively. The hybrid consists of a 10-kW
micro-hydro, solar PV array of 1 kW, Surette 6 CS 25P lead-acid battery and a power
converter of 23 kWh, to meet the energy demands of the village chosen. The project
has a discount factor of 3% and is designed for 20 years.

58
4.3.1. Vortex Micro- Hydro Turbine
The pipe head loses are minimal hence assumed to be 5% and turbine has a nominal
capacity of 13.2 kW. The technology modeled in HOMER produces annual energy of
110,212 kWh/yr, which is 98% of total energy generation. Since the river is a
perennial source, the operation of the vortex turbine will be for 8760 hours producing
electricity all year round. The turbine designed in HOMER has the characteristics
from the Turbulent technology vortex turbine and has a 3-phase induction generator
that is submersed and water-cooled (Technology, 2018).
Figure 28: Vortex Micro-Hydro Turbine Output Serving Ac Load
The energy generated from the turbine is stable throughout the days (see fig 28) and is
capable of meeting the energy requirements of the village as seen in fig X above.
During certain peaks, the technology, however, fails to meet the energy demand. For
this reason, the system is backed with PV and battery.
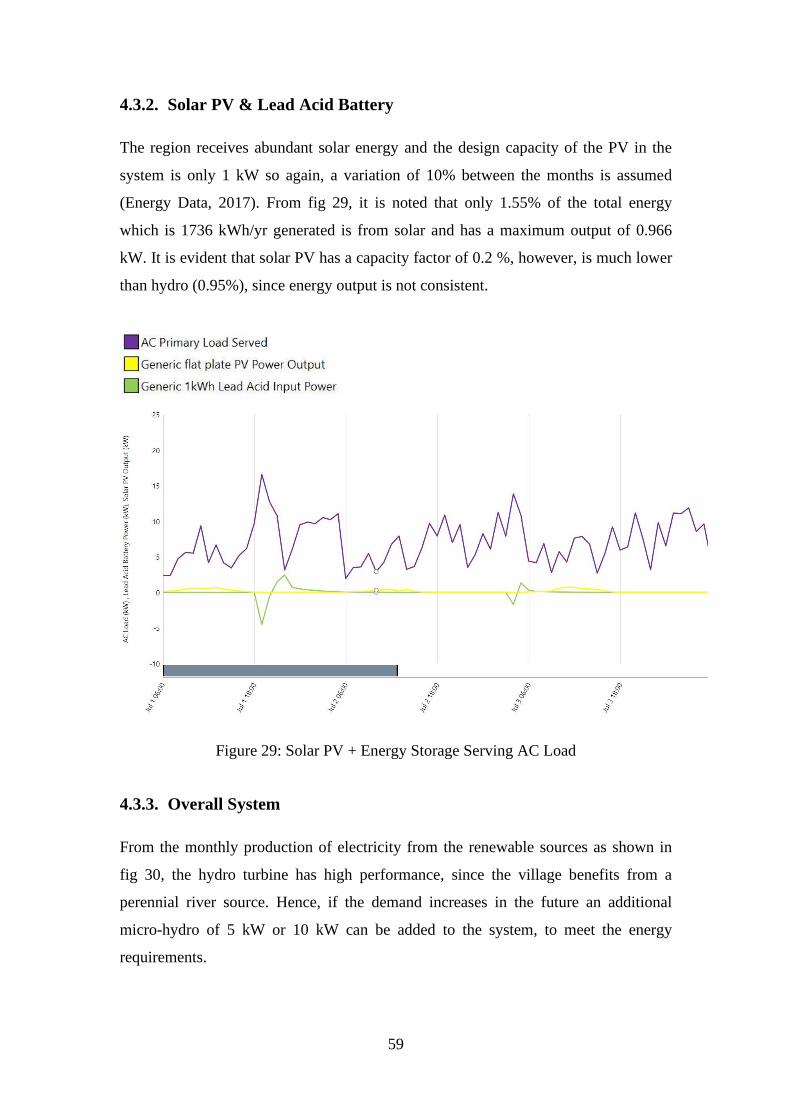
59
4.3.2. Solar PV & Lead Acid Battery
The region receives abundant solar energy and the design capacity of the PV in the
system is only 1 kW so again, a variation of 10% between the months is assumed
(Energy Data, 2017). From fig 29, it is noted that only 1.55% of the total energy
which is 1736 kWh/yr generated is from solar and has a maximum output of 0.966
kW. It is evident that solar PV has a capacity factor of 0.2 %, however, is much lower
than hydro (0.95%), since energy output is not consistent.
Figure 29: Solar PV + Energy Storage Serving AC Load
4.3.3. Overall System
From the monthly production of electricity from the renewable sources as shown in
fig 30, the hydro turbine has high performance, since the village benefits from a
perennial river source. Hence, if the demand increases in the future an additional
micro-hydro of 5 kW or 10 kW can be added to the system, to meet the energy
requirements.
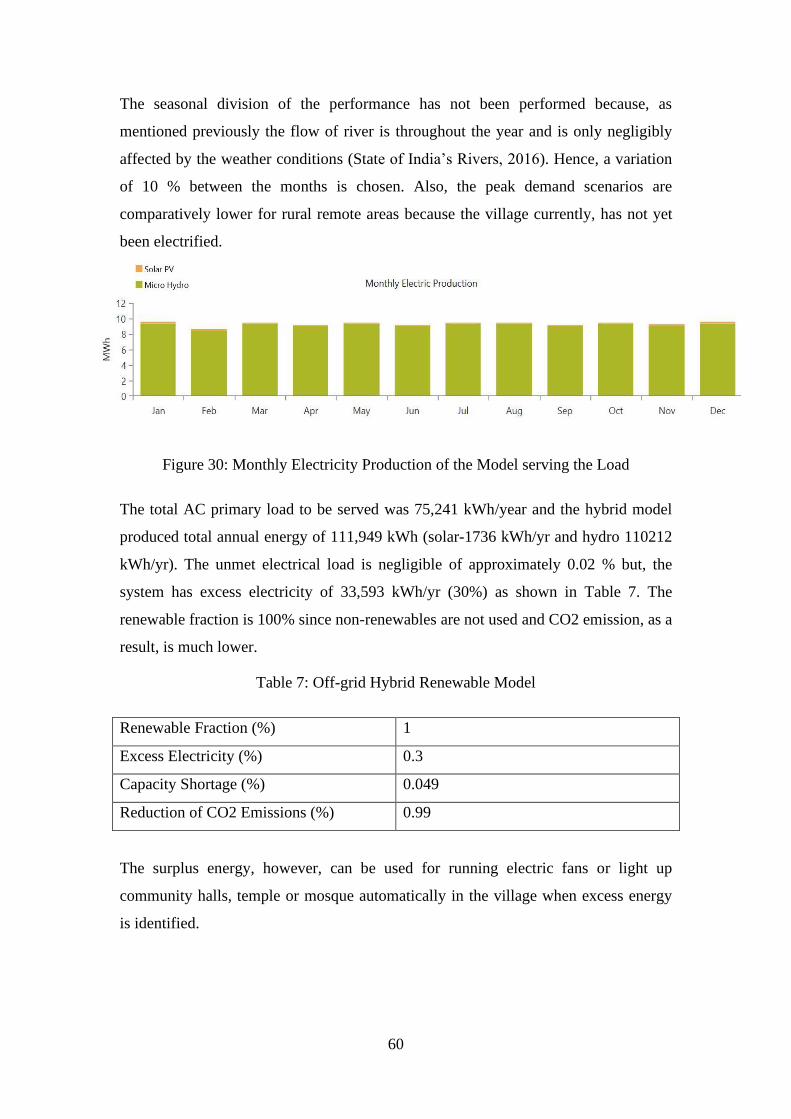
60
The seasonal division of the performance has not been performed because, as
mentioned previously the flow of river is throughout the year and is only negligibly
affected by the weather conditions (State of India’s Rivers, 2016). Hence, a variation
of 10 % between the months is chosen. Also, the peak demand scenarios are
comparatively lower for rural remote areas because the village currently, has not yet
been electrified.
Figure 30: Monthly Electricity Production of the Model serving the Load
The total AC primary load to be served was 75,241 kWh/year and the hybrid model
produced total annual energy of 111,949 kWh (solar-1736 kWh/yr and hydro 110212
kWh/yr). The unmet electrical load is negligible of approximately 0.02 % but, the
system has excess electricity of 33,593 kWh/yr (30%) as shown in Table 7. The
renewable fraction is 100% since non-renewables are not used and CO2 emission, as a
result, is much lower.
Table 7: Off-grid Hybrid Renewable Model
Renewable Fraction (%) 1
Excess Electricity (%) 0.3
Capacity Shortage (%) 0.049
Reduction of CO2 Emissions (%) 0.99
The surplus energy, however, can be used for running electric fans or light up
community halls, temple or mosque automatically in the village when excess energy
is identified.
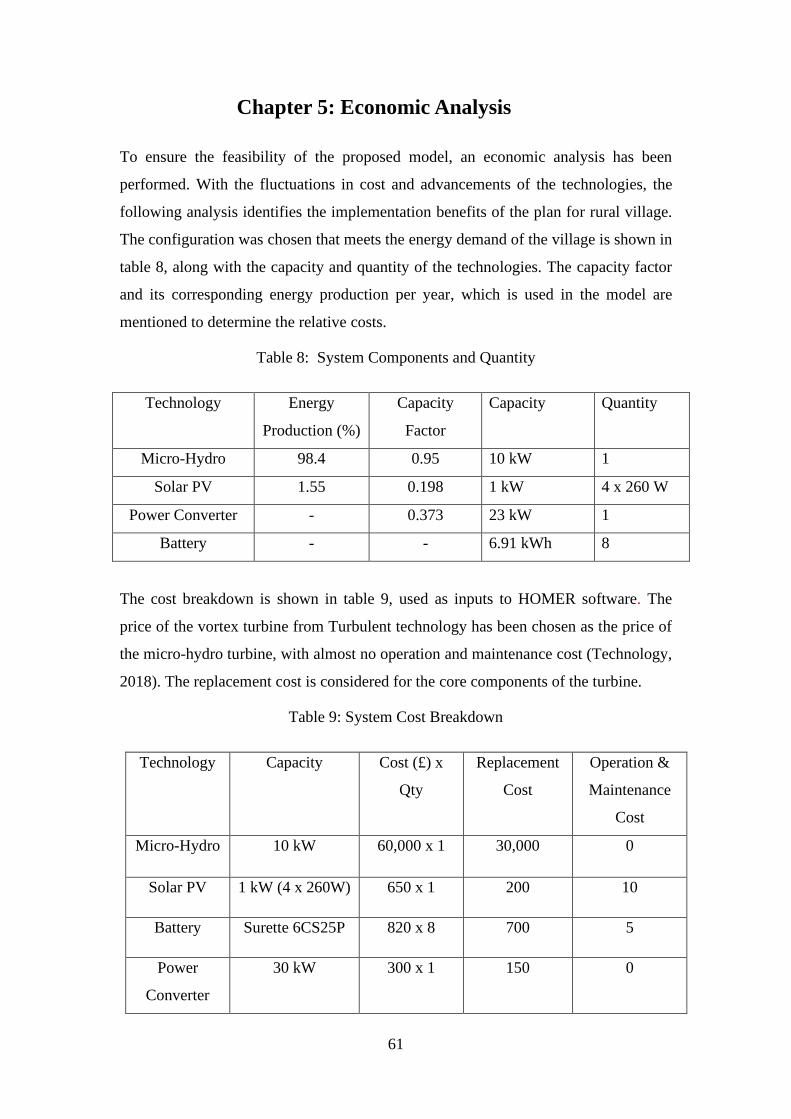
61
Chapter 5: Economic Analysis
To ensure the feasibility of the proposed model, an economic analysis has been
performed. With the fluctuations in cost and advancements of the technologies, the
following analysis identifies the implementation benefits of the plan for rural village.
The configuration was chosen that meets the energy demand of the village is shown in
table 8, along with the capacity and quantity of the technologies. The capacity factor
and its corresponding energy production per year, which is used in the model are
mentioned to determine the relative costs.
Table 8: System Components and Quantity
Technology Energy
Production (%)
Capacity
Factor
Capacity Quantity
Micro-Hydro 98.4 0.95 10 kW 1
Solar PV 1.55 0.198 1 kW 4 x 260 W
Power Converter - 0.373 23 kW 1
Battery - - 6.91 kWh 8
The cost breakdown is shown in table 9, used as inputs to HOMER software. The
price of the vortex turbine from Turbulent technology has been chosen as the price of
the micro-hydro turbine, with almost no operation and maintenance cost (Technology,
2018). The replacement cost is considered for the core components of the turbine.
Table 9: System Cost Breakdown
Technology Capacity Cost (£) x
Qty
Replacement
Cost
Operation &
Maintenance
Cost
Micro-Hydro 10 kW 60,000 x 1 30,000 0
Solar PV 1 kW (4 x 260W) 650 x 1 200 10
Battery Surette 6CS25P 820 x 8 700 5
Power
Converter
30 kW 300 x 1 150 0
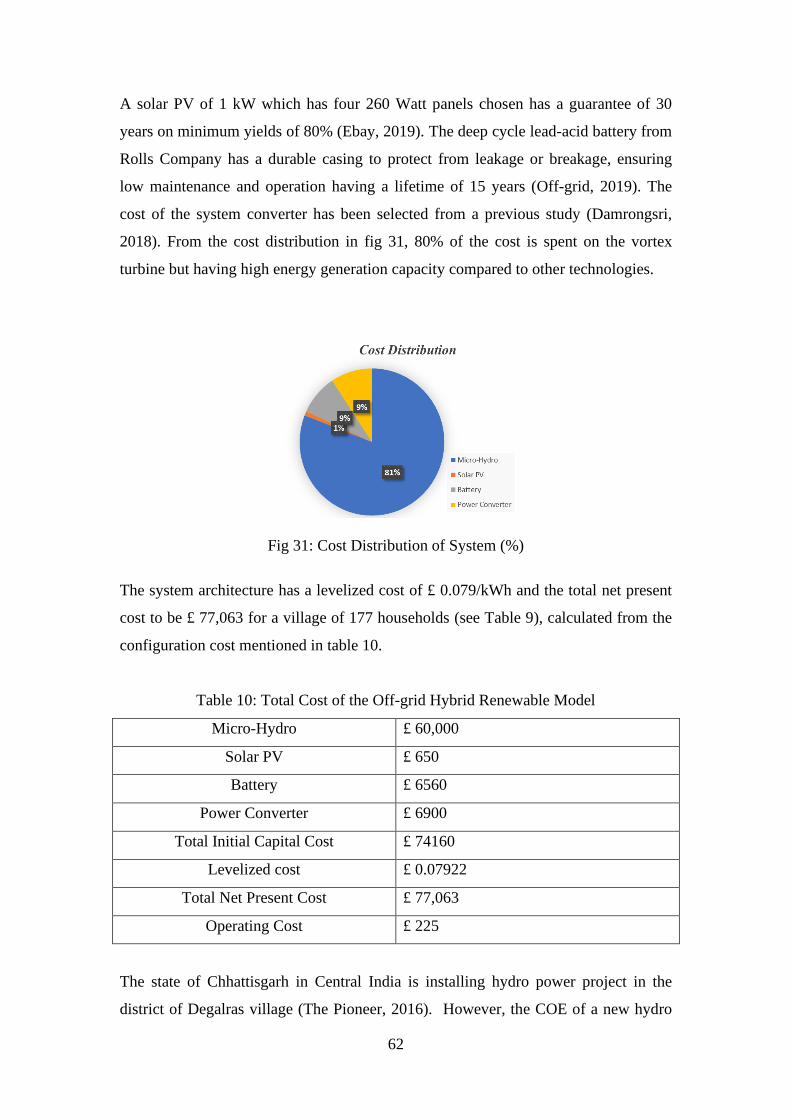
62
A solar PV of 1 kW which has four 260 Watt panels chosen has a guarantee of 30
years on minimum yields of 80% (Ebay, 2019). The deep cycle lead-acid battery from
Rolls Company has a durable casing to protect from leakage or breakage, ensuring
low maintenance and operation having a lifetime of 15 years (Off-grid, 2019). The
cost of the system converter has been selected from a previous study (Damrongsri,
2018). From the cost distribution in fig 31, 80% of the cost is spent on the vortex
turbine but having high energy generation capacity compared to other technologies.
Fig 31: Cost Distribution of System (%)
The system architecture has a levelized cost of £ 0.079/kWh and the total net present
cost to be £ 77,063 for a village of 177 households (see Table 9), calculated from the
configuration cost mentioned in table 10.
Table 10: Total Cost of the Off-grid Hybrid Renewable Model
Micro-Hydro £ 60,000
Solar PV £ 650
Battery £ 6560
Power Converter £ 6900
Total Initial Capital Cost £ 74160
Levelized cost £ 0.07922
Total Net Present Cost £ 77,063
Operating Cost £ 225
The state of Chhattisgarh in Central India is installing hydro power project in the
district of Degalras village (The Pioneer, 2016). However, the COE of a new hydro

63
plant is expected to be £ 0.83/kWh or more (The Economic Times, 2018), indicating
this system generates a lower tariff of £ 0.79/kWh.
Regarding the energy plan for the village requirements (see table 1) such as solar
lantern, solar street lighting, solar water pump, solar box cooker for household and
solar cooker for community scale are available on subsidy or for free from the
government, hence, not included in the analysis (MNRE, 2017).
64
Chapter 6: Conclusion & Future Scope
6.1. Conclusion
To conclude, the objectives of the project of determining an optimal off-grid
renewable solution for a remote rural un-electrified location were met as follows:
• To identify the need for decentralization and achieved a fully renewable
energy autonomy:
As discussed earlier, the rural electrification is unable to achieve its full
potential mainly due to factors such as high costs associated with
inaccessibility, inadequate power supply, and transmission losses. Through
this project, a renewable automized off-grid system was developed, with 100%
renewable fraction.
• To determine the current energy demand of the chosen rural village that is yet
to be electrified:
The current energy demand of the un-electrified village of 177 households was
identified to be 75,241 kWh/yr, calculated from the energy load profiles
created for both residential and community load.
• To develop an optimized model that meets with these energy requirements, by
making use of the available local resources:
A vortex micro-hydro technology generating 110213 kWh/yr, optimized with
solar PV generating 1736 kWh/yr and a deep cycle lead-acid battery for
storage, with total annual energy production of 111,949 kWh/yr, is the
designed model to meet the energy requirements of village.
• To ensure the feasibility of the model technically, economically and
environmentally:
Since the energy requirements of the village are met and the value of excess
electricity being in a reasonable range, the model was identified to be
technically feasible. The economic analysis performed in software produces a
65
COE value of £ 0.7 /kWh which compared to a future electrical power source
for the village is determined to be lower, ensuring economic feasibility of
model. The renewable fraction from the software developed model was 100%
with lowest CO2 emissions proving environmental friendliness.
• To justify the benefits of designed renewable energy model over grid power:
The government is planning on installing a hydro plant for this un-electrified
village. Apart from the benefit of low tariff of the designed model, the village
will not face negative social impacts from hydro plant since, vortex micro-
hydro turbine for run-off river is damless with no reservoir and a fish-friendly
technology, causing no disruption to land or natural habitat, unlike hydro
plant. Moreover, system is safe from risk of floods or droughts and no
displacement of local communities.
• To identify a solution for coping with any future increase in demand of the
village: With any increase in energy demand in the future, a vortex turbine can
be added to the system, since it is evident from the simulations that stable
annual energy output is produced mainly because of the perennial nature of
river.
• To produce a methodology which can be implemented in similar un-electrified
rural villages: The robust methodology developed for producing the model can
be extended to the nearby un-electrified villages in the state, located along the
banks of the river.
Hence, since the objectives of the project are model the aim of implementing an off-
grid power source for the un-electrified village has been achieved.
6.2. Future Scope
• The model can be seen as a roadmap of an effective planning strategy for
electrifying houses using an off-grid hybrid renewable model.
• Through a more detailed sensitivity analysis from the software HOMER, for
instance: the design excludes choice for 15 kW hydro turbine and a 10 kW
66
turbine is used along with solar PV for optimization, the system efficiency can
be improved.
• With successful commercialization such as better subsidies from the
government and low technology costs for renewables in the market, the model
can be made more viable.
67
References
Agrawal, S., Bali, N. and Urpelainen, D.J. (2019). Rural Electrification in India:
Customer Behaviour and Demand - The Rockefeller Foundation. [online] The
Rockefeller Foundation. Available at
https://www.rockefellerfoundation.org/report/rural-electrification-india-customer-
behaviour-demand/ [Accessed 15 Jul. 2019].
Bhattacharyya, S. (2006). Energy access problem of the poor in India: Is rural
electrification a remedy? Energy Policy, [online] 34(18), pp.3387-3397. Available at:
https://www.sciencedirect.com/science/article/pii/S0301421505002302?via%3Dihub
[Accessed 15 Jun. 2019].
Blum, N. U., Sryantoro Wakeling, R. and Schmidt, T. S. (2013) ‘Rural electrification
through village grids - Assessing the cost competitiveness of isolated renewable
energy technologies in Indonesia’, Renewable and Sustainable Energy Reviews.
Science Direct. doi: 10.1016/j.rser.2013.01.049.
British Petroleum, 2015. BP Statistical Review of World Energy, London.
Buckley T. and Sharda J., 2015. India’s Electricity-Sector Transformation, Institute of
Energy Economics and Financial Analysis, Cleveland. http://ieefa.org/wp-
content/uploads/2015/08/IEEFA-Indian-Electricity-Sector-Transformation-August-
2015.pdf
Buckley T., 2016. Cancellation of Ultra-Mega-Power Plants Underscores
India’Commitment to Energy Transition, Institute for Energy Economics and
Financial Analysis, Cleveland
Buckley T., 2016. More Evidence India Is on Track to End Coal Imports, Institute for
Energy Economics and Financial Analysis, Cleveland. http://ieefa.org/evidence-india-
track-end-coal-imports%E2%80%A8/
CEA–Central Electricity Authority, 2016. Draft National Electricity Plan,
Government of India. New Delhi. www.cea.nic.in/reports/committee/nep/nep_dec.pdf
68
Chandel SS et al., (2015), Review of solar photovoltaic water pumping system
technology for irrigation and community drinking water supplies, Renewable and
Sustainable Energy Reviews, 49, 1084-99.
Cherni, J. et al., 2007. Energy supply for sustainable livelihoods: a multi-criteria
decision support system. Energy Policy, Volume 35, pp. 1493-1504.
Coady D., Parry I., Sears L., Shang B., 2015. How large are global energy subsidies?
International Monetary Fund, Washington
Damrongsri, N. (2018). Investigating of Hybrid Energy Systems in Southern Region of
Thailand. [online] pp.50–60. Available at:
http://www.esru.strath.ac.uk/Documents/MSc_2018/Damrongsri.pdf [Accessed 25
Jul. 2019].
District Census Handbook Dantewada, 2011. [ cited 29 May 2018]. Available from:
http://censusindia.gov.in/2011census/dchb/2217_PART_B_DCHB_DAKSHIN%20B
ASTAR%20DANTEWADA.pdf p.64
Drinkwaard, W., Kirkels, A. and Romijn, H. (2010). A learning-based approach to
understanding success in rural electrification: Insights from Micro Hydro projects in
Bolivia. Energy for Sustainable Development, [online] 14(3), pp.232-237. Available
at: https://www.sciencedirect.com/journal/energy-for-sustainable-
development/vol/14/issue/3 [Accessed 17 Jun. 2019].
Ebay.ca. (2019). solar panel | eBay. [online] Available at:
https://www.ebay.ca/sch/i.html?_nkw=solar+panel [Accessed 20 Jul. 2018].
Electrification in rural areas of India and consideration of SHS. (2010). In:
International Conference on Industrial and Information Systems (ICIIS). [online]
India: IEEE, pp.596-597. Available at:
https://www.researchgate.net/publication/224175590_Electrification_in_rural_areas_
of_India_and_consideration_of_SHS [Accessed 20 Aug. 2019].
Enerdata, 2014. Global Energy Statistical Yearbook 2014, Grenoble.
(https://yearbook.enerdata.net/) [Accessed 25 June 2019].
Epstein P. and Buonocore J., 2011. Full cost accounting for the life cycle of coal,
Annals of the New York Academy of Sciences, 1219, 73–98. pmid:21332493
69
Ernst &Young, 2012. Renewable Energy Country Attractiveness Indices, issue 33,
London. http://www.ey.com/Publication/vwLUAssets/Renewable_energy_country_att
ractiveness_indices_-_Issue_33/$FILE/EY_RECAI_issue_33.pdf⟩ [Accessed 23 June
2019]
Feron, S. (2016). Sustainability of Off-Grid Photovoltaic Systems for Rural
Electrification in Developing Countries: A Review. Sustainability, [online] 8(12),
p.1326. Available at: https://www.mdpi.com/2071-1050/8/12/1326/pdf [Accessed 20
Aug. 2019].
Fulford, D., Mosley, P. and Gill, A. (2000). Recommendations on the use of micro-
hydro power in rural development. Journal of International Development, [online]
12(7), pp.975-983. Available at:
https://www.semanticscholar.org/paper/Recommendations-on-the-use-of-micro-
hydro-power-in-Fulford-Mosley/8963d27f9b8ea1c92e6285dc3f7e8410d2727a57
[Accessed 16 Jun. 2019].
Gulagi, A., Choudhary, P., Bogdanov, D. and Breyer, C. (2017). Electricity system
based on 100% renewable energy for India and SAARC. PLOS ONE, [online] 12(7),
p.e0180611. Available at: https://www.ncbi.nlm.nih.gov/pubmed/28723937
[Accessed 19 Jun. 2019].
Gurung, A., Gurung, O. and Oh, S. (2011). The potential of a renewable energy
technology for rural electrification in Nepal: A case study from Tangting. Renewable
Energy, [online] 36(11), pp.3203-3210. Available at:
https://www.sciencedirect.com/science/article/pii/S0960148111001261 [Accessed 5
Jun. 2019].
Hallberg, M. and Hallme, E. (2015). Energy demand in different topographical
zones : A field study about the domestic energy demand in the rural areas of Bolivia.
[online] DIVA. Available at: http://www.diva-
portal.org/smash/record.jsf?pid=diva2:838985 [Accessed 21 Jul. 2019].
Homerenergy.com. (2018). HOMER Pro - Microgrid Software for Designing
Optimized Hybrid Microgrids. [online] Available at:
https://www.homerenergy.com/homer-pro.html [Accessed 21 Aug. 2019].
Iea.org. (2017). WEO 2017: Key Findings. [Online] Available at:
https://www.iea.org/weo2017/ [Accessed 5 May 2019].
70
Iimi, A. Estimating global climate change impacts on hydropower projects:
Applications in India, Sri Lanka and Vietnam. The World Bank. 2007 [Accessed 17
June 2019].
[ISA]—International Solar Alliance, 2015. Working Paper on International Solar
Alliance, Ministry of New and Renewable Energy, Govt. of India,
Gurgoan. http://isolaralliance.com/pdf/ISA-Working-Paper.pdf.
Kamalapur, G. and Udaykumar, R. (2011). Rural electrification in India and
feasibility of Photovoltaic Solar Home Systems. International Journal of Electrical
Power & Energy Systems, [online] 33(3), pp.594-599. Available at:
https://ieeexplore.ieee.org/document/6967552 [Accessed 20 Jun. 2019].
Kemmler, A. (2007) ‘Factors influencing household access to electricity in India’,
Energy for Sustainable Development, 34(18), pp. 3387–3397. doi: 10.1016/S0973-
0826(08)60405-6.
Kusakana, K., Munda, J. and Jimoh, A. (2019). Feasibility study of a hybrid PV-micro
hydro system for rural electrification - IEEE Conference Publication. [online]
Ieeexplore.ieee.org. Available at: https://ieeexplore.ieee.org/document/5308185
[Accessed 19 Jun. 2019].
Mahapatra S, Dasappa S. Rural electrification, (2012), Optimizing the choice between
decentralised renewable energy sources and grid extension, Energy for Sustainable
Development. 16(2), 146-154.
Ministry of Finance, 2015. Indian Public Finance Statistics, Government of India,
New Delhi (http://finmin.nic.in/reports/IPFStat201415.pdf) Accessed [26 June 2019]
Ministry of Power, 2016. Press release, India to ratify COP 21 Global Climate
Agreement on April 22, Government of India, New
Delhi. http://pib.nic.in/newsite/PrintRelease.aspx?relid=138511 [Accessed 26 June
2019]
Mishra, R. (2013) ‘Sustainable Energy Plan of a village in Punjab for Self-
Generation’, Appl. Phys. A, 73, pp. 1–21.
71
Mospi.nic.in. (2011). Energy Statistics - 2011 | Ministry of Statistics and Program
Implementation | Government Of India. [online] Available at:
http://mospi.nic.in/publication/energy-statistics-2011 [Accessed 20 Aug. 2019].
Murni, S., Whale, J., Urmee, T., Davis, J. and Harries, D. (2012). The Role of Micro
Hydro Power Systems in Remote Rural Electrification: A Case Study in the Bawan
Valley, Borneo. Procedia Engineering, [online] 49, pp.189-196. Available at:
https://www.sciencedirect.com/science/article/pii/S1877705812047844 [Accessed 9
Jun. 2019].
Nishi Y, Inagaki T, (2017), Performance and Flow Field of a Gravitation Vortex Type
Water Turbine, International Journal of Rotating Machinery, 2017, 1-11.
NREL (2018). NREL Data: Microgrid Load and LCOE Modelling Results. [online]
Nrel.gov. Available at: https://data.nrel.gov/submissions/79 [Accessed 23 Jun. 2019].
Off-grid-europe.com. (2017). Rolls 5000 Series 6CS25P 6v. [online] Available at:
https://www.off-grid-europe.com/rolls-5000-series-6cs25p-
6v?gclid=CjwKCAjwqNnqBRATEiwAkHm2BOrdBG70lBHlf2kzRXLwyeHhNmyN
_yAVBW2XtHVo8ScIxhoupUK_zRoC1GMQAvD_BwE [Accessed 18 Jul. 2019].
Paish, O. (2002). Micro-hydropower: Status and prospects. Proceedings of the
Institution of Mechanical Engineers, Part A: Journal of Power and Energy, 216(1),
pp.31-40.
Planning Commission, 2011. Faster, Sustainable and More Inclusive Growth-An
Approach to the Twelfth Five Year Plan, report by the Planning Commission,
Government of India, New Delhi. [Accessed]
http://planningcommission.gov.in/plans/planrel/12appdrft/appraoch_12plan.pdf
Planning Commission. Integrated Energy Policy: Report of the Expert Committee;
Government of India: New Delhi, India, 2006.
Power C et al., (2016), A parametric experimental investigation of the operating
conditions of gravitational vortex hydropower (GVHP), Journal of Clean Energy
Technologies, 4(2),112-119
Ranganathan, V. (1993). Rural electrification revisited. Energy Policy, [online] 21(2),
pp.142-151. Available at:
72
https://www.sciencedirect.com/science/article/pii/0301421593901364 [Accessed 14
Jun. 2019].
Rathore, M. M. and Warkhedkar, R. M. (2015) ‘International Journal of Modern
Trends in Engineering and Research A REVIEW OF SOLAR COOKERS’, (2349),
pp. 2–4. Available at: https://ijmter.com/published_special_issues/07-02-2015/a-
review-of-solar-cookers.pdf.
Reiche, K., Covarrubias, A. and Martinot, E. (2000). Expanding Electricity Access to
Remote Areas: Off-Grid Rural Electrification in Developing Countries. [Online]
Semanticscholar.org. Available at:
https://www.semanticscholar.org/paper/Expanding-Electricity-Access-to-Remote-
Areas-%3A-in-Reiche-Covarrubias/6019ae76e6771f8c00fa2a20b61b34ae34115e25
[Accessed 9 May 2019].
Saubhagya.gov.in. (2017). Saubhagya Dashboard. [Online] Available at:
https://saubhagya.gov.in/ [Accessed 13 May 2019].
Scheme / Documents | Ministry of New and Renewable Energy [Internet].
Mnre.gov.in. [Online] Available from: https://mnre.gov.in/schemedocuments
[Accessed 22 June]
Shafiq, M. (2016) ‘Design of Sustainable Energy Systems for Rural Communities in
Pakistan’. Available at:
http://www.esru.strath.ac.uk/Documents/MSc_2016/Shafiq.pdf.
Shreedhar, R. (2015). Community Based Micro-Hydro Village Electrification Scheme
-Technology & Approach. [online] Available at:
https://www.researchgate.net/publication/270880990_Community_Based_Micro-
Hydro_Village_Electrification_Scheme_-Technology_Approach [Accessed 12 Jun.
2019].
Sisodia, G. S. and Singh, P. (2016) ‘The Status of Renewable Energy Research on
India’, in Energy Procedia. ScienceDirect, pp. 416–423. doi:
10.1016/j.egypro.2016.09.050.
Solargis (2017). Global Solar Atlas. [online] Globalsolaratlas.info. Available at:
https://globalsolaratlas.info/ [Accessed 21 Jul. 2019].
73
Solar Water Pump [Internet]. Krishitechnologies.com. 2018 [cited 20 May 2018].
Available from: http://www.krishitechnologies.com/solar-water-pump.html
Sontake, V. C. and Kalamkar, V. R. (2016) ‘Solar photovoltaic water pumping system
- A comprehensive review’, Renewable and Sustainable Energy Reviews. Science
Direct. doi: 10.1016/j.rser.2016.01.021.
Technology – Turbulent Website [Internet]. Turbulent.be. [cited 20 May 2018].
Available from: https://www.turbulent.be/technology/
The Economic Times. (2018). India to consider ways to lower hydropower tariffs.
[online] Available at:
http://economictimes.indiatimes.com/industry/energy/power/india-to-consider-ways-
to-lower-hydropower-tariffs/articleshow/62599393.cms [Accessed 24 Jul. 2019].
The Pioneer (2016). CSPGCl planning hydro power project in Dantewada district.
[online] The Pioneer. Available at: https://www.dailypioneer.com/2016/state-
editions/cspgcl-planning-hydro-power-project-in-dantewada-district.html [Accessed
20 Aug. 2019].
Turbulent VORTEX Demonstration [Internet]. 2017 [cited 14 May 2019]. Available
from: https://www.youtube.com/watch?v=pXFkrKygXQY
[UN]—United Nations, Department of Economic and Social Affairs, Population
Division, 2015. World Population Prospects: The 2015 Revision. New York.
[UNFCCC]–United Nations Framework Convention on Climate Change, 2015.
India’s intended nationally determined contribution: working towards climate justice,
Technical report, Bonn.
Urmee, T., Harries, D. and Schlapfer, A. (2009). Issues related to rural electrification
using renewable energy in developing countries of Asia and Pacific. Renewable
Energy, 34(2), pp.354-357.
Urmee TP. Gender and renewable energy program in Bangladesh. In: Debate on
sustainable energy in danish development assistance, Copenheagen, Denmark; 2000.
Vansutre, S., Deshmukh, S. and Hari, K. (2014). Past, Present and Future of Indravati
River Capture: A Geomorphological Investigation. IOSR Journal of Applied Geology
and Geophysics, [online] 2(5), pp.01-05. Available at:
74
https://www.researchgate.net/publication/284407664_Past_Present_and_Future_of_In
dravati_River_Capture_A_Geomorphological_Investigation [Accessed 24 May
2019].
[WBGU]—German Advisory Council on Global Change, 2007. Climate Change as a
Security Risk, Berlin, Earthscan,
London www.wbgu.de/fileadmin/templates/dateien/veroeffentlichungen/hauptgutacht
en/jg2007/wbgu_j [Accessed 22 June 2019]
Williams, A. and Simpson, R. (2009). Pico hydro – Reducing technical risks for rural
electrification. Renewable Energy, [online] 34(8), pp.1986-1991. Available at:
https://www.sciencedirect.com/science/article/pii/S096014810800459X [Accessed 13
Jun. 2019].
[WWF]–World Wildlife Fund—India and [WISE]–World Institute of Sustainable
Energy, 2013. The Energy Report Kerala: 100% Renewable Energy by 2050, New
Delhi. Available at: http://wisein.org/WISE_Projects/kerala_energy_report_3_jan.pdf
[Accessed 21 June 2019]
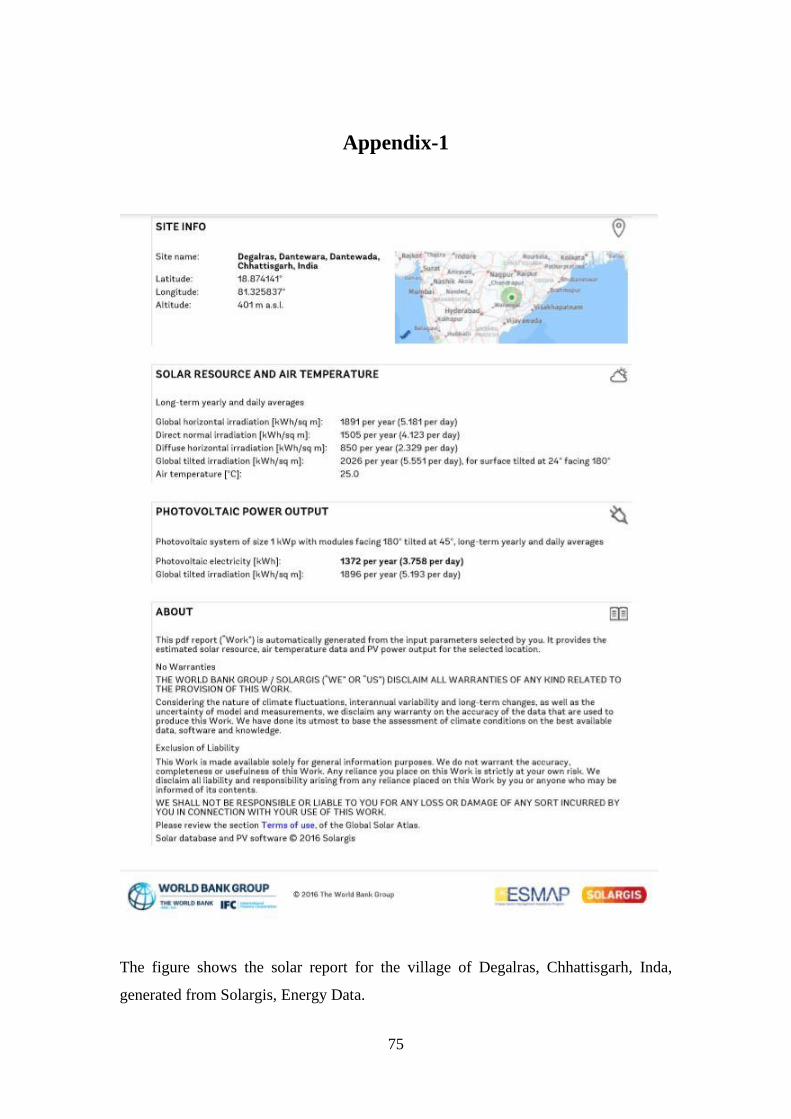
75
Appendix-1
The figure shows the solar report for the village of Degalras, Chhattisgarh, Inda,
generated from Solargis, Energy Data.