Embed Size (px)
Citation preview
MODELLING AEROBIC 4-CHLOROPHENOL AND 2,4-
DICHLOROPHENOL BIODEGRADATION-EFFECT OF BIOGENIC
SUBSTRATE CONCENTRATION
A THESIS SUBMITTED TO
THE GRADUATE SCHOOL OF NATURAL AND APPLIED SCIENCES
OF
MIDDLE EAST TECHNICAL UNIVERSITY
BY
ERKAN ŞAHİNKAYA
IN PARTIAL FULFILLMENT OF THE REQUIREMENTS
FOR
THE DEGREE OF DOCTOR OF PHILOSOPHY
IN
ENVIRONMENTAL ENGINEERING
DECEMBER 2006
ii
Approval of the Graduate School of Natural and Applied Sciences
Prof. Dr. Canan Özgen
Director
I certify that this thesis satisfies all the requirements as a thesis for the degree of
Doctor of Philosophy.
Prof. Dr. Göksel N. Demirer
Head of Department
This is to certify that we have read this thesis and that in our opinion it is fully
adequate, in scope and quality, as a thesis for the degree of Doctor of Philosophy.
Prof. Dr. Filiz B. Dilek
Supervisor
Examining Committee Members
Prof. Dr. Celal F. Gökçay (METU, ENVE)
Prof. Dr. Filiz B. Dilek (METU, ENVE)
Prof. Dr. Ülkü Yetiş (METU, ENVE)
Prof. Dr. İnci Eroğlu (METU, CHEM)
Assoc. Prof. Dr. Özer Çınar (KSU, ENVE)
iii
I hereby declare that all information in this document has been obtained and
presented in accordance with academic rules and ethical conduct. I also
declare that, as required by these rules and conduct, I have fully cited and
referenced all material and results that are not original to this work.
Name, Last name : Erkan Şahinkaya
Signature :
iv
ABSTRACT
MODELLING AEROBIC 4-CHLOROPHENOL AND 2,4-DICHLOROPHENOL
BIODEGRADATION-EFFECT OF BIOGENIC SUBSTRATE
CONCENTRATION
Şahinkaya, Erkan
Ph.D., Department of Environmental Engineering
Supervisor : Prof. Dr. Filiz B. Dilek
December 2006, 204 pages
Aerobic biodegradation kinetics of 4-Chlorophenol (4-CP) and 2,4-Dichlorophenol
(2,4-DCP) by acclimated mixed cultures were examined separately and in mixture
using batch and sequencing batch reactors (SBRs). Biodegradation abilities of
acclimated mixed cultures were also compared with those of isolated pure species.
Complete degradation of chlorophenols and high COD removal efficiencies were
observed throughout the SBRs operation. During the degradation of 4-CP, 5-chloro-
2-hydroxymuconic semialdehyde, (the -meta cleavage product of 4-CP),
accumulated but was subsequently removed completely. Chlorophenol degradation
v
rates increased with increasing chlorophenols concentration in the feed of the
SBRs. Gradually decreasing feed peptone concentration did not adversely affect
chlorophenol degradation profiles in SBRs. Only competent biomass was thought to
be responsible for chlorophenol degradation due to required unique metabolic
pathways. It was assumed that the fraction of competent biomass (specialist
biomass) is equal to COD basis fraction of chlorophenols in the feed of the reactors
as competent biomass grows on chlorophenols only. Models developed using this
assumption agreed well with experimental data.
The performance of a two stage rotating biological contactor (RBC) was also
evaluated for the treatment of synthetic wastewater containing peptone, 4-CP and
2,4-DCP at 5 rpm. High chlorophenols (>98%) and COD (>94%) removals were
achieved throughout the reactor operation up to 1000 mg/L 4-CP and 500 mg/L 2,4-
DCP in the feed. Results showed that RBC is more resistant than suspended growth
reactors to high chlorophenols load.
The change of dominant species during the operation of SBRs and RBC was also
followed using API 20NE identification kits.
Keywords: Chlorophenols, Biodegradation Kinetics, Competent Biomass,
Sequencing Batch Reactor, Rotating Biological Contactor
vi
ÖZ
AEROBİK 4-KLOROFENOL VE 2,4-DİKLOROFENOL
BİYODEGRADASYONUNUN MODELLENMESİ- KOLAY AYRISABİLEN
BESİ MADDESİNİN ETKİSİ
Şahinkaya, Erkan
Doktora, Çevre Muhendisliği Bölümü
Tez Yöneticisi : Prof. Dr. Filiz B. Dilek
Aralik 2006, 204 sayfa
Aerobik 4-Klorofenol (4-KF) ve 2,4-Diklorofenol biyogiderim kinetiği ayrı ayrı ve
karışım halinde, kesikli ve ardışık kesikli reaktörler (AKR) kullanılarak
araştırılmıştır. Aklime edilmiş karışık kültürün klorofenol arıtım yeteneği, izole
edilen saf kültürlerinki ile de karşılaştırılmıştır. AKR lerin işletilmesi sırasında,
klorofenollerin tamamen arıtıldığı ve yüksek KOİ arıtım verimi gözlenmiştir. 4-
KF`ün parçalanması sırasında, 5-kloro-2-hidroksimukonik semialdehit (4-
vii
klorofenolün, -meta bağının parçalanması ile oluşan ara ürün) birikimi gözlenmiş,
fakat sonradan tamamen giderilmiştir. AKR lerin girişinde klorofenol
konsantrasyonu artıkça, klorofenol arıtım hızı da artmıştır. AKR lerin girişinde
pepton konsantrasyonunun kademeli olarak azaltılması, klorofenol giderim profilini
etkilememiştir. Klorofenol arıtımı için özel bir biyolojikyol (pathway)
gerektiğinden, sadece yetenekli biyokütlenin klorofenol arıtımından sorumlu
olduğu düşünülmüştür. Yetenekli biyokütle sadece klorofenol üzerinden
büyüyebildiği için, çamur içindeki yetenekli biyokütle oranının reaktör girişindeki
KOİ bazlı klorofenol oranına eşit olduğu kabul edilmişitir. Bu varsayımlara
dayanılarak kurulan modeller, deneysel verilere yüksek düzeyde uygunluk
göstermiştir.
4-KF, 2,4-DKF ve peptone içeren sentetik atıksuyun arıtılabilirliliği, iki kademeli
ve 5 rpm de işletilen dönen biyolojik disk reaktörde (DBD) de araştırılmıştır.
Reaktör işletimi süresince, 1000 mg/L 4-KF ve 500 mg/L 2,4-DKF giriş
konsantrasyonlarına kadar yüksek düzeyde klorofenol (>%98) ve KOİ (>%94)
giderimi gözlenmiştir. Sonuçlar DBD’in yüksek klorofenol yüklemelerine
bakterilerin askıda büyüdüğü reaktörlerden daha dayanıklı olduğunu göstermiştir.
Ayrıca, AKR ve DBD işletimi sırasında baskın kültürlerin değişimi API 20NE
belirleme kiti kullanılarak takip edilmiştir.
Anahtar Kelimeler: Klorofenoller, Biyogiderim Kinetiği, Yetenekli Biyokütle,
Ardışık Kesikli Reaktör, Dönen Biyolojik Disk Reaktör

viii
To My Family and Nihan
ix
ACKNOWLEDGMENTS
I wish to express my deepest gratitude to my supervisor Prof. Dr. Filiz B. Dilek for
her guidance, advice, trust and encouragement throughout this research.
I would like to thank the Supervising Committee Members, Prof. Dr. Ülkü Yetiş
and Prof. Dr. İnci Eroğlu, for their valuable suggestions and constructive criticism.
I would like to thank Kemal Demirtaş, Aynur Yıldırım and Ramazan Demir for
their excellent assistance in the lab.
I would also like to express my gratitude to my friends, Nimet and Burak Uzal,
Vedat Yılmaz, Hakan Moral, Nuray Ateş, Cavit Burak Bural and Hande Yükseler
for their support.
My warmest thanks are dedicated to my dear wife Nihan and my family for all the
patience, encouragement and love.
Lastly, I wish to express my gratitude to the Middle East Technical University
Research Fund for supporting this research (Project no: BAP-2002-03-11-01).
x
TABLE OF CONTENTS
ABSTRACT..............................................................................................................iv
ÖZ .............................................................................................................................vi
ACKNOWLEDGMENTS.........................................................................................ix
TABLE OF CONTENTS...........................................................................................x
LIST OF TABLES ................................................................................................. xiii
LIST OF FIGURES.................................................................................................xiv
ABBREVIATIONS....................................................................................................1
1. INTRODUCTION..................................................................................................1
1.1.General .............................................................................................................1
1.2. Purpose and Scope ..........................................................................................5
1.3. Literature Review............................................................................................6
1.3.1. Microbial Degradation of Recalcitrant Synthetic Organic Chemicals
(SOCs)................................................................................................................8
1.3.1.1. Anaerobic Reductive Dechlorination of Chlorophenols .................12
1.3.1.2. Aerobic Microbial Degradation of Chlorophenols..........................16
1.3.1.2.1. Degradation of SOCs in Multisubstrate Environment and Co-
metabolic Degradation of Chlorophenols ................................................20
1.3.1.2.2. Use of Mixed Microbial Communities in Aerobic
Biodegradation of Chlorophenols ............................................................28
1.3.1.3. Chlorophenol Degradation in Aerobic Attached Growth Reactors 35
1.3.1.3.1. Rotating Biological Contactors (RBCs)...................................40
xi
1.3.2. Modeling SOCs Degradation .................................................................45
2. MATERIALS AND METHODS.........................................................................51
2.1. Chemicals ......................................................................................................51
2.2. Cultures and Medium....................................................................................51
2.3. Experiments...................................................................................................53
2.3.1. Sequencing Batch Reactor (SBR) Experiments .....................................53
2.3.1.1. Instantaneously Fed Sequencing Batch Reactor (SBR) Experiments.53
2.3.1.2. Semi-continuously fed Sequencing Batch Reactors (SBRs)
experiments ..................................................................................................57
2.3.2. Batch Experiments .................................................................................59
2.3.3. Rotating Biological Contactors (RBC) Experiments .............................61
2.3.4. Isolation of pure cultures........................................................................64
2.4. Analytical Techniques...................................................................................65
3. RESULTS AND DISCUSSION ..........................................................................68
3.1. Chlorophenols Degradation In Instantaneously Fed SBRs...........................68
3.1.1. Chlorophenols Degradation at Varying Feed Concentrations................72
3.1.1.1. Kinetics of Chlorophenols Degradation..........................................77
3.1.2. Effect of Biogenic Substrate Concentration on Chlorophenols
Degradation Kinetics........................................................................................90
3.1.2.1. Effect of Biogenic Substrate Concentration on 4-CP Degradation.91
3.1.2.2. Effect of Biogenic Substrate Concentration on Degradation of 4-CP
and 2,4-DCP Mixture ...................................................................................99
3.1.2.3. Kinetics of Chlorophenols Degradation at Varying Biogenic
Substrate Concentrations............................................................................103
3.2. Kinetics of Chlorophenols Degradation in Batch Reactors ........................108
3.2.1. Kinetics of 4-CP Degradation by Culture (Culture 4) Acclimated to 4-
CP...................................................................................................................108
3.2.2. Kinetics of 4-CP Degradation Using Culture (Culture M) Acclimated to
Mixture of 4-CP and 2,4-DCP .......................................................................116
xii
3.2.3. Effect of 2,4-DCP on 4-CP Degradation Kinetics of 4-CP Acclimated
culture (Culture 4) ..........................................................................................119
3.2.4. Degradation of 4-CP by Pure Cultures Isolated From Acclimated Mixed
Cultures ..........................................................................................................126
3.2.5. Biodegradation Kinetics of 2,4-DCP by acclimated mixed cultures ...128
3.2.6. Degradation of 2,4-DCP by Pure Cultures Isolated From Acclimated
Mixed Cultures...............................................................................................138
3.3. Effect of Filling Time on the Performance of Sequencing Batch Reactor
(SBR) Treating 4-CP and 2,4-DCP Mixture ......................................................140
3.4. Effect of Biogenic Substrate Concentration on the Performance of
Sequencing Batch Reactor (SBR) Treating 4-CP and 2,4-DCP Mixture...........154
3.5. Degradation of 4-CP and 2,4-DCP Mixture Using Rotating Biological
Contactors (RBC)...............................................................................................166
CONCLUSIONS....................................................................................................188
REFERENCES.......................................................................................................191
CURRICULUM VITAE ........................................................................................202
xiii
LIST OF TABLES
TABLES
Table 2.1. Composition of the Synthetic Wastewater..............................................52
Table 3.1. Characteristics of isolated and identified species....................................87
Table 3.2. Average competent biomass and DRs in FED4 and FEDM.................106
Table 3.3. Andrews kinetic parameters of 4-CP degradation ................................118
Table 3.4. Andrews Model parameters of 2,4-DCP biodegradation......................134
Table 3.5. SDR of 2,4-DCP for different cultures .................................................136
Table 3.6. SDRs of 2,4-DCP using isolated pure bacterial cultures ......................139
Table 3.7. SBR operating conditions .....................................................................142
Table 3.8. Average chlorophenols concentrations within days 37 and 52.............178
xiv
LIST OF FIGURES
FIGURES
Figure 1.1. Degradation of 4-CP via meta cleavage pathway, (a) 4-CP, (b) 4-
chlorocatechol, (c) 5-chloro-2-hydroxymuconic semialdehyde (CHMS)........18
Figure 1.2. Degradation of 2,4-DCP via ortho cleavage pathway ...........................19
Figure 1. 3. Schematic diagram of RBC reactor; (1) inlet, (2) rotating cylinder, ....41
Figure 1.4. Typical RBC schematic for secondary treatment ..................................43
Figure 2. 1. A schematic diagram of instantaneously fed SBRs..............................54
Figure 2. 2. Instantaneously fed SBRs .....................................................................55
Figure 2. 3. A schematic Diagram of SBRs .............................................................58
Figure 2.4. A schematic diagram of RBC ................................................................62
Figure 2.5. RBC used in the experiments. (a) cross view, (b) over view.................63
Figure 2.6. Support medium (a), control panel (b) and RBC stages (c)...................64
Figure 2.7. Coloration of medium due to production of CHMS (a), medium after
complete removal of CHMS (b).......................................................................66
Figure 2.8. UV scan of CHMS.................................................................................67
Figure 2.9. Two API 20NE strips after 24 h of inoculation.....................................67
Figure 3.1. Feed 4-CP and 2,4-DCP in instantaneously fed SBRs ..........................72
Figure 3.2. Time course variation of COD and corresponding removal..................73
Figure 3.3. CHMS concentrations in the effluent of reactors fed with 4-CP (10
mg/L) and mixture of 4-CP (10 mg/L) and 2,4-DCP (5 mg/L) .......................75
Figure 3.4. Change of Y, COD removal efficiencies and MLVSS concentrations
with respect to feed 4-CP concentrations in FED4 and FEDM .......................76
Figure 3.5. The prediction of 4-CP concentration profile considering ....................80
xv
Figure 3.6. Experimental data and model results for FED4 receiving.....................82
Figure 3.7. Experimental data and model results for FEDM ...................................85
Figure 3.8. Variation of SDRs with the fraction of chlorophenols in the feed on
COD basis ........................................................................................................87
Figure 3.9. A view of isolated and identified species grown on agar plates (a)
species from FED4, (b) species from FEDM...................................................88
Figure 3.10. Measured and calculated 4-CP SDR values for FEDM and FED4 .....90
Figure 3.11. Time course variations of 4-CP (a) and COD (a) at variable peptone.93
Figure 3.12. Time course variations of normalized 4-CP and CHMS in FED4 ......94
Figure 3.13. Effect of feed peptone concentration on FED4 ...................................95
Figure 3.14. Effect of peptone concentration on 4-CP degradation pattern in FED4-
2........................................................................................................................97
Figure 3.15. Effect of peptone concentration on the performance of FED4-2.........98
Figure 3.16. Time course variations of 2,4-DCP (a), 4-CP (b) and COD (c) ........100
Figure 3.17. Effect of feed peptone concentration on FEDM................................102
Figure 3.18. SDRs of chlorophenols in FEDM (a) and FED4 (b) at different
chlorophenols fractions in the feed on COD basis.........................................104
Figure 3.19. Calculated versus measured SDR values of chlorophenols in...........105
Figure 3.20. Time course variation of 4-CP concentrations and SDRs of culture 4 at
different initial 4-CP concentrations ..............................................................110
Figure 3.21. Time required for complete degradation at different initial 4-CP
concentrations.................................................................................................111
Figure 3.22. Application of Andrews model (qm = 145.27 mg/ g MLVSSc.h) to .112
Figure 3.23. Time course variations of pH at different initial 4-CP concentrations
........................................................................................................................113
Figure 3.24. Relative concentrations of 4-CP and CHMS .....................................114
Figure 3.25. Change of CHMS at different initial 4-CP concentrations ................115
Figure 3.26. HPLC diagrams of the batch reactor receiving 100 mg/L 4-CP........115
Figure 3.27. Time course variation of 4-CP concentrations and SDRs of culture M
at different initial 4-CP concentrations ..........................................................117
xvi
Figure 3.28. Time course variations of pH at different initial 4-CP concentrations
........................................................................................................................119
Figure 3.29. Time course variations of normalized 4-CP and CHMS concentrations
for 50 and 100 mg/L initial 4-CP concentrations...........................................120
Figure 3.30. Time course variations of 4-CP and 2,4-DCP ...................................121
Figure 3.31. Time required to have complete 4-CP degradation at different.........122
Figure 3.32. Initial degradation rate of 4-CP at different initial 2,4-DCP
concentrations.................................................................................................123
Figure 3.33. pH variations at different initial 2,4-DCP concentrations .................123
Figure 3.34. Relative concentrations of 4-CP, 4-CP and CHMS for reactors
receiving 10 mg/L 2,4-DCP (a) and 40 mg/L 2,4-DCP (b)............................126
Figure 3.35. Isolated pure species grown in erlenmeyers ......................................127
Figure 3.36. Degradation of 4-CP by isolated pure strains ....................................128
Figure 3.37. Time course variation of 2,4-DCP for culture 4 (a) and culture M (b)
(data points represent experimental data, while, smooth curves are optimized
fit of Andrews equation) ................................................................................129
Figure 3.38. Required time to achieve complete degradation of 2,4-DCP ............131
Figure 3.39. Specific initial degradation rate of 2,4-DCP by culture 4 (a), and
culture M (b) ..................................................................................................133
Figure 3.40. HPLC diagram of influent and effluent of batch experiments
inoculated with culture M receiving 104.4 mg/L 2,4-DCP............................137
Figure 3.41. Time course variations of 2,4-DCP for reactors inoculated with pure
strains isolated from acclimated mixed cultures (second spike) ....................139
Figure 3.42. Time course variation of COD and chlorophenols for 8 h of filling time
........................................................................................................................143
Figure 3.43. Time course variation of COD and chlorophenols for 5.5 h of .........145
Figure 3.44. Time course variation of COD and chlorophenols for 2.2 h of filling
time.................................................................................................................147
Figure 3.45. Time course variation of COD and chlorophenols when SBR fed
instantaneously (filling time is 0 h.)...............................................................148
Figure 3.46. Time course variation of CHMS at different filling times.................149
xvii
Figure 3.47. HPLC results of influent and effluent of SBR operated at ................150
Figure 3.48. Effect of feeding time on the time required to completely degrade
chlorophenols and on the maximum concentrations of COD, chlorophenols,
and CHMS......................................................................................................152
Figure 3.49. Degradation rate of 4-CP during the reactor operation (a) and ratio of
degradation to loading rate for different filling times ....................................154
Figure 3.50. Time course variation of 4-CP (a), 2,4-DCP (b), COD (c) and ABS380
(d) in SBR at different feed peptone concentrations ( Influent 4-CP and 2,4-
DCP were 220 and 110 mg/L, respectively) ..................................................157
Figure 3.51. Effect of peptone concentration on Y values and biomass
concentrations.................................................................................................159
Figure 3.52. Effect of peptone concentration on removal rates of 4-CP and 2,4-DCP
........................................................................................................................160
Figure 3.53. Effect of peptone concentration on SDRs of 4-CP (a) and 2,4-DCP (b)
........................................................................................................................162
Figure 3.54. Effect of peptone concentration of removal/loading rates.................164
Figure 3.55. Variation of effluent COD and corresponding removal ....................167
Figure 3.56. Effect of Rotational speed of Disks on the COD removal efficiency167
Figure 3.57. First (a) and second (b) stage of RBC discs in the absence of additional
aeration...........................................................................................................170
Figure 3.58. Microorganisms in first (a) and second (b) stage of RBC in the absence
of additional aeration......................................................................................170
Figure 3.59. RBC discs in the absence after additional aeration............................171
Figure 3.60. Influent and 1st stage effluent of chlorophenol concentrations in RBC
........................................................................................................................172
Figure 3.61. Effect of peptone concentration on the performance of RBC ...........175
Figure 3.62. Effect of peptone concentration on the MLSS and MLVS
concentrations in the effluent of RBC (a) and sludge production per mg COD
removal (b) .....................................................................................................176
Figure 3.63. Batch wise operation of RBC to recover the reactor from process
failure .............................................................................................................177
xviii
Figure 3.64. Influent (a) and effluent (b) chlorophenols concentrations in RBC ..179
Figure 3.65. Batch experiments conducted in the presence and absence of peptone
using sludge from RBC on day 32 .................................................................180
Figure 3.66. Feed chlorophenols concentrations (a) and effluent CHMS as
absorbance at 380 nm (ABS380) (b) during the shock loading experiments.181
Figure 3.67. 4-CP and 2,4-DCP concentrations at the RBC effluent during shock
loading experiments .......................................................................................183
Figure 3.68. Effect of 4-CP concentration on the removal rate in the first stage...184
Figure 3.69. Effect of 2,4-DCP concentration on the removal rate in the first stage
........................................................................................................................184
Figure 3.70. Effluent from second stage of RBC on day 2 and 4 ..........................185
Figure 3.71. Removal rates vs. loading rates of chlorophenols in the first stage...186
Figure 3.72. Removal rates vs. loading rates of chlorophenols in the second stage
........................................................................................................................187
1
ABBREVIATIONS
µ : Specific growth rate
µmax : Maximum specific growth rate
2,4-DCP : 2,4-Dichlorophenol
4-CP : 4-Chlorophenol
a : Fraction of chlorophenols in feed on COD basis
AOX : Adsorbable organic halogen
BKME : Bleached kraft mill effluent
CHMS : 5-chloro-2-hydroxymuconic semialdehyde
COD : Chemical oxygen demand
CSTR : Completely stirred tank reactor
Culture4 : Culture acclimated to 4-CP
CultureM : Culture acclimated to mixture of 4-CP and 2,4-DCP
DCG : Dichloroguaiacol
FBR : Fluidized bed reactor
FED4 : Instantaneously fed SBR operated at 10 d SRT
and fed with 4-CP
FED4-2 : Instantaneously fed SBR operated at 20 d SRT
and fed with 4-CP
FEDM : Instantaneously fed SBR operated at 10 d SRT
and fed with mixture of 4-CP and 2,4-DCP
HRT : Hydraulic retention time
I : Inhibitor
k : Zero order degradation rate constant of 2,4-DCP
KI : Inhibition coefficient in Andrews equation
Kii : Competitive inhibition constant
2
Ks : Half saturation rate constant
MLVSS : Mixed liquor volatile suspended solid
PCP : Pentachlorophenol
PNP : Paranitrophenol
q : Specific substrate utilization rate
qm : Maximum specific substrate utilization rate
RBC : Rotating biological contactor
S : Substrate concentration
SBR : Sequencing batch reactor
Scr : Critical substrate concentration
SDR : Specific degradation rate
SDRc : Specific degradation rate based on competent
biomass concentration
Smin : Minimum substrate concentration
SOC : Synthetic organic chemical
SRT : Sludge retention time
TCG : Trichloroguaiacol
TCP : Trichlorophenol
TCS : Trichlorosyringol
TeCP : Tetrachlorophenol
TOC : Total organic compound
UASB : Up-flow anaerobic sludge blanket reactor
V : Volume
X : Biomass concentration
Xc : Competent biomass concentration
Xsus : Suspended biomass concentration
Xt : Total biomass concentration
Y : Yield coefficient
1
CHAPTER 1
INTRODUCTION
1.1.General
The development of industrial and agricultural human activities leads to the
synthesis of new organic compounds known as xenobiotics (Lora et al., 2000).
Chlorophenols are introduced into the environment through various human
activities such as waste incineration, uncontrolled use of wood preservatives,
pesticides, fungicides and herbicides, as well as via bleaching of pulp with chlorine
and the chlorination of drinking water. Many forms of chlorinated aromatics or
chlorinated polyaromatics are widely utilized to control microbial contamination
and degradation. It is, therefore, not surprising that these compounds are very
inhibitory to bioremediation (Hill et al., 1996; Valo et al., 1990). Therefore, their
discharge to the environment is of great concern because of their toxicity and
suspected carcinogenicity.
Despite the recalcitrance of chlorophenols, efforts are still being made to treat them
biologically for economic reasons and in expectation of few byproducts. The
microorganisms used are usually aerobes, including Pseudomonas sp., Alcaligenes
sp., Azotobacter sp., Rhodococcus sp. and Cryptococcus sp. However, chlorinated
compounds have been reported as being in general useless as carbon and energy
2
sources for microbial growth, and should thus be rather biodegraded by
cometabolism (Wang and Loh, 1999; Tarighan et al., 2003; Saez and Rittmann,
1991 and 1993).
In most of the studies with special strains of microorganisms, necessity of phenol
supplementation to the growth medium was reported to induce enzymes required
for 4-Chlorophenol (4-CP) degradation (Wang and Loh, 1999 and 2000; Hill et al.,
1996; Lu et al., 1996; Kim and Hao, 1999; Hao et al., 2002). The main problems
with the usage of special strains are the possibility of contamination and phenol
requirement, which may lead to additional pollution problem. Due to the toxicity
problems of using phenol as a growth substrate and inducer, some studies have
been conducted to replace toxic phenol with a non-toxic conventional growth
substrate. Under these conditions, the enzymes required for chlorophenol
degradation should be induced by the compound itself. In this context, Tarighian et
al. (2003) pointed that the amount of waste chlorophenols generated by the
industries in USA were 1,900 tones in 1999 and if the entire 1,900 tones of
chlorophenols waste discharged in 1999 were subjected to cometabolic degradation
using either phenol or glucose as the growth stimulant at the ratio used in their
study (10 parts growth cosubstrate to 1 part chlorophenol), then the substrate cost
would have been U.S. $ 17.2 million compared to U.S. $ 9.4 million using glucose,
a saving of 45%. Also, as mentioned above, the addition of phenol to the waste
effluent would have added toxicity potential to those streams, whereas glucose
would not.
On the other hand, a wastewater treatment plant generally receives influent
containing a mixture of recalcitrant synthetic organic chemicals (SOCs) and
biogenic substrates. Interactions among these multiple substrates are complex,
partially due to their toxicity and, competition for enzymes and cofactors (Hu et al.
2005b). This raises the question of how does biogenic substrate concentration affect
the removal efficiency of SOCs present in the feed mixture. Many researchers claim
that a specific competent biomass fraction is responsible for the degradation of
3
specific compounds, and which is equal to the fraction of COD contributed to the
feed by that compound (Hu et al., 2005b; Hu et al., 2005a; Ellis et al., 1996; Tomei
et al., 2003). This means that the presence of a biogenic substrate does not
guarantee the enhanced biodegradation of SOCs (Hu et al. 2005b). For example,
Kulkarni and Chaudhari (2006) reported that degradation rate of p-nitrophenol
decreased with the addition of glucose. In another study, Hu et al. (2005b) reported
that at standard oxygen conditions 4-CP specific degradation rate (SDR) decreased
with the supplementation of biogenic substrates (7 g/L milk powder plus 1 g/L
yeast extract), whereas, the specific degradation rate of 2,4-DCP increased in the
presence of biogenic substrate. They also reported, that at elevated oxygen
conditions, although biogenic substrate addition did not affect 4-CP degradation
rate, it caused increase in the specific degradation rate of 2,4-DCP. These results
showed that different chemicals might give different responses to the presence of
biogenic substrate depending on assay conditions.
Another important point is that mixed cultures are particularly important if we aim
at complete mineralization of toxic organics to CO2. Many pure-culture studies
have shown that toxic intermediates accumulate during biodegradation, because a
single organism may be incapable of fully mineralizing the xenobiotics (Buitron
and Gonzalez, 1996). Therefore, treating chlorophenols with activated sludge that
contains an active mixed culture but lacks a special growth substrate would be more
meaningful, informative, and practical. The advantage in using a microbial
consortium formed by activated sludge is that the species present in the flocks
would interact. Furthermore, the degrading capabilities of an activated sludge
system can be enhanced by acclimation (Buitron et al., 1998 and Kim et al., 2002).
For example, Buitron et al. (1998) reported that acclimated activated sludge
degraded a chlorophenols mixture up to two orders of magnitude faster than pure
strains obtained from an acclimated consortium. Wiggings et al. (1987) suggested
that during acclimation, physiological transformations in the metabolism of
microorganisms, such as changing enzyme levels, regulation and production, and
mutations, lead to selection and multiplication of specialized microorganisms. In
4
aerobic microbial communities, acclimation periods range typically from several
hours to several days. Thus by definition, acclimation is any response that
ultimately leads the community to eliminate stress or find a way to maintain its
function despite the stress (Rittmann and McCarty, 2001). Several studies have
showed that acclimated mixed bacterial culture has ability to use chlorophenols as
sole carbon and energy sources (Quan et al., 2005; Moreno and Buitron, 2004;
Buitron et al., 2005).
Moreover, generally stirred tank reactors or flasks as batch reactors were utilized in
the treatability studies of chlorophenolic wastes. The advantage of these reactors is
that operating and adjusting the detention time is simple. Whereas, it is vulnerable
to shock and washout and it takes a long time to recover from perturbation (Kim et
al., 2002). On the other hand, use of attached growth reactors overcome most of the
problems encountered in suspended cells bioreactors. For example, Kim et al.
(2002) reported that packed bed reactor is more effective compared to CSTR in
simultaneous degradation of 4-CP and phenol as although washout occurred in
CSTR at a dilution rate of 0.36 per hour, efficient treatment was observed in packed
bed reactor at the same dilution rate.
Another point to consider is that knowledge of microbial growth and substrate
utilization kinetics is important for the accurate prediction of effluent quality from
engineered treatment processes (Ellis et al., 1996a,b; Ellis and Anselm, 1999;
Grady et al., 1996). Accurate kinetic parameters also help to operation engineers to
optimize operational conditions to meet discharge requirements (Ellis and Anselm,
1999). The Andrews equation (Andrews, 1968) is one of the most commonly used
models to describe self-inhibitory effect of a compound on its own transformation
(Hao et al., 2002, Ellis et al., 1996b). In recent years great effort has been put on the
modeling biodegradation of phenol (Monterio et al., 2000; Kim and Hao, 1999; Hao
et al., 2002) and cometabolic degradation of 4-CP in the presence of phenol as a
growth substrate (Hill et al., 1996; Sae´z and Rittmann, 1993; Kim and Hao, 1999;
Hao et al., 2002; Wand and Loh, 2001). Most of these studies were carried out
5
using pure cultures under sterilized conditions. Therefore, the observed kinetic
parameters cannot be applicable to model a full-scale application, in which mixed
culture is responsible for substrate utilization.
As it can be concluded from the literature survey, although kinetics of
chlorophenols degradation has been deeply investigated using pure cultures, there is
no noteworthy kinetic study with acclimated mixed culture especially when
chlorophenols are present in mixtures. Another important point is that the presence
of biogenic substrate may improve or impede the degradation of SOC of interest.
Therefore, the effect of biogenic substrate concentration on the degradation kinetics
of chlorophenols mixtures is worth studying.
Also, the feed composition of an industrial wastewater treatment plant may show
great fluctuation. Therefore, it will be interesting to investigate whether a culture
previously acclimated to a specific type of chlorophenol has ability to degrade
another structurally similar chlorophenol. If biomass has such ability, the extent of
this should be deeply investigated.
1.2. Purpose and Scope
The proposed research is based on the central hypothesis that the use of
acclimated and/or cross-acclimated culture especially in attached growth reactors
would enhance the performance of the system, which may allow the decrease or
completely avoid the necessity of biogenic substrate supplementation. The main
objective of the study is to comparatively investigate chlorophenol biodegradation
in long-term operated suspended and attached growth systems. Sequencing batch
reactors (SBRs) and rotating biological contactor (RBC) were used as suspended
and attached growth reactors, respectively. In this context, the specific objectives
of the research can be listed as:
6
1- To investigate the biodegradation kinetics of 4-CP and 2,4-DCP separately
and in mixture using batch and SBRs.
2- To investigate 2,4-DCP degradation kinetics by culture acclimated to 4-CP
and the culture acclimated to 4-CP and 2,4-DCP mixture in batch reactors.
3- To investigate the effect of acclimation levels, filling time and feed
chlorophenol concentrations on the chlorophenols degradation kinetics in
SBRs.
4- To reduce competitive and self inhibition of chlorophenols in an attach
growth reactor (RBC).
5- To investigate the effect of biogenic substrate concentration on the
biodegradation kinetics of chlorophenols using SBRs and RBC.
6- To isolate and identify the pure strains from suspended and attached cultures.
7- To compare chlorophenols degradation rates of mixed and pure cultures.
1.3. Literature Review
The most commonly disrupted xenobiotics are the pesticides, which are common
components of toxic wastes. Over 1000 pesticides have been marketed for chemical
pest control purposes. These include primarily herbicides, insecticides, and
fungicides (Madigan et al., 1997). Chlorophenols are one of the most commonly
used pesticides and they constitute a series of 19 compounds consisting of mono-,
di-, tri-, -tetra and pentachlorophenol (PCP). PCP and the lower chlorophenols have
been used as biocides to control bacteria, fungi, algae, mollusks, insects, slime, and
other biota (Hale et al., 1994).
Potential environmental sources of chlorinated phenols include:
• Direct soil applications as biocides;
• Leaching or vaporizing from treated wood items;
7
• Synthesis during routine chlorination process in water and wastewater
treatment plants, since both water sources can contain aromatic compounds
of natural origin;
• Synthesis during production of bleached pulp in which chlorine is used;
• Releases from factories into air and water;
• Incineration of waste materials and burning of fresh lignocellulosic biomass,
e.g. forest fires.
A considerable amount of information is available regarding the stability of
chlorinated phenols in the environment. The following generalization can be made:
• Chlorophenols are much more environmentally stable than the parent
unsubstituted phenol.
• As the number of chlorine substituents increases, the rate of aerobic
decomposition decreases, whereas, opposite is generally true for anaerobic
decomposition.
• Compounds containing a meta-chlorine (i.e. 3-chloro- or 2,4,5-
trichlorophenol) are more persistent under aerobic conditions than
compounds lacking a chlorine substituent in -meta positions to the hydroxyl
group.
Chlorinated phenols may be removed from water body via:
• Volatilization,
• Photodegradation,
• Adsorption onto suspended or bottom sediments, and
• Microbial degradation (Hale et al., 1994).
It is apparent from the studies on contaminated wood-preserving sites that
polychlorinated phenols are persistent in soil and ground water. Self-cleaning
systems are slow, and the contamination may thus persist for decades. While
8
degradation of chlorophenols may be slow in the environment, it is, however,
possible to isolate microbes capable of utilizing PCP and other types of chlorinated
phenols as a source of carbon and energy. In addition to aerobic isolates, obligate
anaerobic bacteria that reductively dechlorinate chlorophenols have been isolated.
Chlorophenols are among the most widely used industrial organic compounds and
listed as priority pollutants by the U.S. Environmental Protection Agency
(U.S.EPA) (Jin and Bhattacharya, 1997). The reported levels of chlorophenol in
contaminated ground water range from 150 µg/L (Valo et al., 1990) to 100-200
mg/L (Ettala et al., 1992). The concentration and the types of chlorophenols in
industrial effluents may also show great variation depending on the type of industry
and process used. Some typical values of phenolic compounds in chemical industry
wastewaters were reported to be 400 mg/L for phenolic resin production; 50 mg/L
for refineries; 12 mg/L for naphthalenic acid production and 200 mg/L for shale dry
distillation (Chen et al., 1997). Low concentrations of chlorophenols were also
reported for some industrial wastewaters. For example, the average chlorophenol
concentration in a bleached kraft mill effluent may range from 39-236 µg/L
(Rempel et al., 1992). In another study, Hall and Randle (1994) used a simulated
bleached kraft mill effluent with an average chlorophenols concentration of 155
µg/L. Many forms of chlorinated aromatics or chlorinated polyaromatics are widely
utilized to control microbial contamination and degradation. It is, therefore, not
surprising that these compounds are very inhibitory to bioremediation (Hill et al.,
1996; Valo et al., 1990). Therefore, their discharge to the environment is of great
concern because of their toxicity and suspected carcinogenicity.
1.3.1. Microbial Degradation of Recalcitrant Synthetic Organic Chemicals
(SOCs)
At first glance, it might seem strange to try and use biological treatment systems to
destroy recalcitrant synthetic organic chemicals (SOCs). After all, the destruction of
organic matter in such systems is caused by microorganisms that use the organic
9
matter as a carbon and energy source. The pathways employed for degrading
biogenic organic matter have developed over long periods of time and are quite
effective. Since SOCs have only been on the earth for a very short time period
(most for 50 years or less), how is it possible for microorganisms to posses
enzymatic pathways that can act on them? The answer to that question is two fold.
First, most SOCs have structural similarity to biogenic materials, allowing them to
fit into active sites on enzymes that did not evolve with them as substrates. Second,
the specificity of enzymes is not exact. Although the type of reaction catalyzed by a
given enzyme is very specific; the range substrate upon which it can act is not. In
other words, biodegradation of SOCs are fortuitous. Because the initiation of
biodegradation of a SOC requires the presence of an enzyme that is able to perform
a transformation reaction, it follows that biodegradation of the SOC requires the
presence of a microorganism with the genetic capability to synthesize that enzyme.
Furthermore, if mineralization of SOC to occur, the transformation product from
the first reaction must serve as the substrate for another transforming enzyme, etc.,
until ultimately a biogenic product is formed that will funnel into common
metabolic pathways. The enzymes catalyzing reactions subsequent to the initial
reactions may not reside in the same microorganism as the ones producing the
compounds upon which they act, so that mineralization may require the concerted
action of a community rather than a single type of organism (Grady et al., 1999).
The requirement to maintain appropriate microbial community can cause serious
problems if the SOC is only intermittently discharged to a bioreactor. The
capability to degrade any given organic chemical is not necessarily widely
distributed in the microbial world. While the ability to use common sugars like
glucose and fructose is widespread, other biogenic organic compounds are utilized
by only a fraction all isolates tested. Thus, one would anticipate that the ability to
use a SOC would be even less widely distributed. When the discharge of a SOC to a
bioreactor stops, the niche by which the capable microorganisms are maintained
may be eliminated, causing them to be lost from the system. The time constant for
their loss is the SRT of the system, with the result that about 95% of them will be
10
lost in three SRTs. Thus, it can be seen that most of the microorganisms capable of
degrading a SOC can be lost if SOC is absent from the bioreactor feed for only a
few weeks, unless there is some other means of preserving their niche. This means
that the capable population must be rebuilt upon reintroduction of the SOC in the
influent, causing time lags during which release of the SOC in the effluent occurs.
Even if the capable organisms are retained, chances are that the required enzymes
will not be synthesized in the absence of the SOC. This follows from the fact that
with a few exceptions, most organic compounds are degraded by inducible
enzymes, i.e., those that are synthesized only when they are needed. When the
inducer is no longer present, their synthesis is stopped and the unused enzymes are
degraded, freeing their amino acids for use in the synthesis of new enzymes.
Because proteins have a relatively high turnover rate in bacteria, this loss can be
quite rapid, causing a culture to lose the ability to degrade a SOC much faster than
would be predicted from a simple washout of the enzyme. Then, when the inducer
is reintroduced into the system, new enzyme synthesis must occur, leading to
another type of lag. While this lag is considerably shorter than the lag associated
with the regrowth of a population, it can still be sufficiently long to allow discharge
of a SOC following its reintroduction in feed to a bioreactor. So, biological systems
will be most effective in destroying SOCs when the SOCs are continuously
discharged to treatment systems (Grady et al., 1999). Unlike to inducible enzymes,
constitutive enzymes are always produced by cells independently of the
composition of the growth medium. The enzymes that operate during glycolysis
and the TCA cycle are generally constitutive and they are present at more or less
the same concentration in cells.
Alexander (1965) described factors causing organic compounds to resist
biodegradation in the environment, which termed “molecular recalcitrance”.
1. A structural characteristic of the molecule prevents an enzyme from acting.
2. The compound is inaccessible, or unavailable.
3. Some factor essential for growth is absent.
11
4. Environment is toxic.
5. Requisite enzymes are inactivated.
6. The community of microorganisms present is unable to metabolize the
compound because of some physiological inadequacy.
The first factors suggest that, for biodegradation to occur, the molecular structure
must be inherently biodegradable. The next four factors are related to
environmental conditions that are necessary for biodegradation to take place. The
last indicates that appropriate organisms must be present. If biodegradation does not
occur naturally, then at least one of the factors listed is likely to be the cause. In
order to bring about degradation, the factors imparting recalcitrance must be
overcome. The objective of engineering strategies for enhancing biodegradation is
to overcome the factor effecting recalcitrance (Rittmann and McCarty, 2001).
The nature, number, and position of xenophores all influence the biodegradability
of a SOC. Biodegradability of halogenated compounds is lower than the
unsubstituted compounds. Furthermore, the greater the number of xenophores, the
less susceptible the SOC is to biodegradation. However, it is difficult to generalize
about the effect of the position of a xenophore. A given xenophore in a given
position may have a strong effect, whereas another xenophore in the same position
may have none. Because of these widely diverse effects, there is strong interest in
the development of structure-biodegradability relationships that can be used to
deduce biodegradability from a compound’s molecular structure. It must be
recognized, however, that the knowledge base for such relationships is still limited,
thereby restricting their utility at this time. Prediction of biodegradability is a new
science and much is still to be learned. With a few exceptions, microorganisms are
thought to degrade only organic compounds that are dissolved in the aqueous phase.
This means that solubility has a profound effect on the biodegradability of any
organic compound, whether xenobiotic or biogenic. Many xenophores reduce
aqueous solubility, thereby reducing bioavailability and the rate of biodegradation.
12
Furthermore, if a compound has very low solubility, it may be difficult to induce
the enzymes required for its biodegradation (Grady et al., 1999).
The environment has a strong effect on biodegradability. In addition to the usual
effects of pH, temperature, and the availability of nutrients and electron acceptor,
the presence or absence of molecular oxygen can have a strong effect. For example,
some enzymatic steps, such as those carried out by oxygenase enzymes require the
presence of oxygen, whereas others, such as reductive dehalogenation, require its
absence. The engineer must be knowledgeable about the nature of the pathways for
biodegradation of a given SOC so that the appropriate environment can be
provided. Failure to do so will result in an inadequate system that can meet effluent
goals (Grady et al., 1999). Considering this, anaerobic reductive dehalogenation
and aerobic degradation of chlorophenols were deeply discussed.
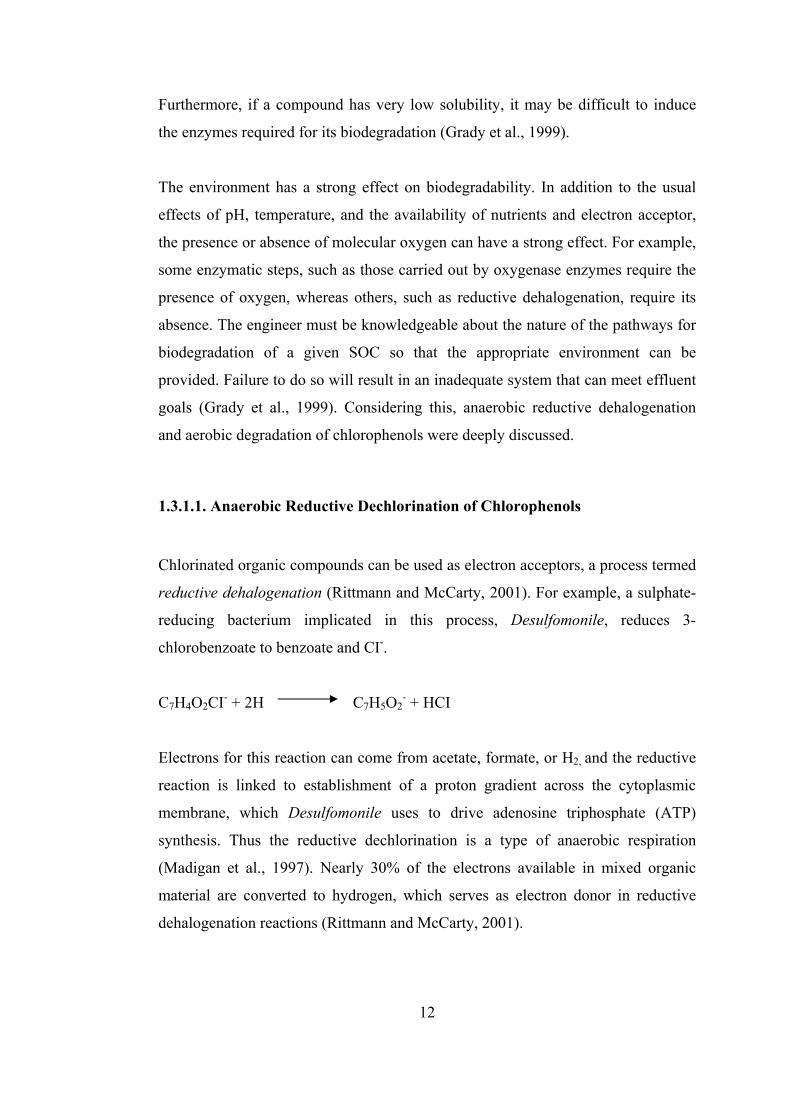
1.3.1.1. Anaerobic Reductive Dechlorination of Chlorophenols
Chlorinated organic compounds can be used as electron acceptors, a process termed
reductive dehalogenation (Rittmann and McCarty, 2001). For example, a sulphate-
reducing bacterium implicated in this process, Desulfomonile, reduces 3-
chlorobenzoate to benzoate and CI-.
C7H4O2CI- + 2H C7H5O2- + HCI
Electrons for this reaction can come from acetate, formate, or H2, and the reductive
reaction is linked to establishment of a proton gradient across the cytoplasmic
membrane, which Desulfomonile uses to drive adenosine triphosphate (ATP)
synthesis. Thus the reductive dechlorination is a type of anaerobic respiration
(Madigan et al., 1997). Nearly 30% of the electrons available in mixed organic
material are converted to hydrogen, which serves as electron donor in reductive
dehalogenation reactions (Rittmann and McCarty, 2001).
13
Aerobic microorganisms can metabolize mono- and di-chlorinated substances, but
aerobic attack becomes less effective with more highly chlorinated compounds. On
the other hand, the rate of dechlorinations under anaerobic conditions is actually
greatest for more heavily chlorinated compounds, but progressively slower as the
chlorophenol molecules become less chlorinated. In particular, although
monochlorophenols and more heavily chlorinated phenols can be degraded under
anaerobic conditions, anaerobic cultures capable of dechlorinating more heavily
chlorinated compounds have a limited ability to degrade monochlorophenols
(Armenante et al., 1999).
Efficiency of thermophilic anaerobic process (550C) to remove chlorinated phenolic
compounds from bleached kraft mill effluent (BKME) was studied by Lepisto and
Rintala (1994). In this study, four different types of anaerobic processes: an upflow
anaerobic sludge blanket (UASB) reactor; an UASB reactor enriched with sulfate;
an UASB reactor with recirculation and a fixed bed reactor with recirculation at
total influent chlorophenols concentration varying between 75.3 and 1010 µg/L.
2,4-DCP accumulation was observed. However, it was completely removed when
loading rate of reactors was increased. Contrary to AOX (adsorbable organic
halogen) removal (AOX removal during the study varied between 19 and 67%
depending on loading rate and reactor type), the COD reduction efficiency in the
four reactors decreased as the concentration of the influent COD increased (COD
removal efficiency showed variation between 32 and 72 %).
Jin and Bhattacharya (1997) investigated the toxicity and treatability of 12
chlorophenolic compounds consisting of mono-, di- and trichlorophenolic
compounds in anaerobic propionate enrichment culture in batch reactors. It was
observed that trichlorophenols was the most toxic among the examined mono-, di-
and trichlorophenolic compounds and 2,3,5-Trichlorophenol (TCP) was the most
toxic among the examined trichlorophenolic compounds. The toxicity of selected
chlorophenols to the propionate-fed culture decreased in the following order: 2,4,5-
TCP > 2,3,5-TCP > 2,4,6-TCP> 2,3,6-TCP > 2,3-DCP > 2,6-DCP, 3-CP, 4-CP, 2-
14
CP, 2,5-DCP, 3,4-DCP, 2,4-DCP. Most chlorophenols were dechlorinated
reductively to less chlorinated compounds and/or phenol. Dechlorination at the
ortho position was observed most frequently for TCPs. During the degradation
studies in batch experiments, it was observed that 2-CP degraded faster than 3-CP,
which degraded more rapidly than 4-CP. Phenol also was detected during the
degradation of 2,3-DCP; 2,6-DCP; 3,5-DCP; 2-CP; 3-CP; and 4-CP. The overall
removal of selected chlorophenols in anaerobic propionate enrichment systems
were in the following order: 2,3,5-TCP > 2,3,6-TCP > 3,5-DCP > 2,4-DCP > 2-CP
> 3,4-DCP, 2,3-DCP, 2,5-DCP > 3-CP > 2,4,5-TCP > 2,6-DCP > 2,4,6-TCP > 4-
CP.
Puhakka et al. (1994) studied continuous removal of chlorophenols in the anaerobic
fluidized-bed reactor at influent concentration of 7.1 mg/L PCP and 2,4,6-TCP and
1.0 mg/L TCG. During steady operation at 24 h HRT, the mean total organic carbon
(TOC) removal was 92% with simultaneous mean methane production of 250
mL/gCOD added. In the study, 99% removals for TCP and PCP and over 95%
removal of TCG were achieved. This study also demonstrated that sequential
anaerobic-aerobic treatment of pulping effluents, which is often proposed for
overall waste management economy, was an attractive combination for
mineralization of chlorinated monoaromatics as well.
Fang et al. (1999) investigated the efficiency of treating wastewater containing
medium-strength of phenolic pollutants and nitrate in both continuous and batch
reactors. The influence of a carbonhydrate co-substrate and interaction between
methanogens and denitrifiers were also investigated. Continuous experiments were
conducted in UASB reactor at different COD/NO3-N concentration containing 200
mg/L phenol and 100 mg/L m-cresol. Results showed that denitrifiers out-competed
methanogens for carbon and electron supplies. At the COD/NO3-N ratio of 3.34, all
electrons were utilized by denitrification, as evidenced by the cease of methane
production. The fraction of electron flow to methogenesis increased with the
COD/NO3-N ratio. It was shown that denitrifiers had superior m-cresol degrading
15
capability than methanogens. When COD/NO3-N ratio was 3.34 or lower,
denitrifiers were able to degrade nearly 100% of phenol and m-cresol with 1 day of
hydraulic retention even in the absence of additional carbon source. Batch studies
showed that degradation of m-cresol was enhanced by the presence of either
sucrose or phenol as cosubstrate.
Shin et al. (1999) used tire chips as packing material for sequential anaerobic and
aerobic biofilm reactors to remove persistent chlorinated hydrocarbons. In this
study, 2,4-DCP was added at concentration of 10, 20, 40 and 70 mg/L, total influent
COD was 1000 mg/L. Adsorption experiments for 4-CP and 2,4-DCP in batch
reactors showed that maximum adsorption capacity of 2,4-DCP was only 0.3% of
granular activated carbon. For 4-CP, maximum adsorption capacity was only 0.04%
of granular activated carbon because 4-CP has greater polarity than DCP.
Therefore, it was concluded that removal of 2,4-DCP and 4-CP through adsorption
could be neglected. Biomass attachment tests showed that tire chips has not
inhibitory effect on biofilm and can be used as carrier in anaerobic and aerobic
reactors. 2,4-DCP was completely degraded in anaerobic reactor but 4-CP was
produced as a byproduct. 4-CP could not be removed in anaerobic reactor and it
was further removed in aerobic reactor with the removal efficiencies of 98 and 70%
at concentrations of 0.16mM and 0.31mM, respectively. Therefore, waste tires,
which are difficult to dispose of or treat, can be effectively used as a medium for
biofilm reactors.
Armenante et al. (1999) studied a two-stage anaerobic-aerobic process (including
both batch and continuous reactors) to completely degrade 2,4,6-TCP. Anaerobic
batch experiments in serum bottles showed that lag time for TCP degradation was
about 40 h. After lag period, 2,4,6-TCP was degraded to 2,4-DCP, which was
degraded to 4-CP. Anaerobic batch studies showed that reduction of 4-CP much
more slower than that of more chlorinated phenolic compounds. Also,
parachlorophenol (4-CP) are frequently reported as the accumulated intermediates
16
during reductive dechlorination of more heavily chlorinated phenols (Bali and
Sengül, 2003).
1.3.1.2. Aerobic Microbial Degradation of Chlorophenols
Oxygen has two important roles in enzymatic reactions. First, it can be used as an
electron acceptor in energy generating reactions. Although this is by far the most
important role of O2 in cellular metabolism, O2 plays an interesting and important
role as a direct reactant in certain types of anabolic and catabolic processes.
Oxygenases are enzymes that catalyze the incorporation of oxygen from O2 into
organic compounds. There are two kinds of oxygenases: dioxygenases, which
catalyze the incorporation of both atoms of O2 into the molecule; and
monooxygenases, which catalyze the transfer of only one of the two O2 atoms to an
organic compound as a hydroxyl (OH) group, with the second atom of O2 being
reduced to water, H2O. Because monooxygenases catalyze the formation of
hydroxyl group (OH) in organic compounds, they are sometimes called
hydroxylases. In most monooxygenanses, the electron donor is NADH or NADPH
(Madigan et al., 1997).
Two major steps occur in the biodegradation of aromatic compounds (1) conversion
of aromatic compounds into central intermediates with peripheral pathways and (2)
conversion of the central intermediates to biomass and end products with central
pathways. In the peripheral pathways, the aromatic compounds are converted to
hyroxylated intermediates by monooxygenases or dioxygenases. In the central
pathways, the aromatic ring in the intermediates is broken. Three different
dioxygenases are involved in the cleavage of the central intermediates. First, the
intradiol (ortho) cleaving dioxygenases (e.g. catechol 1,2-dioxygenase,
protocatechuate 3,4-dioxygenase). The second class is extradiol (meta) cleaving
dioxygenases (e.g., catechol 2,3-dioxygenase, procatechuate 4,5-dioxygenase). The
third groups is the dioxygenases (e.g., gentisate 1,2-dioxygenase) cleaving the
17
aromatic ring of para-hydroxylated benzoic acid between carbon 1 and 2 (Çinar,
2002).
Despite the recalcitrant nature of chlorophenols, efforts are still being made to treat
them biologically for economical reasons and in expectation of few byproducts
formation. The microorganisms used are usually aerobes, including Pseudomonas
sp., Alcaligens sp., Azotobacter sp., Rhodococcus sp., and Cryptococcus sp.
Aerobes are more efficient at degrading toxic compounds because they grow faster
than anaerobes and usually achieve complete mineraralization of toxic organic
compounds, rather than transformation as in the case of anaerobic treatment (Kim et
al., 2002).
Bacteria use different strategies to degrade chlorophenols:
• Mono- and dichlorophenols are usually degraded aerobically by
hydroxylation to chlorocatecols and by a spontaneous dechlorination after
ortho- or meta- cleavage of the chlorocatecols.
• Thrichloro- and polychlorophenols are degraded aerobically via
parahydroquinones, which are subsequently dechlorinated before ring
cleavage.
• All chlorophenols (mono- to PCP) are degraded under anaerobic conditions
by a variety of microbial communities; degradation is initiated by reductive
dechlorination followed by ring cleavage (Hale et al., 1994).
Aerobic microorganisms can metabolize mono- and di-chlorinated substances, but
aerobic attack becomes less effective with more highly chlorinated compounds. On
the other hand, the rate of dechlorinations under anaerobic conditions is actually
greatest for more heavily chlorinated compounds, but progressively slower as the
chlorophenol molecules become less chlorinated (Armenante et al., 1999).
18
For complete degradation of chlorinated aromatic compounds, two steps are
necessary, cleavage of the aromatic ring and removal of chlorine atom. The initial
step in the aerobic degradation of mono-chlorophenols is their transformation to
chlorocatechols, ring cleavage by deoxygenates may proceed. In the aerobic
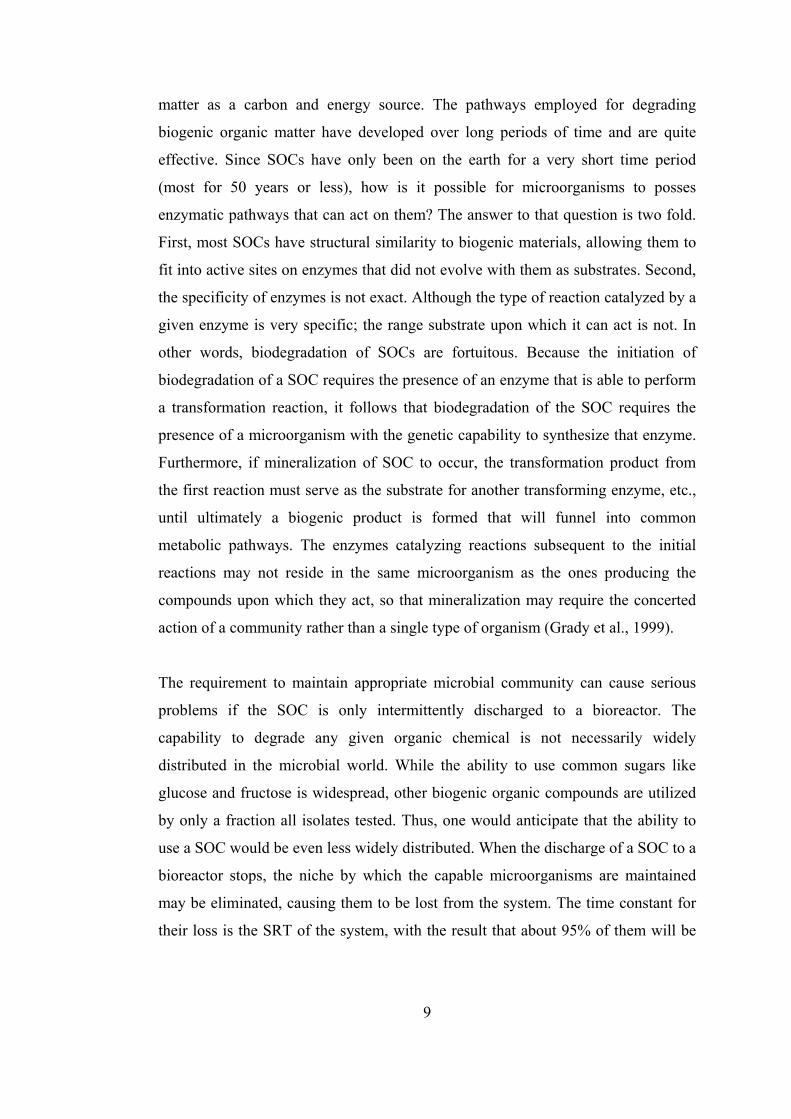
biodegradation of 4-CP, the first step is conversion of 4-CP to 4-chlorocatechol.
The meta-cleavage of 4-chlorocatechol results in the production of a chlorinated
aliphatic compound; 5-chloro-2-hydroxymuconic semialdehyde (CHMS), widely
reported to be a dead-end metabolite especially when pure species were used
(Tarighan et al., 2003; Saez and Rittmann, 1991 and 1993). However, recent reports
have shown that further metabolism of CHMS may occur resulting in complete
degradation of 4-CP via meta-cleavage pathway with mixed cultures (Sahinkaya
and Dilek, 2002 and 2005; Moreno-Andrade and Buitron, 2004a,b; Buitron et al.,
2005; Farrell and Quilty, 1999). CHMS is metabolized leading to the production of
pyruvic acid and chloroacetic acid. Chloroacetic acid may then be dehalogenated to
form glycolate, which may be utilized along with pyruvic acid in the TCA cycle
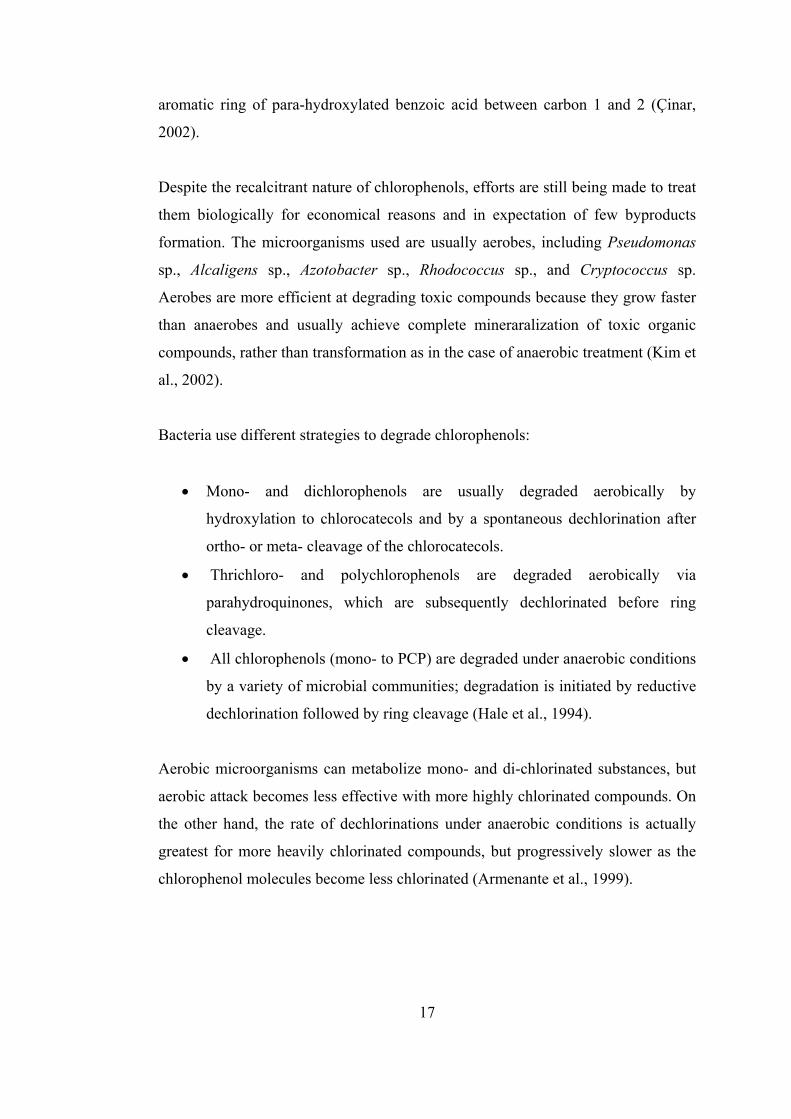
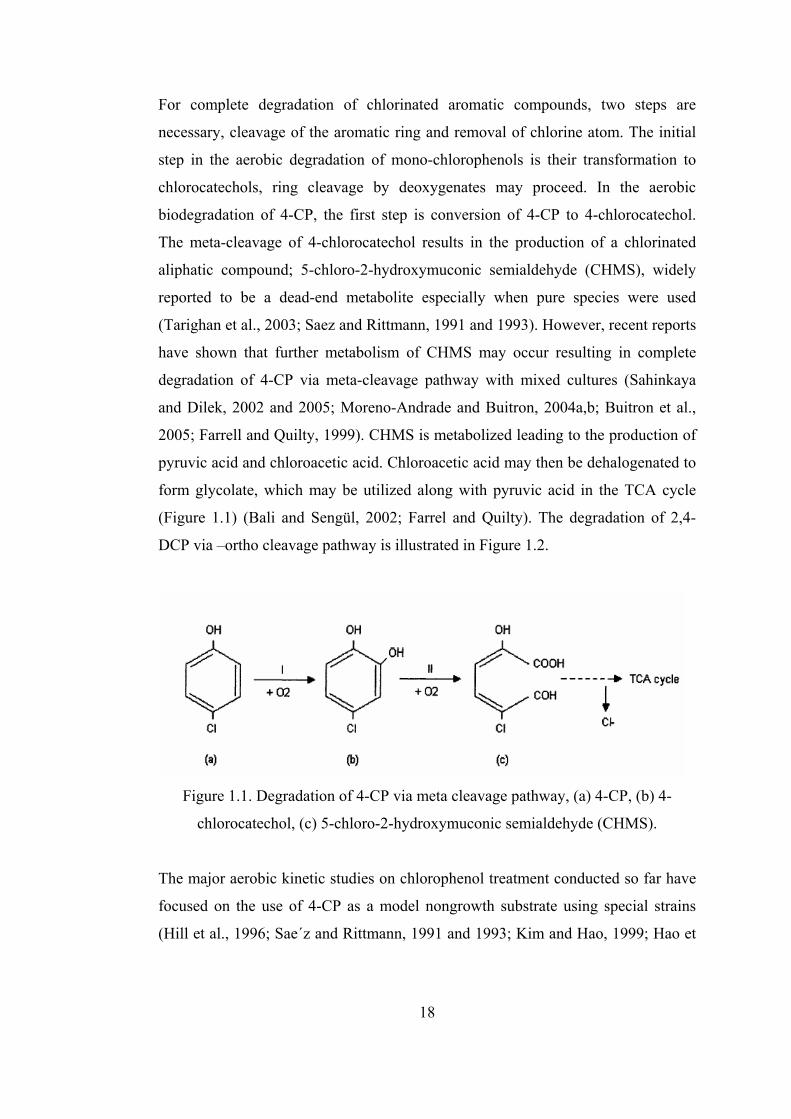
(Figure 1.1) (Bali and Sengül, 2002; Farrel and Quilty). The degradation of 2,4-
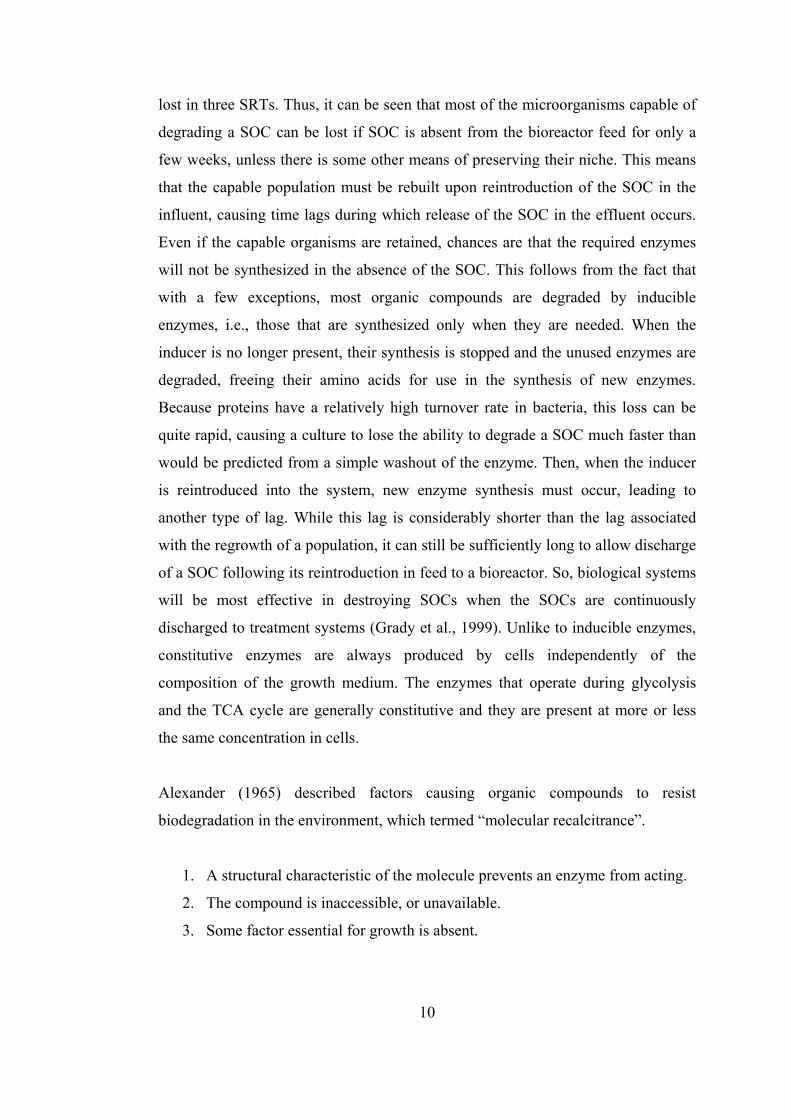
DCP via –ortho cleavage pathway is illustrated in Figure 1.2.
Figure 1.1. Degradation of 4-CP via meta cleavage pathway, (a) 4-CP, (b) 4-
chlorocatechol, (c) 5-chloro-2-hydroxymuconic semialdehyde (CHMS).
The major aerobic kinetic studies on chlorophenol treatment conducted so far have
focused on the use of 4-CP as a model nongrowth substrate using special strains
(Hill et al., 1996; Sae´z and Rittmann, 1991 and 1993; Kim and Hao, 1999; Hao et
19
al., 2002; Wand and Loh, 2001). Many pure-culture studies have shown that toxic
intermediates accumulate during biodegradation, because a single organism may
not have the ability to completely mineralize the xenobiotic (Buitron and Gonzalez,
1996). Therefore, if pure species are used in the degradation of SOCs, bacteria need
a primary biogenic substrate to grow on it, which is known as co-metabolism,
whereas, complete degradation of chlorophenols with mixed culture is possible
even in the absence of externally added biogenic substrate.
Figure 1.2. Degradation of 2,4-DCP via ortho cleavage pathway
20
1.3.1.2.1. Degradation of SOCs in Multisubstrate Environment and Co-
metabolic Degradation of Chlorophenols
The ability of microorganisms to degrade xenobiotic organic compounds when
present at low concentrations, typical of those in the environment, is open to
question. Organism growth rate is a function of substrate concentration. At
sufficiently low concentrations, the organism growth rate may be exceeded by the
organism decay rate so that no net growth can occur. The concentration at which
growth is just balanced by decay is termed the minimum substrate concentration
(Smin). Therefore steady-state biomass can be sustained only when S>Smin. If
S<Smin, the cell net specific growth rate is negative and biomass will not
accumulate or will gradually disappear (Laura et al., 1984; Rittmann and McCarty,
2001). Although some microorganisms have the ability to use SOCs as a sole
carbon and energy source, addition of some growth supporting compounds may be
necessary if SOCs concentration is below Smin. It has been postulated that bacteria
can, however, consume a xenobiotic compound at low concentrations if the
population is supported through energy obtained from another substrate that is
present in concentrations above its Smin level. The compound at high concentration
is termed the primary substrate, and that at low concentration is termed the
secondary substrate (Laura et al., 1984). In this case, the primary substrate should
be selected carefully as it should not impede the degradation of SOC of interest. If
primary substrate is present in the medium, its presence should also be considered
in the development of the model equation.
Co-metabolism (co-oxidation or co-transformation) refers to the ability of
microorganisms to metabolize a compound that cannot be used as an independent
source of energy or growth. Co-metabolism is thus a fortuitous process in which
microorganisms while growing at the expense of one substrate also have the
capacity to transform another compound without driving any benefit from its
metabolism. Thus, microorganisms would need another substrate as a carbon and
energy source on which to grow. This special type of metabolism has been named
21
as co-metabolism. In co-metabolism, organisms use one substrate as primary
energy source and metabolize another compound utilizing the enzymes, which are
synthesized to degrade the primary substrate (Atlas, 1993). In other words, primary
substrate may also induce enzymes required for the degradation of target
compound. However, non-growth substrates have been shown to inhibit the
oxidation of the growth substrate. As such, the rate and efficiency of cometabolism
are always dependent on a complex interaction between the growth substrate and
non-growth substrate. Because some of the most common chlorinated solvents are
known to be biodegraded through cometabolic pathways, the degradation behavior
of cometabolised compounds is of great importance to the biological treatment of
polluted groundwater, industrial effluent, hazardous waste sites, and so on (Bali and
Sengül, 2002).
Wang and Loh (2000) reported that 4-CP degradation at high concentrations using
P. putida were only possible when phenol was supplemented in addition to a
readily degradable substrate (sodium glutamate was used in the study) to induce
enzymes required for the degradation of 4-CP. They stated that for cometabolism of
4-CP, phenol and sodium glutamate play quite different roles although both of them
are growth substrates and are responsible for the production of new cells. As a
specific growth substrate, phenol initiates the key enzymes for its own degradation
and 4-CP transformation. Phenol oxidation efficiently regenerates the reducing
power and continuous phenol degradation sustains the cells ability to
cometabolically transform 4-CP. On the other hand, the major contribution of
sodium glutamate is to increase the specific growth rate and regenerate more active
cells through its metabolism (Wang and Loh, 2001). In another study, Hill et al.
(1996) studied the degradation of 4-CP using a pure culture of Alcaligenes
eutrophus. They reported that 4-CP was found to decrease biomass yield and
increase lag time before logarithmic growth occurred. Both phenol and 4-CP were
found to inhibit the growth rate linearly with maximum concentrations of 1080 ppm
and 69 ppm respectively, beyond which no growth occurred. Although, efficient
degradation of 4-CP was observed in the presence of phenol, no growth or 4-CP
22
consumption occurred in the absence of phenol as the primary growth substrate.
Similar to these observations, Hao et al. (2000) and Kim and Hao (1999) reported
synchronous phenol and 4-CP utilization by the Acinetobacter isolate for
sufficiently high initial phenol:4-CP concentration ratios (>200:50 mg/L). Under
such conditions, sufficient energy from phenol utilization was available for 4-CP
transformation.
Although the removal of 4-CP in the presence of phenol as a primary substrate by
special strains of microorganisms has been studied extensively, it is well known
that phenol is a toxic compound and supplementation of phenol may lead to another
pollution problem (Wang and Loh, 1999; Tarighan et al., 2003; Bali and Sengül
2002). In addition to potential environmental problems caused by phenol,
competition between phenol and 4-CP was observed especially at high phenol
concentrations. In cases where growth and nongrowth substrates share the same key
enzymes, competitive inhibition is commonly observed, and cometabolic
transformation of the nongrowth substrates is strongly affected by the presence of
the growth substrates. To exclude such competitive inhibition, two-stage or
sequencing reactor systems have been proposed to decouple cell growth and
transformation of the nongrowth substrates. Nevertheless, in addition to the systems
being inherently complex, the degradation activity of the cells in such systems for
the nongrowth substrates cannot be maintained due to an absence of growth
substrates. Alternatively, the competitive inhibition between growth and nongrowth
substrates can be avoided if different enzymes catalyze their respective
transformations. This is possible if the cometabolic enzymes were induced by the
nongrowth substrate. Then, the growth substrate is only responsible for cell growth
and regeneration of necessary co-substrates like NADH or NADPH. This being the
case, growth substrates can be optimally chosen from a wide range of carbon
sources, including nontoxic, readily degradable organic compounds. Especially
when the selected growth substrate is a conventional carbon source, the design of
cometabolic systems can be facilitated with reduced cost and risks associated with
the addition of toxic growth substrates (Wang and Loh, 1999). In this context, some
23
studies have been conducted in order to replace phenol with a conventional non-
toxic organic substrate as a growth substrate to degrade mono chlorophenols (Wang
and Loh, 1999; Bali and Sengül, 2002, Tarighian et al., 2003). In the study of Wang
and Loh (1999), 4-CP degradation by Pseudomonas putida was complete up to 200
mg/L when growth medium was supplemented with 1000 mg/L glucose. However,
when the concentration of 4-CP was raised to 300 mg/L, cells could not grow even
after extended period of incubation. Therefore, the ratio of glucose to 4-CP
concentration was found to be 1000:200 or higher in order to achieve complete
degradation of 4-CP. Compared with phenol as the added growth substrate, cells
grown on glucose displayed a longer acclimation phase and, in general, a lower
specific transformation rate. The volumetric transformation rate of 4-CP, however,
was greatly enhanced due to the increased cell density. The results of this work
suggest that 4-CP itself induced the enzymes necessary for its cometabolism. With
NADH regenerated effectively through metabolism of glucose, 4-CP was
transformed in the absence of added phenol. Consequently, the competitive
inhibition involved in cometabolism was avoided and the risks associated with
addition of toxic growth substrates such as phenol were eliminated. Similar to these
results, Bali and Sengül (2002) reported that maximum 4-CP removal rates were
achieved at glucose concentrations between 1000 and 4000 mg/L for 200 mg/L 4-
CP, with an effluent 4-CP concentration below detection limits (0.1 mg/L).
Complete removal of 300 mg/L of 4-CP was achieved at glucose concentrations of
2000 and 3000 mg/L. Increase in 4-CP effluent concentration accompanied with
increase in the influent glucose concentration was observed. Also they observed an
intermediate having a yellow color at the effluent of reactor in cases where
complete degradation of 4-CP was not possible. This intermediate had all
characteristics of 5-chloro-2-hydroxymuconic semialdehyde. The same
intermediate was also reported by some other investigators (Tarighan et al., 2003;
Saez and Rittmann, 1993). Although this intermediate was observed at the effluent,
Tarighian et al (2003) reported negligible toxicity of the intermediate towards
Artemia salina, unlike phenol and 4-CP.
24
In another study, Tarighian et al. (2003) reported that 4-CP was consumed as a
cometabolite with either glucose or phenol acting as the primary growth substrate.
Surprisingly, glucose was found to be the superior growth cosubstrate, suggesting
that inexpensive sugars can be used to enhance the biodegradation of chlorophenol-
contaminated sites. Another advantage of using conventional carbon source as a
primary substrate in the cometabolic degradation of 4-CP is the lower cost of
conventional growth substrate compared to phenol. Tarighian et al. (2003) pointed
that the amount of waste chlorophenols generated by the industries in USA were
1,900 tones in 1999 and if the entire 1900 tones of chlorophenol waste discharged
were subjected to cometabolic degradation using either phenol or glucose as the
growth stimulant at the ratio used in their study (10 parts growth cosubstrate to 1
part chlorophenol), then the substrate cost would have been U.S. $ 17.2 million
compared to U.S. $ 9.4million using glucose, a saving of 45%. Also, as mentioned
above, the addition of phenol to the waste effluent would have added to the toxicity
potential of those streams, whereas glucose would not.
It is also important to state that a wastewater treatment plant generally receives
influent with a mixture of SOCs and biogenic substrates. This means that SOCs and
biogenic compounds often coexist in many wastewater reactors. Interactions among
these multiple substrates are complex, partially due to the toxicity, competition for
enzymes and cofactors (Hu et al., 2005b). Therefore, the question should be
answered is how biogenic substrate concentration affects the removal efficiency of
SOCs especially when they are present in mixture. Many researchers claim that a
fraction of biomass is responsible for the degradation of specific compound, which
is equal to the fraction of COD contributed to the feed by that compound (Hu et al.,
2005b; Hu et al., 2005a; Ellis et al., 1996; Tomei et al., 2003). This means that the
presence of biogenic substrate does not guarantee the enhanced biodegradation of
SOCs (Hu et al., 2005b). For example, Kulkarni and Chaudhari (2006) reported that
degradation rate of p-nitrophenol decreased with the addition of glucose. In another
study, Hu et al. (2005b) reported that at standard oxygen conditions 4-CP
degradation rate decreased with the supplementation of biogenic substrate, whereas,
25
2,4-DCP degradation rate increased in the presence of biogenic substrate. In the
same study, it was also reported that at elevated oxygen conditions, although
biogenic substrate addition did not affect 4-CP degradation rate, it increased the
degradation rate of 2,4-DCP. These results showed that different chemicals might
give different response to the presence of biogenic substrate depending on assay
conditions. In our previous studies, we have investigated the effect of biogenic
substrate availability on 2,4-DCP (Sahinkaya and Dilek, 2002) and 4-CP
(Sahinkaya and Dilek, 2005) degradation for short term experiments. We have
observed a positive effect of biogenic substrate on the chlorophenol removal rate,
although complete degradation was observed even in the absence of biogenic
substrate. However, the impact of biogenic presence should be investigated in long-
term operated reactors.
Zaidi and Mehta (1995) have reported that different bacteria may give different
response to the presence of alternative carbon source. They reported that addition of
glucose did not enhance the p-nitrophenol (PNP) degradation of Corynebacterium
strain Z4 and the bacterium utilized the two substrates simultaneously. Glucose
used at the same concentration, inhibited PNP degradation by Pseudomonas strain
MS. However, glucose increased the extent of PNP degradation by Pseudomonas
strain GR. Phenol also enhanced the degradation of PNP in wastewater by
Pseudomonas strain GR, but had no effect on PNP degradation by
Corynebacterium strain Z4. They also reported that the concentration of toxic
compound may also play important role as the addition of glucose increased the
PNP degradation by Corynebacterium strain Z4 when PNP concentration was too
low to support growth.
Yang et al. (2004) investigated the ability of PCP degrading bacterium
Sphingomonas chlorophenolica to degrade and dechlorinate other chlorophenols.
Their results indicated that Sphingomonas chlorophenolica was able to completely
degrade 2,3,6-TCP, 2,4,6-TCP, 2,3,4,6-TeCP and PCP within 38.1, 15.1, 11.8 and
11.8 hours, and to release 50.1, 60.9, 63.7 and 58.5 mg/L chloride at the same
26
period of time. Furthermore, the results showed that four kinds of chlorophenols
were completely dechlorinated by the cell suspensions. In the presence of
supplementary carbon sources (300 mg/L glucose, pyruvate, sodium acetate and
150 mg/L 2,4,6-TCP, PCP), PCP removal efficiency increased with the presence of
glucose or pyruvate, but the removal efficiency of 75 mg/L 2,4-dichlorophenol did
not raise with the supplement of carbon sources as 75 mg/L of 2,4-DCP was
inhibitive to the growth and activity of cells. Although glucose and pyruvate
increased the removal of PCP, sodium acetate did not have any effect on PCP
removal. The first possible reason of increasing PCP degradation rate in the
presence of glucose and pyruvate suggested by the authors is that the metabolic
pathway of PCP and glucose or pyruvate was partially the same. The second
suggested reason is that the metabolism of glucose and pyruvate could provide
more NADH to facilitate the degradation of PCP.
Although effects of phenol addition on 4-CP degradation kinetics have been
extensively evaluated, less study is available on other types of chlorophenols. In the
study of Quan et al. (2004b), the effect of phenol addition on 2,4-DCP degradation
was evaluated using inner-loop bioreactor immobilized with Achromobacter sp.
They reported that the presence of phenol had inhibitory effect on the enzyme
responsible for 2,4-DCP degradation and the degradation rate decreased in the
presence of phenol. The reason of this observation was that the major carbon source
shifted from toxic compound, 2,4-DCP, to relatively less toxic compound, phenol.
It was also interesting to observe that after complete 2,4-DCP degradation, the
biodegradation rate of phenol increased rapidly.
The same authors (Quan et al., 2004c) also studied the removal of multiple
chlorophenols using activated sludge system bioaugmented with a 2,4-DCP
degrading mixed culture. Results showed that bioaugmented system not only
enhanced the removal of 2,4-DCP, but also improved the removal of other
chlorophenols such as 4-CP and 2,4,6-TCP. They reported that the three types of
chlorophenols could be degraded in the bioaugmented bioreactor in the sequence of
27
2,4-DCP>4-CP>2,4,5-TCP. They also reported that both 4-CP and 2,4,5-TCP
retarded the degradation of 2,4-DCP, but the effect of glucose on 2,4-DCP removal
was not obvious.
In another study, Mangat and Elefsiniotis (1999) investigated the effect of HRT, the
presence and absence of supplemental substrate (phenol or dextrose) and variation
in feed concentration on the biodegradation potential of 2,4-dichlorophenoxyacetate
(2,4-D) in SBR. They reported a need of long acclimation period (around 4 months)
to observe efficient 2,4-D removal. They observed a sequential utilization pattern of
supplemental substrate and 2,4-D. The 2,4-D specific removal rates were affected
by the type of supplemental substrate used (phenol or dextrose), being significantly
lower (30-50%) in the case of dextrose, whereas, they reported the highest specific
degradation rates when 2,4-D was supplemented as a sole carbon and energy
source.
Although there are some studies on the effect of a biogenic substrate concentration
on the degradation rate of toxic organic compounds, their conclusions are often
conflicting as also reported by Wang et al. (1996). In the study of Wang et al (1996)
they pointed different results found in the literature and discussed the possible
reasons of these observations. They stated that confusion seems to stem from the
fact that in some studies well-specified cultures have been used while in others
widely heterogeneous cultures have been employed in the experiments and from the
use of overall rather than specific (i.e., per-unit amount of biomass) biodegradation
rates. If we give some examples from the literature, Lackmann et al. (1981) have
performed experiments with 2,4-D and glucose using a mixed culture which
consisted of three to four dominant Pseudomonas sp. They found that when
simultaneous use of glucose and 2,4-D by the culture occurred, the rates of 2,4-D
biodegradation were the same with those observed when the medium did not
contain glucose, whereas the rate of glucose utilization was lower than that
observed in the absence of 2,4-D. The author’s conclusion was that 2,4-D inhibits
glucose removal while glucose does not affect 2,4-D biodegradation. However,
28
Wang et al. (1996) pointed that this conclusion is not valid when specific growth
rates are used. If 2,4-D biodegradation rate is the same in the presence (implying
higher biomass levels) and absence of glucose, the specific biodegradation rate of
2,4-D is inhibited by the presence of glucose.
In another study, Orhon et al. (1989) studied the effect of the presence of a nutrient
broth on the biodegradation of 2,4-D using a heterogeneous culture. They observed
that the rate of nutrient broth utilization was severely reduced in the presence of
2,4-D while 2,4-D removal (in acclimated cultures) was unaffected by the presence
of the nutrient broth. They explained the reason of this observation is that a specific
fraction of biomass was only responsible for 2,4-D degradation and addition of
biogenic substrate did not affect 2,4-D degradation rate. It seems that presence of
nutrient broth inhibited 2,4-D degradation if the rates had been measured on a per-
unit amount of biomass basis (Wang et al., 1996). In their study, Wang et al. (1996)
concluded that the use of easily degradable substrates did not enhance the specific
degradation rate of phenol.
Contrary to these findings, Schmidt et al. (1987) indicated that glucose enhances
the specific rate of p-nitrophenol degradation by Pseudomonas sp.
Therefore, the effect of other organics on the degradation kinetics of SOCs should
be considered in the development of models used to predict the system
performance.
1.3.1.2.2. Use of Mixed Microbial Communities in Aerobic Biodegradation of
Chlorophenols
Most biodegradation occurs by growth-linked metabolism. This means that the
microorganisms performing the biodegradation receive their carbon and energy
from degradation of the SOC and the SOC can serve as the sole carbon and energy
source for microbial growth. As a consequence, the transformation products from
29
the initial biodegradative reactions with the SOC ultimately enter into the normal
metabolic pathways wherein some of the carbon is incorporated into new cell
material and the remainder is released as carbon dioxide. The result is
mineralization of SOC because it has been converted into innocuous products.
Engineered systems almost always employ natural microbial communities, rather
than pure microbial cultures, and so it is not unusual for biodegradation of SOCs to
occur by the coordinated action of several species within that community. Such
assemblages are called consortia (Grady et al., 1999).
Although pure cultures may exhibit a range of chlorophenol degradation
capabilities, the use of pure culture in a real out door system would be impractical
due to the dominance of other strains on the special strains that are better equipped
to degrade the target compound. Despite the mentioned disadvantage of using pure
culture in out door degradation systems, in most of the studies discussed above,
special strains of microorganisms were utilized for cometabolic degradation of
chlorophenols in the presence of phenol as a growth substrate (Wang and Loh, 1999
and 2000; Wang et al., 2000; Hill et al., 1996; Lu et al., 1996; Kim and Hao, 1999;
Hao et al., 2002). Another disadvantage of using pure culture is the incomplete
degradation of target compound, as the selected specie may not have the ability to
degrade all intermediate coming out from the conversion of target compound.
Mixed cultures are particularly important when the emphasis is placed on complete
mineralization of toxic organics to CO2. Therefore, treating chlorophenols with
activated sludge that contains an active mixed culture but lacks a special growth
substrate would be more meaningful, informative, and practical. Also, it is well
known that the capacities of an activated sludge system can be enhanced by
acclimation (Buitron et al., 1998 and Kim et al., 2002). Buitron et al. (1998)
reported that acclimated activated sludge degraded chlorophenol mixture by one to
two orders of magnitude faster than pure strains obtained from the acclimated
consortium. Sahinkaya and Dilek (2002) reported that although no removal was
observed with an unacclimated culture, almost complete removal of 2,4-DCP, up to
148.7 mg/L, was achieved with the acclimated culture. Similar result was also
30
observed for 4-CP degradation as the degradation rate sufficiently increased with
the acclimation (Sahinkaya and Dilek, 2005). Kim et al. (2002) observed that 4-CP
and phenol degradation by a single pure culture was seriously inhibited in the
presence of 2,4,6-TCP and when another microorganism having the ability of 2,4,6-
TCP degradation added, the concentration of 2,4,6-TCP decreased and the
degradation of 4-CP and phenol began. Therefore, by using a mixed culture, the
severe effects of one compound could also be relieved.
The first step to biodegrade toxic substances in a wastewater treatment plant is the
acclimation of the microorganisms. When microorganisms are put in contact with
toxic compounds, in a favorable environment, acclimation to these compounds may
occur. Different phenomena have been described to explain the acclimation phase.
Wiggings et al. (1987) suggested that there is a selection and a multiplication of
specialized microorganisms during this phase and physiological transformations in
the metabolic system of the microorganisms, i.e., alterations in the enzymatic level,
regulation and production, mutations, etc. In aerobic microbial communities, the
acclimation periods typically range from several hours to several days. Therefore,
acclimation (adaptation) is any response that ultimately leads the community to
eliminate stress or find a way to maintain its function despite the stress (Rittmann
and McCarty, 2001). However, not much information is available concerning the
activity evolution of a microbial consortium during the acclimation to toxic
wastewater. On the other hand, it has been shown that the acclimation is not
permanent. The exposition of the acclimated population to prolonged periods of
starvation produces a decrease of the bacterial activity and, even the death of some
of them (Moreno-Andrade and Buitron, 2004a).
The variation of the microbial activity during the acclimation and deacclimation
process in the degradation of 4-CP was studied in a sequencing batch reactor (SBR)
by Moreno-Andrade and Buitron (2004a). The influence of initial toxic
concentration on acclimation of activated sludge from a municipal wastewater
treatment plant was studied. The experimental design considered three different sets
31
of initial concentration of 4CP: 50, 100 and 200 mg/L. After acclimation, the
biomass was exposed to different periods of starvation to study the deacclimation.
The results showed a reduction in the degradation time as the acclimation process
occurred. Degradation time was reduced from 40 h to 50 min, in the case of 50 mg
4-CP/L and from 52 to 1.16 h, for the case of 100 mg/L. The metabolite production
during the acclimation has been observed. As the acclimation took place, it was
found that the affinity of the consortia to biodegrade the toxic increased, whereas
the ability to biodegrade acetate decreased. This may be due to increase in fraction
of specialist biomass grown on 4-CP (Magbanua et al., 1998). Moreno-Andrade and
Buitron (2004a) also observed that starvation generates a decrease on the microbial
activity. The extent of the deacclimation of starved microorganisms seems to be
affected by the history of the culture. Degradation rates during the acclimation and
deacclimation process followed an exponential model.
Sudden introduction of some unexpected recalcitrant compounds or increase of
their loading rate may cause failure of a conventional activated sludge system easily
and result in toxicity breakthrough. This system failure is mainly due to the low
population of bacteria capable of degrading these recalcitrant compounds and
inhibition of these pollutants to the biomass in the system. One of the most
straightforward strategies to remediate such system failure is bioaugmentation using
a group of specific bacteria (Quan et al., 2004a). In this context, Quan et al. (2004a)
extensively evaluated enhancement of 2,4-DCP degradation in conventional
activated sludge systems bioaugmented with mixed special culture. Results showed
that the two bioaugmented conventional activated sludge systems, which were
inoculated with 5% and 15% 2,4-DCP degrading mixed culture, respectively,
demonstrated and maintained stronger ability to degrade 2,4-DCP than the non-
supplemented control one during the first three shock loading periods. For the
fourth 2,4-DCP shock loading which occurred 100 days after inoculation, the
advantages demonstrated by the bioaugmented systems were greatly reduced
compared to those of the previous three runs, which may be due to acclimation of
culture to 2,4-DCP in non-augmented reactor.
32
In another study, Quan et al. (2003) studied biodegradation of 2,4-DCP in SBR
augmented with immobilized mixed culture. They reported that inoculum size
affected the start-up time of the SBR systems. For the non-augmented system more
time was needed to start up. In addition, bioaugmented SBR systems demonstrated
stronger capacity to cope with 2,4-DCP shock loading. The control SBR failed to
treat 2,4-DCP at 166 mg/L in influent, while the SBR including 1.9% and higher
fraction of special sludge achieved 166 and 250 mg/L 2,4-DCP degradation,
respectively. It was also found that augmented culture played the primary role in
degrading 2,4-DCP at the beginning of system start-up, but after one-month
operation, both the indigenous and the introduced culture posed strong ability to
degrade 2,4-DCP.
Bioaugmention to improve chlorophenol removal was also studied by Farrell and
Quilty (2002). Degradation of 2-chlorophenol by the commercial mixture via a
meta-cleavage pathway led to incomplete degradation, while P. putida CP1 was
shown to be capable of completely degrade 2-chlorophenol via an ortho-cleavage
pathway. Augmentation of the commercial mixed culture with P. putida CP1
caused complete degradation of 2-chlorophenol via an ortho-cleavage pathway. The
ability of P. putida CP1 to degrade 2-chlorophenol increased with the addition of
mixed culture. Increasing the mixed culture inoculum size added to P. putida CP1
decreased lag periods and increased rates of degradation, resulting in decreased
times of degradation.
Biodegradation of 2,4-DCP using Pseudomonas putida and Pseudomonas putida
CP1 was studied by Kargi and Eker ( 2004 and 2005). They observed low 2,4-DCP
removal efficiencies with the pure cultures. For example, complete 2,4-DCP
removal was only observed when initial concentration is 30 mg/L at the end of 60 h
of incubation and DCP removal decreased to 32% and 22% for initial DCP
concentrations of 125 and 240 mg/L, respectively. As for Pseudomonas putida
CP1, the maximum removal efficiency was only 35% when initial DCP
concentration was 51 mg/L. Although no significant degradation of 2,4-DCP by
33
pseudomonas putida was observed in the study of Kargi and Eker (2004), the same
authors reported high removal efficiency of 2,4-DCP with acclimated mixed culture
(Kargi et al, 2005 and Kargi and Eker, 2006). Kargi et al. (2005) investigated
biological treatment of synthetic wastewater containing 2,4-DCP of varying
concentrations using an activated sludge unit operated at 10 d of SRT. They
observed almost complete removal of 2,4-DCP when its concentration was below
150 mg/L, whereas, the effluent 2,4-DCP, COD and toxicity levels increased when
2,4-DCP inlet concentration exceeded 150 mg/L. Also, sludge volume index (SVI)
increased when feed 2,4-DCP concentration was above 150 mg/L. Similar result
was also observed in the study of Uysal and Turkman (2005) as the effluent 2,4-
DCP increased from 2.6 to 113.7 when the feed 2,4-DCP was increased from 100 to
150 mg/L in an activated sludge unit operated at 20 days of SRT. They also
reported that addition of biosurfactant slightly increased the reactor performance as
the COD and 2,4-DCP removal efficiencies increased from 50 and 24.2% to 55.3
and 32.9%, respectively, with the addition of biosurfactant.
In another study, Kargi and Eker (2006) investigated the effect of SRT on the
performance of an activated sludge unit treating 2,4-DCP containing synthetic
wastewater. They kept influent wastewater characteristics constant, while changed
SRT between 5 and 30 days. Increase in sludge age caused significant increases in
biomass concentration in the aeration tank, which resulted in increase in percent
COD, DCP and toxicity removals. COD removal increased from 58 to 90%, while
DCP and toxicity removals increased from 15 to 100% and from 38 to 100%,
respectively, when the sludge age was raised from 5 to 30 days. They also reported
improved sludge settling characteristics at high SRT values.
Activated sludge treatment of ground water contaminated with chlorophenols at
low concentrations (4-120 µg/L) was investigated by Ettala et al. (1992). They
reported that high removal was achieved with steady dosing of chlorophenols at
high SRTs (8-10 d). According to the mass balance, 71% of chlorophenols was
34
removed and 68% was biodegraded. A chlorophenols uptake rate of 29 mg/kg
MLVSS.d was achieved.
Wang et al (2000) studied the biodegradation of 2,4,6-TCP in the presence of
primary substrate by immobilized pure cultures (Pseudomonas spp. strain 01,
Pseudomonas spp. strain 02 and Agrobacterium spp.) isolated from acclimated
mixed culture. Whether in suspended or immobilized forms, all strains have poor
removal efficiencies of 2,4,6-trichlorophenol. Addition of a substrate such as 2-CP,
3- CP, 4-chlorophenol, or 2,4-DCP did not have any benefit to the bacteria to
decompose 2,4,6-TCP. However, in the presence of phenol (200 mg/L), the
immobilized Pseudomonas spp. strain 01 can decompose 63% of 2,4,6-TCP (5
mg/L) at the end of 15-day monitoring period indicating that addition of phenol will
assist the immobilized strain in removing 2,4,6-TCP. Therefore, results showed that
high phenol concentrations (200-400 mg/L) are required to remove 2,4,6-TCP even
at a very low initial concentration, 5 mg/L. On the other hand, Vallecillo et al.
(2000) reported high 2,4,6-TCP removal efficiency even at inlet concentration of
100 mg/L when acclimated mixed culture was used.
Vallecillo et al. (2000) studied the aerobic biodegradability and toxicity of some
chlorophenolic compounds (PCP, 2,4,6-TCP, 2,4-DCP and 4-CP) in batch reactors
and the behavior of a continuous activated sludge reactor feeding with 2,4,6-TCP
and acetic acid in order to determine the feasibility of this treatment for degradation
of such recalcitrant compounds. Activated sludge treatment of 2,4,6-TCP was
studied at different CP and COD concentrations. At 1500 mg/L COD and 25 mg/L
TCP, COD removal was higher than 95% and TCP removal was 90% with an HRT
of 1.25 d. Operating with the same HRT, removal higher than 85% was reached for
TCP concentration of 100mg/L. They reported that TCP removal was dependent on
feed COD concentration, and TCP removal increased strongly when feed COD was
increased from 600 to 1000 mg/L.
35
Farrell and Quilty (1999) used a mixed microbial community, specially designed to
degrade a wide range of substituted aromatic compounds, in the degradation of
mono-chlorophenols as sole carbon source in aerobic batch cultures. The mixed
culture degraded 2-, 3-, and 4-CP (1.56 mM) via meta cleavage pathway. During
the degradation of 2- and 3-chlorophenol, 3-chlorocatechol accumulated in the
medium. Further metabolism was toxic to cells as it caused inactivation of the
catechol 2,3-dioxygenase enzyme upon –meta cleavage of 3-chlorocatechol
resulting in incomplete degradation. Inactivation of the –meta cleavage enzyme led
to an accumulation of brown colored polymers. Degradation of 4-CP by the mixed
culture led to an accumulation of CHMS, which was further metabolized, indicating
complete degradation of 4-CP by the mixed culture via a -meta cleavage pathway.
1.3.1.3. Chlorophenol Degradation in Aerobic Attached Growth Reactors
Generally stirred tank reactors or flasks as batch reactors were utilized in the
treatability studies of chlorophenolic wastes. The advantage of these reactors is that
operating and adjusting the detention time is simple. Whereas, it is vulnerable to
shock and washout and it takes a long time to recover from perturbation (Kim et al.,
2002). On the other hand, use of attached growth reactors overcome most of the
problems encountered in suspended cells bioreactors. For example, Kim et al.
(2002) reported that packed bed reactor is more effective compared to CSTR in
simultaneous degradation of 4-CP and phenol as although washout occurred in
CSTR at a dilution rate of 0.36 per hour, efficient treatment was observed in packed
bed reactor at the same dilution rate. The advantages of immobilized cell cultures
over suspended cultures are given by Shuler and Kargi (1992) as:
• Immobilization provides high cell concentrations.
• Immobilization provides cell reuse and eliminates the costly process of cell
recovery and cells recycle.
• Immobilization eliminated cell washout problems at high dilution rates
36
• The immobilization of high cell concentrations and high flow rates allows
high volumetric productivities.
• Immobilization may provide favorable environmental conditions (that is,
cell-cell contact, nutrient-product gradients, pH gradients) for cells,
resulting in better performance of the biocatalysts (for example, higher
product yields and rates).
• In some cases, immobilization improves genetic stability.
• For some cells, protection against shear damage is important.
In contrary to reported partial treatment efficiencies and deterioration in treatment
system at low temperatures when activated sludge process was used (Ettala et al.,
1992), Jarvinen et al. (1994) reported that chlorophenols could be degraded even at
low temperatures in aerobic FBR. In this study, degradation of chlorinated phenolic
compounds was investigated at different temperatures and HRTs. Concentrations of
chlorophenols in contaminated ground water were as follows: 7-11 for 2,4,6-TCP;
32-36 mg/L for 2,3,4,6-TeCP and 1.8-2.3 mg/L for PCP. Experiments were carried
out in four aerobic FBRs with different carrier materials. Temperature of reactors
was gradually decreased even to ambient temperature of ground water and results
demonstrated that fluidized bed treatment of CP-contaminated ground water
produced close to drinking water quality effluent at ambient ground water
temperature and CP loading rate as high as 740 mg CP/ L/d (HRT = 1.4 h).
Fluidized bed treatment resulted in 80% CP removal at loading rate of 2130 mg
CP/L/d and 0.44 h HRT. At the temperature below 7oC, suspended solid
concentration slightly increased but did not affect the CP degradation. This study
showed that aerobic FBR can be used to treat ground water contaminated with
chlorophenolic compounds at the ambient temperatures of ground water, thus,
avoids the heating expenses.
In another study, Puhakka and Jarvinen (1992) studied the degradation of
polychlorinated phenols in continuous-flow fluidized-bed reactors using pure
oxygen for aeration and celite carrier for cell immobilization. Chlorophenols were
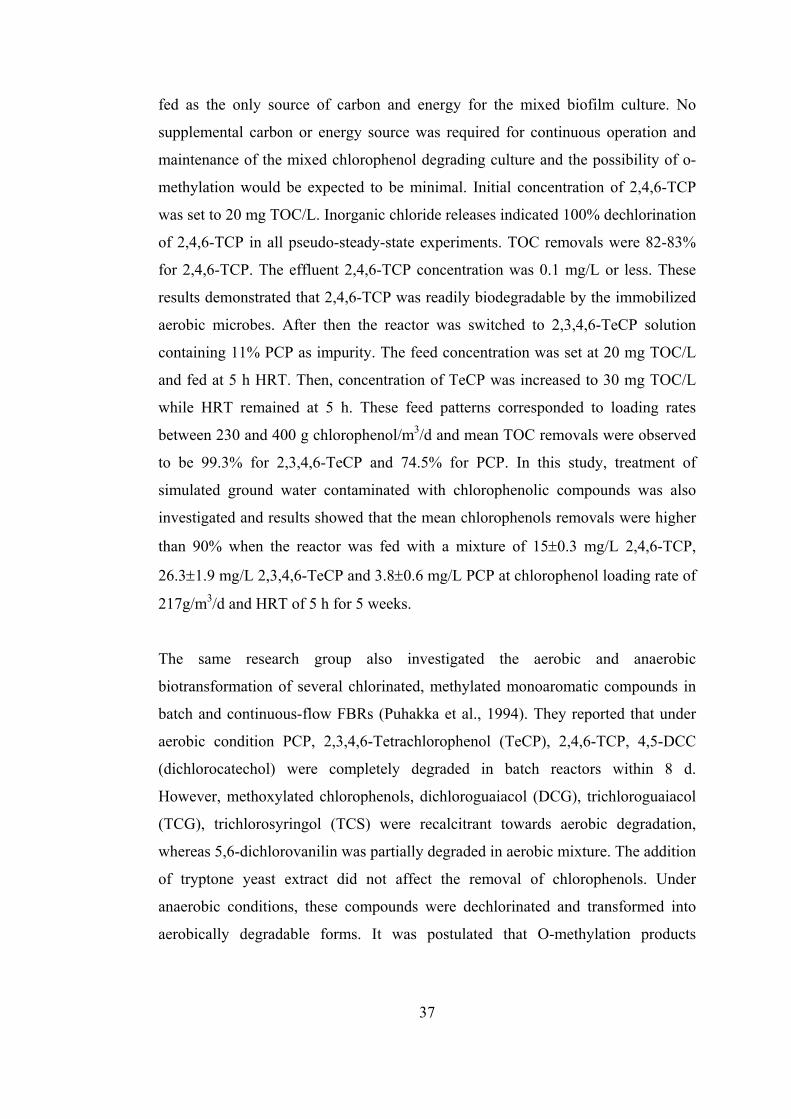
37
fed as the only source of carbon and energy for the mixed biofilm culture. No
supplemental carbon or energy source was required for continuous operation and
maintenance of the mixed chlorophenol degrading culture and the possibility of o-
methylation would be expected to be minimal. Initial concentration of 2,4,6-TCP
was set to 20 mg TOC/L. Inorganic chloride releases indicated 100% dechlorination
of 2,4,6-TCP in all pseudo-steady-state experiments. TOC removals were 82-83%
for 2,4,6-TCP. The effluent 2,4,6-TCP concentration was 0.1 mg/L or less. These
results demonstrated that 2,4,6-TCP was readily biodegradable by the immobilized
aerobic microbes. After then the reactor was switched to 2,3,4,6-TeCP solution
containing 11% PCP as impurity. The feed concentration was set at 20 mg TOC/L
and fed at 5 h HRT. Then, concentration of TeCP was increased to 30 mg TOC/L
while HRT remained at 5 h. These feed patterns corresponded to loading rates
between 230 and 400 g chlorophenol/m3/d and mean TOC removals were observed
to be 99.3% for 2,3,4,6-TeCP and 74.5% for PCP. In this study, treatment of
simulated ground water contaminated with chlorophenolic compounds was also
investigated and results showed that the mean chlorophenols removals were higher
than 90% when the reactor was fed with a mixture of 15±0.3 mg/L 2,4,6-TCP,
26.3±1.9 mg/L 2,3,4,6-TeCP and 3.8±0.6 mg/L PCP at chlorophenol loading rate of
217g/m3/d and HRT of 5 h for 5 weeks.
The same research group also investigated the aerobic and anaerobic
biotransformation of several chlorinated, methylated monoaromatic compounds in
batch and continuous-flow FBRs (Puhakka et al., 1994). They reported that under
aerobic condition PCP, 2,3,4,6-Tetrachlorophenol (TeCP), 2,4,6-TCP, 4,5-DCC
(dichlorocatechol) were completely degraded in batch reactors within 8 d.
However, methoxylated chlorophenols, dichloroguaiacol (DCG), trichloroguaiacol
(TCG), trichlorosyringol (TCS) were recalcitrant towards aerobic degradation,
whereas 5,6-dichlorovanilin was partially degraded in aerobic mixture. The addition
of tryptone yeast extract did not affect the removal of chlorophenols. Under
anaerobic conditions, these compounds were dechlorinated and transformed into
aerobically degradable forms. It was postulated that O-methylation products
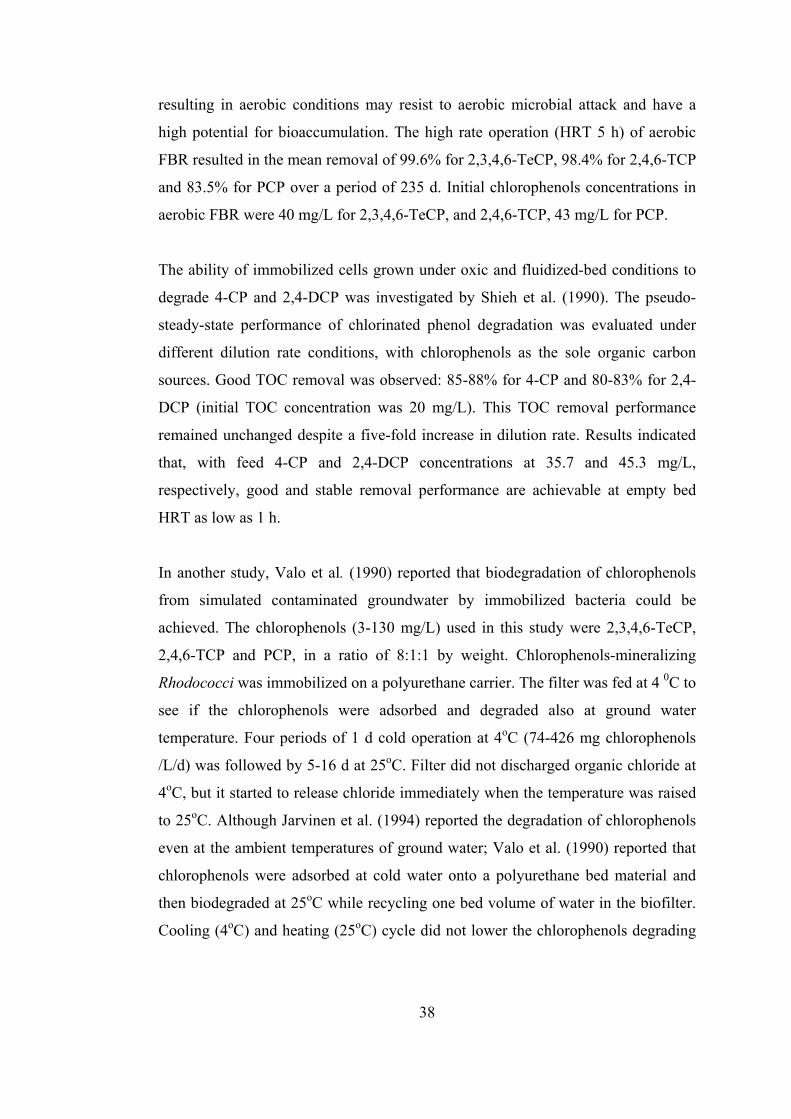
38
resulting in aerobic conditions may resist to aerobic microbial attack and have a
high potential for bioaccumulation. The high rate operation (HRT 5 h) of aerobic
FBR resulted in the mean removal of 99.6% for 2,3,4,6-TeCP, 98.4% for 2,4,6-TCP
and 83.5% for PCP over a period of 235 d. Initial chlorophenols concentrations in
aerobic FBR were 40 mg/L for 2,3,4,6-TeCP, and 2,4,6-TCP, 43 mg/L for PCP.
The ability of immobilized cells grown under oxic and fluidized-bed conditions to
degrade 4-CP and 2,4-DCP was investigated by Shieh et al. (1990). The pseudo-
steady-state performance of chlorinated phenol degradation was evaluated under
different dilution rate conditions, with chlorophenols as the sole organic carbon
sources. Good TOC removal was observed: 85-88% for 4-CP and 80-83% for 2,4-
DCP (initial TOC concentration was 20 mg/L). This TOC removal performance
remained unchanged despite a five-fold increase in dilution rate. Results indicated
that, with feed 4-CP and 2,4-DCP concentrations at 35.7 and 45.3 mg/L,
respectively, good and stable removal performance are achievable at empty bed
HRT as low as 1 h.
In another study, Valo et al. (1990) reported that biodegradation of chlorophenols
from simulated contaminated groundwater by immobilized bacteria could be
achieved. The chlorophenols (3-130 mg/L) used in this study were 2,3,4,6-TeCP,
2,4,6-TCP and PCP, in a ratio of 8:1:1 by weight. Chlorophenols-mineralizing
Rhodococci was immobilized on a polyurethane carrier. The filter was fed at 4 0C to
see if the chlorophenols were adsorbed and degraded also at ground water
temperature. Four periods of 1 d cold operation at 4oC (74-426 mg chlorophenols
/L/d) was followed by 5-16 d at 25oC. Filter did not discharged organic chloride at
4oC, but it started to release chloride immediately when the temperature was raised
to 25oC. Although Jarvinen et al. (1994) reported the degradation of chlorophenols
even at the ambient temperatures of ground water; Valo et al. (1990) reported that
chlorophenols were adsorbed at cold water onto a polyurethane bed material and
then biodegraded at 25oC while recycling one bed volume of water in the biofilter.
Cooling (4oC) and heating (25oC) cycle did not lower the chlorophenols degrading
39
activity of the polyurethane immobilized Rhodococci. Chlorophenols degradation
started as soon as the temperature was raised from 4oC to 25oC. The biofilter with
Rhodococci remained active for over 4 months. The recirculating water became
acid as a result of dechlorination at 25oC after each cold adsorption period. The
chlorophenols concentration of the column effluent was 1/1000-1/10000 of the
influent products.
For continuous-flow biofilm systems, the treatment efficiency is limited by a
minimum substrate concentration (Smin), which is required to maintain a steady-
state biofilm. Below Smin concentration, the microbial decay rate exceeds the
growth rate and the biofilm gradually disappears. Rittmann et al. (1980) and
McCarty et al. (1981) proposed feeding a primary substrate at a concentration
above Smin to support simultaneous xenobiotic compound (secondary substrate)
utilization at sub-Smin concentrations. Problems with this approach include finding a
primary substrate that supports simultaneous degradation of secondary substrates.
This approach was unsuccessful for stimulating biodegradation of trace
concentrations of PCP when acetate was the primary substrate (Speitel et al. 1989);
low concentrations of 2,4-DCP also did not stimulate PCP degradation. Another
approach involves the use of oligotrophic enrichment cultures able to utilize the
contaminant as the sole source of carbon and energy. Oligotrophic bacteria grow at
low substrate concentrations and are characterized by high substrate affinity (low
KS coefficient) and low Smin (Kobayashi and Rittmann 1982; Rittmann et al. 1986).
With oligotrophic xenobiotic-degrading cultures it may, therefore, be possible to
achieve low effluent concentrations without the use of additional substrates (Melin
et al., 1997). In this context, Melin et al. (1997) used a fluidized-bed reactor to
enrich an aerobic chlorophenol-degrading microbial culture. Long-term continuous
flow operation with low effluent concentrations selected oligotrophic
microorganisms producing good-quality effluent for PCP contaminated water. The
results of the study showed that the culture has a high affinity for PCP but is also
inhibited by relatively low PCP concentrations (above 1.1 mg/L PCP). This
enrichment culture was maintained over 1 year of continuous-flow operation with
40
PCP as the sole source of carbon and energy. During continuous-flow operation,
effluent concentrations below 2 µg/L were achieved at 268 min HRT when feed
PCP concentration was 2.5 mg/L.
Zilouei et al.(2004) evaluated bioremediation of chlorophenols at low temperature
in a packed bed bioreactor. Packed-bed reactor was tested at various HRTs at 14ºC
and 23ºC for the treatment of a mixture of 2-CP, 4-CP, 2,4-DCP and 2,4,6-TCP as
sole sources of carbon and energy source. A total chlorophenol removal efficiency
of more than 95% was recorded at both temperatures at 3.9 hours HRT,
corresponding to a total chlorophenol removal rate of more than 535 mg/L.d. The
inlet pollutant concentration was then increased to reach an organic load of 60.4 mg
chlorophenol/L.h at 2.5 hours HRT. Under this condition, total chlorophenol
removal rates of 1230 and 1160 mg/L.d were achieved in the control and cold
reactors, respectively. Under conditions when chlorophenols were not completely
removed, the pollutants were biodegraded in the following order of increasing rates:
TCP = DCP > 4CP > 2CP, which is the inverse of most results reported in
literature.
1.3.1.3.1. Rotating Biological Contactors (RBCs)
Rotating biological contactors (RBCs) were first installed in West Germany in 1960
and were later introduced in United States. In the United States and Canada, 70% of
the RBC systems installed are used for carbonaceous BOD removal only, 25% for
combined carbonaceous BOD removal and nitrification, and 5% for nitrification of
secondary effluent. A rotating biological contactor consists of a series of closely
spaced circular discs. The disks are submerged in wastewater and rotated slowly
through it (Figure 1.3).
In operation, biological growths become attached to the surfaces of the disks and
eventually form a slime layer over the entire wetted surface area of the disks. The
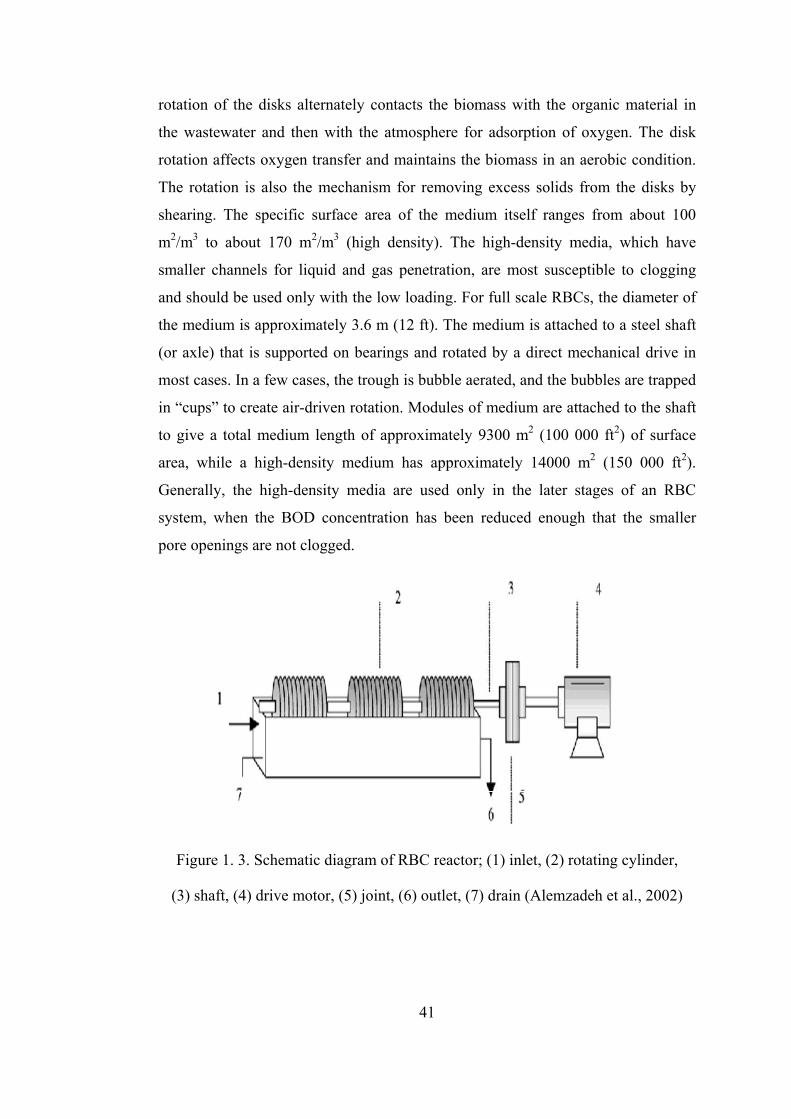
41
rotation of the disks alternately contacts the biomass with the organic material in
the wastewater and then with the atmosphere for adsorption of oxygen. The disk
rotation affects oxygen transfer and maintains the biomass in an aerobic condition.
The rotation is also the mechanism for removing excess solids from the disks by
shearing. The specific surface area of the medium itself ranges from about 100
m2/m3 to about 170 m2/m3 (high density). The high-density media, which have
smaller channels for liquid and gas penetration, are most susceptible to clogging
and should be used only with the low loading. For full scale RBCs, the diameter of
the medium is approximately 3.6 m (12 ft). The medium is attached to a steel shaft
(or axle) that is supported on bearings and rotated by a direct mechanical drive in
most cases. In a few cases, the trough is bubble aerated, and the bubbles are trapped
in “cups” to create air-driven rotation. Modules of medium are attached to the shaft
to give a total medium length of approximately 9300 m2 (100 000 ft2) of surface
area, while a high-density medium has approximately 14000 m2 (150 000 ft2).
Generally, the high-density media are used only in the later stages of an RBC
system, when the BOD concentration has been reduced enough that the smaller
pore openings are not clogged.
Figure 1. 3. Schematic diagram of RBC reactor; (1) inlet, (2) rotating cylinder,
(3) shaft, (4) drive motor, (5) joint, (6) outlet, (7) drain (Alemzadeh et al., 2002)
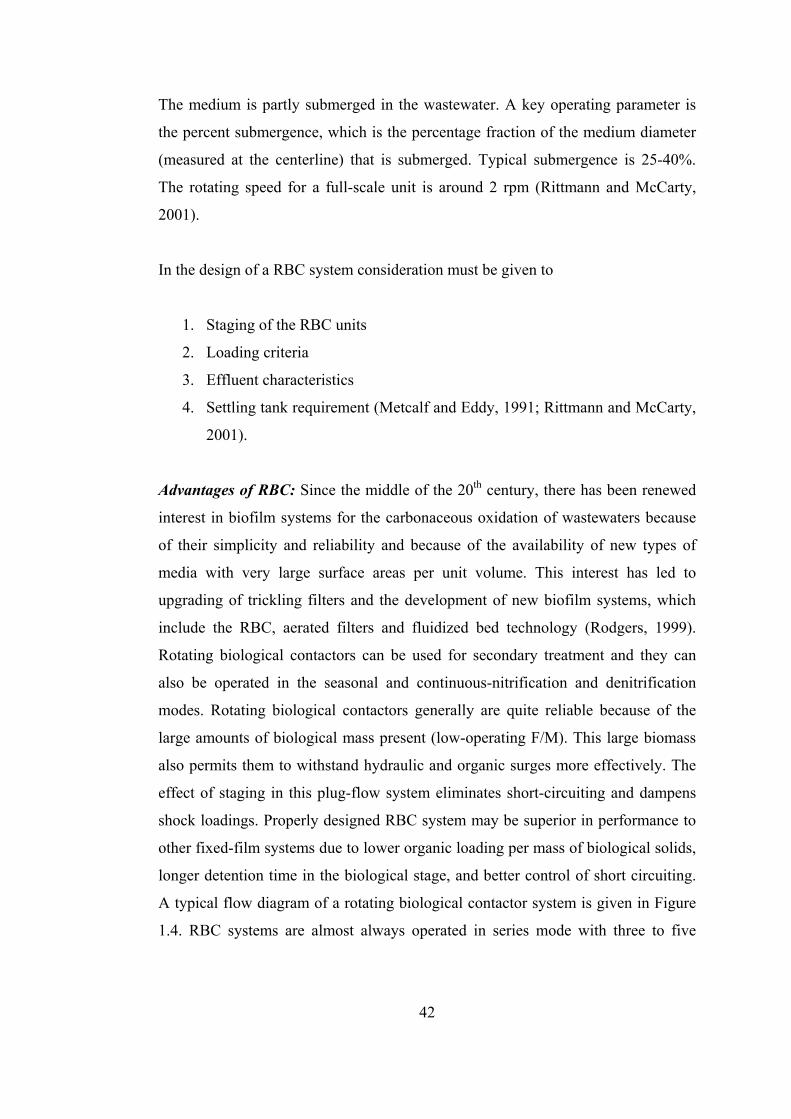
42
The medium is partly submerged in the wastewater. A key operating parameter is
the percent submergence, which is the percentage fraction of the medium diameter
(measured at the centerline) that is submerged. Typical submergence is 25-40%.
The rotating speed for a full-scale unit is around 2 rpm (Rittmann and McCarty,
2001).
In the design of a RBC system consideration must be given to
1. Staging of the RBC units
2. Loading criteria
3. Effluent characteristics
4. Settling tank requirement (Metcalf and Eddy, 1991; Rittmann and McCarty,
2001).
Advantages of RBC: Since the middle of the 20th century, there has been renewed
interest in biofilm systems for the carbonaceous oxidation of wastewaters because
of their simplicity and reliability and because of the availability of new types of
media with very large surface areas per unit volume. This interest has led to
upgrading of trickling filters and the development of new biofilm systems, which
include the RBC, aerated filters and fluidized bed technology (Rodgers, 1999).
Rotating biological contactors can be used for secondary treatment and they can
also be operated in the seasonal and continuous-nitrification and denitrification
modes. Rotating biological contactors generally are quite reliable because of the
large amounts of biological mass present (low-operating F/M). This large biomass
also permits them to withstand hydraulic and organic surges more effectively. The
effect of staging in this plug-flow system eliminates short-circuiting and dampens
shock loadings. Properly designed RBC system may be superior in performance to
other fixed-film systems due to lower organic loading per mass of biological solids,
longer detention time in the biological stage, and better control of short circuiting.
A typical flow diagram of a rotating biological contactor system is given in Figure
1.4. RBC systems are almost always operated in series mode with three to five
43
stages. A settler follows to reduce effluent suspended solids. Control of the
environmental conditions and the biofilm thickness is easier in RBCs since the
liquid phase is more homogeneous and biofilm is visible and reachable during the
operation as compared to biological filters. Moreover, aeration is much more
effective in RBC as a result of direct contact of biofilm and air during rotation
(Kargı and Eker, 2002).
RBC system can be designed to provide secondary or advanced levels of treatment.
Effluent BOD5 characteristics for secondary treatment are comparable to well-
operated activated-sludge process. Where a nitrified effluent is required, RBCs can
be used to provide combined treatment for BOD and ammonia nitrogen or to
provide separate nitrification of secondary effluent (Metcalf and Eddy, 1991;
Rittmann and McCarty, 2001).
Figure 1.4. Typical RBC schematic for secondary treatment
Disadvantages of RBC: Many of the early RBC units had operating problems
consisting of:
1. Shaft and Bearing Failure: Early designs are insufficient in the structural
strength, because the designers did not realize that the accumulation of
Primary clarifier
Raw wastewater
sludge
baffle
Drive motor sludge
Secondary clarifier
Effluent
44
biofilm greatly increased the weight of media. Therefore, the shafts cracked,
the bearings wore out and media ripped off the shaft. The components are
now designed to accommodate the added weight of the biofilm.
2. Eccentric Growth: If the RBC stopped its rotation, the submerged portion
would continue to have growth, while the exposed portion would stop
growth. Then, the eccentric weight distribution required too much torque to
restart the rotation. Higher capacity motors and derives are used to
overcome this problem.
3. Nuisance organisms: Sulfate reducing bacteria fostered by too high loads
and insufficient aeration, caused odors, heavy precipitates (S0, FeS),
filamentous growth, and other serious nuisances. Appropriate first-stage and
overall surface loads, as well as the tip-velocity criterion, generally prevent
nuisance organisms (Rittmann and McCarty, 2001).
In the literature, there are very few studies on chlorophenol treatment using RBC
despite the advantages listed above. Tokuz (1991) used RBC for studying the
biodegradation of phenolic compounds and reported that the phenolic compounds
are biodegradable and RBC is a viable process in treating phenolic wastewaters.
Radwan et al. (1997) achieved the treatment of 2,4-DCP up to a concentration of
200 mg/L in the presence of glucose as primary substrate using a modified RBC.
Although, in most of the studies related to the biological treatment of
chlorophenols, presence of phenol (Wang and Loh, 1999 and 2000; Wang et al.,
2000; Hill et al., 1996; Lu et al., 1996; Kim and Hao, 1999; Hao et al., 2002) or
another non-toxic carbon source (Wang and Loh, 1999; Bali and Sengül, 2002,
Tarighian et al., 2003) is reported to be necessary in suspended culture reactors,
Swaminathan and Ramanujam (1999) reported that acclimated mixed culture has
the ability to use 2,4-DCP as a sole carbon source in RBC. They adapted mixed
culture to 2,4-DCP, of which concentration was increased gradually, in the presence
of glucose, then glucose concentration was decreased gradually and 2,4-DCP was
fed to the reactor as a sole carbon source. Under these conditions, they reported a
remarkably high efficiency (99.2-99.5%) of RBC in the treatment of 2,4-DCP up to
45
253.4 mg/L. Although complete removal of 2,4-DCP as a sole carbon and energy
source was reported in this reactor, there is no enough information whether absence
of primary substrate have an adverse effect on the degradation rate of 2,4-DCP.
Moreover, in the study, there is no information on the fate of some intermediates
coming out from the biological degradation of 2,4-DCP. Also, the ability of the
system for other types of chlorophenols and for chlorophenol mixtures should be
investigated further because substrate interactions are crucial for understanding and
predicting the behavior of chlorophenols in biological treatment systems due to the
great variation of industrial effluents in terms of both composition and
concentration.
1.3.2. Modeling SOCs Degradation
Knowledge of microbial growth and substrate utilization kinetics is important for
the accurate prediction of effluent quality from engineered treatment processes
(Ellis et al., 1996a, 1996b; Ellis and Anselm 1999; Grady et al., 1996). Accurate
kinetic parameters also help to operation engineers to optimize operational
conditions to meet discharge requirements (Ellis and Anselm, 1999).
There is considerable variability in the literature concerning the values of the
kinetic parameters for growth and substrate removal associated with any given
compound, even with pure cultures. While there are doubtless many reasons for that
variability, three appear to be particularly important: culture history, parameter
identifiability, and the nature of the assay procedure employed to measure the
parameters. The history of the culture is important for a variety of reasons. First,
with mixed cultures, the manner in which the culture has been developed
determines which species are present. Second, even with a pure culture, the way in
which a culture has been grown often determines the nature of the enzyme systems
that are expressed. Third, culture history also determines physiological state, which
is the sum total of a cell's macromolecular composition and determines how rapidly
46
it can synthesize enzymes, as well as how rapidly those enzymes react (Grady et al.,
1996).
Culture history (the type of environmental conditions imposed and the duration of
their imposition) has been suggested as a major factor contributing to measured
differences in kinetic parameters describing biodegradation. Continued cultivation
of a mixed culture will result in selection for some members of the community over
others, as determined by their growth kinetics. As the community make-up changes,
the kinetic parameters describing it will be affected. Classical chemostat theory, for
example, dictates that in a continuous flow, completely mixed environment,
organisms with higher affinity enzymes are favored and will displace organisms
with lower affinity enzymes. In batch assays, the chosen value of SolXo is also
important, however, because of its impact on the influence of culture history. If
So/Xo is very large, significant changes can occur in the culture during the assay,
resulting in parameters that are not reflective of the culture as it existed in the
environment from which it was removed. Conversely, if So/Xo is very small, it is
possible for the parameters to be representative of the kinetics manifested in the
source environment. One way in which the value of So/Xo can alter the culture
history is through its effect on the composition of the microbial community, and
this is the mechanism focused on most commonly in the environmental engineering
literature. The meaning of the kinetics observed with a large So/Xo value is clear.
They represent the maximum capability of the members of the microbial
community with the fastest growth kinetics. Such kinetics may shed light on the
ultimate reactor performance under different conditions, e.g. at a lower solids
retention time. Similarly, the meaning of the kinetics observed with a small So/Xo
value is also clear. They represent the capability that the culture had when it was in
the continuous culture reactor from which it was obtained (Grady et al., 1996).
Grady et al. (1996) suggested that the term "intrinsic" be used to denote kinetic
parameters measured with high So/Xo values (>20 on COD basis). The rationale
behind the use of the term intrinsic is its definition of "belonging to the essential
47
nature of a thing". If the kinetics truly reflects unrestricted growth they are
representative only of the nature of the organisms and the substrate. They suggest
the term "extant" be used to denote kinetic parameters measured with very low
So/Xo values (<0.025 on COD basis). The rationale for use of this term is its
definition of "currently existing".
Another significant point is that not all the microorganisms are responsible for the
degradation of all individual substrates in a multi component feed. The fraction of
biomass utilizing biogenic compounds is expected to higher compared to the
fraction of those utilizing SOCs. In the kinetic studies, the concentration of biomass
actually degrading the SOC of interest should be considered rather than total
biomass as degradation of SOCs require unique pathways and not all bacteria in the
community is responsible for the degradation of SOC of interest. Therefore, the
question of how component biomass fraction can be calculated will arise at this
point. Some researchers used the fraction of COD contributed to the feed by that
compound in the calculation of competent biomass fraction based on the
assumption that if specialists are responsible for degradation of a particular
compound, the specialists grows only on SOC of interest (Magbanua et al., 1998;
Hu et al. (2005b), Hu et al., 2005a; Ellis et al., 1996; Tomei et al., 2003).
The bacterial specific growth rate is often described using Monod kinetics.
However, higher substrate concentrations may become inhibitory to microbial
growth, which is called self-inhibition. For example, phenol at sufficiently high
concentrations has been observed to exhibit an inhibitory effect on pure microbial
cultures and activated sludge systems. Most of the equations have been adopted
from models of the substrate inhibition of enzymatic reactions, and involve a
common substrate inhibition term (KI). The Andrews equation (Andrews, 1968) is
one of the most commonly used models for describing the growth inhibition
kinetics:
)/( 2max
Is KSSKS
++=
µµ (1.1)
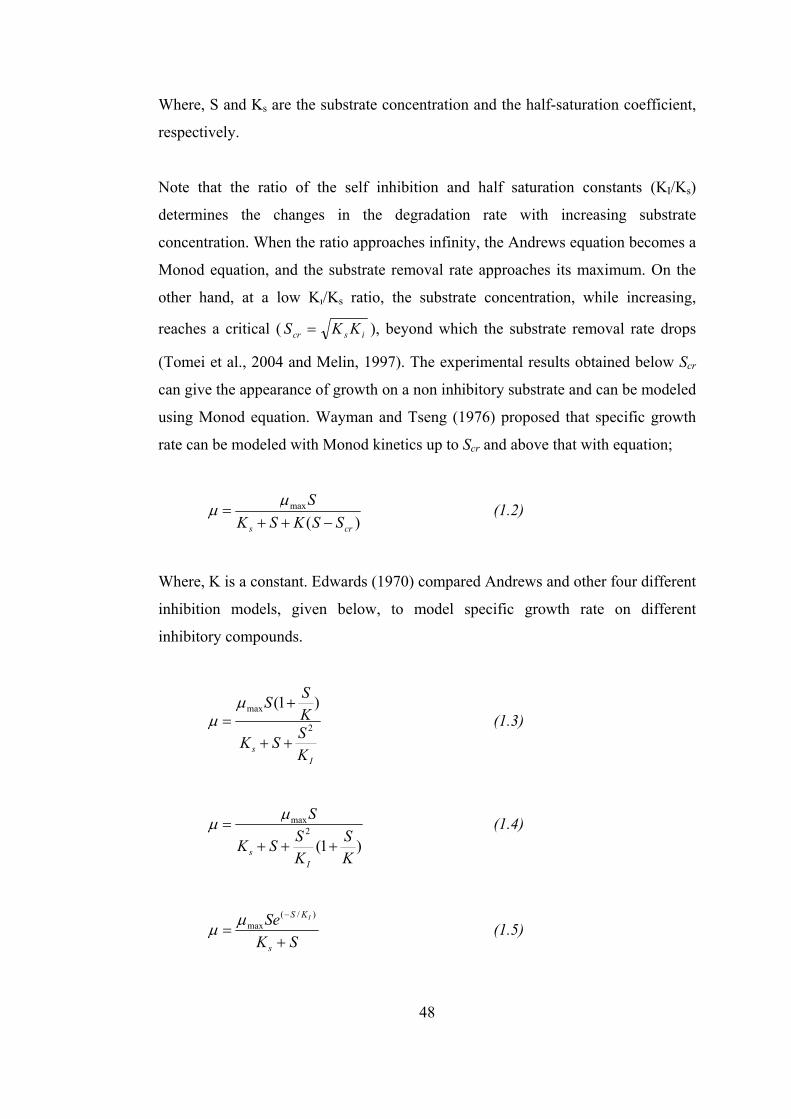
48
Where, S and Ks are the substrate concentration and the half-saturation coefficient,
respectively.
Note that the ratio of the self inhibition and half saturation constants (KI/Ks)
determines the changes in the degradation rate with increasing substrate
concentration. When the ratio approaches infinity, the Andrews equation becomes a
Monod equation, and the substrate removal rate approaches its maximum. On the
other hand, at a low Kı/Ks ratio, the substrate concentration, while increasing,
reaches a critical ( iscr KKS = ), beyond which the substrate removal rate drops
(Tomei et al., 2004 and Melin, 1997). The experimental results obtained below Scr
can give the appearance of growth on a non inhibitory substrate and can be modeled
using Monod equation. Wayman and Tseng (1976) proposed that specific growth
rate can be modeled with Monod kinetics up to Scr and above that with equation;
)(max
crs SSKSKS−++
=µµ (1.2)
Where, K is a constant. Edwards (1970) compared Andrews and other four different
inhibition models, given below, to model specific growth rate on different
inhibitory compounds.
Is K
SSK
KSS
2
max )1(
++
+=µ
µ (1.3)
)1(2
max
KS
KSSK
S
Is +++
=µµ (1.4)
SKSe
s
KS I
+=
− )/(maxµµ (1.5)
49
[ ])/()/(max
sI KSKS ee −− −= µµ (1.6)
The superiority of the models varied for different experimental results and only
equation 1.4 did not give the best fit in any case. Edward (1970) concluded that the
Andrews equation is the easiest to manipulate among the equations tested and the
Andrews is the best choice among the five equations tested. However, significant
case-to-case variations can be observed (Melin, 1997). For example; Sokol and
Howel (1981) reported that phenol degradation kinetics by Pseudomonas putida
was better described by a two parameter model (Equation 1.7) than Andrews
model.
22
2max
SKSK
SKKSK I
I
I
+=
+=µµ (1.7)
The presence of other organic or inorganic compounds may have inhibitory effect
on the degradation of compound of interest and both substrates may compete for the
same enzyme. So, the second type of inhibition is competitive, and a separate
inhibitor is present at concentration I. The competitive inhibitor binds the catalytic
site of the degradative enzyme, thereby excluding substrate binding. The only
parameter affected by I in competitive inhibition is half saturation constant (Ks) in
Monod equation:
+=
Ieff K
IKK 1 (1.8)
Where, KI = an inhibition concentration of the competitive inhibitor. A small value
of KI indicates a strong inhibitor. The rate reduction caused by competitive inhibitor
can be completely offset if S is large enough. Competitive inhibitors usually are
substrate analogues.
50
A third type inhibition is noncompetitive inhibition by a separate inhibitor. A
noncompetitive inhibitor binds with degradative enzyme at a site different from the
reaction site, altering the enzyme conformation in such a manner that substrate
utilization is slowed. The only parameter affected is qeff:
+
=I
eff KIqq/1
(1.9)
In the presence of a noncompetitive inhibitor, high S cannot overcome the
inhibitory effects, since the maximum utilization rate is lowered for all S. This
phenomenon is sometimes called allosteric inhibition, and allosteric inhibition need
not have any structural similarity to the substrate.
In some cases, competitive and noncompetitive impacts occur together. This
situation is termed uncompetitive inhibition. Effective parameters (qeff and Keff)
vary as they do for the individual cases.
Mixed inhibition is a more general form of uncompetitive inhibition in which the KI
can have different values (Rittman and McCarty, 2001).
As it can be understood from inhibition models, in the presence of different toxic
compounds, the system may be affected in different ways and a modification of
Monod kinetic in the presence of toxic compound is necessary to model the system
accurately and get biokinetic parameters, which are necessary to design a
remediation process. Regarding this, although there are several kinetic studies on
the cometabolic treatment of chlorinated phenols (Hao et al., 2002; Hill et al., 1996;
Kim and Hao, 1999; Wang et al., 2003; Saez and Rittmann, 1993), little kinetic
studies are available on chlorophenol degradation, especially when they are present
in mixture, by mixed cultures.
51
CHAPTER 2
MATERIALS AND METHODS
In this chapter, chemicals, inocula, experimental set-ups and analytical methods are
described.
2.1. Chemicals
Chlorophenols (4-CP and 2,4-DCP), the chemicals used for growth medium and
methanol used for HPLC analysis were obtained from Merck Chemical Co.,
Germany. COD kits were obtained from Hach Co.,USA. API 20 NE identification
kits were obtained from Biomerieux Co., France.
2.2. Cultures and Medium
The composition of the synthetic wastewater is given in Table 2.1. In order to
adjust desired chlorophenol concentrations in the synthetic wastewater, two
different stock solutions were used. The first one was 16,000 mg/L 4-CP dissolved
in 0.02 N NaOH, the second one was the mixture of 16,000 mg/L 4-CP and 8,000
mg/L 2,4-DCP dissolved in 0.02 N NaOH. Peptone was utilized as biogenic carbon
and nitrogen sources (N content is around 12%). For the experiments in which
peptone concentration was low to supply enough N, NH4CI was supplied as N
source not to create sub-optimal environmental conditions and the COD/N content
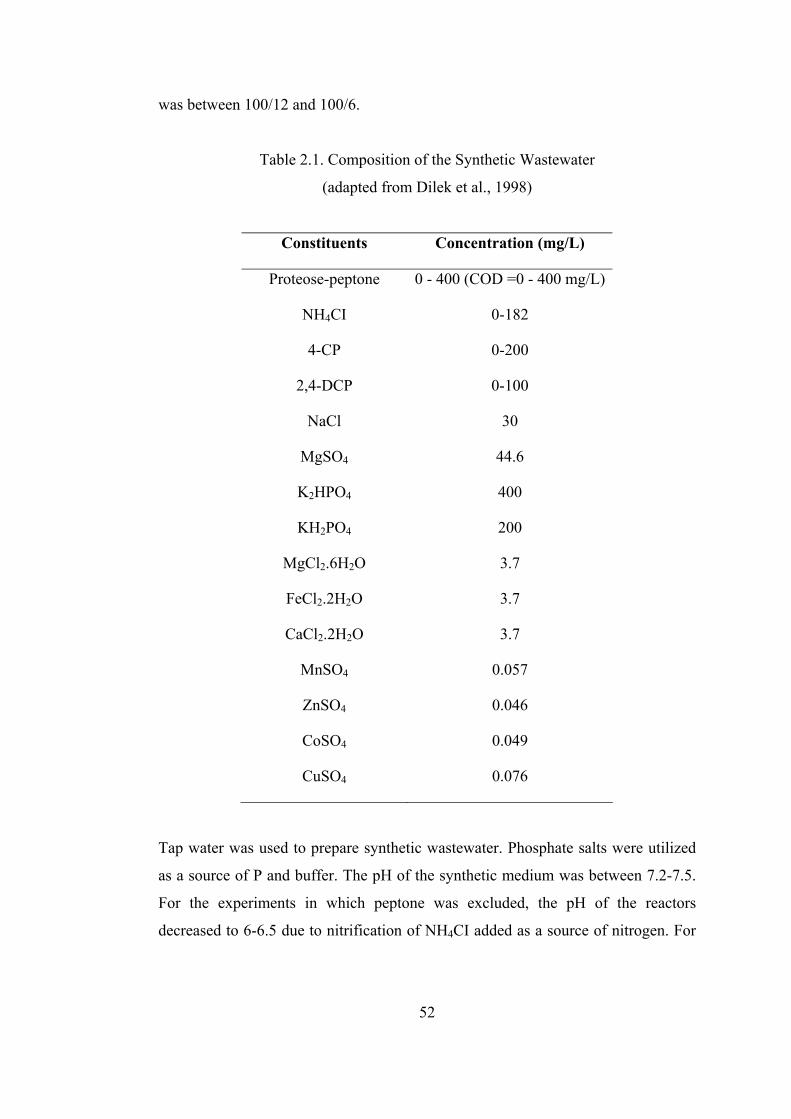
52
was between 100/12 and 100/6.
Table 2.1. Composition of the Synthetic Wastewater
(adapted from Dilek et al., 1998)
Constituents Concentration (mg/L)
Proteose-peptone 0 - 400 (COD =0 - 400 mg/L)
NH4CI 0-182
4-CP 0-200
2,4-DCP 0-100
NaCl 30
MgSO4 44.6
K2HPO4 400
KH2PO4 200
MgCl2.6H2O 3.7
FeCl2.2H2O 3.7
CaCl2.2H2O 3.7
MnSO4 0.057
ZnSO4 0.046
CoSO4 0.049
CuSO4 0.076
Tap water was used to prepare synthetic wastewater. Phosphate salts were utilized
as a source of P and buffer. The pH of the synthetic medium was between 7.2-7.5.
For the experiments in which peptone was excluded, the pH of the reactors
decreased to 6-6.5 due to nitrification of NH4CI added as a source of nitrogen. For
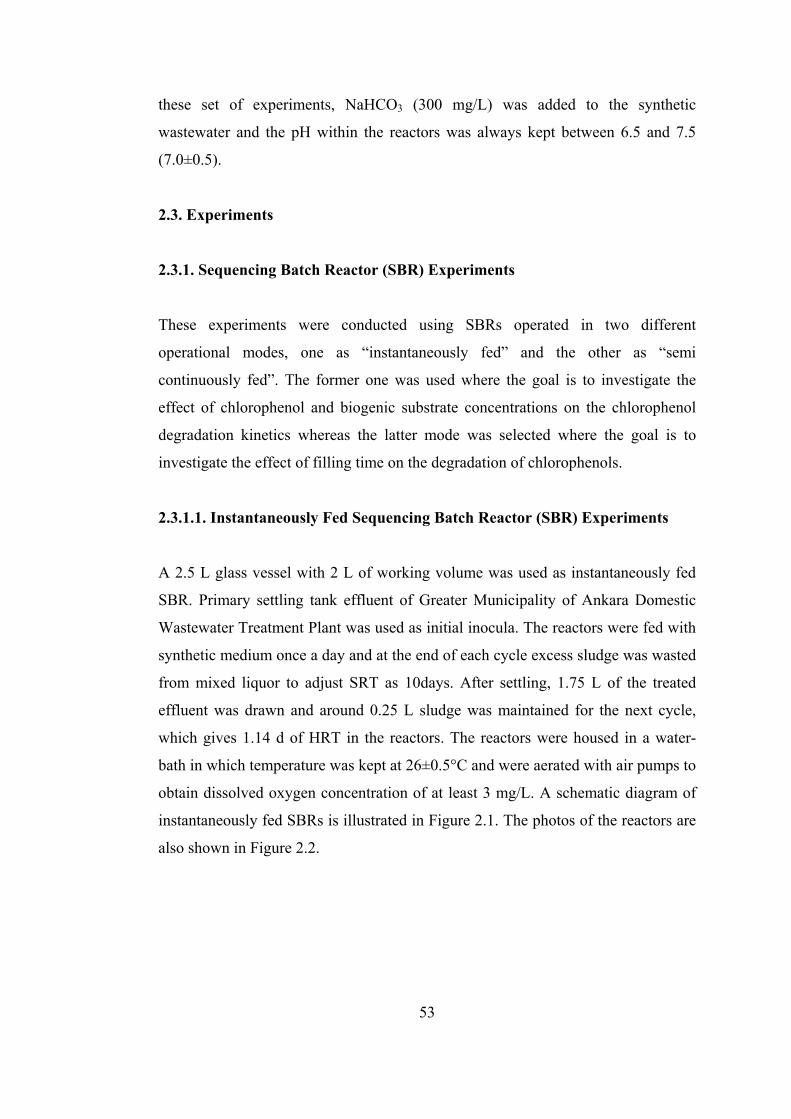
53
these set of experiments, NaHCO3 (300 mg/L) was added to the synthetic
wastewater and the pH within the reactors was always kept between 6.5 and 7.5
(7.0±0.5).
2.3. Experiments
2.3.1. Sequencing Batch Reactor (SBR) Experiments
These experiments were conducted using SBRs operated in two different
operational modes, one as “instantaneously fed” and the other as “semi
continuously fed”. The former one was used where the goal is to investigate the
effect of chlorophenol and biogenic substrate concentrations on the chlorophenol
degradation kinetics whereas the latter mode was selected where the goal is to
investigate the effect of filling time on the degradation of chlorophenols.
2.3.1.1. Instantaneously Fed Sequencing Batch Reactor (SBR) Experiments
A 2.5 L glass vessel with 2 L of working volume was used as instantaneously fed
SBR. Primary settling tank effluent of Greater Municipality of Ankara Domestic
Wastewater Treatment Plant was used as initial inocula. The reactors were fed with
synthetic medium once a day and at the end of each cycle excess sludge was wasted
from mixed liquor to adjust SRT as 10days. After settling, 1.75 L of the treated
effluent was drawn and around 0.25 L sludge was maintained for the next cycle,
which gives 1.14 d of HRT in the reactors. The reactors were housed in a water-
bath in which temperature was kept at 26±0.5°C and were aerated with air pumps to
obtain dissolved oxygen concentration of at least 3 mg/L. A schematic diagram of
instantaneously fed SBRs is illustrated in Figure 2.1. The photos of the reactors are
also shown in Figure 2.2.
54
Figure 2. 1. A schematic diagram of instantaneously fed SBRs
Two reactors operated in parallel were fed with 4-CP only (FED4), whereas, the
other two reactors were fed with mixture of 4-CP and 2,4-DCP (FEDM). Also, one
reactor (base-line) was operated in the absence of chlorophenols in order to
investigate the effect of chlorophenols addition on the reactor performance.
The feed 2,4-DCP concentrations in FEDM were always kept at one half of 4-CP
concentrations as our previous study showed that 2,4-DCP was two times more
toxic on biomass growth compared to 4-CP (Sahinkaya and Dilek, 2002).
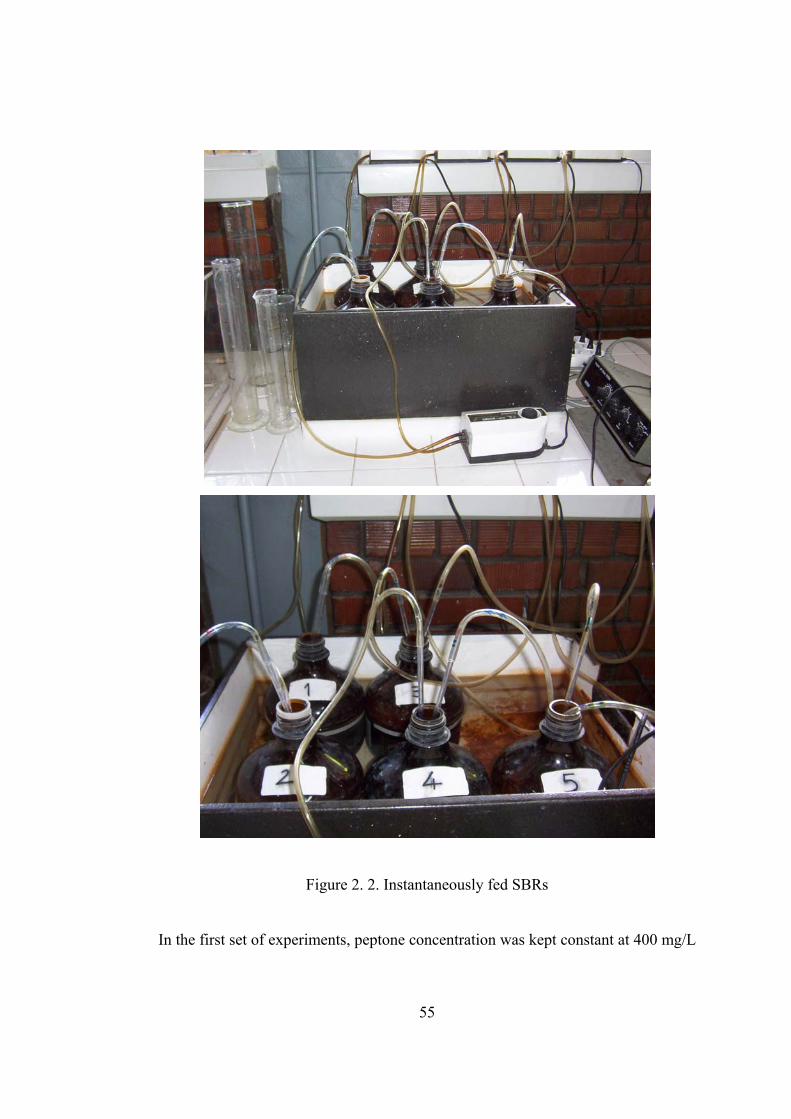
55
Figure 2. 2. Instantaneously fed SBRs
In the first set of experiments, peptone concentration was kept constant at 400 mg/L
56
and chlorophenol concentrations were gradually increased up to 200 mg/L 4-CP
and 100 mg/L 2,4-DCP, which lasted around 5 months (Figure 3.1). The pH of the
synthetic wastewater was 7.2-7.5 and it was 6.5-6.8 (depending on chlorophenol
concentration) at the end of one-day cycle. The decrease was due to production of
HCI as a result of chlorophenols degradation. When the pre-determined
concentrations of chlorophenols were reached, the reactors were allowed three
SRTs to reach steady state conditions, which was also checked measuring the COD
and mixed liquor volatile suspended solids (MLVSS) concentrations at the end of
three successive cycles. After observation of steady state-conditions, the reactors
were sampled for the determination of chlorophenols, COD, 5-chloro-2-
hydroxymuconic semialdehyde (CHMS) and MLVSS at different time intervals.
Also, in order to evaluate the degree of removal via adsorption, 4-CP and 2,4-DCP
on biomass were extracted using 0.1 N NaOH following the centrifugation of
sludge drawn from the reactors at the end of the cycle. Adsorption of 4-CP and 2,4-
DCP on biomass were not detected throughout the reactors operation.
In the second set of experiments, the effect of biogenic substrate concentration on
chlorophenol degradation kinetics was investigated. For that purpose, feed 4-CP
and 2,4-DCP concentrations were kept constant at 200 and 100 mg/L, respectively,
whereas, the feed peptone concentration was gradually decreased from 400 to 0
mg/L. When the pre-determined concentration of peptone was reached, reactors
were allowed three SRTs to reach steady state condition, which was also checked
measuring the COD and MLVSS concentrations at the end of three successive
cycles. After observation of steady state-conditions, samples were drawn from the
reactors for the determination of chlorophenols, COD, CHMS and MLVSS at
different time intervals. As peptone concentration was decreased in the feed
solution, the excluded amount of N was supplemented with increased concentration
of NH4CI not allow the culture to be N limited. When peptone was 100 mg/L,
nitrification of NH4CI at an elevated concentration led to the formation of H+ ion in
high enough concentration to decrease the pH value to around 6 at the end of the
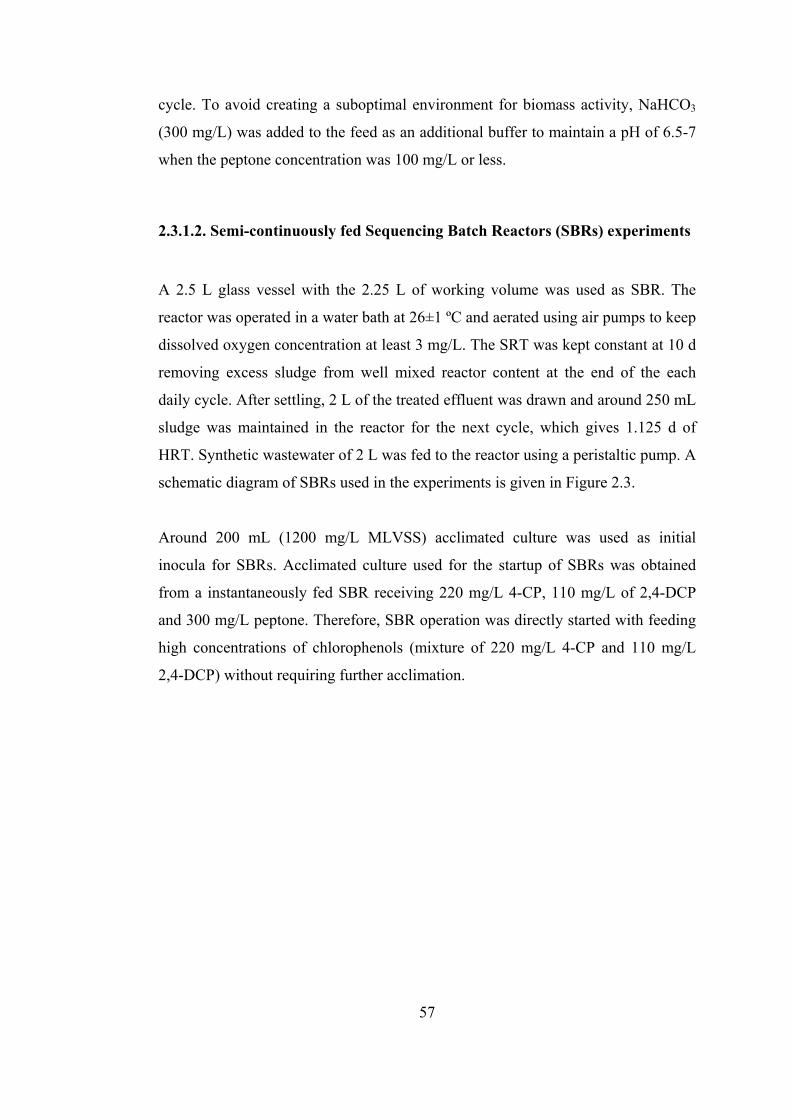
57
cycle. To avoid creating a suboptimal environment for biomass activity, NaHCO3
(300 mg/L) was added to the feed as an additional buffer to maintain a pH of 6.5-7
when the peptone concentration was 100 mg/L or less.
2.3.1.2. Semi-continuously fed Sequencing Batch Reactors (SBRs) experiments
A 2.5 L glass vessel with the 2.25 L of working volume was used as SBR. The
reactor was operated in a water bath at 26±1 ºC and aerated using air pumps to keep
dissolved oxygen concentration at least 3 mg/L. The SRT was kept constant at 10 d
removing excess sludge from well mixed reactor content at the end of the each
daily cycle. After settling, 2 L of the treated effluent was drawn and around 250 mL
sludge was maintained in the reactor for the next cycle, which gives 1.125 d of
HRT. Synthetic wastewater of 2 L was fed to the reactor using a peristaltic pump. A
schematic diagram of SBRs used in the experiments is given in Figure 2.3.
Around 200 mL (1200 mg/L MLVSS) acclimated culture was used as initial
inocula for SBRs. Acclimated culture used for the startup of SBRs was obtained
from a instantaneously fed SBR receiving 220 mg/L 4-CP, 110 mg/L of 2,4-DCP
and 300 mg/L peptone. Therefore, SBR operation was directly started with feeding
high concentrations of chlorophenols (mixture of 220 mg/L 4-CP and 110 mg/L
2,4-DCP) without requiring further acclimation.
58
Figure 2. 3. A schematic Diagram of SBRs
Two sets of experiments were conducted with SBRs. In the first set of experiments,
feed peptone (300 mg/L), 4-CP (220 mg/L) and 2,4-DCP (110 mg/L)
concentrations were kept constant, while filling time was changed in order to
determine the effect of it on the reactor performance. Each SBR cycle lasted one
day consisted of fill (or feeding) (0-8 h), reaction (22-14 h) and settle-draw periods
(2 h). The reactor was aerated in both fill and reaction periods.
The feed pH decreased from 7.0±0.2 to around 6.5±0.2 due to HCI formation
during chlorophenol degradation and nitrification of NH4CI. Though the pH
dropped considerably, it was not low enough to adversely affect biomass activity
and hence we did not adjust it.
During the experiments, samples were drawn from the reactors at predetermined
time intervals and analyzed immediately for COD, chlorophenols and CHMS.
MLVSS concentrations at the end of the cycles were also determined. Experiments
were conducted when reactor reached steady-state conditions (three SRTs were
allowed), which were also checked measuring the MLVSS and COD concentrations
at the end of at least three successive cycles. Experiments were also run to
59
determine parametric variations during one cycle over two or three successive days.
No significant variation occurred.
Following the centrifugation of the sludge from the reactors, 4-CP and 2,4-DCP on
biomass were extracted using 0.1 N NaOH to evaluate the degree of removal via
adsorption, which was not detected (detection limit of chlorophenols was 0.05
mg/L).
In the second set of experiments, the filling time was kept constant at 8 h
throughout the experiments. In order to understand the effect of biogenic substrate
concentration on the performance of the reactor, peptone concentration was
gradually decreased from its initial value of 300 mg/L to 0 mg/L, while the
chlorophenol concentrations were kept constant at 220 and 110 mg/l for 4-CP and
2,4-DCP, respectively. After any change in reactor operation, three SRTs were
allowed to reach steady state conditions, which were also checked measuring
MLVSS and COD concentrations at the end of at least three successive cycles.
After ensuring the steady-state conditions, samples were drawn from the reactors at
predetermined time intervals and analyzed immediately for COD, chlorophenols
and CHMS. MLVSS concentrations at the end of the cycles were also determined.
In order to avoid creation of suboptimal environment for biomass activity, NaHCO3
(300 mg/L) was added to the feed as an extra source of buffer to keep pH between
6.5 and 7 when peptone concentration was 100 mg/L or less.
2.3.2. Batch Experiments
Batch experiments were conducted in 500 mL erlenmeyer flasks stoppered with
cotton plugs. The working liquid volume was 250 mL. All experiments were run in
an orbital shaking incubator set at 200 rpm and 26±1°C. Biomass samples taken
from FEDM and FED4 were washed two times with distilled water in order to
remove organics adsorbed on biomass. Then, cultures were resuspended in distilled
60
water and parallel batch reactors were seeded to have biomass concentration around
200 mg/L. Batch experiments were also conducted with pure species isolated from
acclimated mixed cultures in order to compare the chlorophenols degradation rate
of pure cultures with those of mixed cultures.
In addition to inorganic components, reactors were supplemented with varying
concentrations of 4-CP and/or 2,4-DCP as sole carbon and energy sources. The
same amount of nitrogen in the excluded proteose-peptone (Oxoid) was added to
batch reactors as NH4CI.
Reactors not receiving biomass were also operated as control at the same conditions
to monitor of chlorophenols removal via volatilization. Loss of 4-CP and 2,4-DCP
due to evaporation was negligible (<3%).
During the batch experiments, each flask was sampled at predetermined time
intervals. A 5 mL sample was filtered through a 0.45-µm filter and subjected to 4-
CP and 2,4-DCP analyses. MLVSS concentrations were measured at the start and
end of the reactor operation. Also, variations of pH during incubation were
monitored.
At the end of the experiments, batch flasks were allowed to settle for 30 minutes
and optical density (OD550) of supernatants were measured at 550 nm. The observed
OD550 values were converted to MLVSS concentrations using the linear
relationship, and the floc formation ability of cultures was evaluated by the index of
flocculation (IF), which is defined as (Soda et al., 1999):
total
sustotal
XXX
IF−
= 100(%) (2.1)
Xtotal indicates the total biomass concentration and Xsus is the biomass concentration
in supernatant after 30 minutes settling.
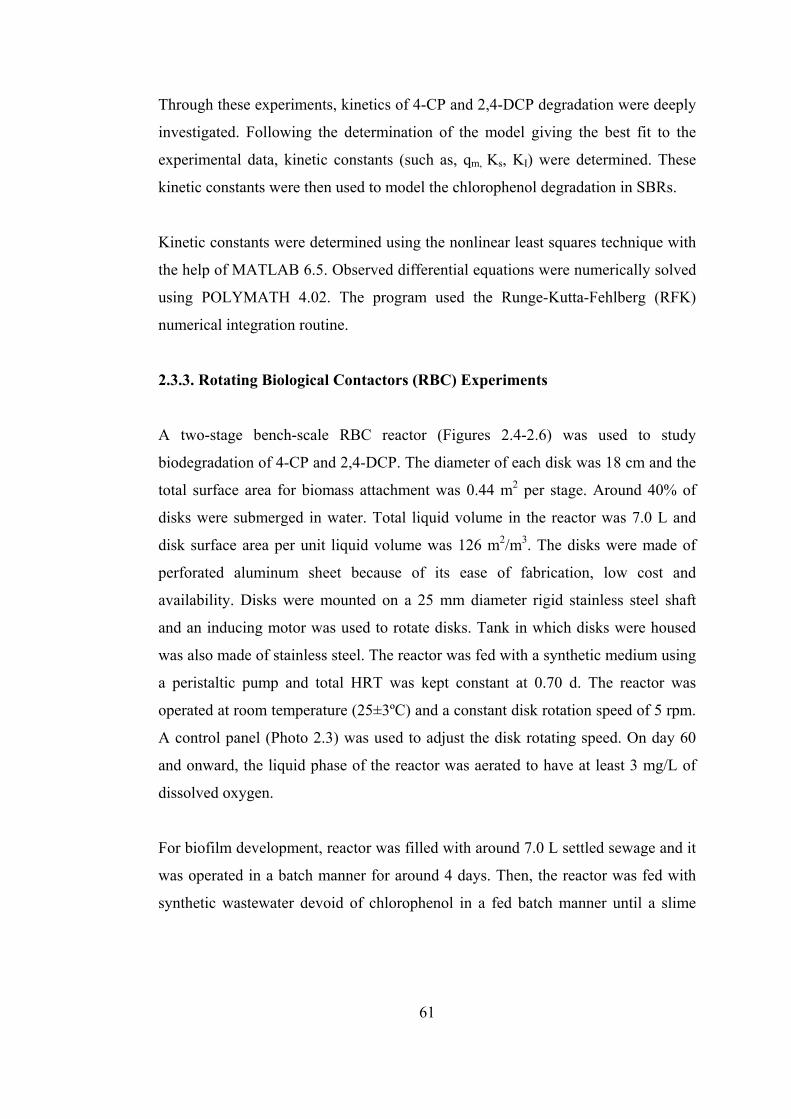
61
Through these experiments, kinetics of 4-CP and 2,4-DCP degradation were deeply
investigated. Following the determination of the model giving the best fit to the
experimental data, kinetic constants (such as, qm, Ks, KI) were determined. These
kinetic constants were then used to model the chlorophenol degradation in SBRs.
Kinetic constants were determined using the nonlinear least squares technique with
the help of MATLAB 6.5. Observed differential equations were numerically solved
using POLYMATH 4.02. The program used the Runge-Kutta-Fehlberg (RFK)
numerical integration routine.
2.3.3. Rotating Biological Contactors (RBC) Experiments
A two-stage bench-scale RBC reactor (Figures 2.4-2.6) was used to study
biodegradation of 4-CP and 2,4-DCP. The diameter of each disk was 18 cm and the
total surface area for biomass attachment was 0.44 m2 per stage. Around 40% of
disks were submerged in water. Total liquid volume in the reactor was 7.0 L and
disk surface area per unit liquid volume was 126 m2/m3. The disks were made of
perforated aluminum sheet because of its ease of fabrication, low cost and
availability. Disks were mounted on a 25 mm diameter rigid stainless steel shaft
and an inducing motor was used to rotate disks. Tank in which disks were housed
was also made of stainless steel. The reactor was fed with a synthetic medium using
a peristaltic pump and total HRT was kept constant at 0.70 d. The reactor was
operated at room temperature (25±3ºC) and a constant disk rotation speed of 5 rpm.
A control panel (Photo 2.3) was used to adjust the disk rotating speed. On day 60
and onward, the liquid phase of the reactor was aerated to have at least 3 mg/L of
dissolved oxygen.
For biofilm development, reactor was filled with around 7.0 L settled sewage and it
was operated in a batch manner for around 4 days. Then, the reactor was fed with
synthetic wastewater devoid of chlorophenol in a fed batch manner until a slime
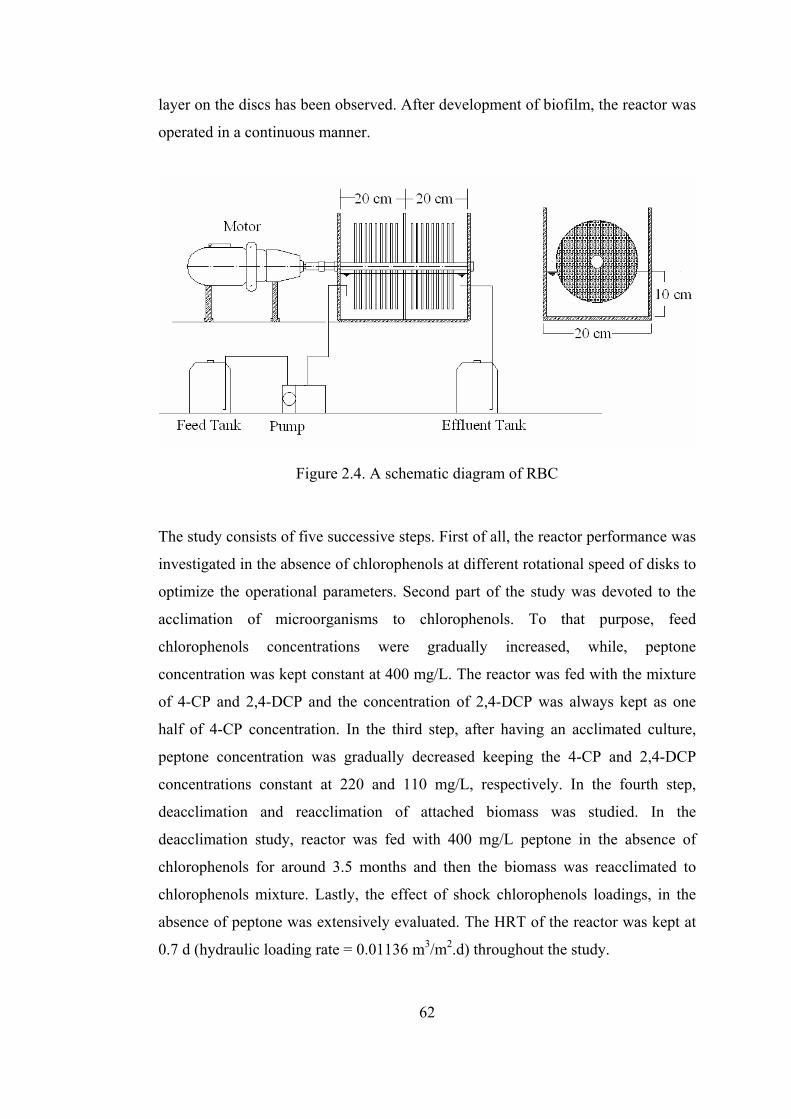
62
layer on the discs has been observed. After development of biofilm, the reactor was
operated in a continuous manner.
Figure 2.4. A schematic diagram of RBC
The study consists of five successive steps. First of all, the reactor performance was
investigated in the absence of chlorophenols at different rotational speed of disks to
optimize the operational parameters. Second part of the study was devoted to the
acclimation of microorganisms to chlorophenols. To that purpose, feed
chlorophenols concentrations were gradually increased, while, peptone
concentration was kept constant at 400 mg/L. The reactor was fed with the mixture
of 4-CP and 2,4-DCP and the concentration of 2,4-DCP was always kept as one
half of 4-CP concentration. In the third step, after having an acclimated culture,
peptone concentration was gradually decreased keeping the 4-CP and 2,4-DCP
concentrations constant at 220 and 110 mg/L, respectively. In the fourth step,
deacclimation and reacclimation of attached biomass was studied. In the
deacclimation study, reactor was fed with 400 mg/L peptone in the absence of
chlorophenols for around 3.5 months and then the biomass was reacclimated to
chlorophenols mixture. Lastly, the effect of shock chlorophenols loadings, in the
absence of peptone was extensively evaluated. The HRT of the reactor was kept at
0.7 d (hydraulic loading rate = 0.01136 m3/m2.d) throughout the study.
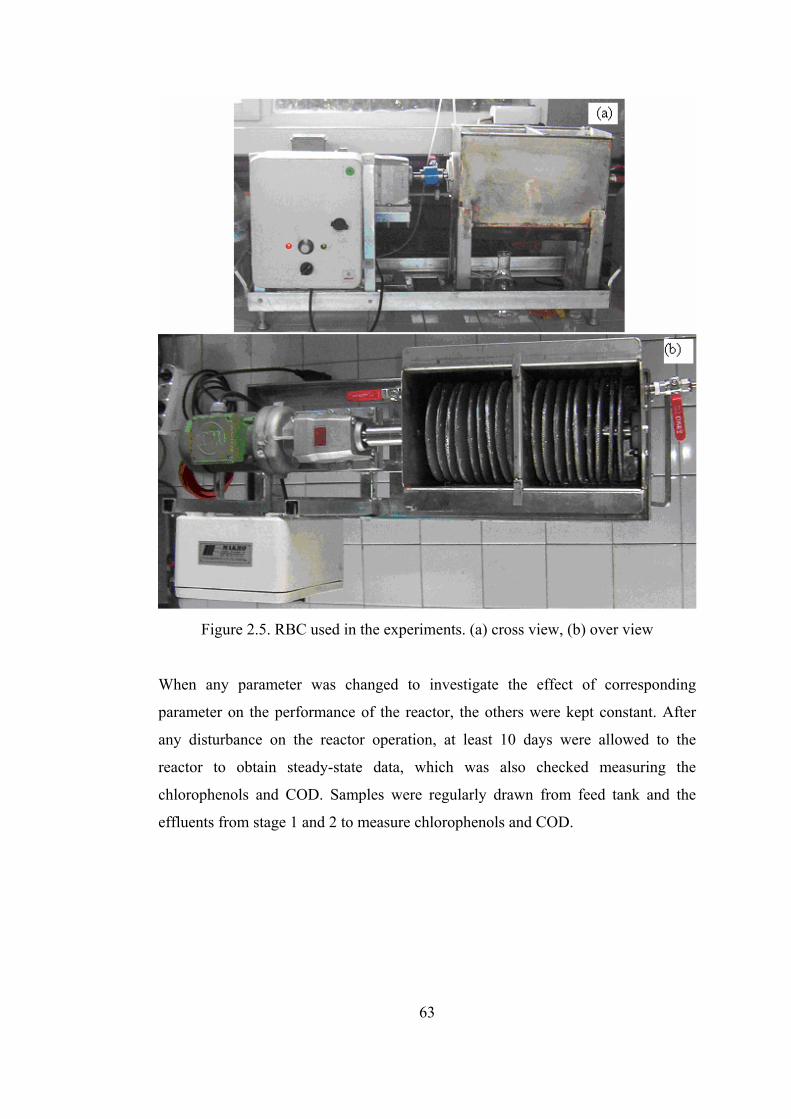
63
Figure 2.5. RBC used in the experiments. (a) cross view, (b) over view
When any parameter was changed to investigate the effect of corresponding
parameter on the performance of the reactor, the others were kept constant. After
any disturbance on the reactor operation, at least 10 days were allowed to the
reactor to obtain steady-state data, which was also checked measuring the
chlorophenols and COD. Samples were regularly drawn from feed tank and the
effluents from stage 1 and 2 to measure chlorophenols and COD.
64
Figure 2.6. Support medium (a), control panel (b) and RBC stages (c)
2.3.4. Isolation of pure cultures
In the isolation of bacteria, the procedure given by Wang et al. (2000) was used.
Mixed culture samples, obtained from reactors, were diluted to have maximum 30
colonies on solidified agar medium. The growth medium used in instantaneously
fed SBRs was solidified and used during the isolation of pure strains. Agar medium
was supplemented with mixture of 50 mg/L 4-CP and 25 mg/L 2,4-DCP. Streaked
agar plates were incubated at 30 °C. After development of colonies, single colonies
were selected and streaked to new agar plates. This procedure was repeated at least
five times in order to ensure the purity of culture. API 20 NE identification kits
were used to define the isolated cultures.
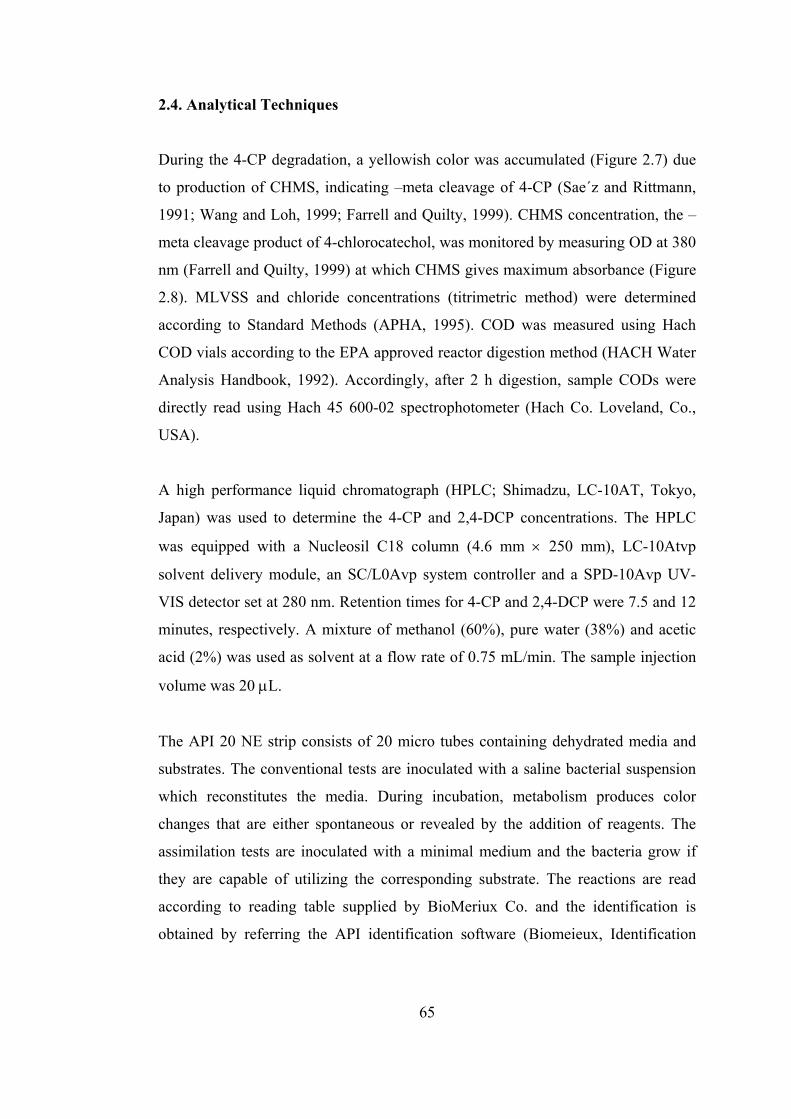
65
2.4. Analytical Techniques
During the 4-CP degradation, a yellowish color was accumulated (Figure 2.7) due
to production of CHMS, indicating –meta cleavage of 4-CP (Sae´z and Rittmann,
1991; Wang and Loh, 1999; Farrell and Quilty, 1999). CHMS concentration, the –
meta cleavage product of 4-chlorocatechol, was monitored by measuring OD at 380
nm (Farrell and Quilty, 1999) at which CHMS gives maximum absorbance (Figure
2.8). MLVSS and chloride concentrations (titrimetric method) were determined
according to Standard Methods (APHA, 1995). COD was measured using Hach
COD vials according to the EPA approved reactor digestion method (HACH Water
Analysis Handbook, 1992). Accordingly, after 2 h digestion, sample CODs were
directly read using Hach 45 600-02 spectrophotometer (Hach Co. Loveland, Co.,
USA).
A high performance liquid chromatograph (HPLC; Shimadzu, LC-10AT, Tokyo,
Japan) was used to determine the 4-CP and 2,4-DCP concentrations. The HPLC
was equipped with a Nucleosil C18 column (4.6 mm × 250 mm), LC-10Atvp
solvent delivery module, an SC/L0Avp system controller and a SPD-10Avp UV-
VIS detector set at 280 nm. Retention times for 4-CP and 2,4-DCP were 7.5 and 12
minutes, respectively. A mixture of methanol (60%), pure water (38%) and acetic
acid (2%) was used as solvent at a flow rate of 0.75 mL/min. The sample injection
volume was 20 µL.
The API 20 NE strip consists of 20 micro tubes containing dehydrated media and
substrates. The conventional tests are inoculated with a saline bacterial suspension
which reconstitutes the media. During incubation, metabolism produces color
changes that are either spontaneous or revealed by the addition of reagents. The
assimilation tests are inoculated with a minimal medium and the bacteria grow if
they are capable of utilizing the corresponding substrate. The reactions are read
according to reading table supplied by BioMeriux Co. and the identification is
obtained by referring the API identification software (Biomeieux, Identification
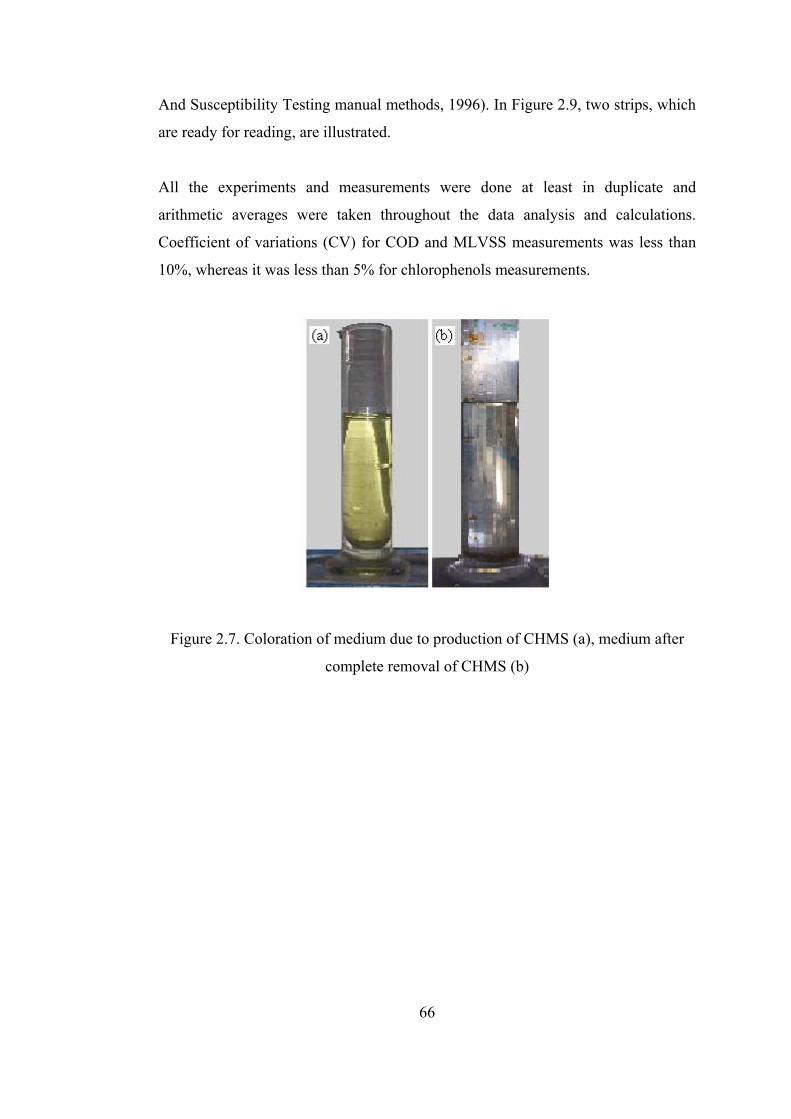
66
And Susceptibility Testing manual methods, 1996). In Figure 2.9, two strips, which
are ready for reading, are illustrated.
All the experiments and measurements were done at least in duplicate and
arithmetic averages were taken throughout the data analysis and calculations.
Coefficient of variations (CV) for COD and MLVSS measurements was less than
10%, whereas it was less than 5% for chlorophenols measurements.
Figure 2.7. Coloration of medium due to production of CHMS (a), medium after
complete removal of CHMS (b)
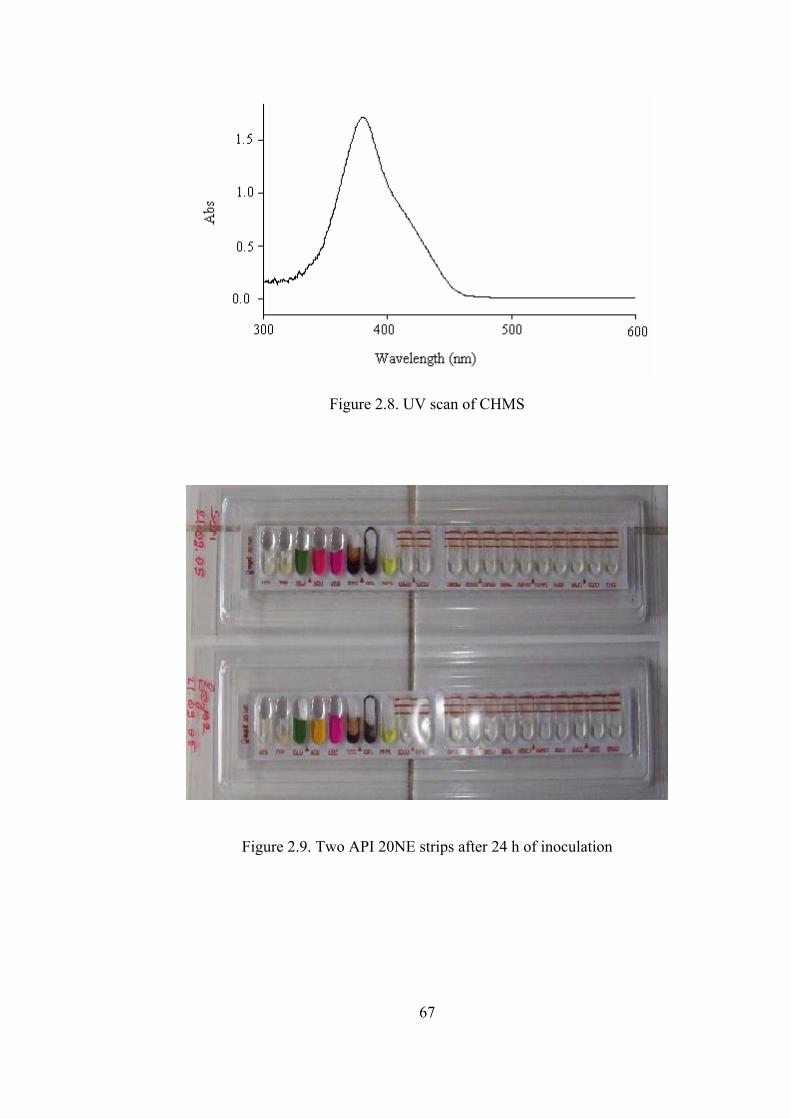
67
Figure 2.8. UV scan of CHMS
Figure 2.9. Two API 20NE strips after 24 h of inoculation
68
CHAPTER 3
RESULTS AND DISCUSSION
Experiments were conducted in suspended and attached growth reactors. Batch and
SBRs were used as suspended growth reactors. Biodegradation kinetics of
chlorophenols were studied in batch reactors and the observed biokinetic
coefficients were tested in instantaneously fed SBRs operated at different
chlorophenols and biogenic substrate concentrations. Semi continuously fed SBRs
were used to investigate the effect of filling time on reactor performance and to
optimize operational conditions. Chlorophenols degradation at different biogenic
substrate concentrations was also comparatively studied in RBC as an attached
growth reactor.
3.1. Chlorophenols Degradation In Instantaneously Fed SBRs
Despite the recalcitrant nature of chlorophenols, there are still some efforts toward
their biological way of treatment with specialized culture conditions because of
economical reasons and in expectation of few byproducts. The microorganisms
used are usually aerobes, including Pseudomonas sp., Alcaligenes sp., Azotobacter
sp., Rhodococcus sp., and Cryptococcus sp. (Kim et al., 2002).
Knowledge of microbial growth and substrate utilization kinetics is important for
the prediction of the fate of organic compounds in natural and engineered
69
environments (Grady et al., 1996). Mixed microbial communities are used by
environmental engineers (Templon and Grady, 1988); therefore, the kinetics of
microbial growth and substrate utilization should be studied using mixed culture in
order to produce data that can be used in the design of real wastewater treatment
plant. The problem is that the conditions imposed prior to the kinetic test have great
impact on the observed kinetics. Continued cultivation of a mixed culture will result
in selection of some members of the community, which affect the observed kinetic
parameters. Also, physiological adaptation (change in macromolecular
composition) of bacteria to their changing environment affects the observed
kinetics parameters as physiological state determines the rate of enzyme synthesis
(Grady et al., 1996). Another significant point is that many researchers claim that
only a specific population of microbial community is responsible for the
degradation of particular compounds, especially if degradation require unique
pathways (e.g. synthetic organic chemicals (SOCs)). In the literature, generally total
biomass concentrations have been used for growth and substrate degradation
kinetics as the measurement of competent biomass fraction is tedious and time
consuming. However, models based on total biomass concentrations will fail to
predict the performance of the bioreactor if it receives SOCs at varying
concentrations (Magbanua et al., 1998). Also, the use of total biomass concentration
in kinetic studies may be one of the reasons in the observation of considerable
variability in the values of the kinetic parameters on growth and substrate removal.
Some researchers used the fraction of COD contributed to the feed by that
compound in the calculation of competent biomass fraction based on the
assumption that if specialists are responsible for degradation of a particular
compound, the specialists grows only on SOC of interest (Magbanua et al., 1998;
Hu et al. (2005b), Hu et al., 2005; Ellis et al., 1996; Tomei et al., 2003). Magbanua
et al. (1998) reported that generally the influent COD fraction underestimated the
competent biomass fraction by a factor of about two, which may be due to the
convergence of degradation pathways for different SOCs. Contrary to this finding,
Hu et al. (2005b) reported that the competent fraction for 4-CP (0.01-0.03%) in
sequencing batch reactor receiving multicomponent feed was two order magnitudes
70
lower than the contribution of 4-CP to influent COD (2.0%). Although it seems that
the use of substrate specific MPN method is better approach compared to the use of
COD fraction, this method may also produce results with high coefficient of
variations (69–130%) due to long term variations in the microbial community of
bioreactor (Magbanua et al., 1998). Therefore, use of COD fraction to roughly
approximate competent biomass fraction is more realistic than assuming all
biomass is responsible for SOCs degradation (Magbanua et al., 1998).
Another significant point is that as wastewater treatment systems receive
multicomponent feed, the degradation of any individual organic constituent is
impacted by the concurrent utilization of other substrates. The biodegradation of a
recalcitrant compound may be synergistically or antagonistically affected by the
presence of other compounds. The enhanced biodegradation may be due to
increased biomass concentration with the utilization of other compounds or the
induction of degradative enzymes, whereas, if the biomass may shift their major
carbon source from recalcitrant to the relatively biodegraded compound, the
utilization rate of recalcitrant compound may decrease (Lu and Tsai, 1993; Lu and
Spetiel, 1988). Also, a recalcitrant compound may adversely affect the
biodegradation of others inhibiting biomass growth or adversely affecting the
enzymes production or reaction. In this context, Lu and Tsai (1993) reported that
2,4-DCP enhanced the biodegradation of a less chlorinated but recalcitrant
compound, 2-Chlorophenol (2-CP). The same authors also reported that
monochlorophenols, 3-Chlorophenol (3-CP), 2-CP and 4-CP retarded the
biodegradation of 2,4-DCP. The knowledge on how substrate interacts is important
to develop mathematical models in the design of a wastewater plant and estimate its
performance. Although there are some studies on the effect of one chlorophenol
presence on the degradation of other type of chlorophenols (Lu and Tsai, 1993;
Quan et al., 2005), there is little or no kinetic study available in the literature.
Therefore, the goals of this set of experiments were to investigate chlorophenols
degradation kinetics at different feed 4-CP concentrations in the presence and
71
absence of 2,4-DCP through long term operated instantaneously fed SBRs in order
to give culture enough time for the selection of different dominant species and the
changes in the physiological state of the cells involved. By this way, the use of
competent biomass fraction in the degradation kinetics of chlorophenols at varying
concentrations was deeply investigated. Also, dominant species in culture were
determined after acclimation to chlorophenols.
One of the reactors (FED4) received 4-CP only, whereas, the other reactor (FEDM)
received mixture of 4-CP and 2,4-DCP. The 2,4-DCP concentrations in the feed of
FEDM was kept always one half of 4-CP concentrations. Chlorophenols were
added to the feed at low concentrations and the concentrations were gradually
increased up to 200 mg/L 4-CP and 100 mg/L 2,4-DCP, which lasted around 5
months (Figure 3.1). The pH of the synthetic wastewater was 7.2-7.5 and it was 6.5-
6.8 (depending on chlorophenol concentration) at the end of one-day cycle. The
decrease was due to production of HCI as a result of chlorophenols degradation.
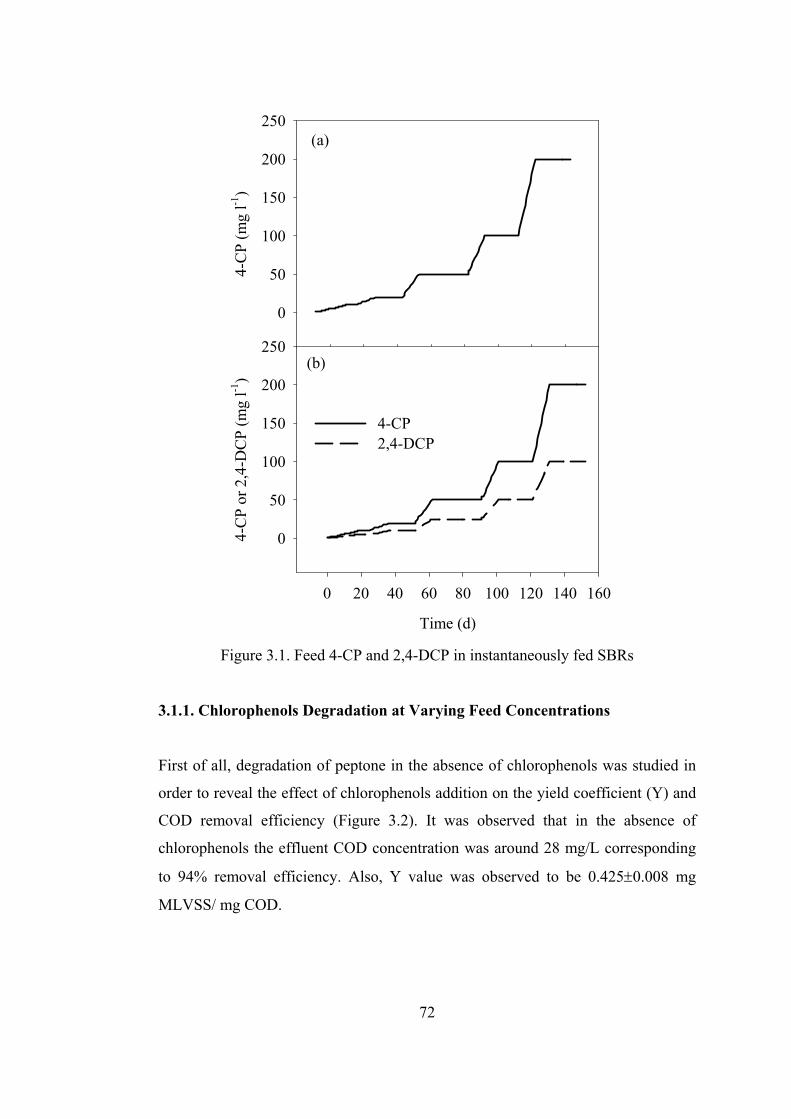
72
4-C
P (m
g l-1
)
0
50
100
150
200
250
Time (d)
0 20 40 60 80 100 120 140 160
4-C
P or
2,4
-DC
P (m
g l-1
)
0
50
100
150
200
250
4-CP2,4-DCP
(a)
(b)
Figure 3.1. Feed 4-CP and 2,4-DCP in instantaneously fed SBRs
3.1.1. Chlorophenols Degradation at Varying Feed Concentrations
First of all, degradation of peptone in the absence of chlorophenols was studied in
order to reveal the effect of chlorophenols addition on the yield coefficient (Y) and
COD removal efficiency (Figure 3.2). It was observed that in the absence of
chlorophenols the effluent COD concentration was around 28 mg/L corresponding
to 94% removal efficiency. Also, Y value was observed to be 0.425±0.008 mg
MLVSS/ mg COD.
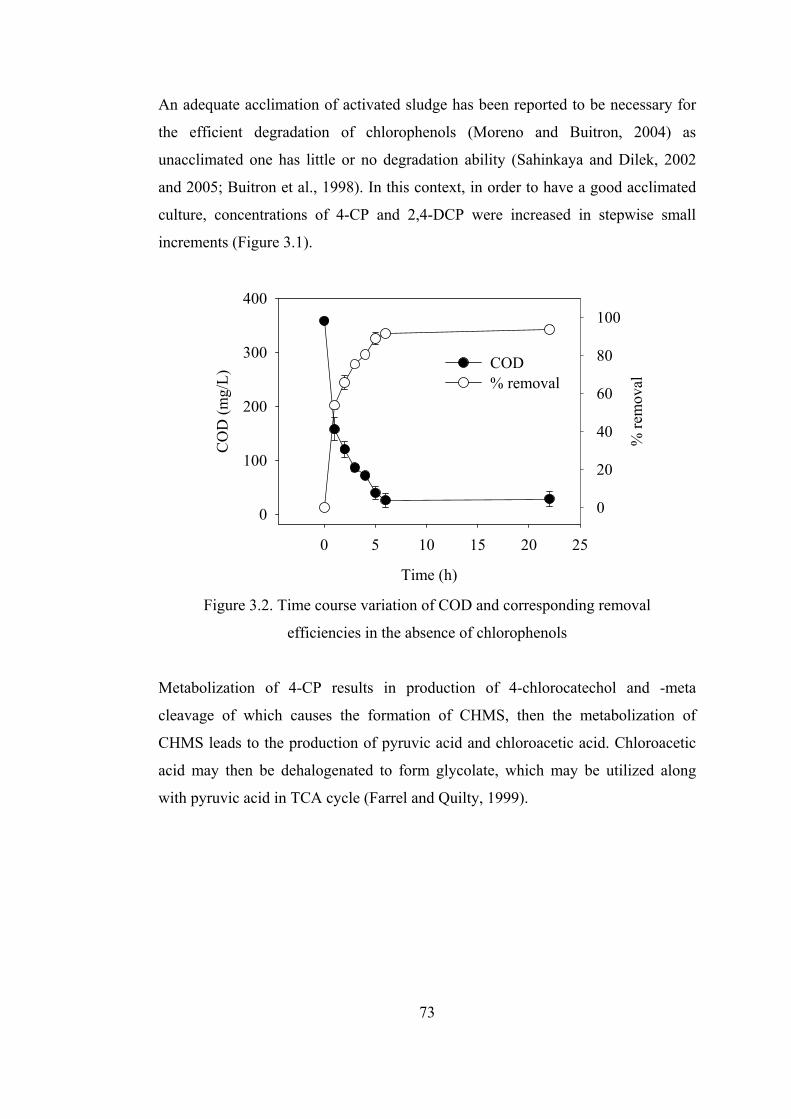
73
An adequate acclimation of activated sludge has been reported to be necessary for
the efficient degradation of chlorophenols (Moreno and Buitron, 2004) as
unacclimated one has little or no degradation ability (Sahinkaya and Dilek, 2002
and 2005; Buitron et al., 1998). In this context, in order to have a good acclimated
culture, concentrations of 4-CP and 2,4-DCP were increased in stepwise small
increments (Figure 3.1).
Time (h)
0 5 10 15 20 25
CO
D (m
g/L)
0
100
200
300
400
% re
mov
al
0
20
40
60
80
100
COD% removal
Figure 3.2. Time course variation of COD and corresponding removal
efficiencies in the absence of chlorophenols
Metabolization of 4-CP results in production of 4-chlorocatechol and -meta
cleavage of which causes the formation of CHMS, then the metabolization of
CHMS leads to the production of pyruvic acid and chloroacetic acid. Chloroacetic
acid may then be dehalogenated to form glycolate, which may be utilized along
with pyruvic acid in TCA cycle (Farrel and Quilty, 1999).
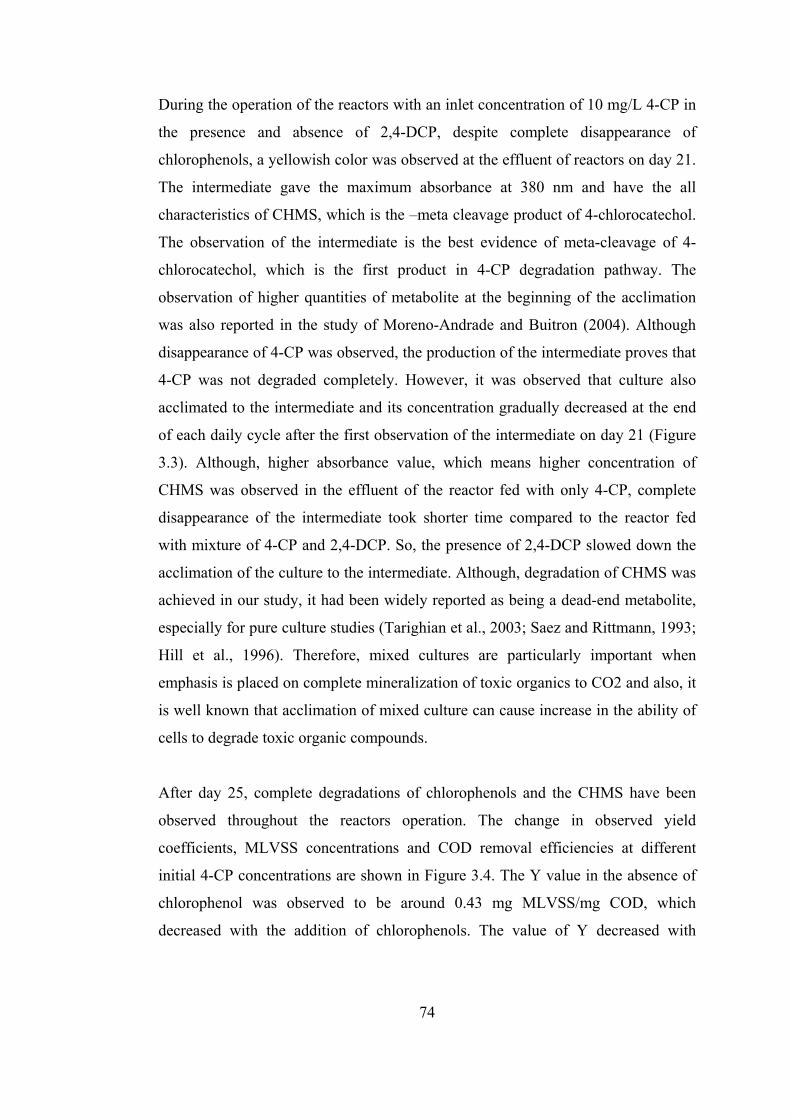
74
During the operation of the reactors with an inlet concentration of 10 mg/L 4-CP in
the presence and absence of 2,4-DCP, despite complete disappearance of
chlorophenols, a yellowish color was observed at the effluent of reactors on day 21.
The intermediate gave the maximum absorbance at 380 nm and have the all
characteristics of CHMS, which is the –meta cleavage product of 4-chlorocatechol.
The observation of the intermediate is the best evidence of meta-cleavage of 4-
chlorocatechol, which is the first product in 4-CP degradation pathway. The
observation of higher quantities of metabolite at the beginning of the acclimation
was also reported in the study of Moreno-Andrade and Buitron (2004). Although
disappearance of 4-CP was observed, the production of the intermediate proves that
4-CP was not degraded completely. However, it was observed that culture also
acclimated to the intermediate and its concentration gradually decreased at the end
of each daily cycle after the first observation of the intermediate on day 21 (Figure
3.3). Although, higher absorbance value, which means higher concentration of
CHMS was observed in the effluent of the reactor fed with only 4-CP, complete
disappearance of the intermediate took shorter time compared to the reactor fed
with mixture of 4-CP and 2,4-DCP. So, the presence of 2,4-DCP slowed down the
acclimation of the culture to the intermediate. Although, degradation of CHMS was
achieved in our study, it had been widely reported as being a dead-end metabolite,
especially for pure culture studies (Tarighian et al., 2003; Saez and Rittmann, 1993;
Hill et al., 1996). Therefore, mixed cultures are particularly important when
emphasis is placed on complete mineralization of toxic organics to CO2 and also, it
is well known that acclimation of mixed culture can cause increase in the ability of
cells to degrade toxic organic compounds.
After day 25, complete degradations of chlorophenols and the CHMS have been
observed throughout the reactors operation. The change in observed yield
coefficients, MLVSS concentrations and COD removal efficiencies at different
initial 4-CP concentrations are shown in Figure 3.4. The Y value in the absence of
chlorophenol was observed to be around 0.43 mg MLVSS/mg COD, which
decreased with the addition of chlorophenols. The value of Y decreased with
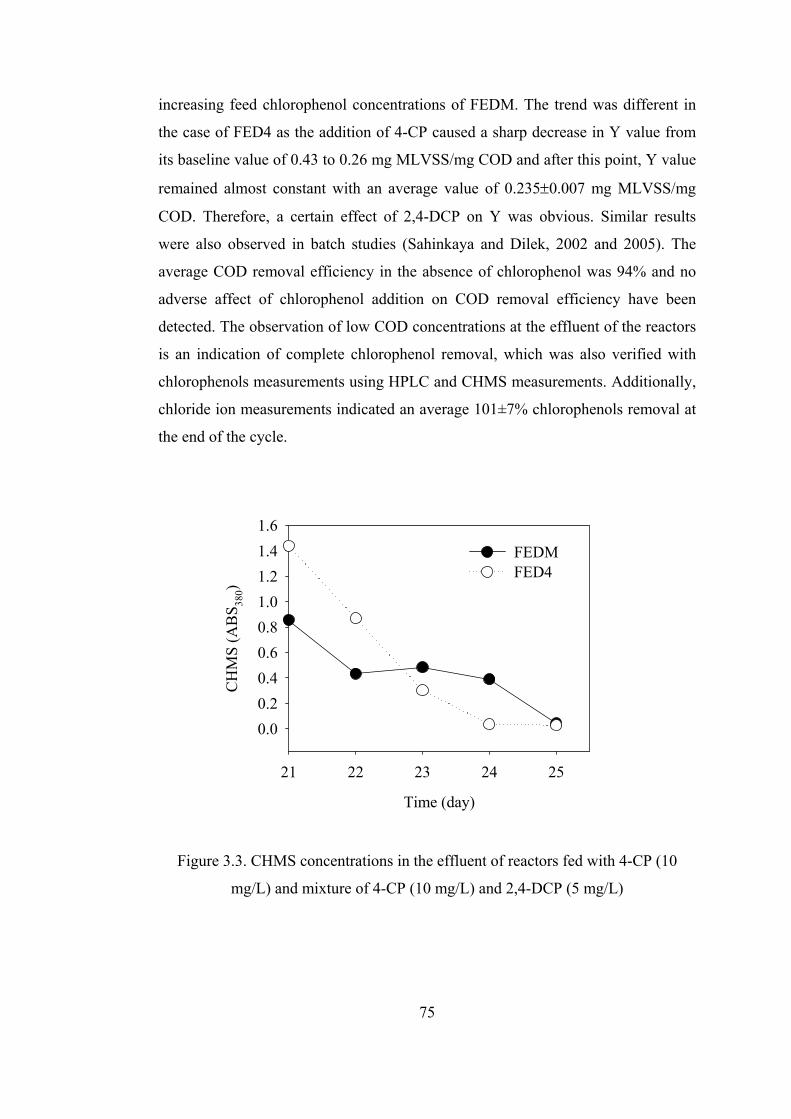
75
increasing feed chlorophenol concentrations of FEDM. The trend was different in
the case of FED4 as the addition of 4-CP caused a sharp decrease in Y value from
its baseline value of 0.43 to 0.26 mg MLVSS/mg COD and after this point, Y value
remained almost constant with an average value of 0.235±0.007 mg MLVSS/mg
COD. Therefore, a certain effect of 2,4-DCP on Y was obvious. Similar results
were also observed in batch studies (Sahinkaya and Dilek, 2002 and 2005). The
average COD removal efficiency in the absence of chlorophenol was 94% and no
adverse affect of chlorophenol addition on COD removal efficiency have been
detected. The observation of low COD concentrations at the effluent of the reactors
is an indication of complete chlorophenol removal, which was also verified with
chlorophenols measurements using HPLC and CHMS measurements. Additionally,
chloride ion measurements indicated an average 101±7% chlorophenols removal at
the end of the cycle.
Time (day)
21 22 23 24 25
CH
MS
(AB
S 380)
0.00.20.40.60.81.01.21.41.6
FEDMFED4
Figure 3.3. CHMS concentrations in the effluent of reactors fed with 4-CP (10
mg/L) and mixture of 4-CP (10 mg/L) and 2,4-DCP (5 mg/L)
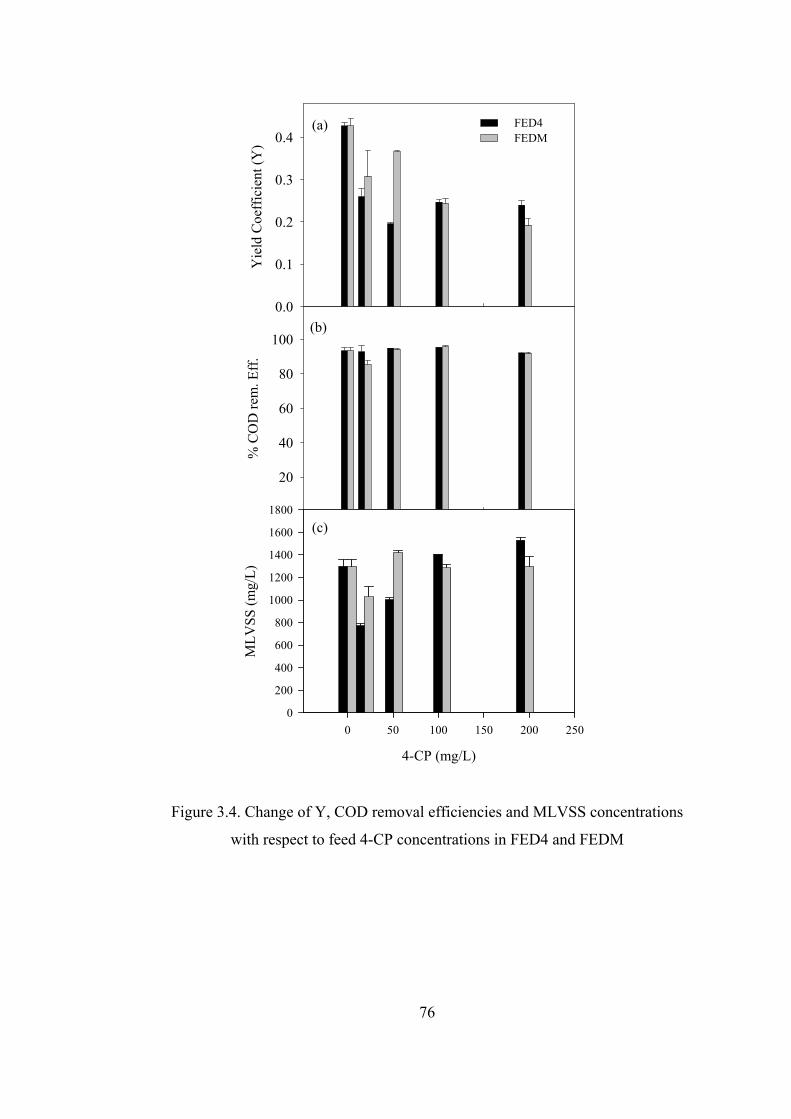
76
% C
OD
rem
. Eff
.
20
40
60
80
100
Yie
ld C
oeff
icie
nt (Y
)
0.0
0.1
0.2
0.3
0.4FED4FEDM
4-CP (mg/L)
0 50 100 150 200 250
MLV
SS (m
g/L)
0
200
400
600
800
1000
1200
1400
1600
1800
(a)
(b)
(c)
Figure 3.4. Change of Y, COD removal efficiencies and MLVSS concentrations
with respect to feed 4-CP concentrations in FED4 and FEDM
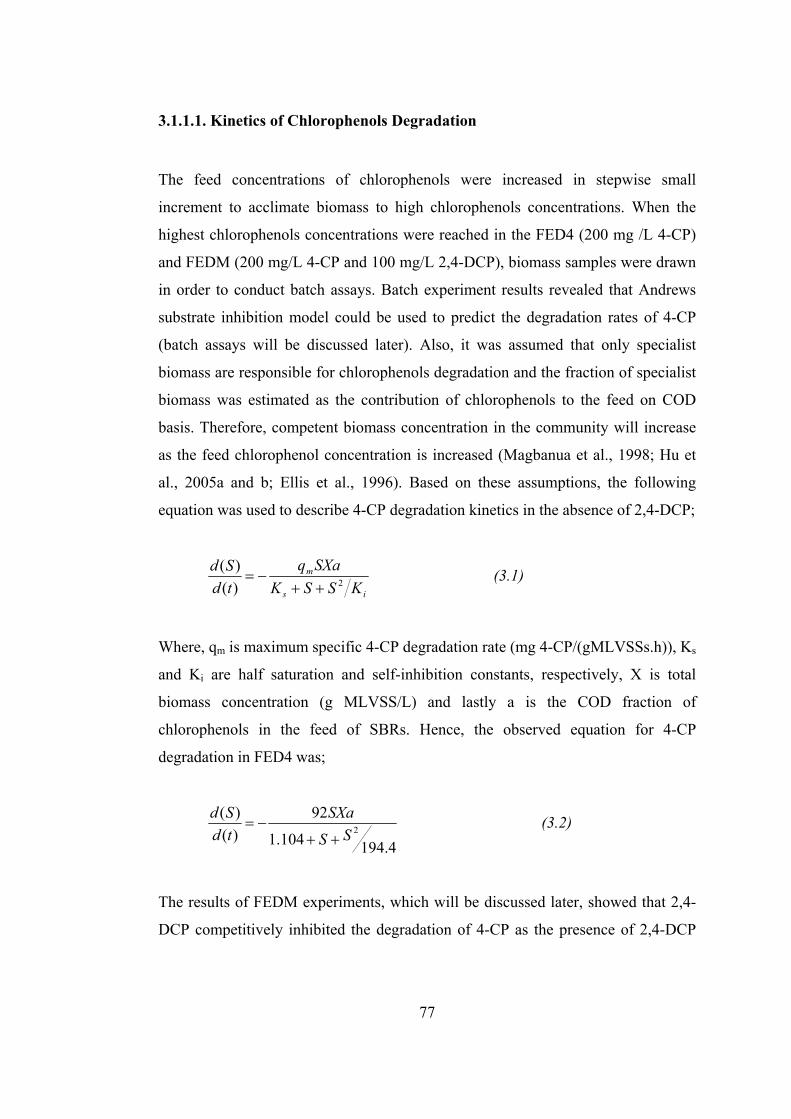
77
3.1.1.1. Kinetics of Chlorophenols Degradation
The feed concentrations of chlorophenols were increased in stepwise small
increment to acclimate biomass to high chlorophenols concentrations. When the
highest chlorophenols concentrations were reached in the FED4 (200 mg /L 4-CP)
and FEDM (200 mg/L 4-CP and 100 mg/L 2,4-DCP), biomass samples were drawn
in order to conduct batch assays. Batch experiment results revealed that Andrews
substrate inhibition model could be used to predict the degradation rates of 4-CP
(batch assays will be discussed later). Also, it was assumed that only specialist
biomass are responsible for chlorophenols degradation and the fraction of specialist
biomass was estimated as the contribution of chlorophenols to the feed on COD
basis. Therefore, competent biomass concentration in the community will increase
as the feed chlorophenol concentration is increased (Magbanua et al., 1998; Hu et
al., 2005a and b; Ellis et al., 1996). Based on these assumptions, the following
equation was used to describe 4-CP degradation kinetics in the absence of 2,4-DCP;
is
m
KSSKSXaq
tdSd
2)()(
++−= (3.1)
Where, qm is maximum specific 4-CP degradation rate (mg 4-CP/(gMLVSSs.h)), Ks
and Ki are half saturation and self-inhibition constants, respectively, X is total
biomass concentration (g MLVSS/L) and lastly a is the COD fraction of
chlorophenols in the feed of SBRs. Hence, the observed equation for 4-CP
degradation in FED4 was;
4.194104.1
92)()(
2SS
SXatdSd
++−= (3.2)
The results of FEDM experiments, which will be discussed later, showed that 2,4-
DCP competitively inhibited the degradation of 4-CP as the presence of 2,4-DCP
78
retarded the initiation of 4-CP degradation and the removal of 4-CP in the presence
of 2,4-DCP was observed to be almost negligible. Similar result was also reported
by Quan et al. (2005). Therefore, the proposed model is;
is
ii
m
KSSK
KI
SXaqtdSd
2)1()(
)(
+++−= (3.3)
Where, I is 2,4-DCP concentration, Kii is inhibition coefficient of 2,4-DCP on 4-CP
degradation and a is the fraction of 4-CP and 2,4-DCP in the feed on COD basis. It
should be noted that in the determination of competent biomass fraction having
ability to degrade 4-CP, total fraction of 4-CP and 2,4-DCP in the feed was taken
into consideration. The reason is that culture with the ability to degrade one type of
chlorophenol may also have ability to degrade another structurally similar
chlorophenol. Although such a generalization may not be true for pure cultures or
sometimes for mixed cultures, in our case the validity of the assumption has also
been proved in our previous studies (Sahinkaya and Dilek, 2002 and 2005). The
observed competitive inhibition also claims that the same enzymes are responsible
for the degradation of both chlorophenols, therefore, it is reasonable to assume that
the same community is responsible for the degradation of 4-CP and 2,4-DCP.
In order to determine the qm, Ks and Ki values in Equation 3.3, batch experiments
were carried out at different 4-CP concentrations in the absence of 2,4-DCP
(Section 3.2) using biomass drawn from FEDM. After determination of qm, Ks and
Ki, Kii value was determined using the results of FEDM when it received 200 mg/L
4-CP and 100 mg/L 2,4-DCP. The best fitting value of Kii, which is competitive
inhibition coefficient of 2,4-DCP on 4-CP degradation, was observed to be 0.17
mg/L. The relatively small value of Kii indicates a high toxic effect of 2,4-DCP on
4-CP degradation. Therefore, the resulting equation is as follows;
79
74.7998.34)17.0/1(
49.248)()(
2SSI
SXatdSd
+++−= (3.4)
Simply zero order degradation model was observed to be good enough to predict
2,4-DCP degradation kinetics in the presence of 4-CP and the degradation rate of
2,4-DCP can be expressed as;
ktdId
−=)()( (3.5)
Combination of the equations 3.4 and 3.5 yielded;
74.7998.34)17.0/)(1(
49.248)()(
2
0SSktI
SXatdSd
++−+−= (3.6)
The observed equations were solved with the help of POLYMATH 4.02 assuming
that the biomass concentration was constant during the reaction time as the initial
biomass concentration is very high and the average difference between initial and
the final value was observed to be around 10%.
In order to evaluate the efficacy of competent biomass in the degradation models,
we have estimated 4-CP concentration profile in FED4 receiving 50 mg/L 4-CP
assuming specialists (Model 1) or generalists (all biomass) (Model 2) was
responsible for 4-CP degradation (Figure 3.5). As clearly seen from the figure,
Model 1 gave much better fit compared to Model 2, which showed that considering
specialist biomass in the kinetic study is better approach, supporting the observation
of Ellis et al. (1996). Hence, in the rest of our kinetic studies, specialist biomass
concentration was considered.
It is also necessary to note that Ellis and Eliosov (2004) reported that the feed COD
fraction gave better approximation of competent biomass fraction when the test
compound’s fraction in feed was high (>1%). In the literature, the efficacy of using
80
feed COD fraction as an indicator of competent biomass fraction was generally
studied in a multisubstrate feed in which the fraction of test compound in the range
of (0.1-5%) (Ellis and Eliosov, 2004; Magbanua et al., 1998; Hu et al. (2005b)). In
our study, however, the fractions of chlorophenols in FED4 and FEDM varied as
10-45% and 12-53% in respective order. Therefore, based on the observation of
Ellis and Eliosov (2004), the accurate estimation of competent biomass fraction
using the feed COD contribution is more likely in our study due to the high fraction
of chlorophenols in the feed.
Time (h)
0 1 2 3 4 5 6
4-C
P (m
g/L)
0
10
20
30
40
50
60ExperimentalModel 1Model 2
Figure 3.5. The prediction of 4-CP concentration profile considering
competent (Model 1) and total biomass concentrations (Model 2)
The experimental results of FED4 receiving 100 and 200 mg/L of 4-CP were
depicted in Figure 3.6. Complete 4-CP and high COD removals were observed in
the reactor for both conditions. During the removal of 4-CP, CHMS concentration
increased simultaneously and the highest concentration reached when 4-CP was just
completely removed (Figure 3.6a and c). The COD concentration when CHMS
concentration was at its maximum is close to that observed at the end of cycle
(around 30 mg/L and 50 mg/L for 100 and 200 mg/L 4-CP, respectively), which
indicated that the accumulated concentration of CHMS is much lower than its
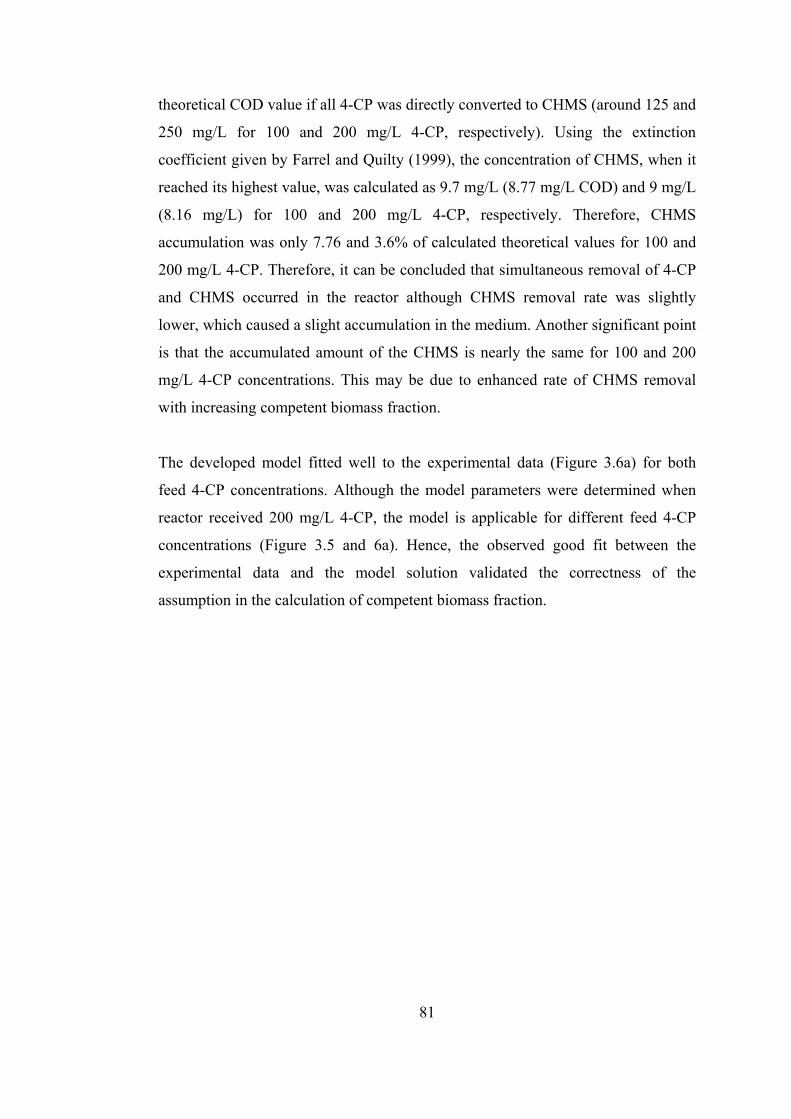
81
theoretical COD value if all 4-CP was directly converted to CHMS (around 125 and
250 mg/L for 100 and 200 mg/L 4-CP, respectively). Using the extinction
coefficient given by Farrel and Quilty (1999), the concentration of CHMS, when it
reached its highest value, was calculated as 9.7 mg/L (8.77 mg/L COD) and 9 mg/L
(8.16 mg/L) for 100 and 200 mg/L 4-CP, respectively. Therefore, CHMS
accumulation was only 7.76 and 3.6% of calculated theoretical values for 100 and
200 mg/L 4-CP. Therefore, it can be concluded that simultaneous removal of 4-CP
and CHMS occurred in the reactor although CHMS removal rate was slightly
lower, which caused a slight accumulation in the medium. Another significant point
is that the accumulated amount of the CHMS is nearly the same for 100 and 200
mg/L 4-CP concentrations. This may be due to enhanced rate of CHMS removal
with increasing competent biomass fraction.
The developed model fitted well to the experimental data (Figure 3.6a) for both
feed 4-CP concentrations. Although the model parameters were determined when
reactor received 200 mg/L 4-CP, the model is applicable for different feed 4-CP
concentrations (Figure 3.5 and 6a). Hence, the observed good fit between the
experimental data and the model solution validated the correctness of the
assumption in the calculation of competent biomass fraction.
82
4-C
P (m
g/L)
0
50
100
150
200
200 mg/L 4-CP100 mg/L 4-CPmodel
CO
D (m
g/L)
0
200
400
600
800
200 mg/L 4-CP100 mg/L 4-CP
Time (h)
0 5 10 15 20 25
CH
MS
(AB
S 380)
0.0
0.5
1.0
1.5
2.0
2.5
200 mg/L 4-CP100 mg/L 4-CP
(a)
(b)
(c)
Figure 3.6. Experimental data and model results for FED4 receiving
100 and 200 mg/L 4-CP
83
In the case of 4-CP and 2,4-DCP mixture, competitive inhibition of 2,4-DCP on 4-
CP degradation can be clearly seen from the analyses of Figure 3.7. Almost
complete removal of 2,4-DCP was achieved within 4 and 6 h (Figure 3.7a) and 4-
CP degradation was almost negligible up to this point. After complete degradation
of 2,4-DCP, there was no any inhibitory effect on 4-CP degradation and its
degradation started immediately and completed following next 5 h (Figure 3.7a).
The competitive inhibitory effect of 2,4-DCP on 4-CP degradation can also be
clearly seen from Figure 3.7c, which depicts normalized concentrations for FEDM
receiving 200mg/L 4-CP and 100 mg/L 2,4-DCP. Zero order degradation model
was good enough to predict time course variation of 2,4-DCP (Figure 3.7a). The
model fitted reasonably well to the experimental data, which means the developed
model can be used to predict the performance of the reactor even at different steady
state feed chlorophenols concentrations.
During the degradation of 4-CP, CHMS concentration in the medium increased and
it reached its maximum when 4-CP was just completely removed from the medium
(Figure 3.7c). After reaching peak value, the CHMS concentration decreased
sharply and complete removal was observed at the end of the cycle. The peak value
of CHMS for 200 mg/L 4-CP and 100 mg/L 2,4-DCP was 3.38% of theoretical
CHMS concentration. The value was observed to be 3.28% for 100 mg/L4-CP and
50 mg/L 2,4-DCP. The measured COD values are also in good agreement with
those observations as the COD values when CHMS reached its maximum is almost
equal to the effluent COD values. Therefore, there were almost no contributions of
CHMS to COD due to its low concentration. These results indicated simultaneous
removal of 4-CP and CHMS, although the removal rate of CHMS is slightly lower.
Similar results were also observed for FED4.
The observed effect of 2,4-DCP on 4-CP degradation was similar to the inhibition
observed in cometabolic degradation of 4-CP in the presence of phenol (Wang and
Loh, 1999 and 2000; Hill et al., 1996; Lu et al., 1996; Kim and Hao, 1999; Hao et
al., 2002). In 4-CP degradation, the first step is the attack of phenol hydroxylase to
84
4-CP, which results in production of 4-Chlorocatechol. The conversion of 4-
Chlorocatechol via -meta cleavage pathway yields CHMS, and complete removal of
the intermediate may further be observed. CHMS has been widely reported to be a
dead-end metabolite when pure culture is used in the degradation process (Hill et
al., 1996; Sae´z and Rittmann, 1991 and 1993; Farrell and Quilty, 1999). However,
we have observed complete degradation of 4-CP and CHMS (Figures 3.6 and 3.7)
with acclimated mixed culture. In the case of 2,4-DCP degradation, the first step is
the production of 3,5-Dichlorocatechol with the use of 2,4-Dichlorophenol
hydroxylase. Then 3,5-Dichlorocatechol is converted to 2,4-Dichloro-cis,cis-
muconate, which is catalyzed by 3,5-dichlorocatechol 1,2-dioxygenase
(Radjendirane et al., 1991). It was reported that phenol hydroxylase has a broad
substrate specificity and it can also catalyze the turnover of 2,4-DCP (Hollender et
al., 1997). It is also known that 2,4-Dichlorophenol hydroxylase has ability to
convert 4-CP to 4-Chlorocatechol (Beadle and Smith, 1982). Therefore, the use of
the same enzymes for the initiation of 4-CP and 2,4-DCP degradation led to
observation of competitive inhibition.
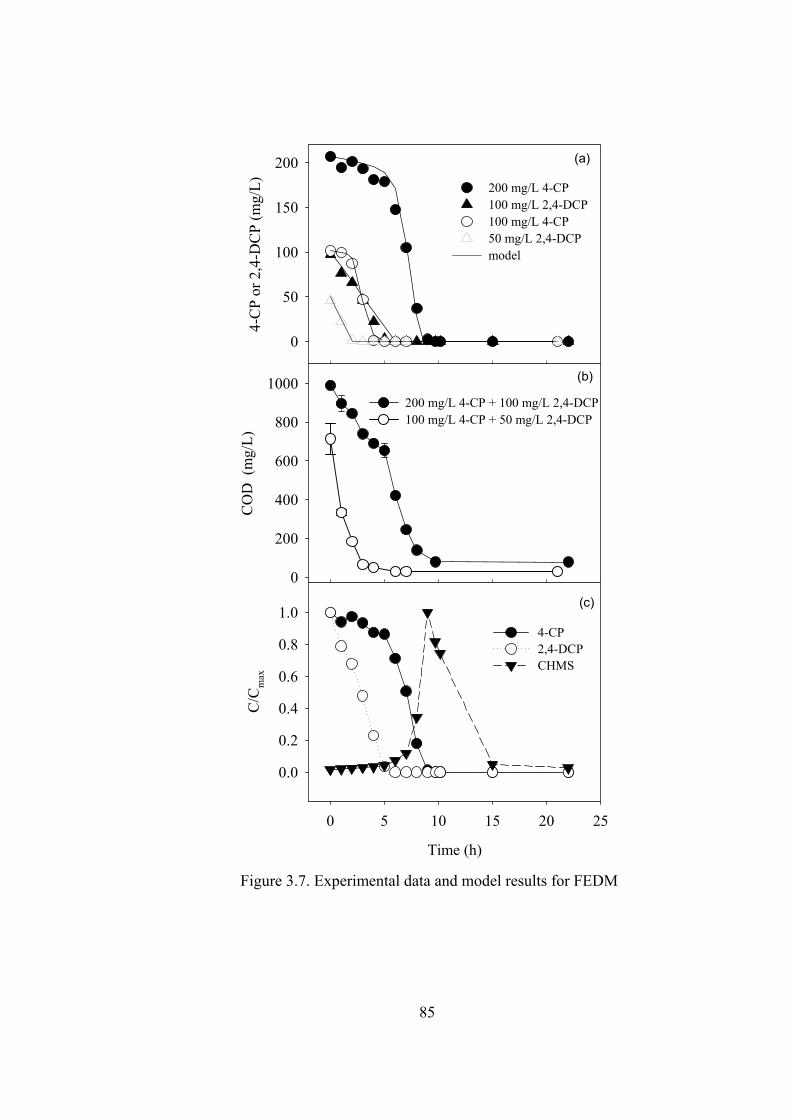
85
2D Graph 8
CO
D (
mg/
L)
0
200
400
600
800
1000200 mg/L 4-CP + 100 mg/L 2,4-DCP100 mg/L 4-CP + 50 mg/L 2,4-DCP
4-C
P or
2,4
-DC
P (m
g/L)
0
50
100
150
200200 mg/L 4-CP100 mg/L 2,4-DCP100 mg/L 4-CP50 mg/L 2,4-DCPmodel
Time (h)
0 5 10 15 20 25
C/C
max
0.0
0.2
0.4
0.6
0.8
1.04-CP2,4-DCPCHMS
(a)
(b)
(c)
Figure 3.7. Experimental data and model results for FEDM
86
The average specific degradation rates on the basis of total biomass concentrations
(SDR) are depicted in Figure 3.8. The SDR values in FEDM were calculated after
2,4-DCP were completely removed from the medium as negligible removal
occurred in the presence of 2,4-DCP due to competitive inhibition. The SDR of
chlorophenols increased linearly with increasing chlorophenol fraction in the feed.
The reason of this observation, as noted before, is the increase in the fraction of
chlorophenol degrading specialized biomass in the community. A better linear
relationship was observed for 4-CP in the absence of 2,4-DCP (FED4). The
possible reason of this observation is the complex substrate interaction in multi-
substrate environments (FEDM). Another interesting point is that SDR values for
FEDM were higher compared to those for FED4. Therefore, although presence of
2,4-DCP competitively inhibited 4-CP degradation, its presence increased the SDR
of 4-CP after 2,4-DCP disappeared in the medium. There may three possible
reasons of such observation. First, the culture community is different in two
reactors (see Table 3.1) as the manner in which the culture has been developed
determines the types of dominant species (Grady et al, 1996). Second, the cell’s
macromolecular composition (cell-envelope, protein, RNA and DNA) may be
different in two reactors, which determines how rapidly enzymes are synthesized
and those enzymes react (Grady et al., 1996). As noted previously, the same
enzymes are utilized in initiation of 4-CP and 2,4-DCP degradation. Therefore,
presence of 2,4-DCP may increase the amount of enzymes utilized in 4-CP
breakdown. Third, the fraction of specialists in the sludge of FEDM may be higher
compared to that in FED4 as 2,4-DCP degraders may also have the ability to
degrade 4-CP.
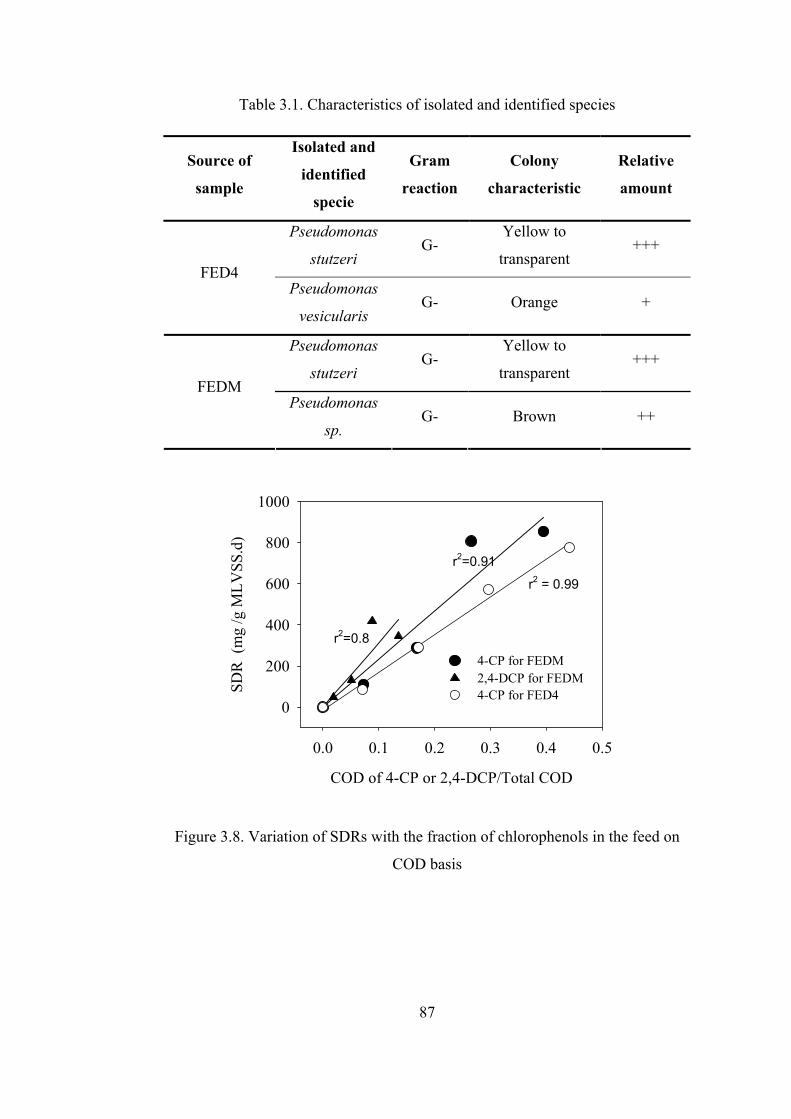
87
Table 3.1. Characteristics of isolated and identified species
COD of 4-CP or 2,4-DCP/Total COD
0.0 0.1 0.2 0.3 0.4 0.5
SDR
(m
g /g
MLV
SS.d
)
0
200
400
600
800
1000
4-CP for FEDM2,4-DCP for FEDM4-CP for FED4
r2 = 0.99
r2=0.91
r2=0.8
Figure 3.8. Variation of SDRs with the fraction of chlorophenols in the feed on
COD basis
Source of
sample
Isolated and
identified
specie
Gram
reaction
Colony
characteristic
Relative
amount
Pseudomonas
stutzeri G-
Yellow to
transparent +++
FED4 Pseudomonas
vesicularis G- Orange +
Pseudomonas
stutzeri G-
Yellow to
transparent +++
FEDM Pseudomonas
sp. G- Brown ++
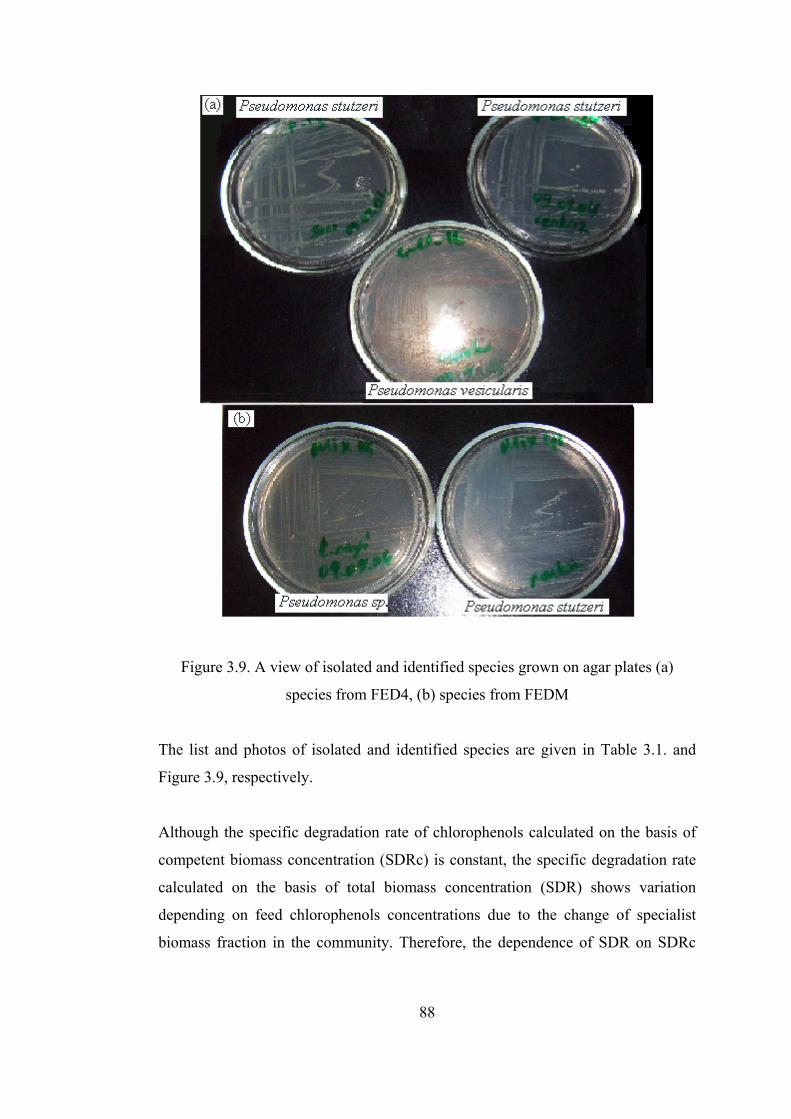
88
Figure 3.9. A view of isolated and identified species grown on agar plates (a)
species from FED4, (b) species from FEDM
The list and photos of isolated and identified species are given in Table 3.1. and
Figure 3.9, respectively.
Although the specific degradation rate of chlorophenols calculated on the basis of
competent biomass concentration (SDRc) is constant, the specific degradation rate
calculated on the basis of total biomass concentration (SDR) shows variation
depending on feed chlorophenols concentrations due to the change of specialist
biomass fraction in the community. Therefore, the dependence of SDR on SDRc
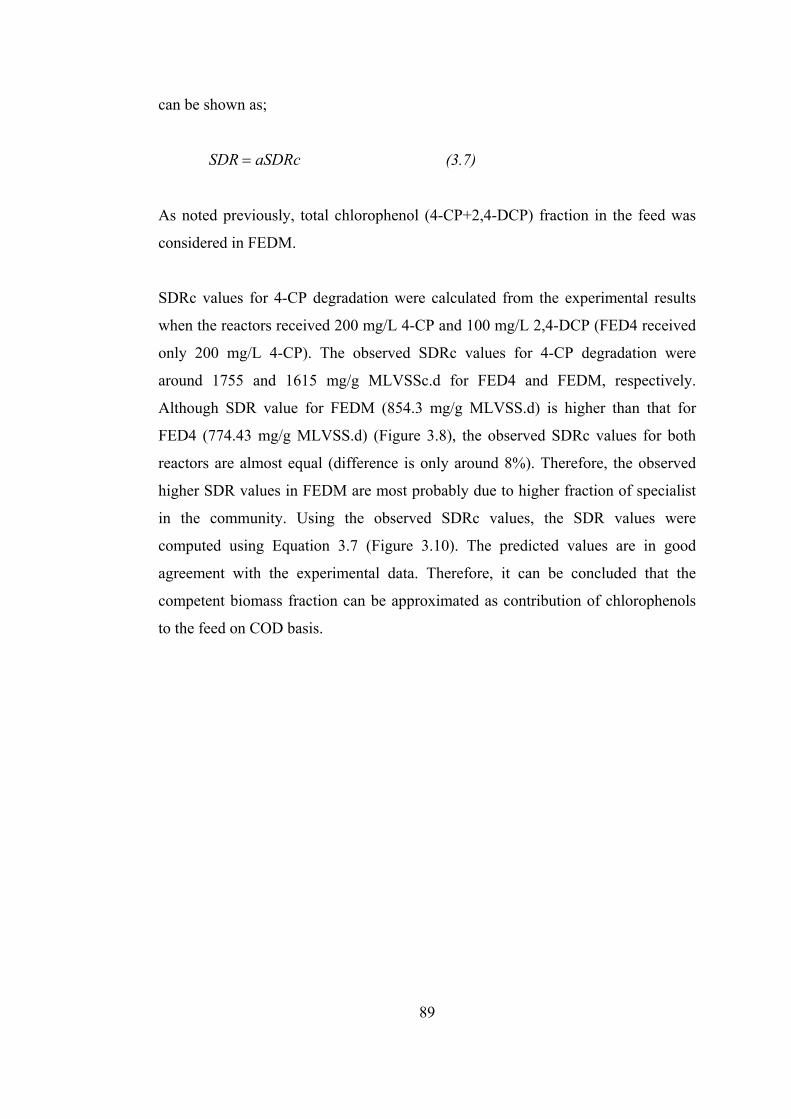
89
can be shown as;
aSDRcSDR = (3.7)
As noted previously, total chlorophenol (4-CP+2,4-DCP) fraction in the feed was
considered in FEDM.
SDRc values for 4-CP degradation were calculated from the experimental results
when the reactors received 200 mg/L 4-CP and 100 mg/L 2,4-DCP (FED4 received
only 200 mg/L 4-CP). The observed SDRc values for 4-CP degradation were
around 1755 and 1615 mg/g MLVSSc.d for FED4 and FEDM, respectively.
Although SDR value for FEDM (854.3 mg/g MLVSS.d) is higher than that for
FED4 (774.43 mg/g MLVSS.d) (Figure 3.8), the observed SDRc values for both
reactors are almost equal (difference is only around 8%). Therefore, the observed
higher SDR values in FEDM are most probably due to higher fraction of specialist
in the community. Using the observed SDRc values, the SDR values were
computed using Equation 3.7 (Figure 3.10). The predicted values are in good
agreement with the experimental data. Therefore, it can be concluded that the
competent biomass fraction can be approximated as contribution of chlorophenols
to the feed on COD basis.
90
Measured SDR (mg/g MLVSS.d)
0 200 400 600 800 1000
Cal
cula
ted
SDR
(mg/
g M
LVSS
.d)
0
200
400
600
800
1000FEDMFED4
Figure 3.10. Measured and calculated 4-CP SDR values for FEDM and FED4
3.1.2. Effect of Biogenic Substrate Concentration on Chlorophenols
Degradation Kinetics
A wastewater treatment plant generally receives influent with a mixture of
recalcitrant synthetic organic chemicals (SOCs) and biogenic substrates. This
means that SOCs and biogenic compounds often coexist in many wastewater
reactors. Interactions among these multiple substrates are complex, partially due to
the toxicity, competition for enzymes and cofactors (Hu et al. 2005b). The aim of
this set of experiments is to evaluate the effect of biogenic substrate concentration
on 4-CP and mixture of 4-CP and 2,4-DCP degradation kinetics using long term
operated instantaneously fed SBRs. In this context, biogenic substrate (peptone)
concentrations in FED4 and FEDM were decreased gradually from its initial value
of 400 mg/L and eventually chlorophenols were fed to the reactors as sole carbon
sources.
91
3.1.2.1. Effect of Biogenic Substrate Concentration on 4-CP Degradation
In this set of experiment, the effect of biogenic substrate concentration on 4-CP
degradation kinetics was investigated in FED4. In this context, peptone
concentration in the feed of the reactor was gradually decreased and following the
observation of steady state conditions, samples were drawn at different time
intervals from the reactor for the analyses of 4-CP, COD, MLVSS and CHMS.
Figure 3.11 shows 4-CP and COD degradation profiles at different initial biogenic
substrate concentrations. Complete 4-CP removal with no significant variation in
the degradation patterns and high COD removals (90-95%) were observed for all
studied conditions (Figure 3.11). The effluent COD concentration was about 28
mg/L in the absence of 4-CP and it changed between 30-50 mg/L in the presence of
4-CP with varying peptone concentrations. Low effluent COD concentrations were
the first evidence of complete 4-CP mineralization, which was supported by HPLC
analyses. Also, released chloride ion concentrations indicated 101±7% 4-CP
mineralization (data not shown).
After complete elimination of peptone from the feed, 400 mg/L peptone was
readded to the feed of the reactor. In Figure 3.11(b), data corresponding to 400
mg/L peptone 1 was observed at the first peptone addition, whereas, data belonging
to 400 mg/L peptone 2 was observed when peptone was readded after its complete
elimination. Variation in the 4-CP degradation patterns was not significant (Figure
3.11(b)) and the observed small change can be attributed to the natural variability of
culture over time. Ellis et al. (1996) reported that biodegradation kinetics might
show variation (standard deviation of ± 50%) even in long-term operated steady
state reactor due to natural variability of culture. In another study, Kaewpipat and
Grady (2002) observed significant difference over time in microbial communities
of even two identically operated activated sludge reactors. Similar to those findings,
isolation and identification studies in FED4 revealed change in dominant species
during the operation of the reactor. Pseudomonas vesicularis and Pseudomonas
stutzeri were dominant species when the reactor fed with 400 mg/L peptone,
92
whereas, Stenotrophomonas maltophilia and Pseudomonas fluorescens were the
dominant species when peptone was completely eliminated from the feed, i.e.,
chlorophenols were the sole carbon sources.
During the degradation of 4-CP, the concentration of CHMS increased
concomitantly, which reached its maximum when 4-CP was just completely
removed from the medium (Figure 3.12). After reaching peak value, its
concentration decreased and complete removal of the intermediate has been
observed. Similar patterns have also been observed for other peptone concentrations
(data not shown). Using the extinction coefficient of CHMS (Farrel and Quilty,
1999), its highest concentration was calculated between 7-10 mg/L for all studied
conditions. Therefore, CHMS accumulation was only 2.5-3.6% of its theoretical
value assuming complete transformation of 4-CP to CHMS. The measured COD
values were also in good agreement with this observation as the COD concentration
when CHMS reached its maximum was almost equal to the effluent COD value due
to the low concentration of CHMS. Therefore, simultaneous removal of 4-CP and
CHMS occurred in the reactor although CHMS removal rate was slightly lower,
which caused a slight accumulation in the medium.
93
Figure 3.11. Time course variations of 4-CP (a, b) and COD (c) at variable peptone
concentrations in FED4
94
Time (h)
0 5 10 15 20 25
C/C
max
0.0
0.2
0.4
0.6
0.8
1.0
1.2
4-CPCHMS
Figure 3.12. Time course variations of normalized 4-CP and CHMS in FED4
receiving 400 mg/L peptone
Almost identical Y values (0.220±0.009 (CV = 4.25%) mg MLVSS/mgCOD) were
observed when peptone concentration was between 400 and 100 mg/L and it
decreased slightly (0.154 ±0.005 mg MLVSS/mgCOD) with the complete
elimination of peptone from the feed (Figure 3.13(a)). The average Y value was
0.207±0.03 (CV = 14.49%) mg MLVSS/mgCOD for whole set of experiments.
Although biomass concentration decreased with decreasing peptone concentration,
degradation rates (DRs) of 4-CP did not correlate with peptone concentration
(Figure 3.13(b)) and the average value was 40.53±7.9 mg/L.h (CV=19.5%). Unlike
to DRs, specific 4-CP degradation rates (SDRs) increased when peptone
concentration was below 200 mg/L and the highest value was reached in the
absence of peptone.
The concentration of specialist biomass having ability to degrade 4-CP (competent
biomass) might remain constant, as 4-CP concentration in the feed was kept
constant. If only competent biomass is responsible for 4-CP degradation, DRs of 4-
CP should not change with peptone concentration, as competent biomass
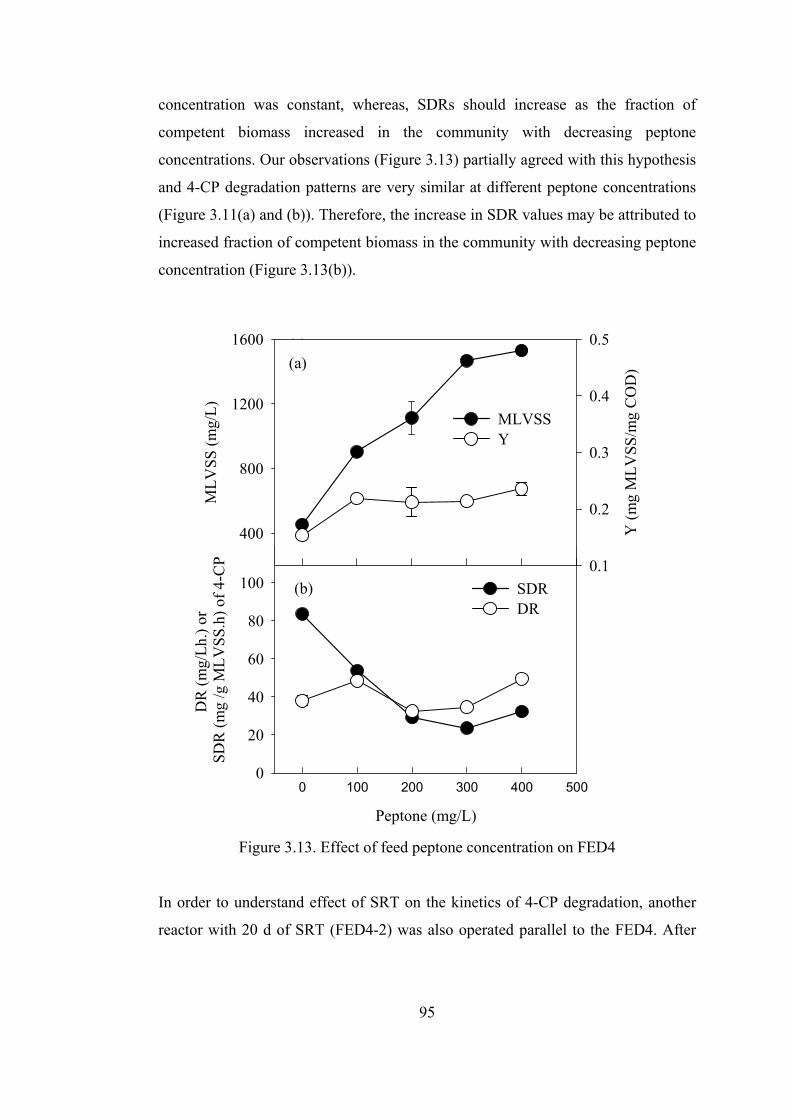
95
concentration was constant, whereas, SDRs should increase as the fraction of
competent biomass increased in the community with decreasing peptone
concentrations. Our observations (Figure 3.13) partially agreed with this hypothesis
and 4-CP degradation patterns are very similar at different peptone concentrations
(Figure 3.11(a) and (b)). Therefore, the increase in SDR values may be attributed to
increased fraction of competent biomass in the community with decreasing peptone
concentration (Figure 3.13(b)).
Peptone (mg/L)
0 100 200 300 400 500
DR
(mg/
Lh.)
or
SDR
(mg
/g M
LVSS
.h) o
f 4-C
P
0
20
40
60
80
100 SDRDR
(a)
(b)
MLV
SS (m
g/L)
400
800
1200
1600
Y (m
g M
LVSS
/mg
CO
D)
0.1
0.2
0.3
0.4
0.5
MLVSSY
(a)
Figure 3.13. Effect of feed peptone concentration on FED4
In order to understand effect of SRT on the kinetics of 4-CP degradation, another
reactor with 20 d of SRT (FED4-2) was also operated parallel to the FED4. After
96
any change in operational parameters, two SRTs were allowed for FED4-2 to reach
steady state conditions. Similar to FED4, complete 4-CP and high COD removals
were observed even in the absence of peptone as the influent COD decreased from
330 to around 21 mg/L and it was thought that the remaining COD was due to
biomass lyses products. Figure 3.14 depicts time course variations of 4-CP
concentrations at different initial peptone concentrations for FED4-2. Similar to
FED4, peptone did not affect the 4-CP degradation profile in FED4-2.
The effect of peptone concentration on the performance of FED4-2 was also
summarized in Figure 3.15. MLVSS concentrations decreased with decreasing
peptone concentration in the feed. SDR of 4-CP was observed to be almost constant
in the presence of peptone and it significantly increased with the complete
exclusion of peptone from the feed. Similar to FED4, almost identical Y values
(0.263±0.009 (CV=3.4%) mg MLVSS/mg COD) were observed when the feed
included peptone and the Y decreased to a value of 0.175±0.005 mg MLVSS/mg
COD with the complete elimination of peptone. The average Y value for whole set
of experiments was observed to be 0.234±0.04 (CV=18%) mg MLVSS/mg COD in
FED4-2. Although slightly lower values were observed in FED4, the Y values were
quite similar for both reactors (Figures 3.13 and 3.15).
The volumetric removal rate of 4-CP was around two times higher in FED4-2 than
FED4. It is known that a high steady state biomass concentration in the treatment
system usually exhibits high volumetric conversion capacity and the flexibility to
the fluctuated loading rates (Tomei et al., 2004).
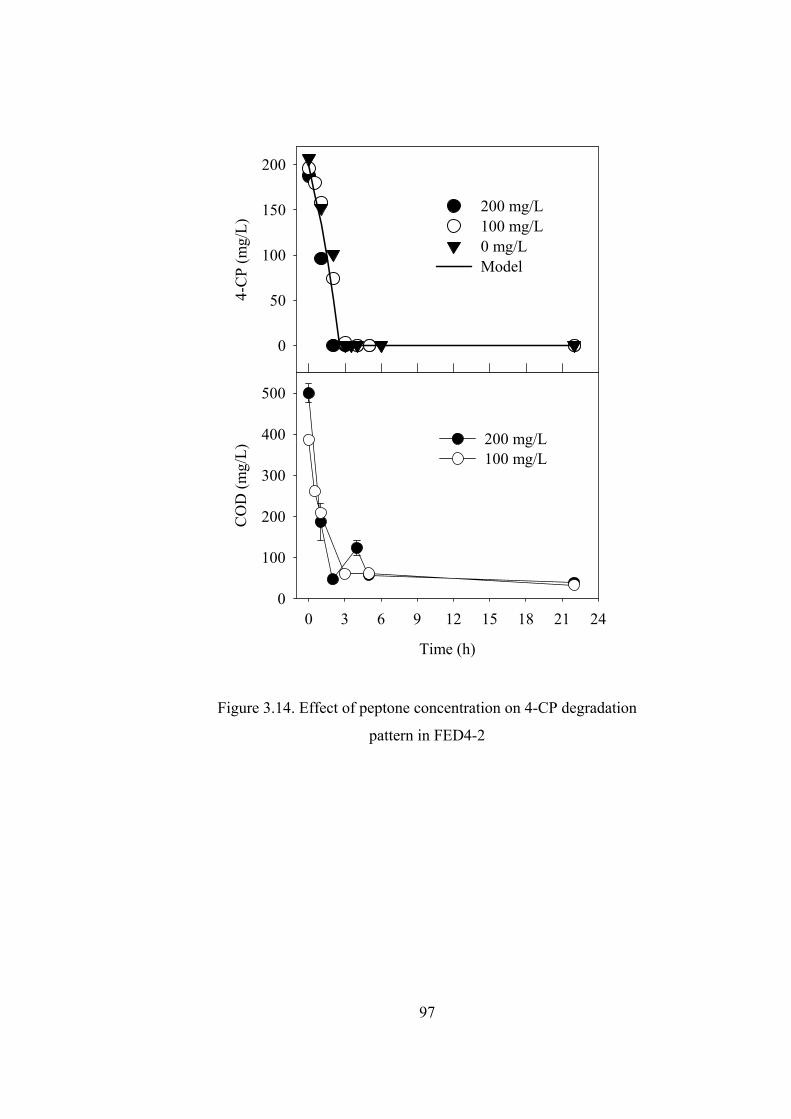
97
4-C
P (m
g/L)
0
50
100
150
200
200 mg/L100 mg/L0 mg/L Model
Time (h)
0 3 6 9 12 15 18 21 24
CO
D (m
g/L)
0
100
200
300
400
500
200 mg/L100 mg/L
Figure 3.14. Effect of peptone concentration on 4-CP degradation
pattern in FED4-2
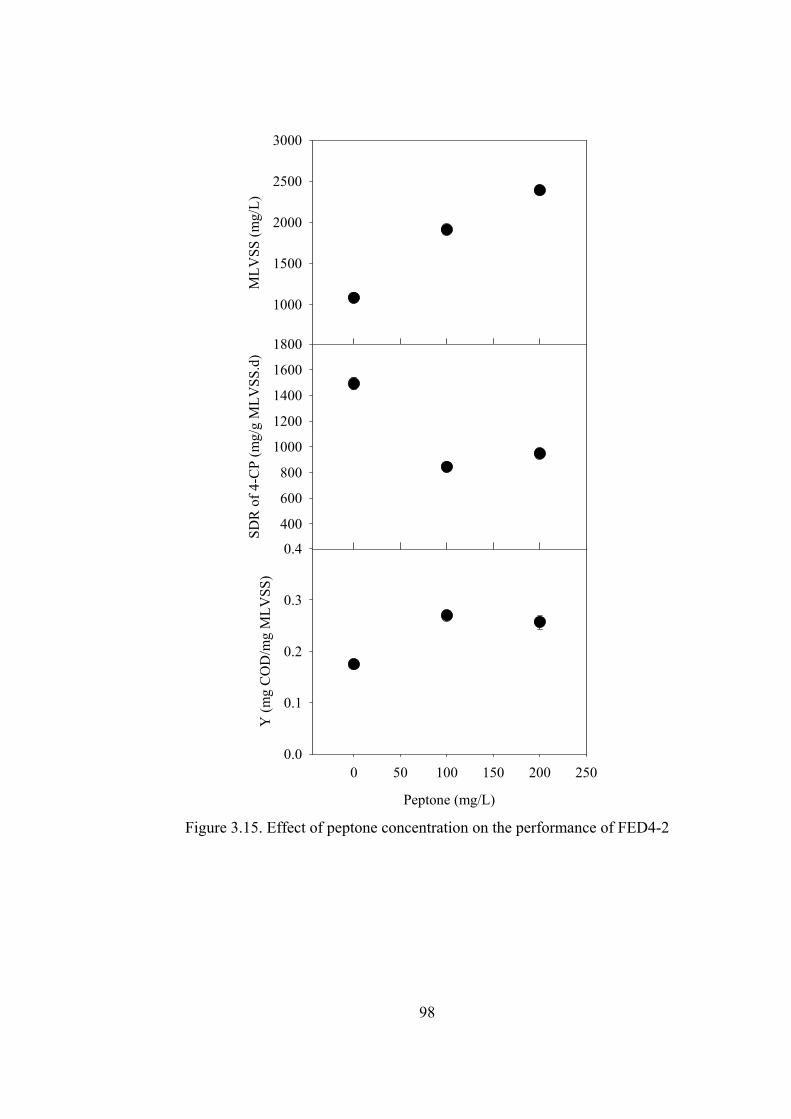
98
MLV
SS (m
g/L)
1000
1500
2000
2500
3000
Col 1 vs Col 4
Peptone (mg/L)
0 50 100 150 200 250
Y (m
g C
OD
/mg
MLV
SS)
0.0
0.1
0.2
0.3
0.4
SDR
of 4
-CP
(mg/
g M
LVSS
.d)
400
600
800
1000
1200
1400
1600
1800
Figure 3.15. Effect of peptone concentration on the performance of FED4-2
99
3.1.2.2. Effect of Biogenic Substrate Concentration on Degradation of 4-CP
and 2,4-DCP Mixture
Similar experiments were also conducted on FEDM in order to evaluate effect of
peptone concentration on biodegradation of chlorophenols mixture. In this context,
biogenic substrate (peptone) concentration in the instantaneously fed SBR was
decreased gradually from its initial value of 400 mg/L and eventually chlorophenols
have been fed to the reactors as sole carbon sources.
Figure 3.16 shows 4-CP, 2,4-DCP and COD degradation profiles at different initial
biogenic substrate concentrations. As can be seen from the figure, complete
chlorophenols removal and high COD removal efficiencies (90-95%) were
observed for all studied conditions and no significant change in degradation
patterns of 4-CP and 2,4-DCP were observed. In the absence of chlorophenols, the
effluent COD concentration was around 28 mg/L. In the presence of chlorophenols
with varying peptone concentrations, the effluent COD concentrations changed
between 30-50 mg/L suggesting that the remaining COD in the effluent of reactor
was due only to biomass lyses products, which may have increased slightly in the
presence of chlorophenols. The similar attribution was also done by Tomei (2005),
in a study investigating 4-NP degradation, who stated that residual COD in the
effluent was in the range of 10–20 mg/L, values reasonably attributable to biomass
lysis product. Therefore, low effluent COD concentrations were the first evidence
of complete removal of chlorophenols without any remaining by-product, which
was supported by HPLC analyses. Also, released chloride ion concentrations
indicated complete (101±7%) mineralization of chlorophenols (data not shown).
Figure 3.16 shows that 2,4-DCP was degraded first and 4-CP degradation began
only after complete removal of 2,4-DCP. It took 4-6 h for 2,4-DCP to be removed
completely, whereas it was 8-10 h for 4-CP. These results suggest that degradation
rates (DRs) of chlorophenols were independent of biogenic substrate concentration.
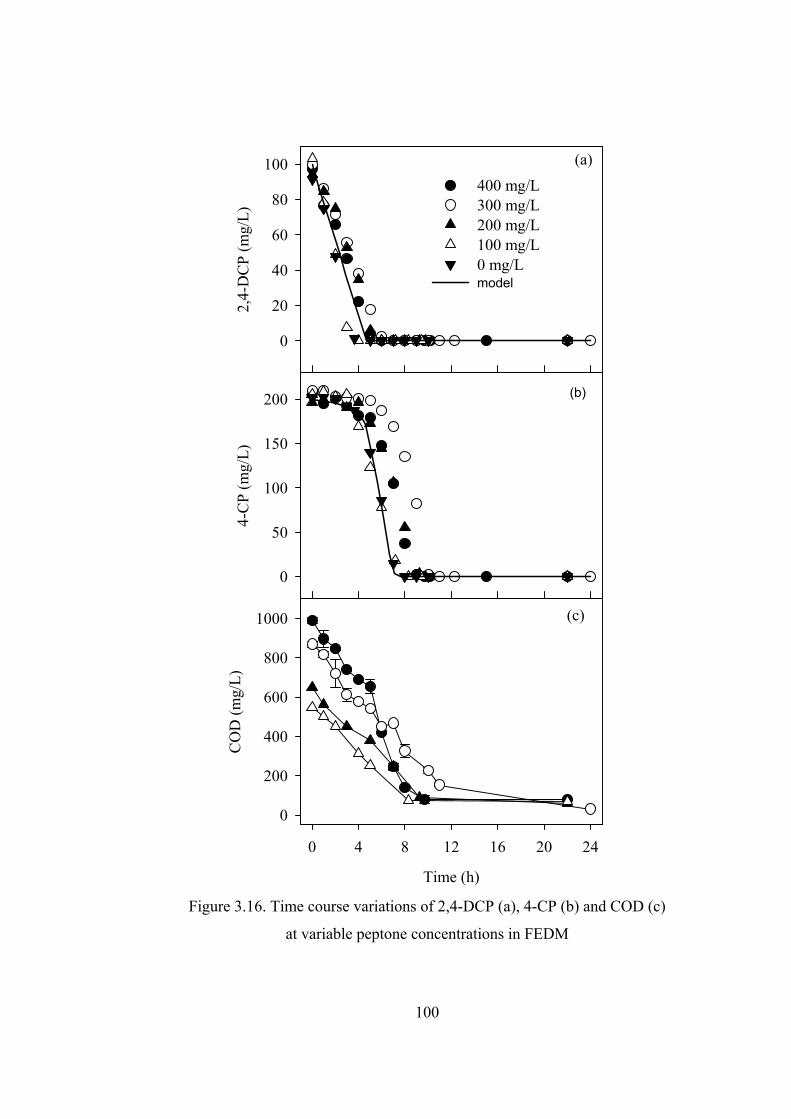
100
2,4-
DC
P (m
g/L)
0
20
40
60
80
100400 mg/L 300 mg/L200 mg/L100 mg/L0 mg/Lmodel
4-C
P (m
g/L)
0
50
100
150
200
Time (h)
0 4 8 12 16 20 24
CO
D (m
g/L)
0
200
400
600
800
1000
(a)
(b)
(c)
Figure 3.16. Time course variations of 2,4-DCP (a), 4-CP (b) and COD (c)
at variable peptone concentrations in FEDM
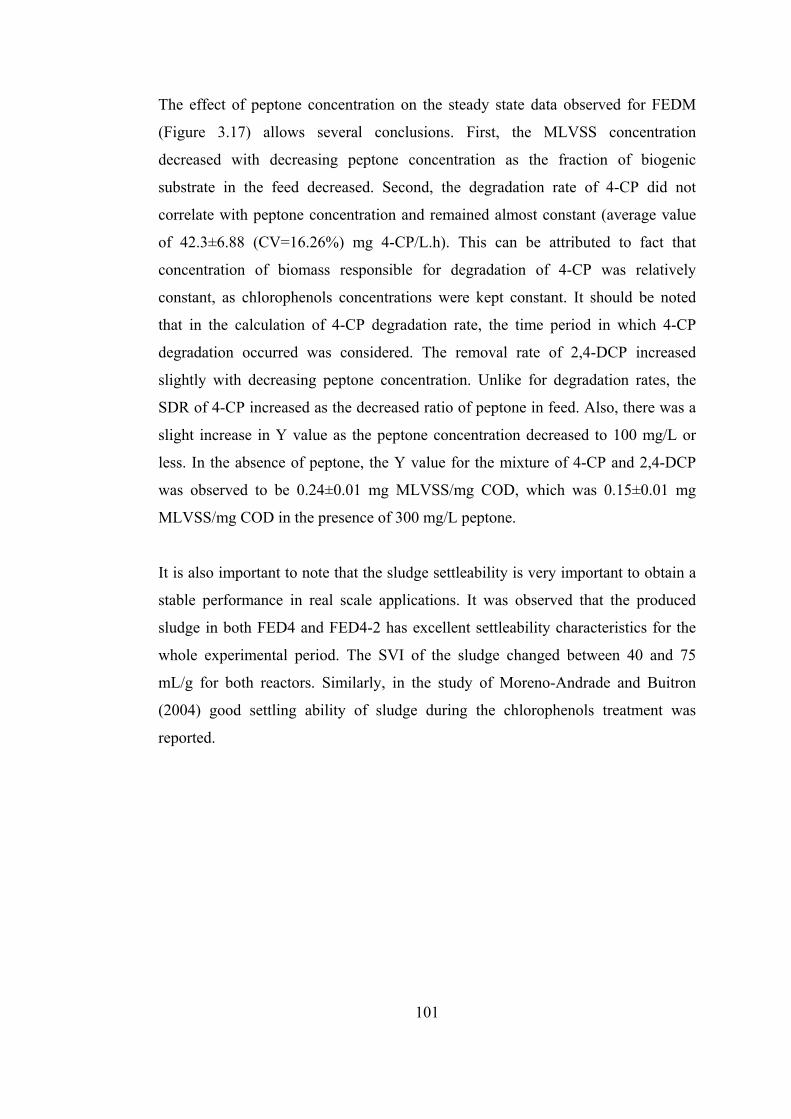
101
The effect of peptone concentration on the steady state data observed for FEDM
(Figure 3.17) allows several conclusions. First, the MLVSS concentration
decreased with decreasing peptone concentration as the fraction of biogenic
substrate in the feed decreased. Second, the degradation rate of 4-CP did not
correlate with peptone concentration and remained almost constant (average value
of 42.3±6.88 (CV=16.26%) mg 4-CP/L.h). This can be attributed to fact that
concentration of biomass responsible for degradation of 4-CP was relatively
constant, as chlorophenols concentrations were kept constant. It should be noted
that in the calculation of 4-CP degradation rate, the time period in which 4-CP
degradation occurred was considered. The removal rate of 2,4-DCP increased
slightly with decreasing peptone concentration. Unlike for degradation rates, the
SDR of 4-CP increased as the decreased ratio of peptone in feed. Also, there was a
slight increase in Y value as the peptone concentration decreased to 100 mg/L or
less. In the absence of peptone, the Y value for the mixture of 4-CP and 2,4-DCP
was observed to be 0.24±0.01 mg MLVSS/mg COD, which was 0.15±0.01 mg
MLVSS/mg COD in the presence of 300 mg/L peptone.
It is also important to note that the sludge settleability is very important to obtain a
stable performance in real scale applications. It was observed that the produced
sludge in both FED4 and FED4-2 has excellent settleability characteristics for the
whole experimental period. The SVI of the sludge changed between 40 and 75
mL/g for both reactors. Similarly, in the study of Moreno-Andrade and Buitron
(2004) good settling ability of sludge during the chlorophenols treatment was
reported.
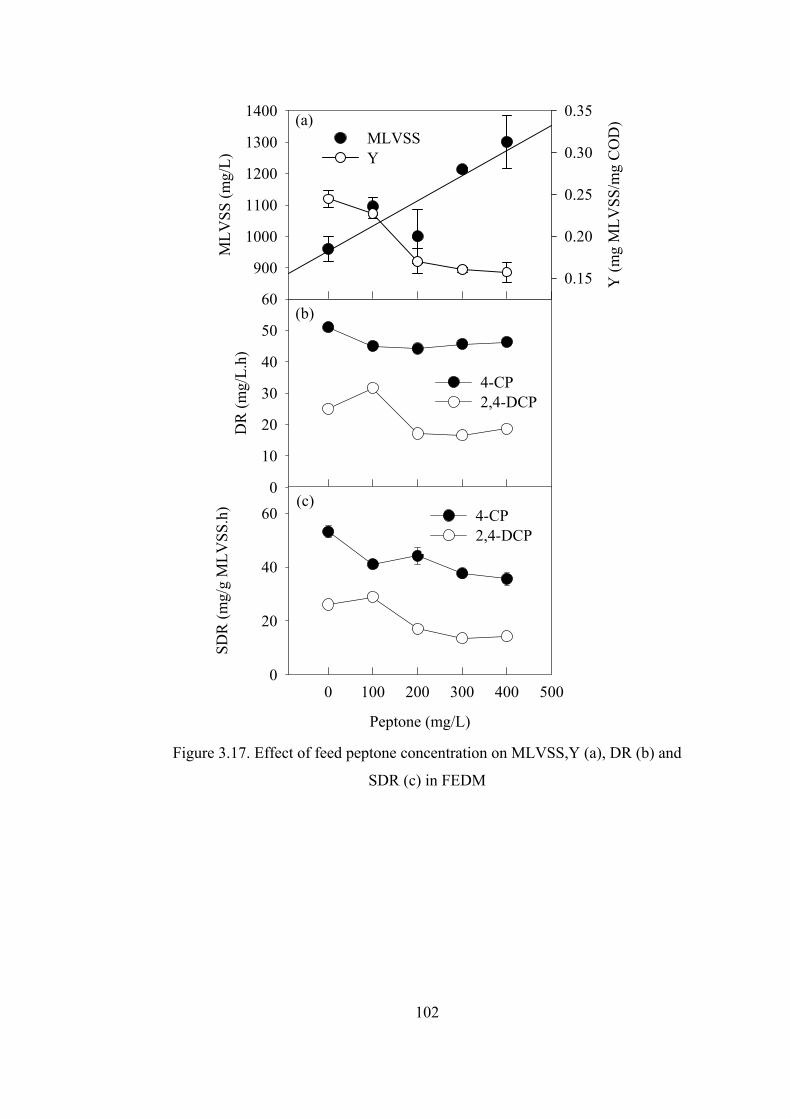
102
DR
(mg/
L.h)
0
10
20
30
40
50
60
4-CP2,4-DCP
Peptone (mg/L)
0 100 200 300 400 500
SDR
(mg/
g M
LVSS
.h)
0
20
40
60 4-CP2,4-DCP
MLV
SS (m
g/L)
900
1000
1100
1200
1300
1400
Y (m
g M
LVSS
/mg
CO
D)
0.15
0.20
0.25
0.30
0.35
MLVSSY
(a)
(b)
(c)
Figure 3.17. Effect of feed peptone concentration on MLVSS,Y (a), DR (b) and
SDR (c) in FEDM
103
3.1.2.3. Kinetics of Chlorophenols Degradation at Varying Biogenic Substrate
Concentrations
In the development of the model it was assumed that only competent biomass was
responsible for chlorophenols degradation, as explained before. Therefore, the
competent biomass can be estimated as:
aXX Tc .= (3.8)
Where, Xc is competent biomass concentration (mg MLVSSc/L), XT is total
biomass concentration (mg MLVSS/L), a is fraction of chlorophenol in the feed on
COD basis.
It should be noted that in the determination of competent biomass fraction having
ability to degrade 4-CP, total fraction of 4-CP and 2,4-DCP in the feed of FEDM
was taken into consideration as explained above. Based on this assumption, the DR
of 4-CP should be constant and independent on peptone concentration, whereas
SDR should increase with decreasing peptone concentration due to increase in
competent biomass fraction. Figure 3.18 depicts the change of SDRs of
chlorophenols for FEDM (Figure 3.18(a)) and FED4 (Figure 3.18(b)). SDRs
increased linearly with decreasing peptone concentration or increasing
chlorophenols fraction in the feed.
Figure 3.19 depicts the measured and estimated SDR values. In the estimation, the
specific degradation rate of competent biomass (SDRc) was first calculated using
experimental data obtained for 400 mg/L peptone and SDR values were calculated
using the following equation, assuming that SDRc does not depended on feed
peptone concentration:
aSDRSDR c= (3.9)
104
SDR
(mg/
g M
LVSS
.h)
0
20
40
60
804-CP2,4-DCP
r2=0.84
r2=074
COD of chlorophenols / Total COD
0.4 0.5 0.6 0.7 0.8 0.9 1.0 1.10
20
40
60
80
r2=0.89
(a)
(b)
Figure 3.18. SDRs of chlorophenols in FEDM (a) and FED4 (b) at different
chlorophenols fractions in the feed on COD basis
Data obtained for FEDM reactor gave better fit than FED4 to the experimental data.
The two data points below the predicted values in Figure 3.19 correspond to 100
and 0 mg/L of peptone concentrations. Although the measured SDRs are lower than
the predicted ones, the DRs at these peptone concentrations were higher compared
to those of higher peptone concentrations (Figure 3.17(b)). This may be due to
increased Y values and higher biomass concentrations being greater than expected;
on the basis of assumption, a constant competent biomass concentration was
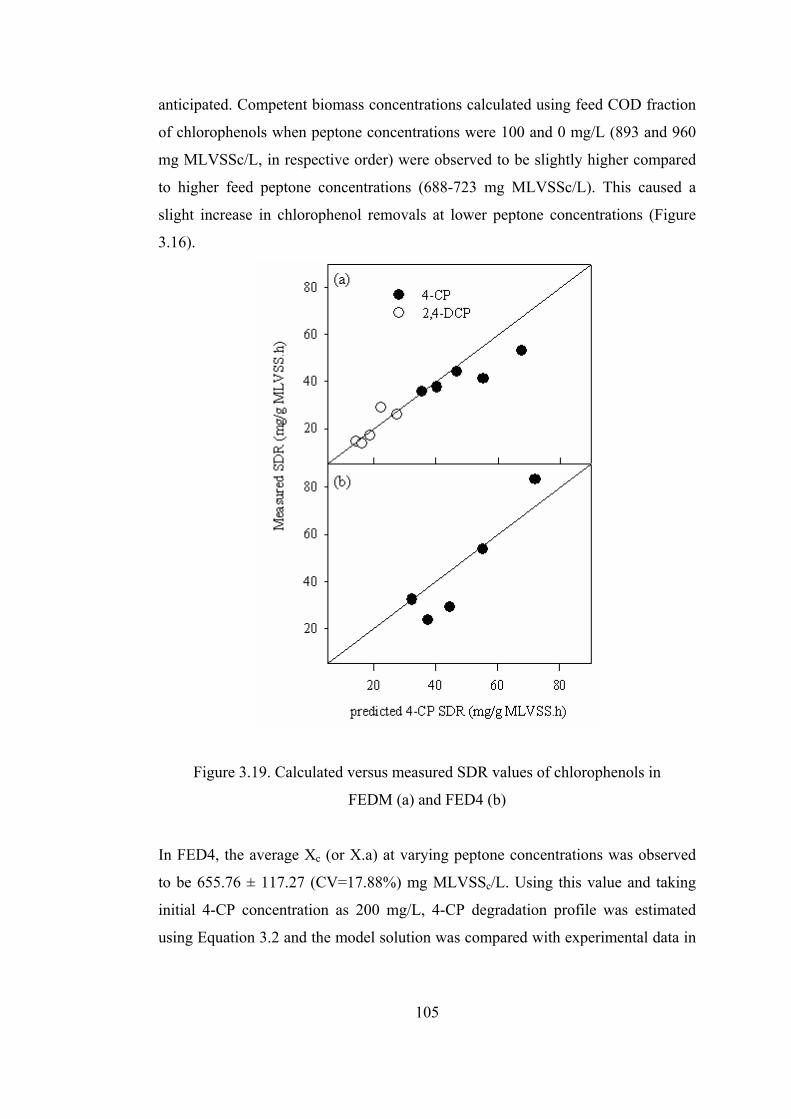
105
anticipated. Competent biomass concentrations calculated using feed COD fraction
of chlorophenols when peptone concentrations were 100 and 0 mg/L (893 and 960
mg MLVSSc/L, in respective order) were observed to be slightly higher compared
to higher feed peptone concentrations (688-723 mg MLVSSc/L). This caused a
slight increase in chlorophenol removals at lower peptone concentrations (Figure
3.16).
Figure 3.19. Calculated versus measured SDR values of chlorophenols in
FEDM (a) and FED4 (b)
In FED4, the average Xc (or X.a) at varying peptone concentrations was observed
to be 655.76 ± 117.27 (CV=17.88%) mg MLVSSc/L. Using this value and taking
initial 4-CP concentration as 200 mg/L, 4-CP degradation profile was estimated
using Equation 3.2 and the model solution was compared with experimental data in
106
Figure 3.11 (a). The predicted 4-CP degradation profile agreed well with the
experimental data, which shows that peptone concentration may not have
significant effect on 4-CP degradation profile. Similarly, in FED4-2, only
competent biomass was assumed to be responsible for 4-CP degradation and its
average concentration (aX) was calculated to be 1339±183 (CV=13.7%) mg
MLVSSc/L. It was observed that the competent biomass concentration in FED4-2
was almost two times of that observed for FED4. The model parameters developed
using the sludge from FED4 was used to predict time course 4-CP degradation
profile and the model gave good fit to the experimental data (Figure 3.14).
Table 3.2. Average competent biomass and DRs in FED4 and FEDM
Reactor Competent Biomass
(mg MLVSSc/l)
DR (mg/l.h)
FED4 655.76±117.27 40.53±7.9
FED4-2 1339±183 77.91±14
Using the average DRs and competent biomass concentrations (Table 3.2), the SDR
values on the basis of competent biomass (SDRc) were calculated as 58.11 and 61.8
mg/g.h for FED4-2 and FED4, respectively. It can be concluded that although DR
value observed in FED4-2 was around two times higher, SDRc values are quite
similar for both reactors. Therefore, the observed higher degradation rate value for
FEDM was only due to observed higher competent biomass concentration.
In the case of FEDM, the average competent biomass fraction (a.X or Xc) was
789.28±128.38 (CV=16.26%) mg MLVSSc/L. The average SDRc value for 2,4-
DCP was observed to be 27.3 ± 4.83 (CV=17.7%) mg/gMLVSSC.h. Using average
SDRc and Xc values, the average DR value was calculated as 21.54 mg/L.h. Using
the calculated average values of Xc and average DR of 2,4-DCP (k in Equation 3.6),
the 4-CP and 2,4-DCP degradation profiles were predicted using Equation 3.6 and
the model simulation was compared with the experimental data (Figure 3.16(a) and
107
(b)). The model well predicted 2,4-DCP degradation profile and experimental
results showed that peptone concentration did not have a significant effect on 2,4-
DCP degradation profile. In the case of 4-CP, although degradation profiles at
different feed peptone concentrations differed especially for feed peptone
concentration of 300 mg/L, the predicted 4-CP degradation profile gave acceptable
fit to the overall data. The change in degradation profiles may partially be due to
change in microbial community in the reactors over time. Ellis et al. (1996)
reported that biodegradation kinetics might show variation (standard deviation of ±
50%) even in long-term operated steady state reactor. In another study, Kaewpipat
and Grady (2002) observed significant differences over time in microbial
community of even two identically operated activated sludge reactors.
In summary, the effect of biogenic substrate concentration on 4-CP and mixture of
4-CP and 2,4-DCP degradation kinetics were extensively investigated in
instantaneously fed SBRs. High COD removal efficiencies and complete
chlorophenols removals were observed even in the absence of peptone. Strong
competitive inhibition of 2,4-DCP on 4-CP degradation was observed in FEDM.
Results showed that decreasing peptone concentration, when implemented
gradually, did not cause significant change in chlorophenol degradation patterns.
The reason of this observation is that only a fraction of biomass grown on
chlorophenols (competent biomass) was responsible for chlorophenols degradation.
Models developed based on this assumption gave good fit to the experimental data.
To our knowledge, this is the first study extensively evaluating the addition of 2,4-
DCP on the kinetics of 4-CP degradation at different biogenic substrate
concentrations in instantaneously fed SBRs operating in steady-state conditions. A
wastewater treatment plant generally receives influent with a mixture of SOCs and
biogenic substrates. Therefore, the results of the study can be used to design a
bioremediation system as well as to optimize operational conditions.
108
3.2. Kinetics of Chlorophenols Degradation in Batch Reactors
The kinetic parameters used during the modeling of chlorophenols degradation in
instantaneously fed SBRs (presented in previous sections) were obtained from
batch experiments. Therefore, this part presents the experimental data obtained
from the batch experiments and the development of the model using the
experimental data is discussed in detail.
3.2.1. Kinetics of 4-CP Degradation by Culture (Culture 4) Acclimated to 4-CP
In this set of experiments, 4-CP biodegradation kinetics was investigated in the
absence of peptone in batch reactors. The biomass used throughout the experiments
was obtained from the FED4 operated with feed composed of 4-CP and peptone
with respective concentrations of 200 and 400 mg/L. Experiments were conducted
keeping initial biomass concentration high enough (around 200 mg/L) to accelerate
degradation rate and avoid further acclimation of culture during lag phase, which
may affect the observed biokinetic parameters. Adaptation of cell at prolonged lag
phase during the phenol degradation was reported in the study of Sae´z and
Rittmann (1993). They reported that the acclimation of cell to high concentrations
of phenol during assays caused some change in kinetic parameters due to reduced
inhibitory effect. Hence, in order to avoid the change of culture history and
correctly estimate kinetic parameters, experiments were conducted at an initial
biomass concentration of 200 ± 10 mg/L, which gave 4-CP/biomass ratios between
0.05-0.94 on COD basis. After inoculation of biomass, reactors were operated in an
orbital shaking incubator at 200 rpm and 25±1°C. The reason of excluding peptone
is to avoid high amount of biomass production, which may change the original
culture taken from FED4.
Another significant point is that peptone was only used as a biogenic carbon source
and its addition is not necessary to initiate 4-CP degradation. Therefore, the
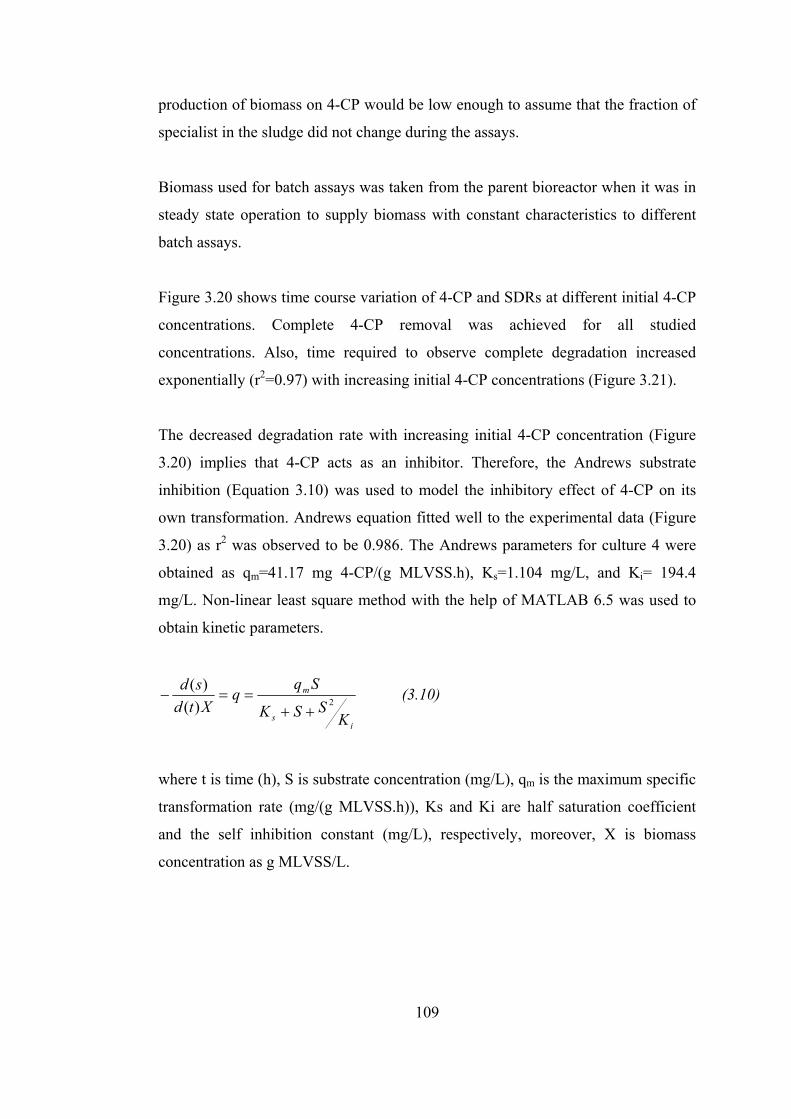
109
production of biomass on 4-CP would be low enough to assume that the fraction of
specialist in the sludge did not change during the assays.
Biomass used for batch assays was taken from the parent bioreactor when it was in
steady state operation to supply biomass with constant characteristics to different
batch assays.
Figure 3.20 shows time course variation of 4-CP and SDRs at different initial 4-CP
concentrations. Complete 4-CP removal was achieved for all studied
concentrations. Also, time required to observe complete degradation increased
exponentially (r2=0.97) with increasing initial 4-CP concentrations (Figure 3.21).
The decreased degradation rate with increasing initial 4-CP concentration (Figure
3.20) implies that 4-CP acts as an inhibitor. Therefore, the Andrews substrate
inhibition (Equation 3.10) was used to model the inhibitory effect of 4-CP on its
own transformation. Andrews equation fitted well to the experimental data (Figure
3.20) as r2 was observed to be 0.986. The Andrews parameters for culture 4 were
obtained as qm=41.17 mg 4-CP/(g MLVSS.h), Ks=1.104 mg/L, and Ki= 194.4
mg/L. Non-linear least square method with the help of MATLAB 6.5 was used to
obtain kinetic parameters.
is
m
KSSK
Sqq
Xtdsd
2)()(
++==− (3.10)
where t is time (h), S is substrate concentration (mg/L), qm is the maximum specific
transformation rate (mg/(g MLVSS.h)), Ks and Ki are half saturation coefficient
and the self inhibition constant (mg/L), respectively, moreover, X is biomass
concentration as g MLVSS/L.
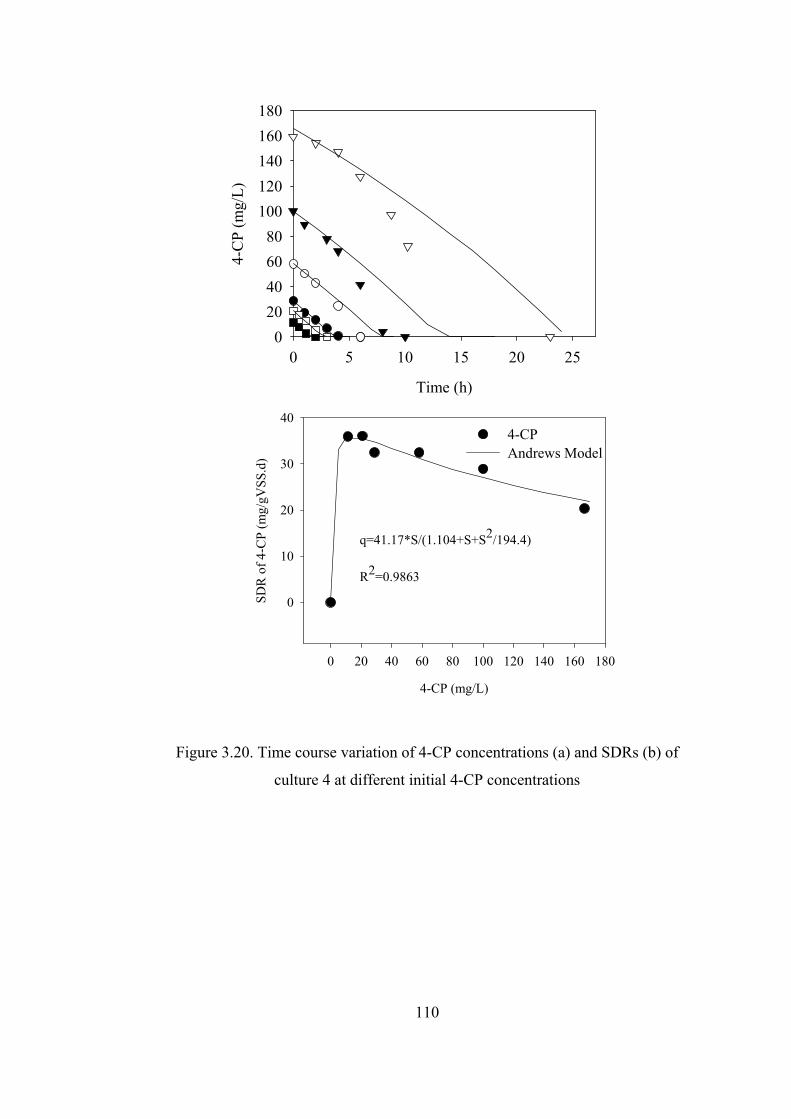
110
Time (h)
0 5 10 15 20 25
4-C
P (m
g/L)
020406080
100120140160180
4-CP (mg/L)
0 20 40 60 80 100 120 140 160 180
SDR
of 4
-CP
(mg/
gVSS
.d)
0
10
20
30
404-CPAndrews Model
q=41.17*S/(1.104+S+S2/194.4)
R2=0.9863
Figure 3.20. Time course variation of 4-CP concentrations (a) and SDRs (b) of
culture 4 at different initial 4-CP concentrations
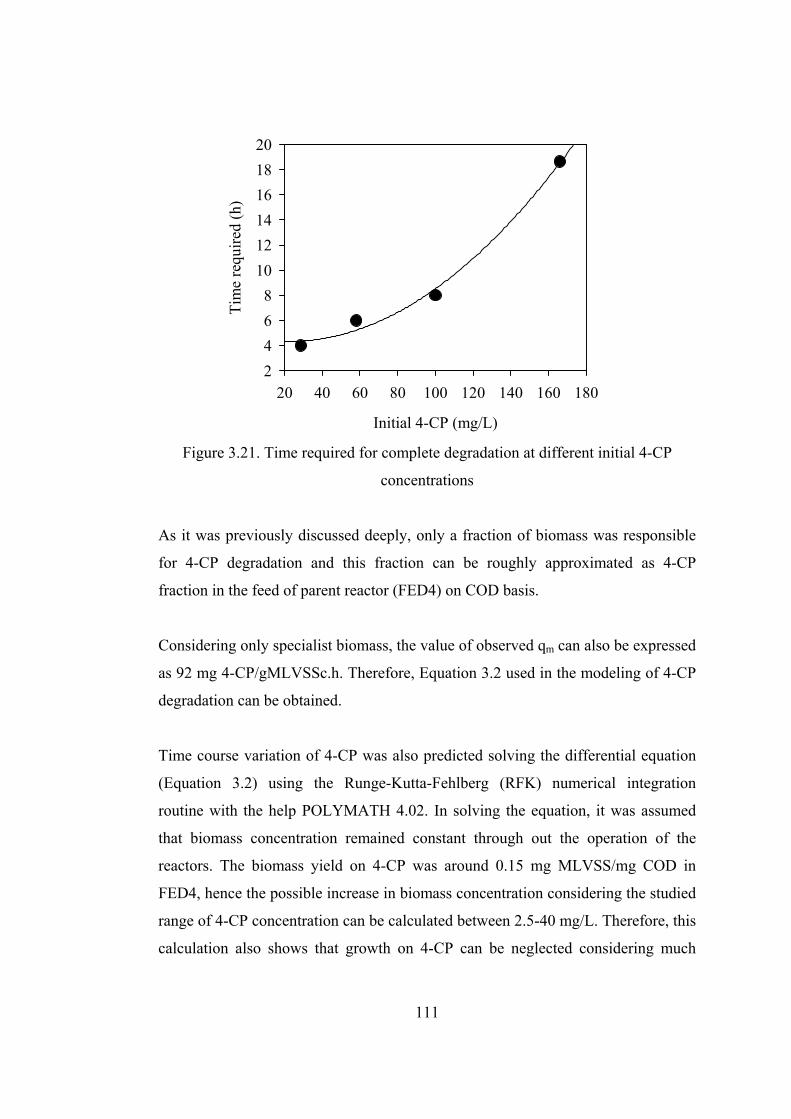
111
Initial 4-CP (mg/L)
20 40 60 80 100 120 140 160 180
Tim
e re
quire
d (h
)
2468
101214161820
Figure 3.21. Time required for complete degradation at different initial 4-CP
concentrations
As it was previously discussed deeply, only a fraction of biomass was responsible
for 4-CP degradation and this fraction can be roughly approximated as 4-CP
fraction in the feed of parent reactor (FED4) on COD basis.
Considering only specialist biomass, the value of observed qm can also be expressed
as 92 mg 4-CP/gMLVSSc.h. Therefore, Equation 3.2 used in the modeling of 4-CP
degradation can be obtained.
Time course variation of 4-CP was also predicted solving the differential equation
(Equation 3.2) using the Runge-Kutta-Fehlberg (RFK) numerical integration
routine with the help POLYMATH 4.02. In solving the equation, it was assumed
that biomass concentration remained constant through out the operation of the
reactors. The biomass yield on 4-CP was around 0.15 mg MLVSS/mg COD in
FED4, hence the possible increase in biomass concentration considering the studied
range of 4-CP concentration can be calculated between 2.5-40 mg/L. Therefore, this
calculation also shows that growth on 4-CP can be neglected considering much
112
higher initial biomass concentration (around 200 mg/L). The model fitted well to
the experimental results only if reactors received 4-CP below 100 mg/L (Figure
3.20). When initial concentration of 4-CP was 100 mg/L or higher, the model could
not predicted the experimental results satisfactorily. It was observed that applied
model over predicted 4-CP concentrations and 4-CP degradation rates were higher
than those predicted by the model. Although relatively high initial biomass
concentration was in batch reactors, a further acclimation of culture during the
degradation caused decrease in toxicity effect of 4-CP on biomass, which lead to
increase in the observed degradation rates. The qm value in Andrews equation was
observed to be 145.27 mg 4-CP/(g MLVSSc.h) for 100 mg/L 4-CP (Equation 3.11).
4.194104.1
27.145)()(
2SS
SXatdSd
++−= (3.11)
The model fitted well to the experimental data (Figure 3.22)
Time (h)
0 2 4 6 8 10 12
4-C
P (m
g/L)
0
20
40
60
80
100
120
4-CPmodel
Figure 3.22. Application of Andrews model (qm = 145.27 mg/ g MLVSSc.h) to
100 mg/L 4-CP
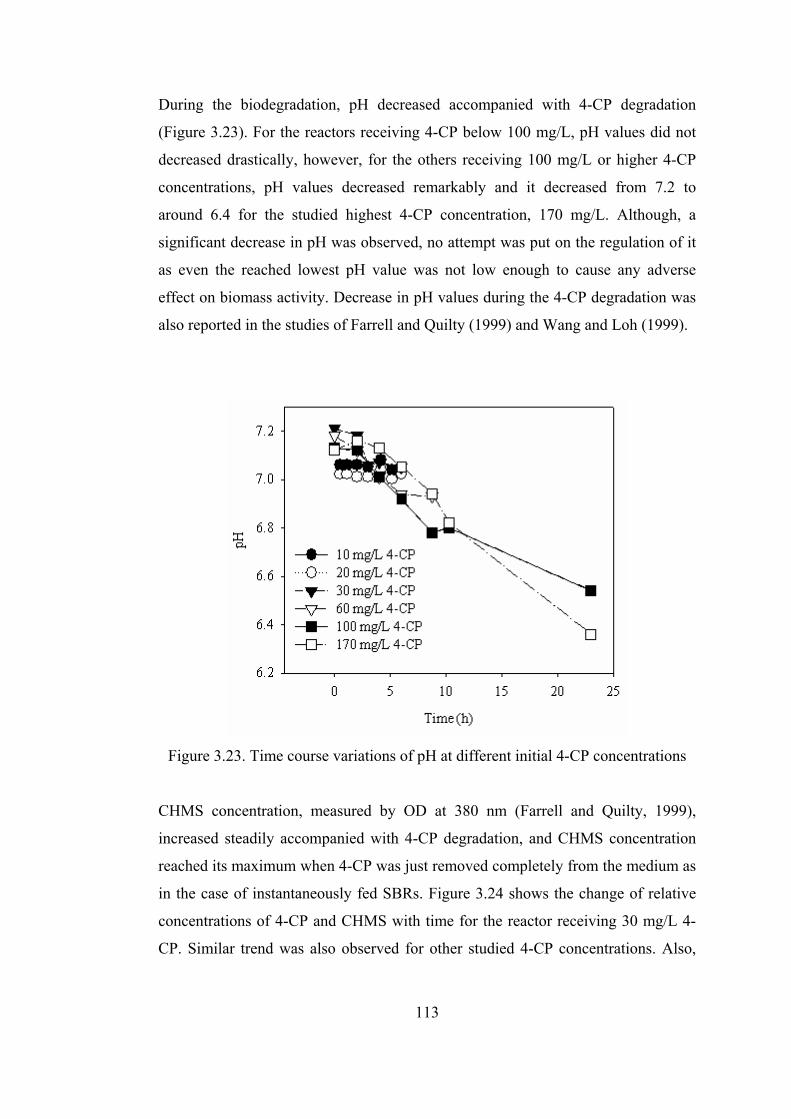
113
During the biodegradation, pH decreased accompanied with 4-CP degradation
(Figure 3.23). For the reactors receiving 4-CP below 100 mg/L, pH values did not
decreased drastically, however, for the others receiving 100 mg/L or higher 4-CP
concentrations, pH values decreased remarkably and it decreased from 7.2 to
around 6.4 for the studied highest 4-CP concentration, 170 mg/L. Although, a
significant decrease in pH was observed, no attempt was put on the regulation of it
as even the reached lowest pH value was not low enough to cause any adverse
effect on biomass activity. Decrease in pH values during the 4-CP degradation was
also reported in the studies of Farrell and Quilty (1999) and Wang and Loh (1999).
Figure 3.23. Time course variations of pH at different initial 4-CP concentrations
CHMS concentration, measured by OD at 380 nm (Farrell and Quilty, 1999),
increased steadily accompanied with 4-CP degradation, and CHMS concentration
reached its maximum when 4-CP was just removed completely from the medium as
in the case of instantaneously fed SBRs. Figure 3.24 shows the change of relative
concentrations of 4-CP and CHMS with time for the reactor receiving 30 mg/L 4-
CP. Similar trend was also observed for other studied 4-CP concentrations. Also,
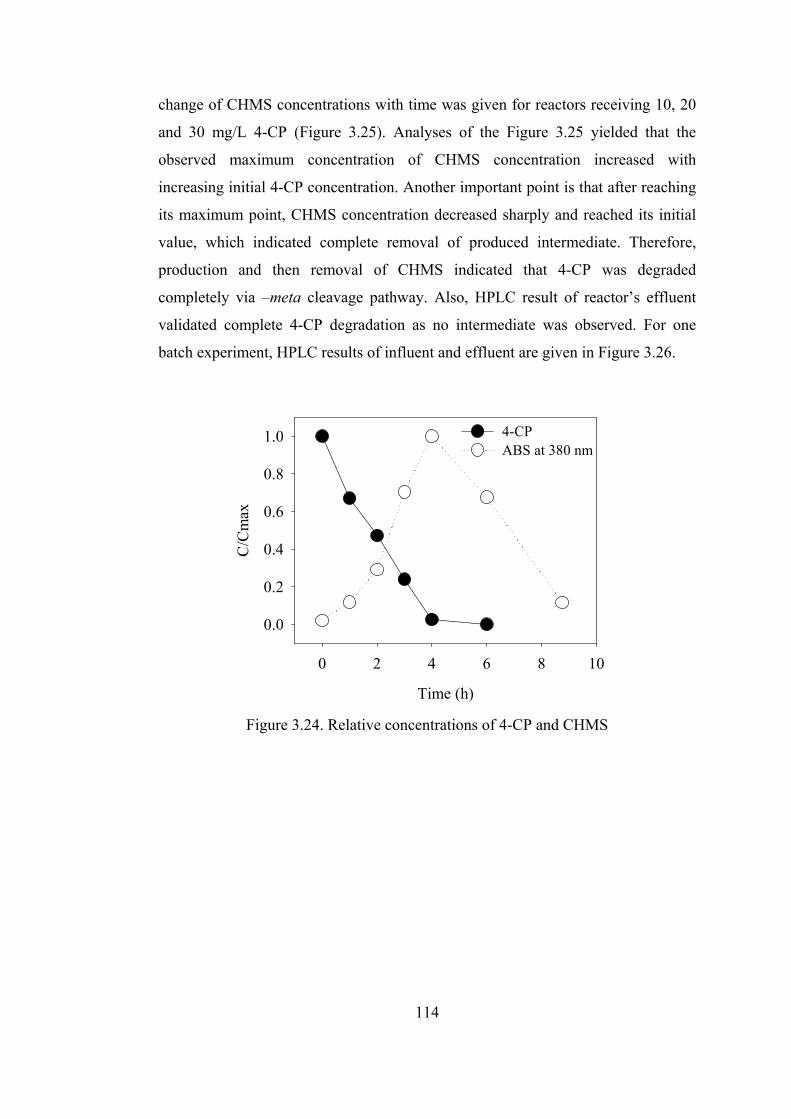
114
change of CHMS concentrations with time was given for reactors receiving 10, 20
and 30 mg/L 4-CP (Figure 3.25). Analyses of the Figure 3.25 yielded that the
observed maximum concentration of CHMS concentration increased with
increasing initial 4-CP concentration. Another important point is that after reaching
its maximum point, CHMS concentration decreased sharply and reached its initial
value, which indicated complete removal of produced intermediate. Therefore,
production and then removal of CHMS indicated that 4-CP was degraded
completely via –meta cleavage pathway. Also, HPLC result of reactor’s effluent
validated complete 4-CP degradation as no intermediate was observed. For one
batch experiment, HPLC results of influent and effluent are given in Figure 3.26.
Time (h)
0 2 4 6 8 10
C/C
max
0.0
0.2
0.4
0.6
0.8
1.0 4-CPABS at 380 nm
Figure 3.24. Relative concentrations of 4-CP and CHMS
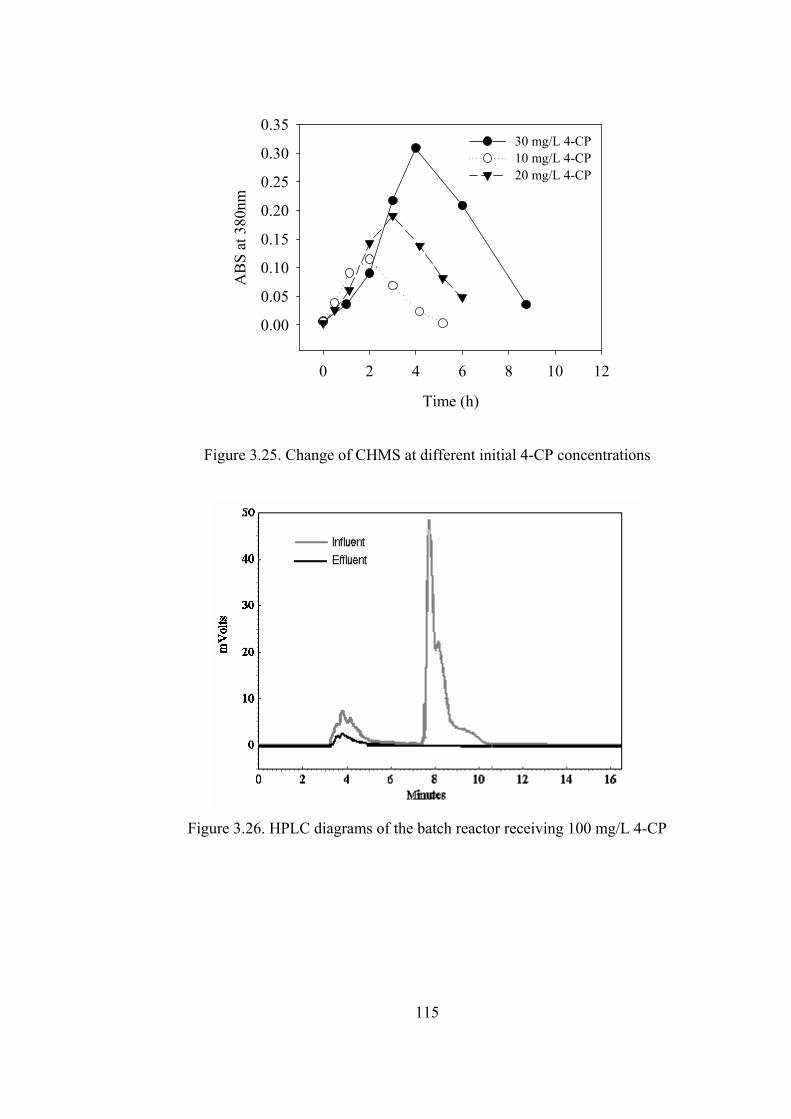
115
Time (h)
0 2 4 6 8 10 12
AB
S at
380
nm
0.00
0.05
0.10
0.15
0.20
0.25
0.30
0.3530 mg/L 4-CP10 mg/L 4-CP20 mg/L 4-CP
Figure 3.25. Change of CHMS at different initial 4-CP concentrations
Figure 3.26. HPLC diagrams of the batch reactor receiving 100 mg/L 4-CP
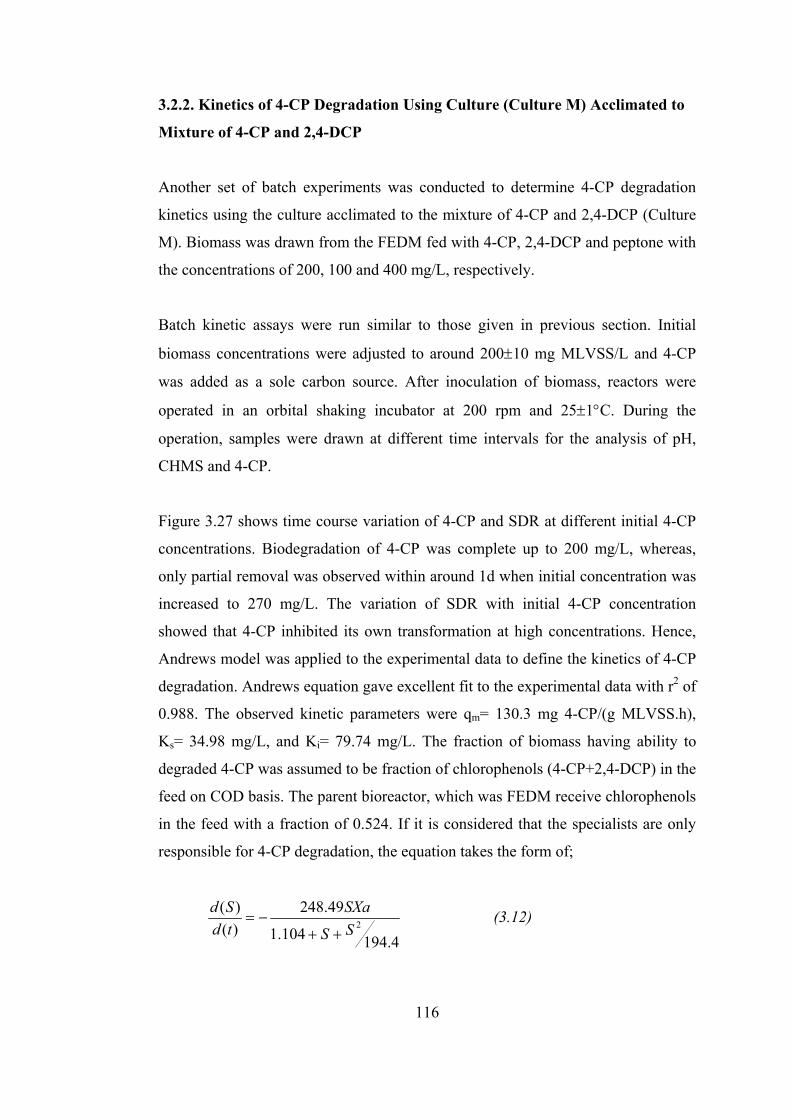
116
3.2.2. Kinetics of 4-CP Degradation Using Culture (Culture M) Acclimated to
Mixture of 4-CP and 2,4-DCP
Another set of batch experiments was conducted to determine 4-CP degradation
kinetics using the culture acclimated to the mixture of 4-CP and 2,4-DCP (Culture
M). Biomass was drawn from the FEDM fed with 4-CP, 2,4-DCP and peptone with
the concentrations of 200, 100 and 400 mg/L, respectively.
Batch kinetic assays were run similar to those given in previous section. Initial
biomass concentrations were adjusted to around 200±10 mg MLVSS/L and 4-CP
was added as a sole carbon source. After inoculation of biomass, reactors were
operated in an orbital shaking incubator at 200 rpm and 25±1°C. During the
operation, samples were drawn at different time intervals for the analysis of pH,
CHMS and 4-CP.
Figure 3.27 shows time course variation of 4-CP and SDR at different initial 4-CP
concentrations. Biodegradation of 4-CP was complete up to 200 mg/L, whereas,
only partial removal was observed within around 1d when initial concentration was
increased to 270 mg/L. The variation of SDR with initial 4-CP concentration
showed that 4-CP inhibited its own transformation at high concentrations. Hence,
Andrews model was applied to the experimental data to define the kinetics of 4-CP
degradation. Andrews equation gave excellent fit to the experimental data with r2 of
0.988. The observed kinetic parameters were qm= 130.3 mg 4-CP/(g MLVSS.h),
Ks= 34.98 mg/L, and Ki= 79.74 mg/L. The fraction of biomass having ability to
degraded 4-CP was assumed to be fraction of chlorophenols (4-CP+2,4-DCP) in the
feed on COD basis. The parent bioreactor, which was FEDM receive chlorophenols
in the feed with a fraction of 0.524. If it is considered that the specialists are only
responsible for 4-CP degradation, the equation takes the form of;
4.194104.1
49.248)()(
2SS
SXatdSd
++−= (3.12)
117
Where, a is fraction of chlorophenols in feed on COD basis. As it was noted above,
for this set of experiments, the value of a was 0.524. The observed kinetic
parameters for two different mixed cultures were summarized in Table 3.3. It will
be useful to note again, the qm values were calculated considering only specialist
biomass in the sludge.
Time (h)
0 5 10 15 20 25
4-C
P (m
g/L)
0
50
100
150
200
250
30030 mg/L 50 mg/L 80 mg/L100 mg/L160 mg/L215 mg/L267 mg/L
4-CP (mg/L)
0 50 100 150 200 250 300
SDR
of 4
-CP
(mg4
-CP/
gVSS
.h)
0
10
20
30
40
50
60
70ExperimentAndrews model
q=130.3*S/(34.98+S+S2/79.74)
R2=0.988
Figure 3.27. Time course variation of 4-CP concentrations and SDRs of culture M
at different initial 4-CP concentrations
118
Table 3.3. Andrews kinetic parameters of 4-CP degradation
Culture qm
(mg 4-CP/(g MLVSSc.h))
Ks
(mg/L)
Ki
(mg/L) R2
Culture 4 92 1.104 194.4 0.986
Culture M 248.49 34.98 79.74 0.988
Analyses of the table can yield some significant conclusions. First of all, 4-CP
degradation can be sufficiently well described using Andrews equation for both
cultures as r2 values were higher than 0.98. Second conclusion is that the maximum
specific degradation rate of 4-CP with culture M is almost three times higher
compared to that of culture 4. Third, although culture M has higher maximum SDR,
Culture 4 has the higher sensitivity due to lower Ks value.
For self-inhibitory compounds, there is a critical substrate
concentration, Iscrt KKS = , above which the substrate removal rate falls (Tomei
et al., 2004). Therefore, the critical 4-CP concentrations for culture M and culture 4
were observed to be 52.81 and 14.65 mg/L. Attained maximum degradation rates at
critical substrate concentrations can, therefore, be calculated as around 56 and 36
mg 4-CP/(g MLVSS.h) for culture M and 4, respectively. Therefore, the
degradation rate of 4-CP at critical concentration was around 1.5 times higher in the
case of culture M. During the incubation of the reactors, pH of the medium
decreased slightly, especially at high initial 4-CP concentrations (Figure 3.28). The
lowest pH at the end of the incubation was observed to be around 6.5 and pH
adjustment was not required.
119
Figure 3.28. Time course variations of pH at different initial 4-CP concentrations
In addition, variation of CHMS concentrations was followed at different initial 4-
CP concentrations. Similar to the results obtained in the case of culture 4, CHMS
concentration increased to a peak value and then it decreased to its original value,
which indicated complete mineralization of 4-CP. Also, peak value of CHMS
increased with increasing initial 4-CP concentration (Figure 3.29).
3.2.3. Effect of 2,4-DCP on 4-CP Degradation Kinetics of 4-CP Acclimated
culture (Culture 4)
It is known that chlorophenols are generally found in mixtures in the contaminated
sites or industrial wastewaters, hence, studying the ability of the culture towards the
degradation of chlorophenols mixtures, rather than a single compound, will be more
meaningful and informative. In this respect, the effect of a sudden appearance of a
compound (2,4-DCP), which has similar structure to the target compound, on the 4-
CP degradation ability of culture was deeply investigated.
120
Figure 3.29. Time course variations of normalized 4-CP and CHMS concentrations
for 50 and 100 mg/L initial 4-CP concentrations
Acclimated culture (culture 4) for batch assays was obtained from the
instantaneously fed SBR receiving 220 mg/L 4-CP and 400 mg/L peptone (FED4).
Chlorophenols were supplied to batch reactors as a sole carbon source. To explore
the presence of 2,4-DCP on 4-CP degradation kinetics, 4-CP concentration was
kept constant at 100 mg/L and 2,4-DCP concentrations were varied. Biomass taken
from FED4 was washed two times and then batch reactors were inoculated to have
an initial MLVSS concentration close to 250 mg/L.
Control reactor results showed that the removal of 4-CP and 2,4-DCP via
volatilization within the incubation period was negligible (data not shown). Also,
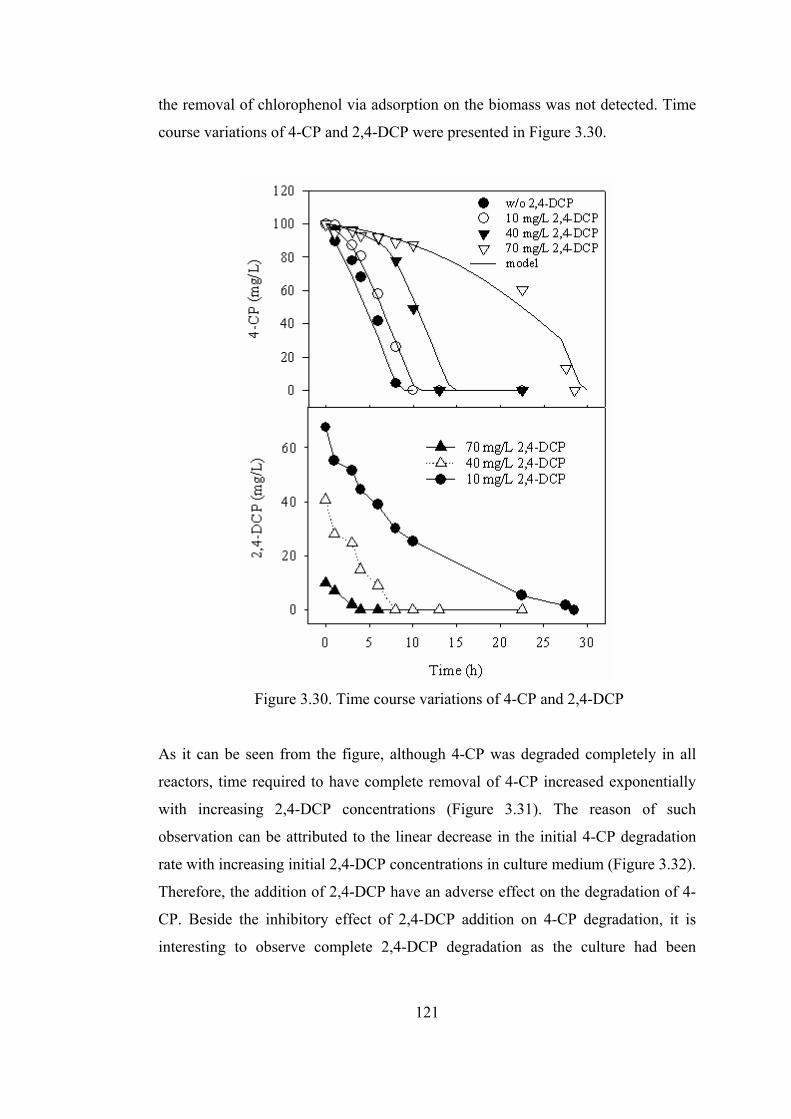
121
the removal of chlorophenol via adsorption on the biomass was not detected. Time
course variations of 4-CP and 2,4-DCP were presented in Figure 3.30.
Figure 3.30. Time course variations of 4-CP and 2,4-DCP
As it can be seen from the figure, although 4-CP was degraded completely in all
reactors, time required to have complete removal of 4-CP increased exponentially
with increasing 2,4-DCP concentrations (Figure 3.31). The reason of such
observation can be attributed to the linear decrease in the initial 4-CP degradation
rate with increasing initial 2,4-DCP concentrations in culture medium (Figure 3.32).
Therefore, the addition of 2,4-DCP have an adverse effect on the degradation of 4-
CP. Beside the inhibitory effect of 2,4-DCP addition on 4-CP degradation, it is
interesting to observe complete 2,4-DCP degradation as the culture had been
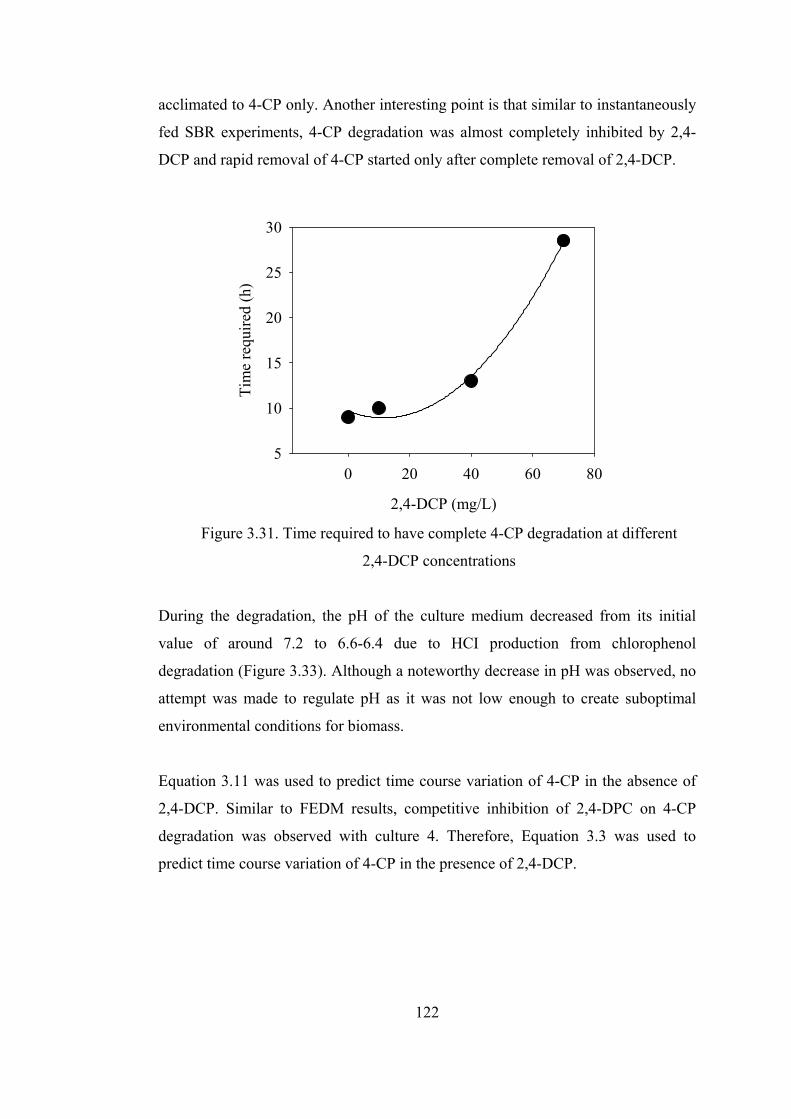
122
acclimated to 4-CP only. Another interesting point is that similar to instantaneously
fed SBR experiments, 4-CP degradation was almost completely inhibited by 2,4-
DCP and rapid removal of 4-CP started only after complete removal of 2,4-DCP.
2,4-DCP (mg/L)
0 20 40 60 80
Tim
e re
quire
d (h
)
5
10
15
20
25
30
Figure 3.31. Time required to have complete 4-CP degradation at different
2,4-DCP concentrations
During the degradation, the pH of the culture medium decreased from its initial
value of around 7.2 to 6.6-6.4 due to HCI production from chlorophenol
degradation (Figure 3.33). Although a noteworthy decrease in pH was observed, no
attempt was made to regulate pH as it was not low enough to create suboptimal
environmental conditions for biomass.
Equation 3.11 was used to predict time course variation of 4-CP in the absence of
2,4-DCP. Similar to FEDM results, competitive inhibition of 2,4-DPC on 4-CP
degradation was observed with culture 4. Therefore, Equation 3.3 was used to
predict time course variation of 4-CP in the presence of 2,4-DCP.
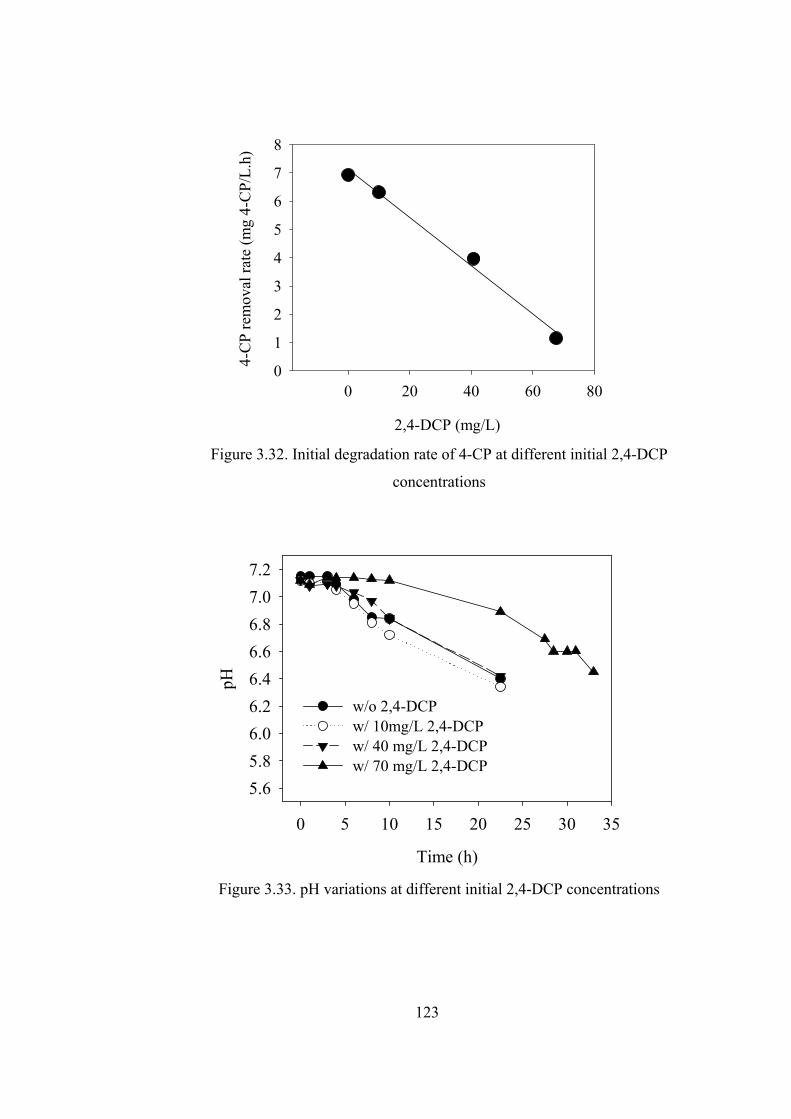
123
2,4-DCP (mg/L)
0 20 40 60 80
4-C
P re
mov
al ra
te (m
g 4-
CP/
L.h)
0
1
2
3
4
5
6
7
8
Figure 3.32. Initial degradation rate of 4-CP at different initial 2,4-DCP
concentrations
Time (h)
0 5 10 15 20 25 30 35
pH
5.65.86.06.26.46.66.87.07.2
w/o 2,4-DCPw/ 10mg/L 2,4-DCPw/ 40 mg/L 2,4-DCPw/ 70 mg/L 2,4-DCP
Figure 3.33. pH variations at different initial 2,4-DCP concentrations
124
The values of qm, Ks and Ki were previously estimated (Equation 3.11) in the
absence of 2,4-DCP. Therefore, Kii value should be predicted to model time course
variations of 4-CP concentrations. To minimize the errors in the estimation of Kii
value, which determines the toxic effect of 2,4-DCP on 4-CP degradation,
degradation of 2,4-DCP was not modeled. Hence, the best fitting equation to the
experimental data of 2,4-DCP was used in model equation. The value of Kii was
determined as 0.038 mg/L (Equation 3.13) using the data obtained for 10 mg/L 2,4-
DCP and the model was validated using data obtained for other 2,4-DCP
concentrations. Observed differential equations were numerically solved using
POLYMATH 4.02. The program used the Runge-Kutta-Fehlberg (RFK) numerical
integration routine.
4.194104.1)038.0
1(
27.145)()(
2SSISXa
tdSd
+++−= (3.13)
It was observed that the developed model gave excellent fit to the experimental data
as model tracked experimental data well (Figure 3.30). Hence, the effect of 2,4-
DCP on the 4-CP degradation by culture 4 was modeled and the time course
variation of 4-CP concentrations was estimated accurately even in the presence of
2,4-DCP. It is important to note that the value of Kii for culture M was 0.17 mg/L
(Equation 3.6), which is almost one order of magnitude higher than that for culture
4 (0.038 mg/L). Therefore, it can be concluded that 2,4-DCP is more toxic to
culture 4 compared to culture M, as culture 4 was acclimated to 4-CP only.
In addition to chlorophenol concentrations, time course variations of CHMS were
followed and it was observed that as 4-CP was removed from the medium,
concentration of CHMS increased (Figure 3.34), which reached the peak value
when 4-CP was just completely removed. After reaching a peak value, CHMS
concentrations began to decrease sharply and finally complete CHMS removal was
observed, which means that chlorophenols degraded without remaining any
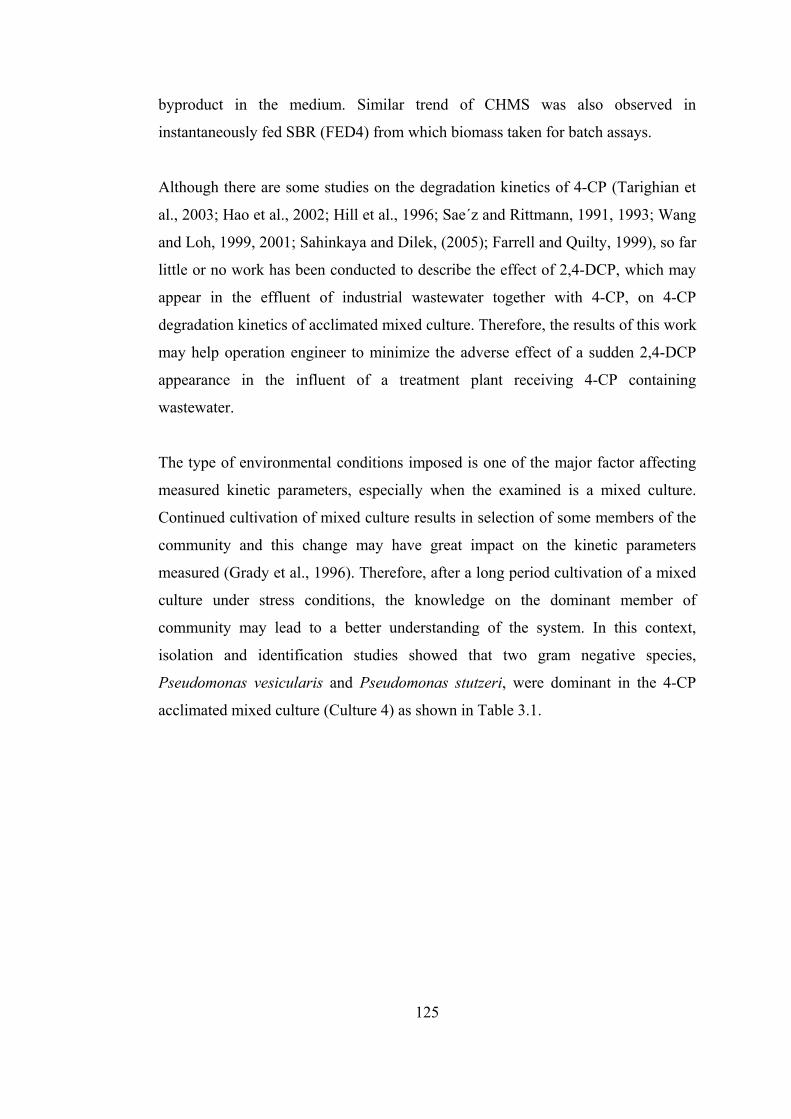
125
byproduct in the medium. Similar trend of CHMS was also observed in
instantaneously fed SBR (FED4) from which biomass taken for batch assays.
Although there are some studies on the degradation kinetics of 4-CP (Tarighian et
al., 2003; Hao et al., 2002; Hill et al., 1996; Sae´z and Rittmann, 1991, 1993; Wang
and Loh, 1999, 2001; Sahinkaya and Dilek, (2005); Farrell and Quilty, 1999), so far
little or no work has been conducted to describe the effect of 2,4-DCP, which may
appear in the effluent of industrial wastewater together with 4-CP, on 4-CP
degradation kinetics of acclimated mixed culture. Therefore, the results of this work
may help operation engineer to minimize the adverse effect of a sudden 2,4-DCP
appearance in the influent of a treatment plant receiving 4-CP containing
wastewater.
The type of environmental conditions imposed is one of the major factor affecting
measured kinetic parameters, especially when the examined is a mixed culture.
Continued cultivation of mixed culture results in selection of some members of the
community and this change may have great impact on the kinetic parameters
measured (Grady et al., 1996). Therefore, after a long period cultivation of a mixed
culture under stress conditions, the knowledge on the dominant member of
community may lead to a better understanding of the system. In this context,
isolation and identification studies showed that two gram negative species,
Pseudomonas vesicularis and Pseudomonas stutzeri, were dominant in the 4-CP
acclimated mixed culture (Culture 4) as shown in Table 3.1.
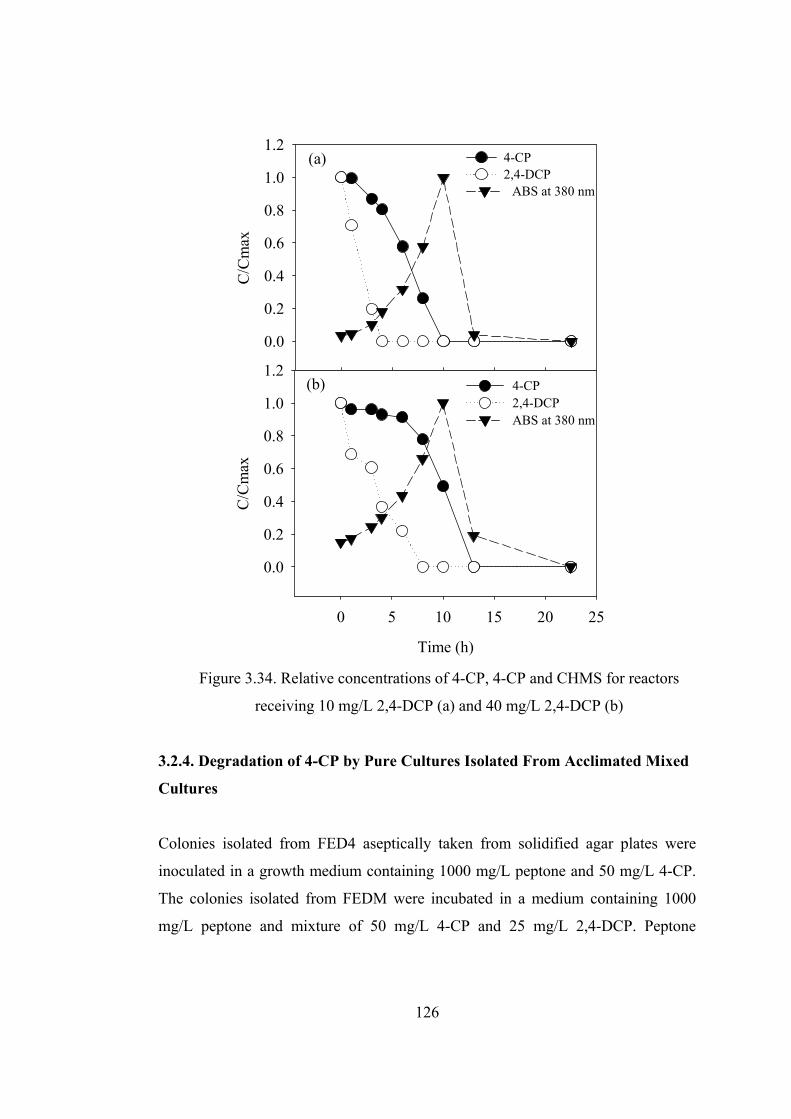
126
C/C
max
0.0
0.2
0.4
0.6
0.8
1.0
1.2
Time (h)
0 5 10 15 20 25
C/C
max
0.0
0.2
0.4
0.6
0.8
1.0
1.24-CP2,4-DCPABS at 380 nm
4-CP2,4-DCP
ABS at 380 nm
(a)
(b)
Figure 3.34. Relative concentrations of 4-CP, 4-CP and CHMS for reactors
receiving 10 mg/L 2,4-DCP (a) and 40 mg/L 2,4-DCP (b)
3.2.4. Degradation of 4-CP by Pure Cultures Isolated From Acclimated Mixed
Cultures
Colonies isolated from FED4 aseptically taken from solidified agar plates were
inoculated in a growth medium containing 1000 mg/L peptone and 50 mg/L 4-CP.
The colonies isolated from FEDM were incubated in a medium containing 1000
mg/L peptone and mixture of 50 mg/L 4-CP and 25 mg/L 2,4-DCP. Peptone
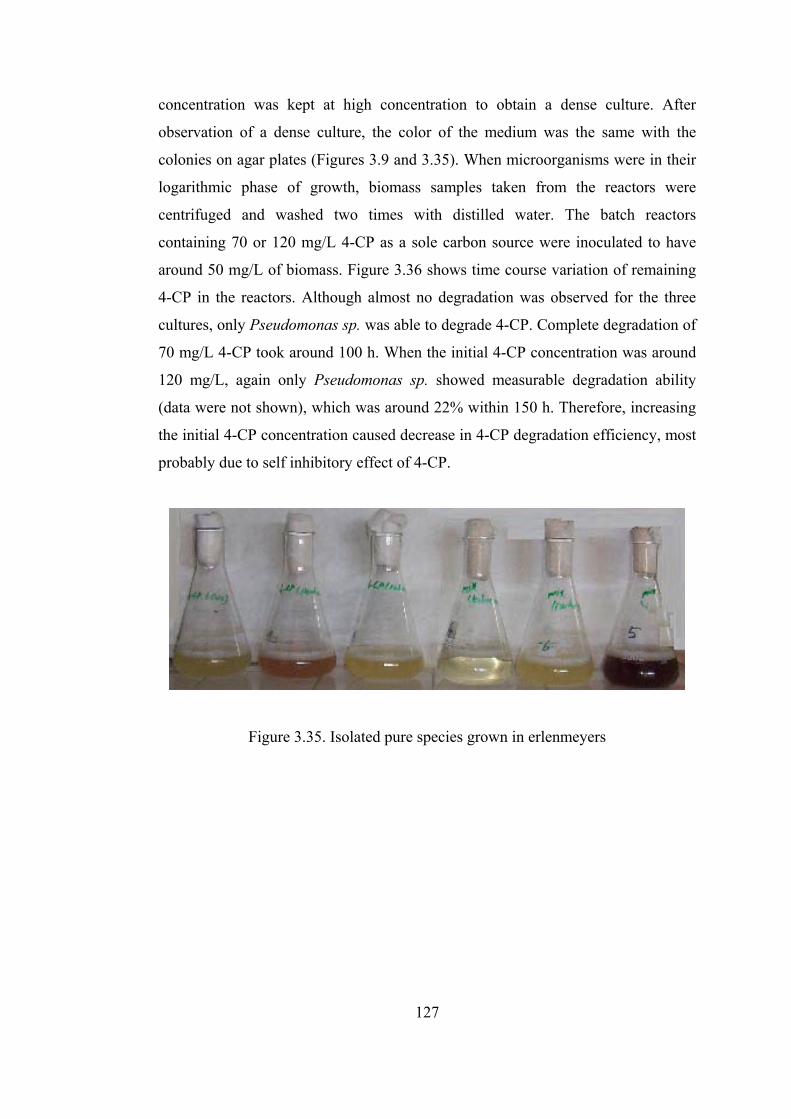
127
concentration was kept at high concentration to obtain a dense culture. After
observation of a dense culture, the color of the medium was the same with the
colonies on agar plates (Figures 3.9 and 3.35). When microorganisms were in their
logarithmic phase of growth, biomass samples taken from the reactors were
centrifuged and washed two times with distilled water. The batch reactors
containing 70 or 120 mg/L 4-CP as a sole carbon source were inoculated to have
around 50 mg/L of biomass. Figure 3.36 shows time course variation of remaining
4-CP in the reactors. Although almost no degradation was observed for the three
cultures, only Pseudomonas sp. was able to degrade 4-CP. Complete degradation of
70 mg/L 4-CP took around 100 h. When the initial 4-CP concentration was around
120 mg/L, again only Pseudomonas sp. showed measurable degradation ability
(data were not shown), which was around 22% within 150 h. Therefore, increasing
the initial 4-CP concentration caused decrease in 4-CP degradation efficiency, most
probably due to self inhibitory effect of 4-CP.
Figure 3.35. Isolated pure species grown in erlenmeyers
128
0
0.2
0.4
0.6
0.8
1
1.2
1.4
0 20 40 60 80 100 120
Time (h)
4-C
P (m
g/L)
P. stutzeri-1 P. stutzeri-2Pseudomonas sp. P. vesicularis
Figure 3.36. Degradation of 4-CP by isolated pure strains
3.2.5. Biodegradation Kinetics of 2,4-DCP by acclimated mixed cultures
The main goal of this set of experiments was to investigate the biodegradation
kinetics of 2,4-DCP using two different mixed cultures; one (culture M) was
previously acclimated to mixture of 4-CP and 2,4-DCP, the other (culture 4) was
acclimated to 4-CP only. Also, degradation ability of pure strains isolated from
acclimated mixed cultures was investigated.
The growth conditions of biomass used for batch degradation assay can greatly
influence the observed kinetic parameters, even with pure cultures (Ellis et al.,
1996a and b; Ellis and Anselm, 1999; Grady et al., 1996). Thus, the kinetic
parameters for a particular culture and substrate are not necessarily constant and
may reflect previous growth conditions (Ellis et al., 1996). In this context, parent
bioreactors used for biomass source for batch experiments should be operated
within the limits of real full-scale treatment processes. Therefore, in our study, SRT
of parent bioreactor was selected as 10 d to represent a real full-scale application.
Also, biomass for batch tests was drawn when parent reactors were in steady-state
operation to supply biomass with constant characteristics for different batch assays
as suggested by Sae´z PB and Rittmann, (1993).
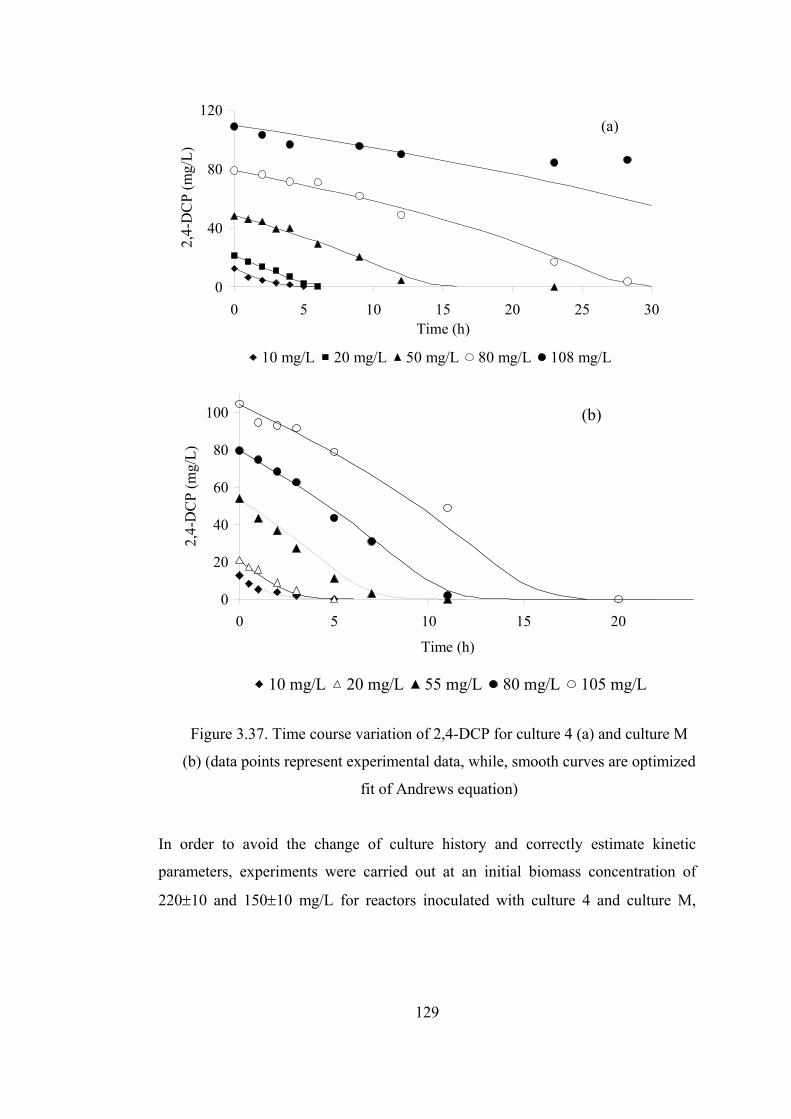
129
0
40
80
120
0 5 10 15 20 25 30Time (h)
2,4-
DC
P (m
g/L)
10 mg/L 20 mg/L 50 mg/L 80 mg/L 108 mg/L
(a)
0
20
40
60
80
100
0 5 10 15 20
Time (h)
2,4-
DC
P (m
g/L)
10 mg/L 20 mg/L 55 mg/L 80 mg/L 105 mg/L
(b)
Figure 3.37. Time course variation of 2,4-DCP for culture 4 (a) and culture M
(b) (data points represent experimental data, while, smooth curves are optimized
fit of Andrews equation)
In order to avoid the change of culture history and correctly estimate kinetic
parameters, experiments were carried out at an initial biomass concentration of
220±10 and 150±10 mg/L for reactors inoculated with culture 4 and culture M,
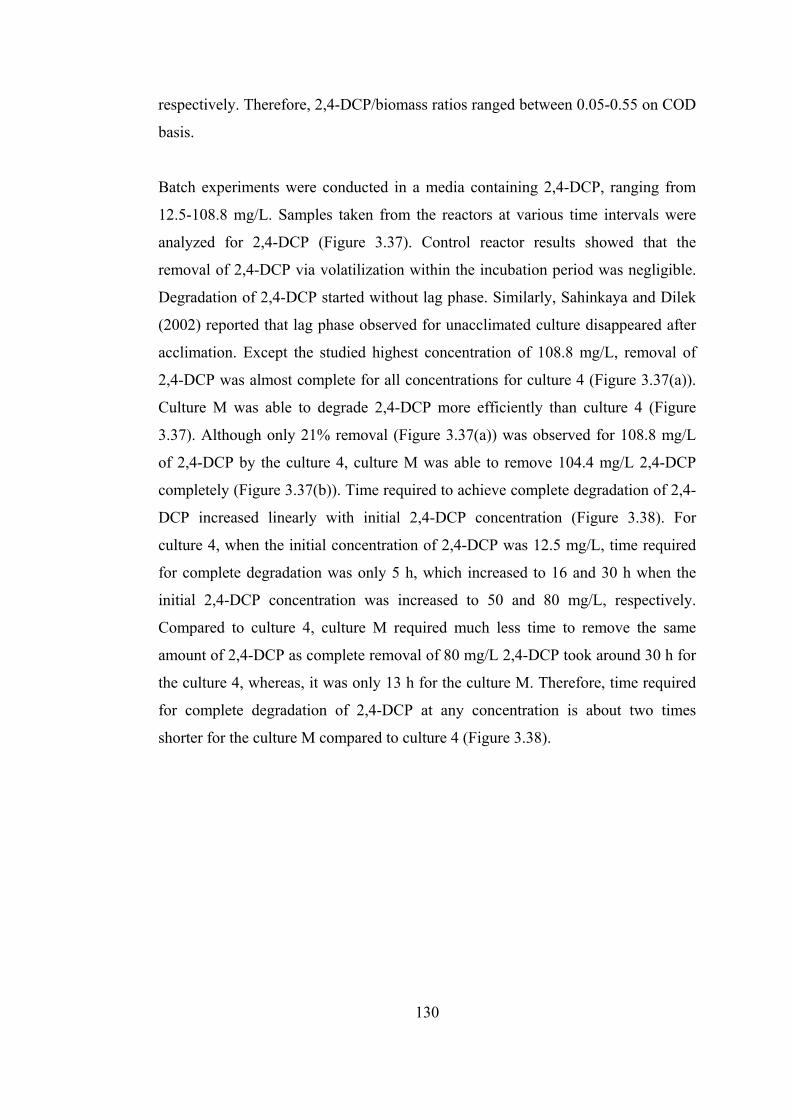
130
respectively. Therefore, 2,4-DCP/biomass ratios ranged between 0.05-0.55 on COD
basis.
Batch experiments were conducted in a media containing 2,4-DCP, ranging from
12.5-108.8 mg/L. Samples taken from the reactors at various time intervals were
analyzed for 2,4-DCP (Figure 3.37). Control reactor results showed that the
removal of 2,4-DCP via volatilization within the incubation period was negligible.
Degradation of 2,4-DCP started without lag phase. Similarly, Sahinkaya and Dilek
(2002) reported that lag phase observed for unacclimated culture disappeared after
acclimation. Except the studied highest concentration of 108.8 mg/L, removal of
2,4-DCP was almost complete for all concentrations for culture 4 (Figure 3.37(a)).
Culture M was able to degrade 2,4-DCP more efficiently than culture 4 (Figure
3.37). Although only 21% removal (Figure 3.37(a)) was observed for 108.8 mg/L
of 2,4-DCP by the culture 4, culture M was able to remove 104.4 mg/L 2,4-DCP
completely (Figure 3.37(b)). Time required to achieve complete degradation of 2,4-
DCP increased linearly with initial 2,4-DCP concentration (Figure 3.38). For
culture 4, when the initial concentration of 2,4-DCP was 12.5 mg/L, time required
for complete degradation was only 5 h, which increased to 16 and 30 h when the
initial 2,4-DCP concentration was increased to 50 and 80 mg/L, respectively.
Compared to culture 4, culture M required much less time to remove the same
amount of 2,4-DCP as complete removal of 80 mg/L 2,4-DCP took around 30 h for
the culture 4, whereas, it was only 13 h for the culture M. Therefore, time required
for complete degradation of 2,4-DCP at any concentration is about two times
shorter for the culture M compared to culture 4 (Figure 3.38).
131
y = 0.3634xr2 = 0.9875
y = 0.1754xr2 = 0.9589
0
5
10
15
20
25
30
35
0 20 40 60 80 100 120
2,4-DCP (mg/L)
Tim
e re
quire
d (h
)
acclimated to 4-CPacclimated to mixture
Figure 3.38. Required time to achieve complete degradation of 2,4-DCP
Culture pH is an important parameter in chlorophenol degradation (Wang and Loh,
1999). Although slightly higher decreases were observed at higher 2,4-DCP
concentrations, the monitored values were always between 7.2-6.8 and pH
adjustment was not required.
Figure 3.39 shows relation between specific degradation rate (SDR) and initial
concentration of 2,4-DCP. The decreased SDR with increasing initial 2,4-DCP
concentration implies that 2,4-DCP acts as an inhibitor. Therefore, the Andrews
substrate inhibition was used to model the inhibition of 2,4-DCP on its own
transformation. In modeling, only the substrate utilization term was considered and
the biomass production from the utilization of 2,4-DCP was neglected due to the
relatively higher initial concentration of biomass, which was 220±10 and 150±10
mg/L for reactors inoculated with culture 4 and culture M, respectively. The
accuracy of the assumption was also validated with the measurements of MLVSS
concentrations at the end of the degradation assays as the biomass increase
remained within the range of 0-16% depending on initial 2,4-DCP concentrations.
Similarly, Rutgers et al. (1997) reported that the growth yield coefficients on
chlorinated phenols are lower than those of heterotrophic growth on non-
chlorinated compounds. They studied growth yield coefficient of Sphingomonas sp.
132
strain P5 on various chlorophenols in chemostat culture and reported the growth
yield coefficients within the range of 0.255-0.11 molC/molC. Using the given range
of yield coefficient and taking average biomass weight 113 g/mol (Rittmann and
McCarty, 2001), the possible increase in biomass concentration even at 100 mg/L
of 2,4-DCP, which is the studied highest concentration, can be calculated in the
range of 10-20 mg/L, which can be neglected considering much higher initial
biomass concentrations in the batch assays. It should also be emphasized that the
community structure of our original mixed culture may be relatively constant
during the batch experiments due to lower biomass growth and, the obtained kinetic
parameters will be representative for the original mixed culture taken out from the
parent bioreactor. Chudoba et al. (1992) also reported this fact as substrate to
biomass concentration should be selected not to allow substantial cell
multiplications and, the kinetic constants obtained only under these conditions can
be safely used for the activated sludge plant design and operation.
Application of experimental data to the Andrews equation (Equation 3.10) gave
excellent fit (Figure 3.39) as r2 was observed to be higher than 0.99 for both
cultures (Table 3.4). The kinetic parameters for culture 4 were obtained as
qm=38.83 mg 2,4-DCP/(g MLVSS.h), Ks=7.72 mg/L, and Ki= 22.81 mg/L.
Therefore, the observed kinetic equation is;
81.2272.7
83.38)()(
2SS
SXtdSd
++
−= (3.14)
133
SDR
of 2
,4-D
CP
(mg/
g M
LVSS
. h)
0
5
10
15
20
25ExperimentAndrews Model
2,4-DCP (mg/L)
0 20 40 60 80 100 120
0
20
40
60
(a)
(b)
Figure 3.39. Specific initial degradation rate of 2,4-DCP by culture 4 (a), and
culture M (b)
By solving the model established, the 2,4-DCP concentration profiles can be
simulated for different initial 2,4-DCP concentrations. Although predicted values
using Andrews equation gave good fit to the experimental data (Figure 3.37(a)), a
slight discrepancy was observed at the highest concentration studied (108.8 mg/L).
The similar discrepancy of Andrews equation was also noted by Hao et al. (2002)
during the degradation of phenol at high concentrations using a pure culture of
Acinetobacter sp. Moreover, only a partial removal of 2,4-DCP (21%) (Figure
134
3.37(a)) was observed at the end of 30 h incubation due to toxic effect of 2,4-DCP
at the highest studied concentration (108.8 mg/L).
Table 3.4. Andrews Model parameters of 2,4-DCP biodegradation
Sludge qm
(mg/(g MLVSS.h))
Ks
(mg/L)
Ki
(mg/L)
Ccrt
(mg/L) r2
Culture 4 38.83 7.72 22.81 13.27 0.997
Culture M 112.4 13.77 44.46 24.74 0.996
Meanwhile, in the case of culture M, the dependence of SDR on the initial 2,4-DCP
concentration displayed a similar trend (Figure 3.39(b)) to that of the culture 4 and
Andrews model was used to describe the experimental data. Andrews equation
(Equation 3.10) gave good fit to the experimental results and kinetic constants were
observed as qm=112.4 mg 2,4-DCP/(gMLVSS.h), Ks=13.77 mg/L, and Ki= 44.46
mg/L. Therefore, the model equation is;
46.4477.13
4.112)()(
2SS
SXtdSd
++
−= (3.15)
The model well fitted to the experimental data (Figure 3.37(b)) and it can be
concluded that the model could be used to estimate variations of 2,4-DCP
concentrations with time.
Critical 2,4-DCP concentrations, Iscrt KKS = , were calculated as 13.27 and
24.74 mg/L for culture 4 and culture M, respectively. The corresponding removal
rates were 17.95 and 53.19 mg/(g.MLVSS.h). Therefore, the obtained maximum
removal rate for culture M is around three times higher compared to culture 4.

135
The parameters of the model estimated from the experimental data are listed in
Table 3.4. The observed maximum specific degradation rate constant for culture M
is around 3 times higher than that for culture 4. Small Ks values were obtained for
both cultures, which means that maximum observed degradation rate could be
reached at very low 2,4-DCP concentrations if substrate inhibition has not been a
factor. Observed Ki values were also low, which means that 2,4-DCP is toxic to the
cells even at low concentrations.
Although unacclimated sludge cannot degrade 2,4-DCP (Sahinkaya and Dilek,
2002), 4-CP acclimated culture was able to degrade 2,4-DCP without any lag phase
due to structural similarity between 4-CP and 2,4-DCP. Culture acclimated to a
specific chlorophenol may have ability to degrade other types of chlorophenols due
to structural similarity (Sahinkaya and Dilek, 2002; Quan et al., 2004c); however,
there is no information in the literature on kinetics of such ability. Therefore, in the
present study, Andrews equation parameters were estimated for two different
acclimated activated sludge cultures. Also, the proposed model can be helpful for
understanding the behavior of biological processes and predicting the 2,4-DCP
concentrations in the treatment systems.
136
Table 3.5. SDR of 2,4-DCP for different cultures
2,4-DCP
(mg/L)
Culture SDR
(mg/(gMLVSS.h))
SDRa
(mg/(gMLVSS.h))
Reference
75 8.84 19.64
100 Culture 4
7.11 15.80 This study
75 39.15 75.28
100 Culture M
33.18 63.80 This study
75 9.54 63.60
100 Culture 24 8.68 57.87
Sahinkaya
and Dilek
(2002) a When the specialist biomass concentrations were taken into account
The inhibition of 2,4-DCP on its own degradation was also reported in our previous
work (Sahinkaya and Dilek, 2002). In this previous study, degradation of 2,4-DCP
was investigated with a culture previously acclimated to 2,4-DCP (Culture 24) and
it was observed that the degradation rate of 2,4-DCP decreased linearly with
increasing concentrations. Using the data in our previous work (Sahinkaya and
Dilek, 2002) and the present study, the calculated SDRs of 2,4-DCP for two
different inlet concentrations are given in Table 3.5. The analyses of the table could
yield two important conclusions. First, SDRs of culture 4 and culture 24 are similar,
whereas, SDR of culture M is almost four times higher compared to those of culture
4 and culture 24. Although there may be several reasons of this, two of them seem
to be particularly important. First, the feed compositions of the parent bioreactors
used to supply biomass to the batch assays were different. Hence, the type of
species dominant in the cultures may be different (Grady et al., 1996). Second, even
the dominant species were similar; their enzyme systems may be different, as
adaptation by enzyme regulation does not require any change in community
structure (Rittmann and McCarty, 2001). The fraction of total chlorophenol in the
feed of SBR receiving both 4-CP and 2,4-DCP was the highest. Therefore, one
137
reason of observing higher substrate removal in the case of culture M may be the
presence of comparably higher fraction of specialist biomass within the community.
The COD fraction of total chlorophenols in the feed of the parent bioreactor
(FEDM) used as the source of culture M was around 0.52, and it was 0.45 and 0.15
for the culture 4 and culture 24, respectively. Considering these fractions, SDRc
values for 100 mg/L 2,4-DCP can be computed as 63.8, 15.8 and 57.87
(mg/(gMLVSSc.h)) for culture M, culture 4 and culture 24, respectively. Therefore,
when the specialist biomass concentrations were considered, there is no so much
difference between SDRc values of culture M and culture 24, and both cultures
have the higher SDRc values than culture 4. The observation of low SDR value for
culture 4 is reasonable, as the culture was not previously exposed to 2,4-DCP, but
only to another structurally similar compound, 4-CP.
HPLC results of influent and effluent samples indicated complete removal of 2,4-
DCP without any by-product. As an example, Figure 3.40 shows HPLC diagrams of
selected one batch experiment.
Figure 3.40. HPLC diagram of influent and effluent of batch experiments
inoculated with culture M receiving 104.4 mg/L 2,4-DCP
Although complete mineralization 2,4-DCP was observed in our study,
accumulation of dichlorocatechols was detected (based on HPLC results) during the
degradation of 2,4-DCP by Micrococcus A (Gallizia et al., 2003). Therefore, mixed
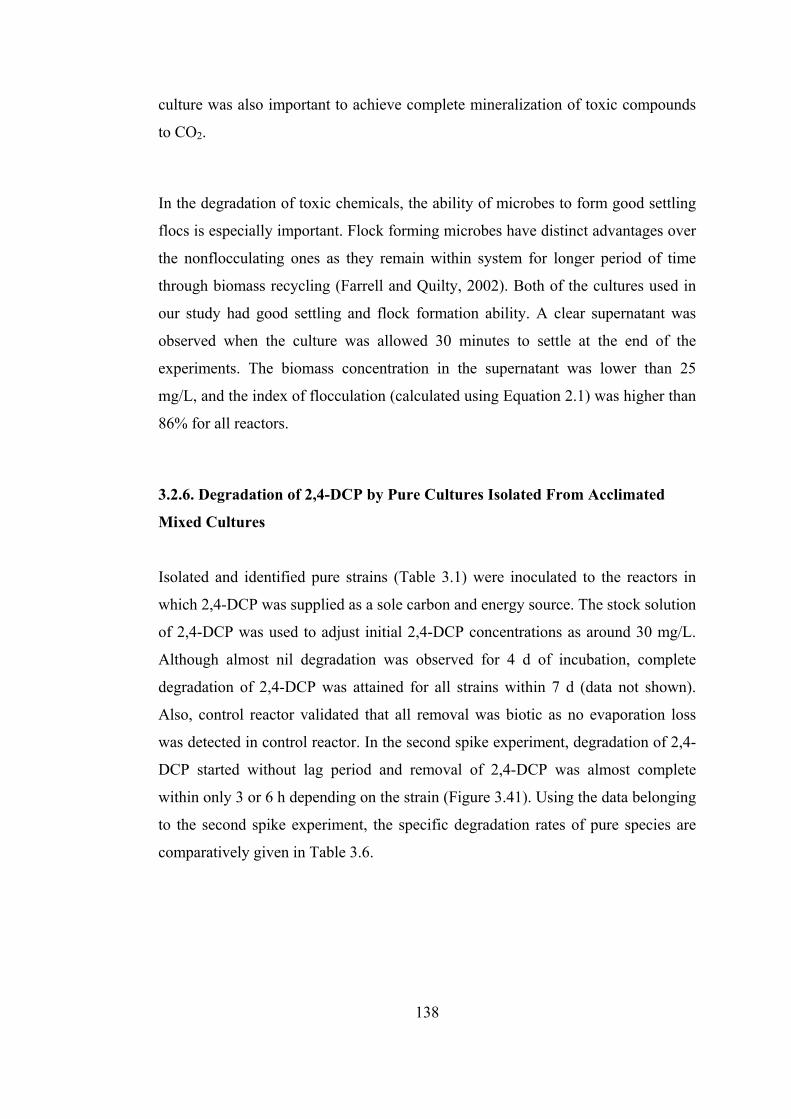
138
culture was also important to achieve complete mineralization of toxic compounds
to CO2.
In the degradation of toxic chemicals, the ability of microbes to form good settling
flocs is especially important. Flock forming microbes have distinct advantages over
the nonflocculating ones as they remain within system for longer period of time
through biomass recycling (Farrell and Quilty, 2002). Both of the cultures used in
our study had good settling and flock formation ability. A clear supernatant was
observed when the culture was allowed 30 minutes to settle at the end of the
experiments. The biomass concentration in the supernatant was lower than 25
mg/L, and the index of flocculation (calculated using Equation 2.1) was higher than
86% for all reactors.
3.2.6. Degradation of 2,4-DCP by Pure Cultures Isolated From Acclimated
Mixed Cultures
Isolated and identified pure strains (Table 3.1) were inoculated to the reactors in
which 2,4-DCP was supplied as a sole carbon and energy source. The stock solution
of 2,4-DCP was used to adjust initial 2,4-DCP concentrations as around 30 mg/L.
Although almost nil degradation was observed for 4 d of incubation, complete
degradation of 2,4-DCP was attained for all strains within 7 d (data not shown).
Also, control reactor validated that all removal was biotic as no evaporation loss
was detected in control reactor. In the second spike experiment, degradation of 2,4-
DCP started without lag period and removal of 2,4-DCP was almost complete
within only 3 or 6 h depending on the strain (Figure 3.41). Using the data belonging
to the second spike experiment, the specific degradation rates of pure species are
comparatively given in Table 3.6.
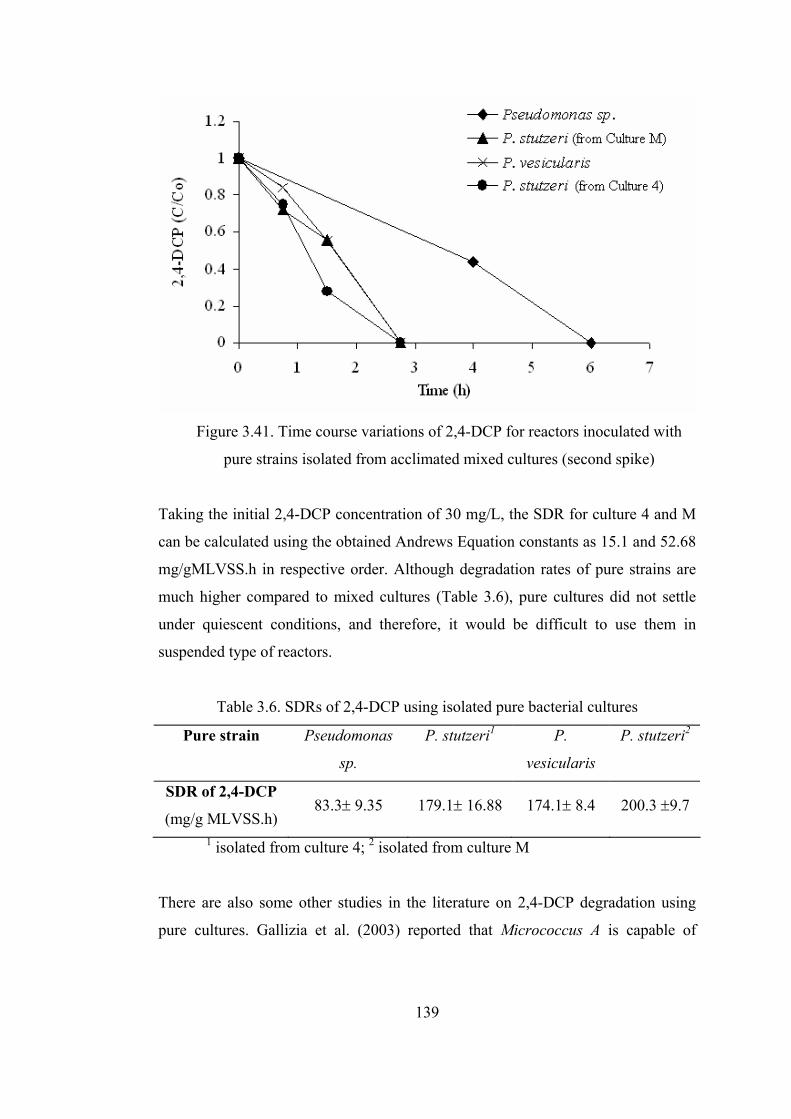
139
Figure 3.41. Time course variations of 2,4-DCP for reactors inoculated with
pure strains isolated from acclimated mixed cultures (second spike)
Taking the initial 2,4-DCP concentration of 30 mg/L, the SDR for culture 4 and M
can be calculated using the obtained Andrews Equation constants as 15.1 and 52.68
mg/gMLVSS.h in respective order. Although degradation rates of pure strains are
much higher compared to mixed cultures (Table 3.6), pure cultures did not settle
under quiescent conditions, and therefore, it would be difficult to use them in
suspended type of reactors.
Table 3.6. SDRs of 2,4-DCP using isolated pure bacterial cultures
Pure strain Pseudomonas
sp.
P. stutzeri1 P.
vesicularis
P. stutzeri2
SDR of 2,4-DCP
(mg/g MLVSS.h) 83.3± 9.35 179.1± 16.88 174.1± 8.4 200.3 ±9.7
1 isolated from culture 4; 2 isolated from culture M
There are also some other studies in the literature on 2,4-DCP degradation using
pure cultures. Gallizia et al. (2003) reported that Micrococcus A is capable of
140
removing 100 mg/L 2,4-DCP within 10 days and the observed SDR was around
3.68 mg/(g biomass h). Kargi and Eker (2004) reported that complete degradation
of 2,4-DCP by Pseudomonas putida was achieved when its initial concentration
was 30 mg/L, and removal efficiency decreased sharply further increasing the
concentrations. They also reported that SDR of 2,4-DCP were within 0.7-1.1 mg/(g
biomass.h) depending on initial concentrations. The removal efficiency of 10 mg/L
2,4-DCP by Bacillus insolitus is only 42% at the end of 16 d incubation (Wang et
al., 2000). Similarly, Buitron et al. (1998) pointed that 2,4-DCP-degradation rate of
acclimated mixed culture was 25.4 mg/(g MLVSS. h), whereas, it was in the range
of 0.67-1.66 mg/(g MLVSS.h) for pure cultures, which were isolated from
acclimated activated sludge. Contrary to these findings, we have observed much
higher SDRs for the isolated and selected pure strains compared to the acclimated
mixed cultures and the literature findings. There are two possible reasons of such an
observation; first, strains were isolated from acclimated mixed cultures, which were
exposed to chlorophenols for 5 months. Second, the isolated pure cultures were also
stored on agar plates containing 4-CP and/or 2,4-DCP and the pure cultures were
pre-exposed to 2,4-DCP in first spike experiments.
3.3. Effect of Filling Time on the Performance of Sequencing Batch Reactor
(SBR) Treating 4-CP and 2,4-DCP Mixture
SBRs offer an attractive alternative to conventional biological wastewater treatment
systems, mainly because of their simple and flexible operation and cost
effectiveness for small-scale treatment facilities (Mangat and Elefsiniotis, 1999;
Chiavola et al., 2004). The key difference is that the reactor volume of SBRs varies
with time but remains constant with traditional continuous flow systems (Mohan et
al., 2005). Enforcement of controlled, short-term, non-steady conditions in SBRs
may favor induction of enzymes to degrade biorefractory compounds (Tomei et al.
2004). Another significant point for SBRs is that the chlorophenols peak
concentration in the reactor, adjustable by changing the feeding time, markedly
affects reactor performance. Accumulated compounds may adversely affect both
141
their own degradation via self-inhibition and the degradation of other compounds in
the feed via substrate interaction and/or inhibition of the biomass. Therefore, SBR
operational parameters should be optimized especially when chlorophenols are
present in the mixture.
The ratio of Kı/Ks determines the how degradation rate changes with increasing
substrate concentration. When the ratio approaches infinity, the Andrews equation
reduces to Monod equation and the substrate removal rate approaches its maximum.
For low Kı/Ks ratio, as the substrate concentration increases there is a critical
substrate concentration, iscr KKS = , above which the substrate removal rate falls
(Tomei et al., 2004). The ratio of Kı/Ks for 4-CP and 2,4-DCP was calculated as
2.28 and 3.22, respectively using the values given in Sections 3.2.2 and 3.2.5. For
both cases, the observed relatively low values of Kı/Ks clearly indicated that both of
the substrates significantly inhibit their own transformation above the critical
substrate concentration, at which degradation rate is maximal. Based on the results,
critical substrate concentrations for 4-CP and 2,4-DCP were observed as 53 and 25
mg/L, respectively. Hence, the critical concentration of 4-CP was 2.5 times that of
2,4-DCP, indicating higher toxicity of 2,4-DCP. At this point, the use of SBR with
long filling time gains importance as the concentrated wastewaters can be readily
degraded without exceeding critical substrate concentration.
In an SBR, we studied 4-CP and 2,4-DCP degradation using four different feeding
periods to determine the effect of feeding duration on reactor performance. During
the experiments, peptone, 4-CP, and 2,4-DCP concentrations were kept constant at
300, 220, and 110 mg/L, respectively, and the reactor was operated over four
feeding durations of 8, 5.5, 2.2, and 0 h (see Table 3.7 for reactor operating
conditions). After each change of feeding regime, the reactor was allowed three
SRTs to reach a steady state, determined also by measuring effluent COD and
MLVSS at least three successive days.
142
Table 3.7. SBR operating conditions
Filling Time (h) 8 5.5 2.2 0
Hydraulic residence time (d) 1.125 1.125 1.125 1.125
Fill flow rate (l/h) 0.25 0.36 0.91 -
Steady state MLVSS at the end of
daily cycle (mg MLVSS/L) 1050±56 1502±29 1373±35 1335±8
Chlorophenols loading rate
(mg chlorophenols/gMLVSS.h) 34.92 35.5 97.11 -
Figure 3.42 shows changes in chlorophenol and COD concentrations with time for
one cycle at 8-h feeding. As the figure shows, though the influent chlorophenol
concentrations were high, their maxima in the reactor did not exceed 2 mg/L for
both 4-CP and 2,4-DCP; thus by the end of the cycle, both chlorophenols were
completely removed (their concentrations were below the detection limit).
143
Inf.
4-C
P or
2,4
-DC
P (m
g/L)
0
50
100
150
200
250
4-C
P or
2,4
-DC
P (m
g/L)
in S
BR
0
2
4
6
8
10Influent 4-CPInfluent 2,4-DCP 4-CP in SBR2,4-DCP in SBR
Time (h)
0 5 10 15 20 25
CO
D (m
g/L)
0
200
400
600
800
1000
% R
emov
al0
20
40
60
80
100
120
Influent COD COD in SBR% COD removal
(a)
(b)
Figure 3.42. Time course variation of COD and chlorophenols for 8 h of filling time
Similarly, the influent COD was close to 900 mg/L and the maximum COD during
the operation remained at about 140 mg/L and decreased to 27±3 mg/L, thus
corresponding to about 97% removal at the end of the operation. The low COD at
the end of operation implies that chlorophenols were fully removed without residual
by-products in the medium. In addition, effluent COD remained at about 25 mg/L
when the reactor was fed with peptone without chlorophenols. Therefore, adding
chlorophenols to the medium caused no significant increase in effluent COD, and
the low COD at the end of the cycle may have come from biomass lyses. These
144
findings coincide with those of Tomei et al. (2004) on 4-nitrophenol degradation.
They reported that after complete degradation of 4-nitrophenol, residual COD was
10-20 mg/L, also accounted for by biomass lyses.
Figure 3.43 shows time course variation of chlorophenols and COD for 5.5-h
feeding. Decreasing feeding from 8 to 5.5 h increased the maximum 4-CP and 2,4-
DCP concentrations to about 70 and 7 mg/L, respectively. Similarly, the maximum
COD concentration increased from 140 mg/L for 8-h feeding to about 215 mg/L for
5-h feeding. Both maximum chlorophenol and COD concentrations also occurred at
the start of feeding, a finding that allows two possible explanations. First, at the
beginning of operation, the low reactor volume prevented incoming wastewater
from being diluted. Second, because during settling and idling the reactor was not
aerated, biomass activity decreased resulting in increased reactor concentration.
Similarly, Tomei et al. (2004) observed a short initial lag phase, which they
attributed to time required for the solution to homogenize and the biomass to adapt
during the settling and idling of the reactor. Like in 8-h feeding, high COD removal
(91±3%) occurred also at the end of the 5.5-h cycle.
Similar to the operation at 8 h filling time, high COD removal efficiency (91±3%)
was observed at the end of the cycle.
145
Time (h)
4-C
P or
2,4
-DC
P (m
g/L)
0
50
100
150
200
2504-CP in SBR2,4-DCP in SBRInfluent 4-CP Influent 2,4-DCP
Time (h)
0 5 10 15 20 25
CO
D (m
g/L)
0
200
400
600
800
1000
% C
OD
rem
oval
0
20
40
60
80
100
120
COD in SBRInfluent COD % COD removal
Figure 3.43. Time course variation of COD and chlorophenols for 5.5 h of
filling time
Figure 3.44 gives chlorophenol and COD variations over 2.2-h feeding and shows
that both concentrations increased during the feeding period and more significantly
than during 5.5-h feeding. Therefore, during the former feeding the chlorophenol
and COD degradation rates were lower than the loading rate, as also noticed by
Chiavola et al. (2004) in their study of 3-CP/phenol degradation via cometabolism.
Another significant point, also seen in the figure, is that 4-CP degradation did not
start until all 2,4-DCP was consumed in the medium: the 4-CP and 2,4-DCP peak
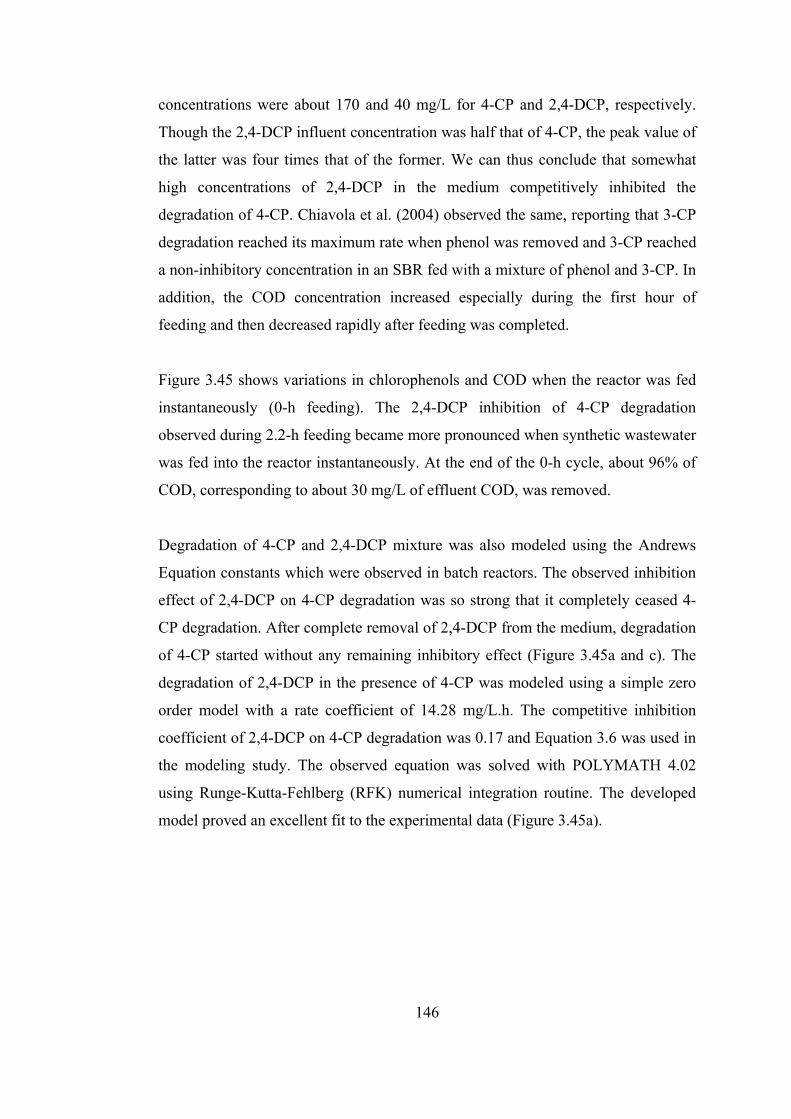
146
concentrations were about 170 and 40 mg/L for 4-CP and 2,4-DCP, respectively.
Though the 2,4-DCP influent concentration was half that of 4-CP, the peak value of
the latter was four times that of the former. We can thus conclude that somewhat
high concentrations of 2,4-DCP in the medium competitively inhibited the
degradation of 4-CP. Chiavola et al. (2004) observed the same, reporting that 3-CP
degradation reached its maximum rate when phenol was removed and 3-CP reached
a non-inhibitory concentration in an SBR fed with a mixture of phenol and 3-CP. In
addition, the COD concentration increased especially during the first hour of
feeding and then decreased rapidly after feeding was completed.
Figure 3.45 shows variations in chlorophenols and COD when the reactor was fed
instantaneously (0-h feeding). The 2,4-DCP inhibition of 4-CP degradation
observed during 2.2-h feeding became more pronounced when synthetic wastewater
was fed into the reactor instantaneously. At the end of the 0-h cycle, about 96% of
COD, corresponding to about 30 mg/L of effluent COD, was removed.
Degradation of 4-CP and 2,4-DCP mixture was also modeled using the Andrews
Equation constants which were observed in batch reactors. The observed inhibition
effect of 2,4-DCP on 4-CP degradation was so strong that it completely ceased 4-
CP degradation. After complete removal of 2,4-DCP from the medium, degradation
of 4-CP started without any remaining inhibitory effect (Figure 3.45a and c). The
degradation of 2,4-DCP in the presence of 4-CP was modeled using a simple zero
order model with a rate coefficient of 14.28 mg/L.h. The competitive inhibition
coefficient of 2,4-DCP on 4-CP degradation was 0.17 and Equation 3.6 was used in
the modeling study. The observed equation was solved with POLYMATH 4.02
using Runge-Kutta-Fehlberg (RFK) numerical integration routine. The developed
model proved an excellent fit to the experimental data (Figure 3.45a).
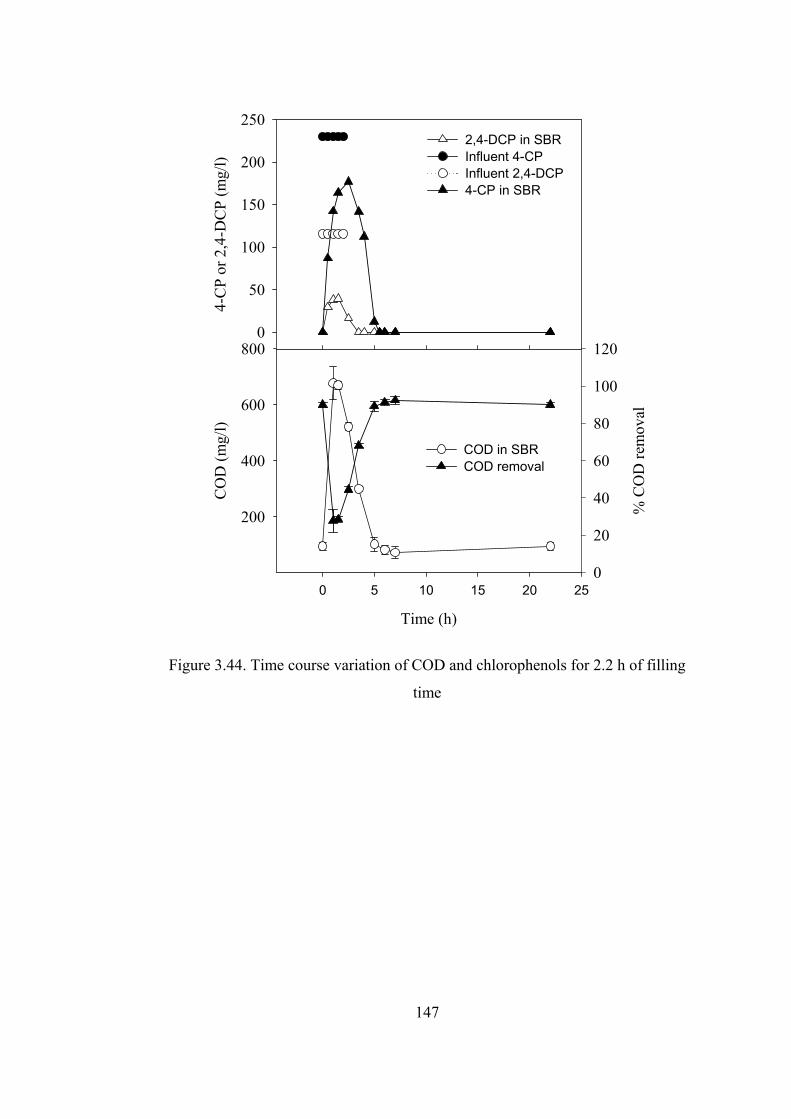
147
Time (h)
0 5 10 15 20 25
CO
D (m
g/l)
200
400
600
800
% C
OD
rem
oval
0
20
40
60
80
100
120
COD in SBRCOD removal
4-C
P or
2,4
-DC
P (m
g/l)
0
50
100
150
200
2502,4-DCP in SBRInfluent 4-CPInfluent 2,4-DCP 4-CP in SBR
Figure 3.44. Time course variation of COD and chlorophenols for 2.2 h of filling
time
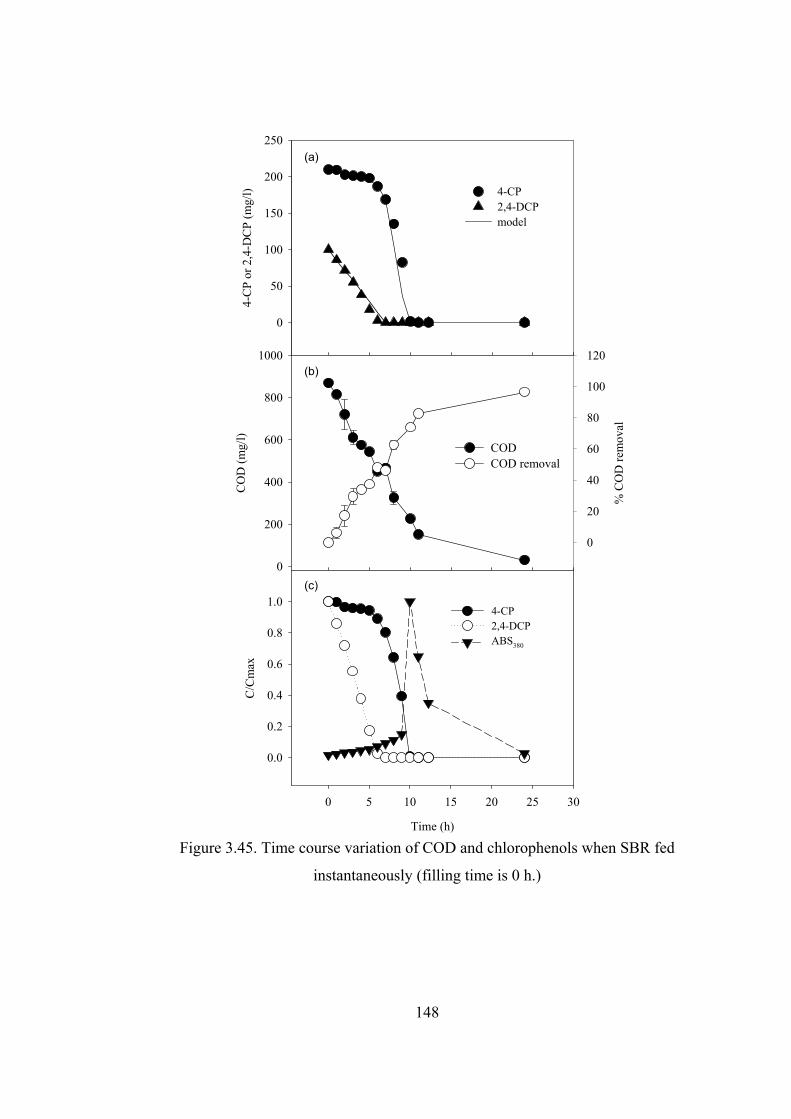
148
Figure 3.45. Time course variation of COD and chlorophenols when SBR fed
instantaneously (filling time is 0 h.)
4-C
P or
2,4
-DC
P (m
g/l)
0
50
100
150
200
250
4-CP2,4-DCPmodel
CO
D (m
g/l)
0
200
400
600
800
1000
% C
OD
rem
oval
0
20
40
60
80
100
120
CODCOD removal
Time (h)
0 5 10 15 20 25 30
C/C
max
0.0
0.2
0.4
0.6
0.8
1.04-CP2,4-DCPABS380
(a)
(b)
(c)
149
Time (h)
0 5 10 15 20 25
AB
S 380
0.0
0.5
1.0
1.5
2.08 h5.5 h2.2 h0 h
Figure 3.46. Time course variation of CHMS at different filling times
Figure 3.46 depicts time course variation of CHMS concentration as absorbance at
380 nm (ABS380) for different filling periods. The observed maximum
concentration of CHMS increased with decreasing filling time. Another significant
point is that the maximum CHMS concentration occurred immediately after 4-CP
was fully removed from the medium (Figure 3.45c). During the degradation of 4-
CP, the concentration of CHMS increased and after complete removal of 4-CP from
the culture medium, the concentration of the intermediate decreased sharply.
The production and subsequent complete removal of CHMS imply that 4-CP was
degraded completely via –meta cleavage pathway without by-product in culture
medium. Furthermore, HPLC analysis showed no intermediates in the treated
effluent (Figure 3.47). The complete break down of the chlorophenols was also
confirmed by the chloride material balance showing a total chlorophenols
degradation of 103±6% (data not shown).
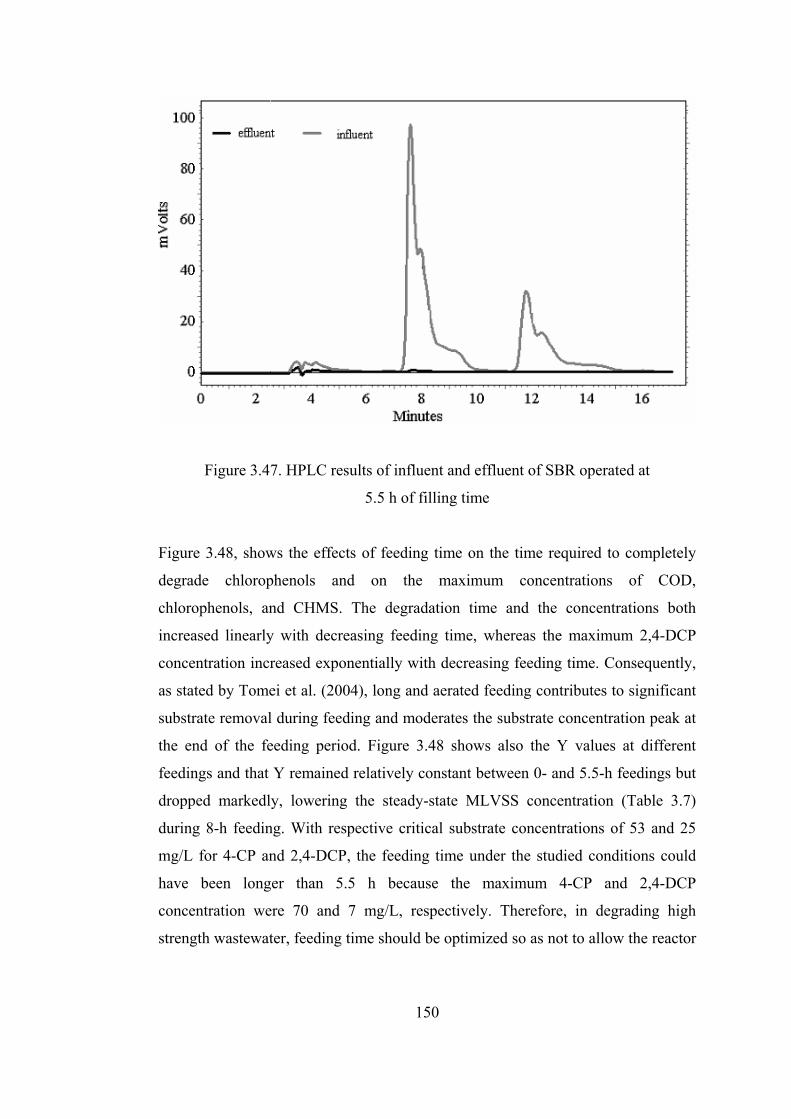
150
Figure 3.47. HPLC results of influent and effluent of SBR operated at
5.5 h of filling time
Figure 3.48, shows the effects of feeding time on the time required to completely
degrade chlorophenols and on the maximum concentrations of COD,
chlorophenols, and CHMS. The degradation time and the concentrations both
increased linearly with decreasing feeding time, whereas the maximum 2,4-DCP
concentration increased exponentially with decreasing feeding time. Consequently,
as stated by Tomei et al. (2004), long and aerated feeding contributes to significant
substrate removal during feeding and moderates the substrate concentration peak at
the end of the feeding period. Figure 3.48 shows also the Y values at different
feedings and that Y remained relatively constant between 0- and 5.5-h feedings but
dropped markedly, lowering the steady-state MLVSS concentration (Table 3.7)
during 8-h feeding. With respective critical substrate concentrations of 53 and 25
mg/L for 4-CP and 2,4-DCP, the feeding time under the studied conditions could
have been longer than 5.5 h because the maximum 4-CP and 2,4-DCP
concentration were 70 and 7 mg/L, respectively. Therefore, in degrading high
strength wastewater, feeding time should be optimized so as not to allow the reactor
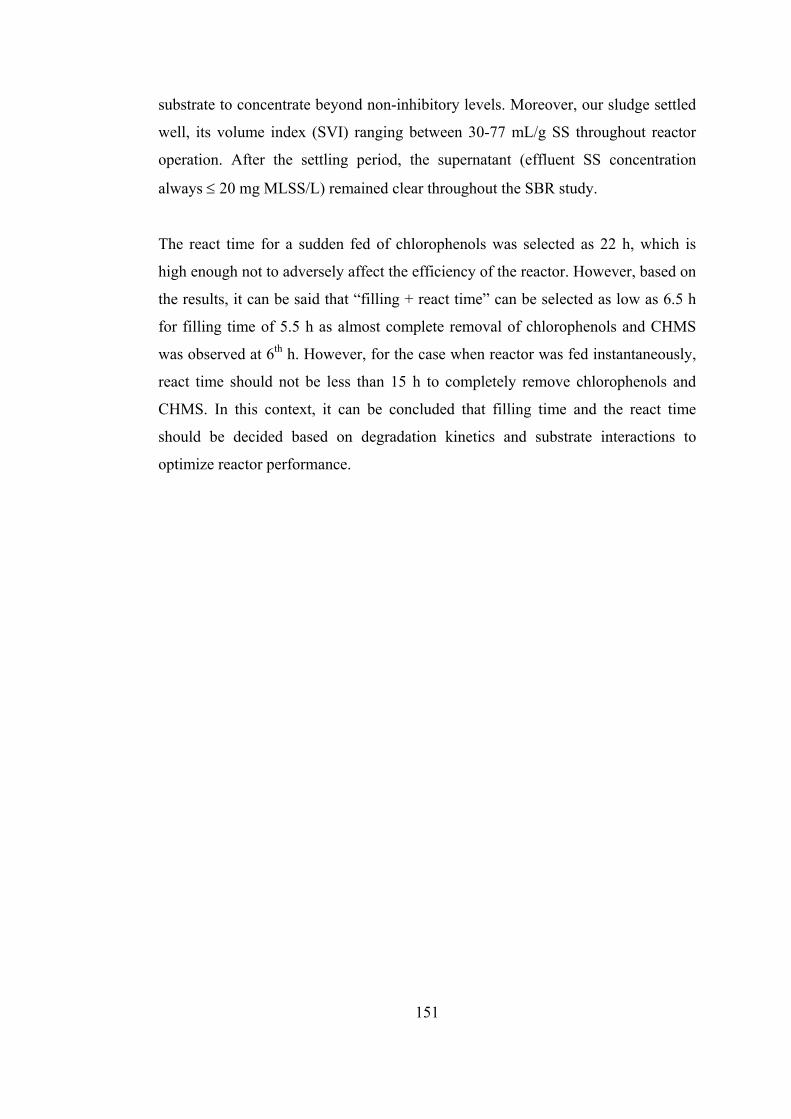
151
substrate to concentrate beyond non-inhibitory levels. Moreover, our sludge settled
well, its volume index (SVI) ranging between 30-77 mL/g SS throughout reactor
operation. After the settling period, the supernatant (effluent SS concentration
always ≤ 20 mg MLSS/L) remained clear throughout the SBR study.
The react time for a sudden fed of chlorophenols was selected as 22 h, which is
high enough not to adversely affect the efficiency of the reactor. However, based on
the results, it can be said that “filling + react time” can be selected as low as 6.5 h
for filling time of 5.5 h as almost complete removal of chlorophenols and CHMS
was observed at 6th h. However, for the case when reactor was fed instantaneously,
react time should not be less than 15 h to completely remove chlorophenols and
CHMS. In this context, it can be concluded that filling time and the react time
should be decided based on degradation kinetics and substrate interactions to
optimize reactor performance.
152
Figure 3.48. Effect of feeding time on the time required to completely degrade
chlorophenols and on the maximum concentrations of COD, chlorophenols, and
CHMS
153
As mentioned above, biomass activity slowed down in the first 30 min of feeding
after the reactor had settled and idled for about 2 h. Especially during short feeding
periods, this lowered activity and caused chlorophenols to accumulate. In addition,
because 2,4-DCP competitively inhibited 4-CP degradation, the latter rate was
much lower than the loading rate during short feedings (Figure 3.49b). Figure 3.49b
shows that the 4-CP removal/loading rate was lower than unity especially for the 1st
h of the 2.2-h feeding. Significantly also, the 4-CP degradation rate was highest in
for 1st h of the 5.5-h feeding because during the first 30 min reduced biomass
activity allowed the 4-CP concentration to reach about 70 mg/L, which was close to
the critical substrate concentration (about 53 mg/L). The degradation rates for the 8-
and 2.2-h feedings were lower because of 4-CP concentrations, which were,
respectively, lower and higher than the critical substrate concentration. With an
instantaneously fed reactor, the 4-CP degradation rate was almost zero for the first
5 h because a high 2,4-DCP concentration completely inhibited 4-CP degradation.
Thereafter, the 4-CP degradation rate increased steadily because 2,4-DCP was all
but removed from the medium. After its maximum, the degradation rate began to
drop as the 4-CP concentrations slid below the critical value (Figure 3.49a).
Therefore, fed over a long period, the SBR avoided the toxic compounds from self-
inhibiting their own degradation and from being inhibited by substrate interaction.
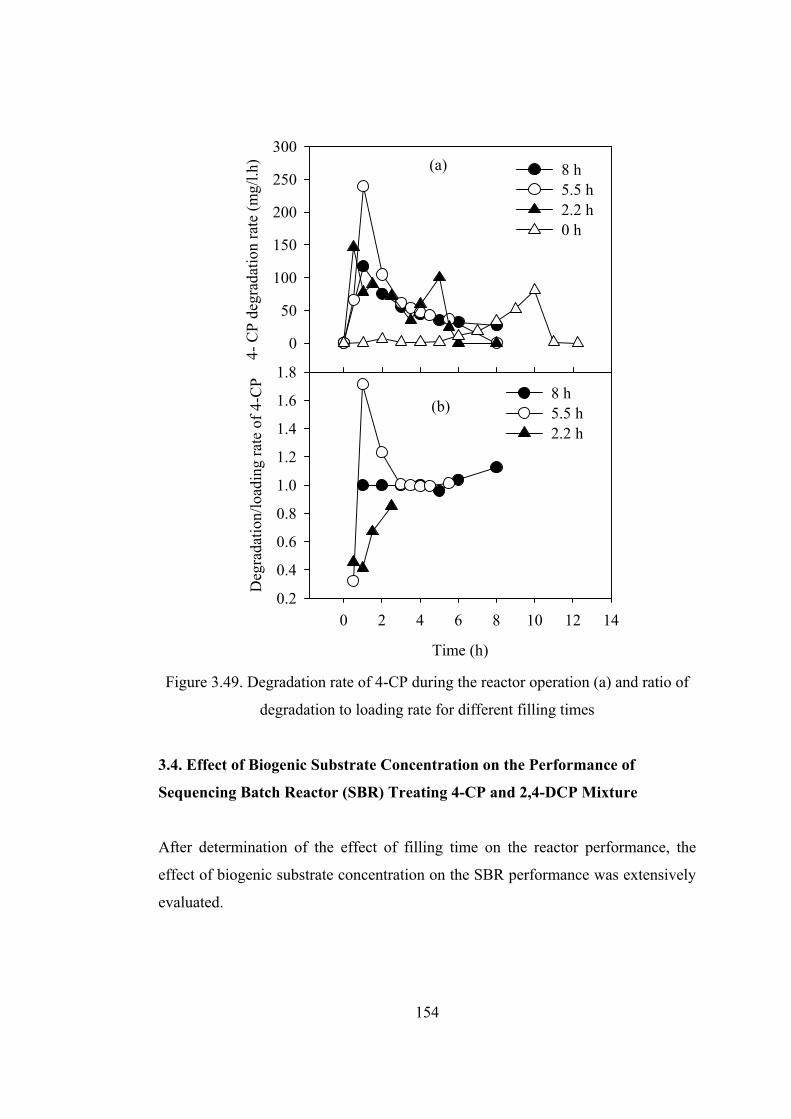
154
4- C
P de
grad
atio
n ra
te (m
g/l.h
)
0
50
100
150
200
250
3008 h5.5 h2.2 h0 h
Time (h)
0 2 4 6 8 10 12 14
Deg
rada
tion/
load
ing
rate
of 4
-CP
0.2
0.4
0.6
0.8
1.0
1.2
1.4
1.6
1.88 h5.5 h 2.2 h
(a)
(b)
Figure 3.49. Degradation rate of 4-CP during the reactor operation (a) and ratio of
degradation to loading rate for different filling times
3.4. Effect of Biogenic Substrate Concentration on the Performance of
Sequencing Batch Reactor (SBR) Treating 4-CP and 2,4-DCP Mixture
After determination of the effect of filling time on the reactor performance, the
effect of biogenic substrate concentration on the SBR performance was extensively
evaluated.
155
The filling time was kept constant at 8 h throughout the experiments. In order to
understand the effect of biogenic substrate concentration on the performance of the
reactor, peptone concentration was gradually decreased from its initial value of 300
mg/L, while the chlorophenols concentrations were kept constant at 220 and 110
mg/L for 4-CP and 2,4-DCP, respectively. After any change in reactor operation,
three SRTs were allowed to reach steady state conditions, which were also checked
measuring MLVSS and COD concentrations at the end of at least three successive
cycles. After ensuring the steady-state conditions, samples were drawn from the
reactors at predetermined time intervals and analyzed immediately for
chlorophenols, COD and CHMS. MLVSS concentrations at the end of the cycles
were also determined.
At the start of each cycle, the volume of settled sludge was 0.250 L and at the end
of the filling period the reached total volume of the reactor was 2.25 L. Therefore,
for each cycle, SBR received 2 L synthetic wastewater (HRT = 1.125 d), which was
fed to the reactor within 8 h of filling period.
Figure 3.50 gives time course variations of the 4-CP, 2,4-DCP, CHMD and COD
concentrations for each peptone concentration studied. The initial feed COD
concentration was around 800 mg/L when reactor received 300 mg/L peptone, 220
mg/L 4-CP and 110 mg/L 2,4-DCP. A 100 mg/L exclusion of peptone caused
around 100 mg/L decrease in the COD of reactor influent and the COD
concentration was around 500 mg/L when reactor was fed with chlorophenols as a
sole carbon and energy sources. Complete degradation of chlorophenols was
observed for all studied conditions, although the trend of chlorophenol
concentrations showed variation depending on the biogenic substrate concentration.
Although reactor was fed with a high concentration of 4-CP and 2,4-DCP mixture,
4-CP and 2,4-DCP concentrations were observed to be below 2 mg/L during the
filling period of the SBR for influent peptone concentration of 300 mg/L, which
were increased to around 12.5 and 5 mg/L in respective order with decreasing
influent peptone concentration to 200 mg/L (Figure 3.50(a)). When the peptone
156
concentration was decreased to 200 mg/L, chlorophenols started to exhibit a
noticeable peak value which corresponds to the very beginning of the cycle. Then,
it can be said that decreasing peptone concentration adversely affected
chlorophenol removal rate, which led to a slight increase in observed maximum
chlorophenol concentrations within the reactor. However, the maximum COD
concentration within the cycle was not affected from the decreasing peptone
concentration from 300 to 200 mg/L as it was observed to be 135 and 140 mg/L in
respective order (Figure 3.50(c)). When peptone concentration decreased further to
100 mg/L, the 4-CP peak concentration increased to 126 mg/L and a slight decrease
in the peak 4-CP concentration to 104 mg/L was observed when chlorophenols
were fed to the reactor as sole carbon and energy source (Figure 3.50(a)). The
decrease in 4-CP peak value when peptone concentration decreased from 100 to 0
mg/L is not known, but the possible reason is thought as change in community
structure with the complete elimination of peptone from the influent. This can also
be taken into consideration as an effect of acclimation of the culture to the
chlorophenol as the slow or gradual exclusion of the peptone from the feed might
have allowed the culture to acclimatize better.
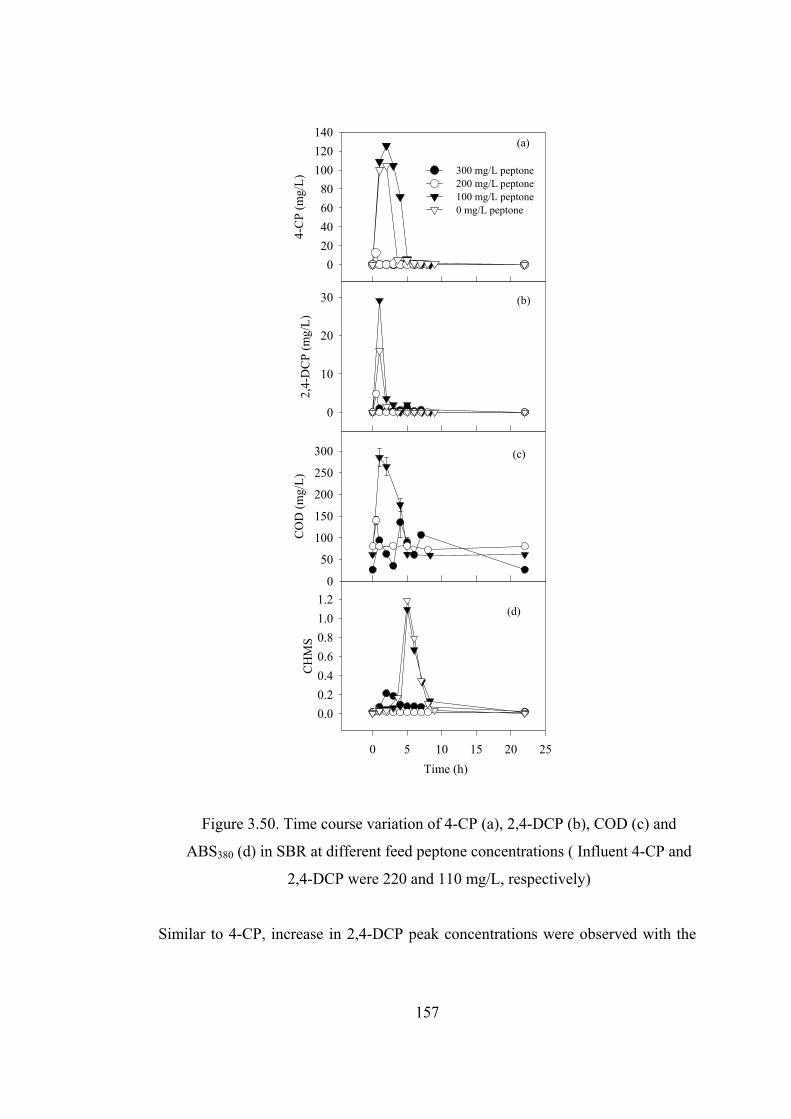
157
4-C
P (m
g/L)
020406080
100120140
300 mg/L peptone200 mg/L peptone100 mg/L peptone0 mg/L peptone
2,4-
DC
P (m
g/L)
0
10
20
30
0 5 10 15 20 25
CH
MS
0.00.20.40.60.81.01.2
Time (h)
CO
D (m
g/L)
0
50
100
150
200
250
300
(a)
(b)
(c)
(d)
Figure 3.50. Time course variation of 4-CP (a), 2,4-DCP (b), COD (c) and
ABS380 (d) in SBR at different feed peptone concentrations ( Influent 4-CP and
2,4-DCP were 220 and 110 mg/L, respectively)
Similar to 4-CP, increase in 2,4-DCP peak concentrations were observed with the
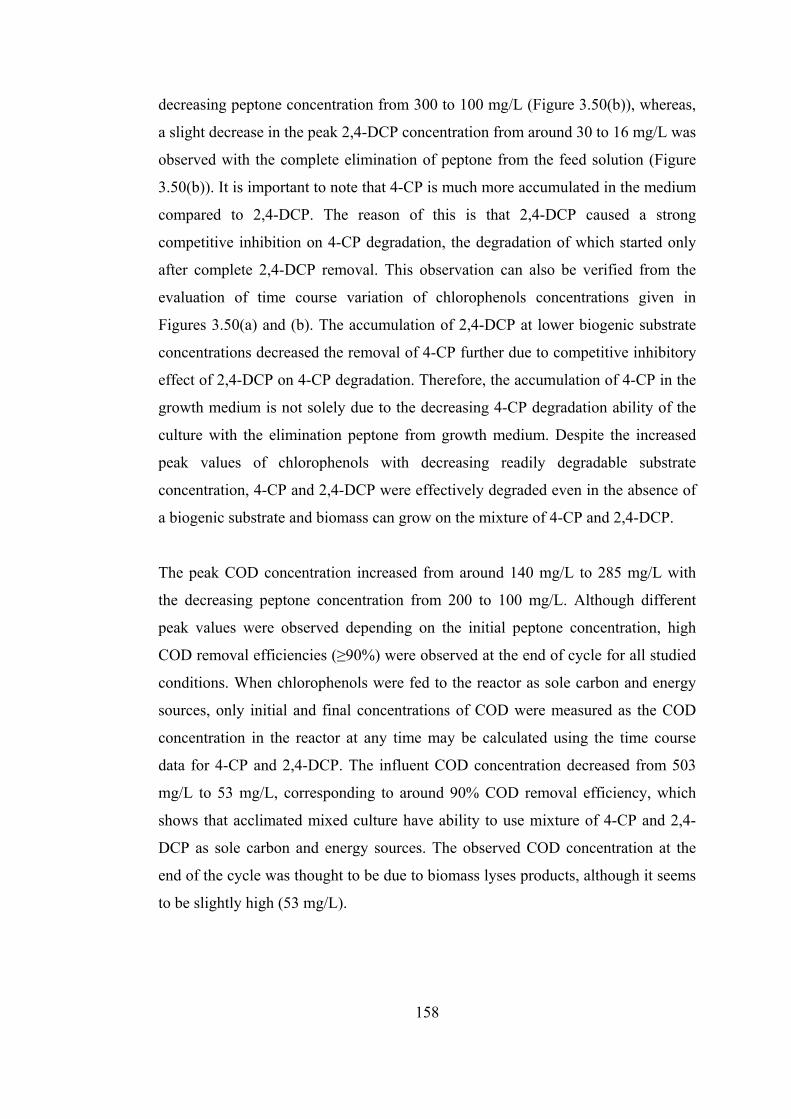
158
decreasing peptone concentration from 300 to 100 mg/L (Figure 3.50(b)), whereas,
a slight decrease in the peak 2,4-DCP concentration from around 30 to 16 mg/L was
observed with the complete elimination of peptone from the feed solution (Figure
3.50(b)). It is important to note that 4-CP is much more accumulated in the medium
compared to 2,4-DCP. The reason of this is that 2,4-DCP caused a strong
competitive inhibition on 4-CP degradation, the degradation of which started only
after complete 2,4-DCP removal. This observation can also be verified from the
evaluation of time course variation of chlorophenols concentrations given in
Figures 3.50(a) and (b). The accumulation of 2,4-DCP at lower biogenic substrate
concentrations decreased the removal of 4-CP further due to competitive inhibitory
effect of 2,4-DCP on 4-CP degradation. Therefore, the accumulation of 4-CP in the
growth medium is not solely due to the decreasing 4-CP degradation ability of the
culture with the elimination peptone from growth medium. Despite the increased
peak values of chlorophenols with decreasing readily degradable substrate
concentration, 4-CP and 2,4-DCP were effectively degraded even in the absence of
a biogenic substrate and biomass can grow on the mixture of 4-CP and 2,4-DCP.
The peak COD concentration increased from around 140 mg/L to 285 mg/L with
the decreasing peptone concentration from 200 to 100 mg/L. Although different
peak values were observed depending on the initial peptone concentration, high
COD removal efficiencies (≥90%) were observed at the end of cycle for all studied
conditions. When chlorophenols were fed to the reactor as sole carbon and energy
sources, only initial and final concentrations of COD were measured as the COD
concentration in the reactor at any time may be calculated using the time course
data for 4-CP and 2,4-DCP. The influent COD concentration decreased from 503
mg/L to 53 mg/L, corresponding to around 90% COD removal efficiency, which
shows that acclimated mixed culture have ability to use mixture of 4-CP and 2,4-
DCP as sole carbon and energy sources. The observed COD concentration at the
end of the cycle was thought to be due to biomass lyses products, although it seems
to be slightly high (53 mg/L).
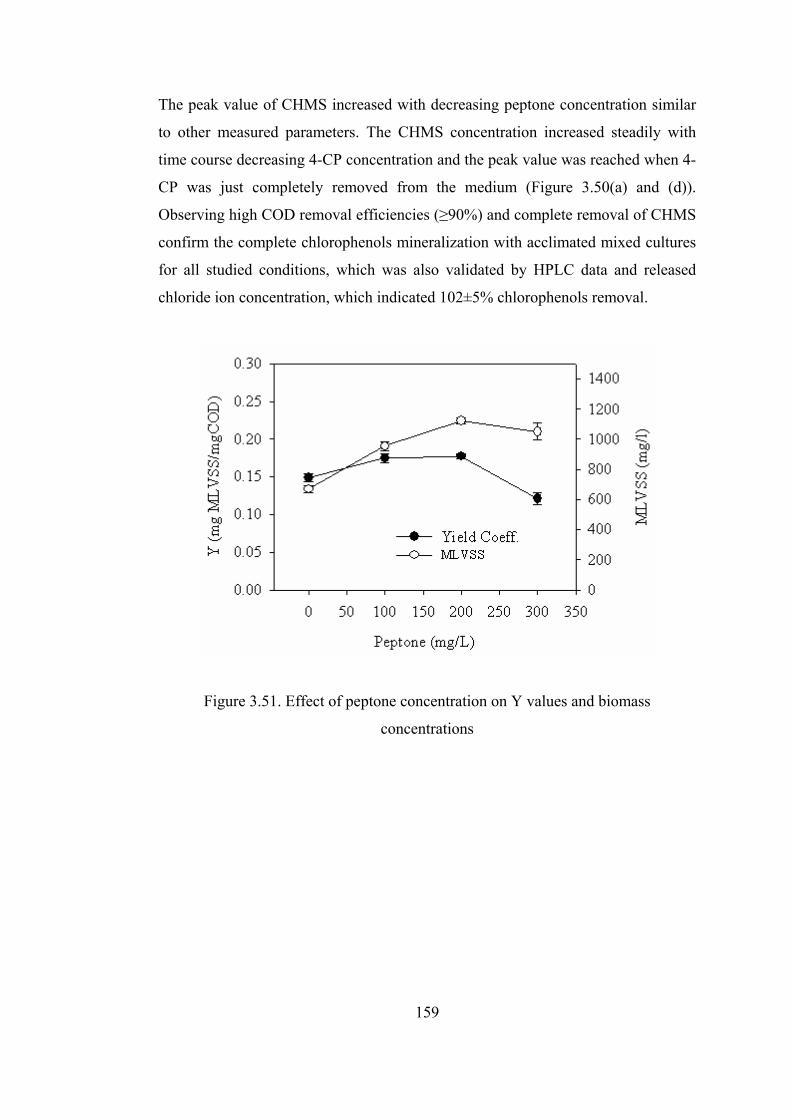
159
The peak value of CHMS increased with decreasing peptone concentration similar
to other measured parameters. The CHMS concentration increased steadily with
time course decreasing 4-CP concentration and the peak value was reached when 4-
CP was just completely removed from the medium (Figure 3.50(a) and (d)).
Observing high COD removal efficiencies (≥90%) and complete removal of CHMS
confirm the complete chlorophenols mineralization with acclimated mixed cultures
for all studied conditions, which was also validated by HPLC data and released
chloride ion concentration, which indicated 102±5% chlorophenols removal.
Figure 3.51. Effect of peptone concentration on Y values and biomass
concentrations
160
4-C
P re
mov
al ra
te (m
g/L.
h)
0
50
100
150300 mg/L 200 mg/L 100 mg/L 0 mg/L
Time (h)
0 2 4 6 8
2,4-
DC
P re
mov
al ra
te (m
g/L.
h)
0
20
40
60
80
300 mg/L 200 mg/L100 mg/L0 mg/L
Figure 3.52. Effect of peptone concentration on removal rates of 4-CP and 2,4-DCP
The reason for the increases in peak concentrations of measured parameters with
decreasing peptone concentration may be due to decreasing biomass concentration
(Figure 3.51). The effect of peptone concentration on the observed yield coefficient
(Y) and MLVSS values are depicted in Figure 3.51. Another striking conclusion,
which can be drawn from Figure 3.51, is that Y did not correlate with peptone
concentration and the average value was observed to be 0.155±0.028 (CV=18%)
mg MLVSS/mg COD. The Y value was significantly lower than one expected for a
readily degradable substrate (0.4-0.6 MLVSS/mg COD) and it was 0.42±0.008 mg
MLVSS/mg COD on only peptone in instantaneously fed SBR.
161
Effect of peptone concentration on time course degradation rates of 4-CP and 2,4-
DCP are given in Figure 3.52. In the calculation of degradation rates the following
equation was used and the change in volume of the reactor was taken into account;
rVQCVdtdc
−= 0 (3.16)
Where, C and C0 are chlorophenol concentrations (mg/L) in SBR and feed,
respectively. V (L) is total reactor volume and r is chlorophenol removal rate
(mg/L.h). Total volume during the filling period of the reactor is;
QtVV += 0 (3.17)
Where, V0 is settled sludge volume at the start of the cycle. Hence, degradation rate
can be observed as;
dtdc
QtVQC
r −+
=0
0 . (3.18).
Degradation rates of 4-CP and 2,4-DCP were very high at the start of the
experiments for 300 and 200 mg/L of influent peptone concentrations. The
observed initial degradation rates for 4-CP decreased to very low values for peptone
concentrations of 100 and 0 mg/L, which caused accumulation of chlorophenols
within the reactor. The maximum observed 4-CP degradation rate increased slightly
with decreasing peptone concentration from 300 to 200 mg/L. The reason of this
increase in degradation rate is due to the slight increase in peak 4-CP concentration
from 2 to 12.5 mg/L. Degradation of chlorophenols obeys Andrews kinetics, which
means chlorophenol degradation rate increases up to a certain concentration
(critical substrate concentration) at which degradation rate is maximum, whereas,
after this point degradation rate decreases with increasing 4-CP concentration. 4-CP
critical substrate concentration was previously observed to be close to 53 mg/L.
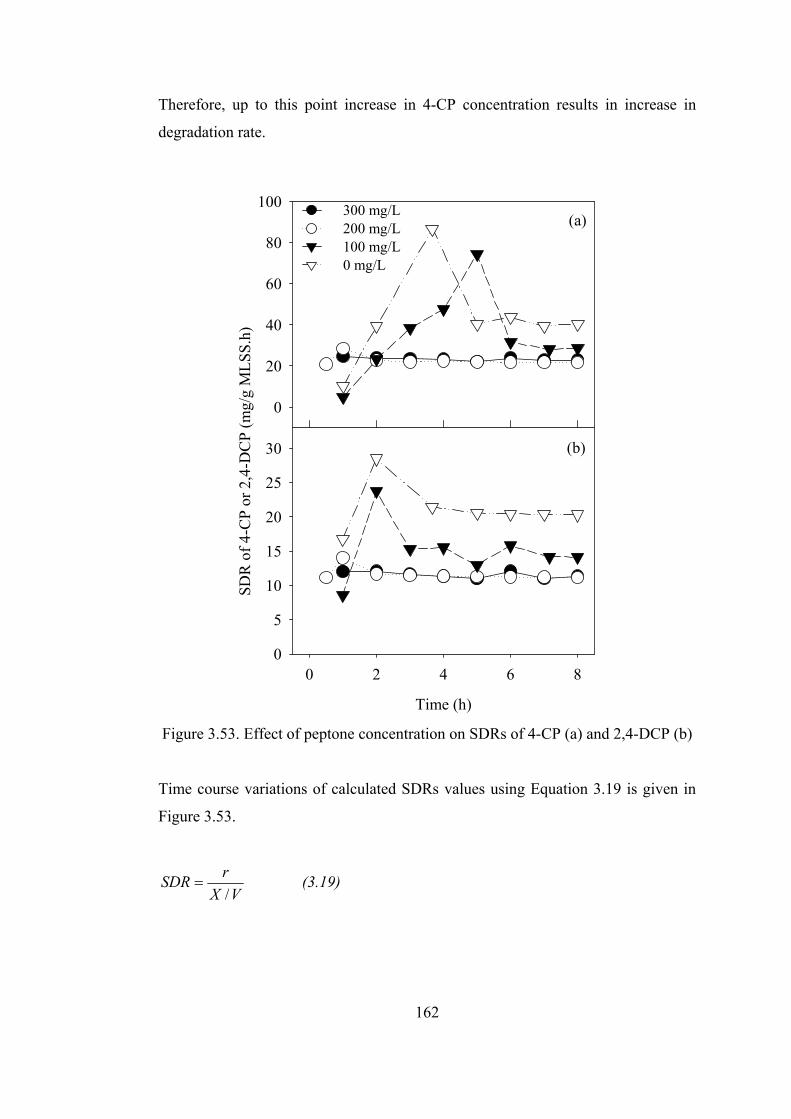
162
Therefore, up to this point increase in 4-CP concentration results in increase in
degradation rate.
Time (h)
0 2 4 6 80
5
10
15
20
25
30
SDR
of 4
-CP
or 2
,4-D
CP
(mg/
g M
LSS.
h)
0
20
40
60
80
100 300 mg/L 200 mg/L100 mg/L0 mg/L
(a)
(b)
Figure 3.53. Effect of peptone concentration on SDRs of 4-CP (a) and 2,4-DCP (b)
Time course variations of calculated SDRs values using Equation 3.19 is given in
Figure 3.53.
VXrSDR/
= (3.19)
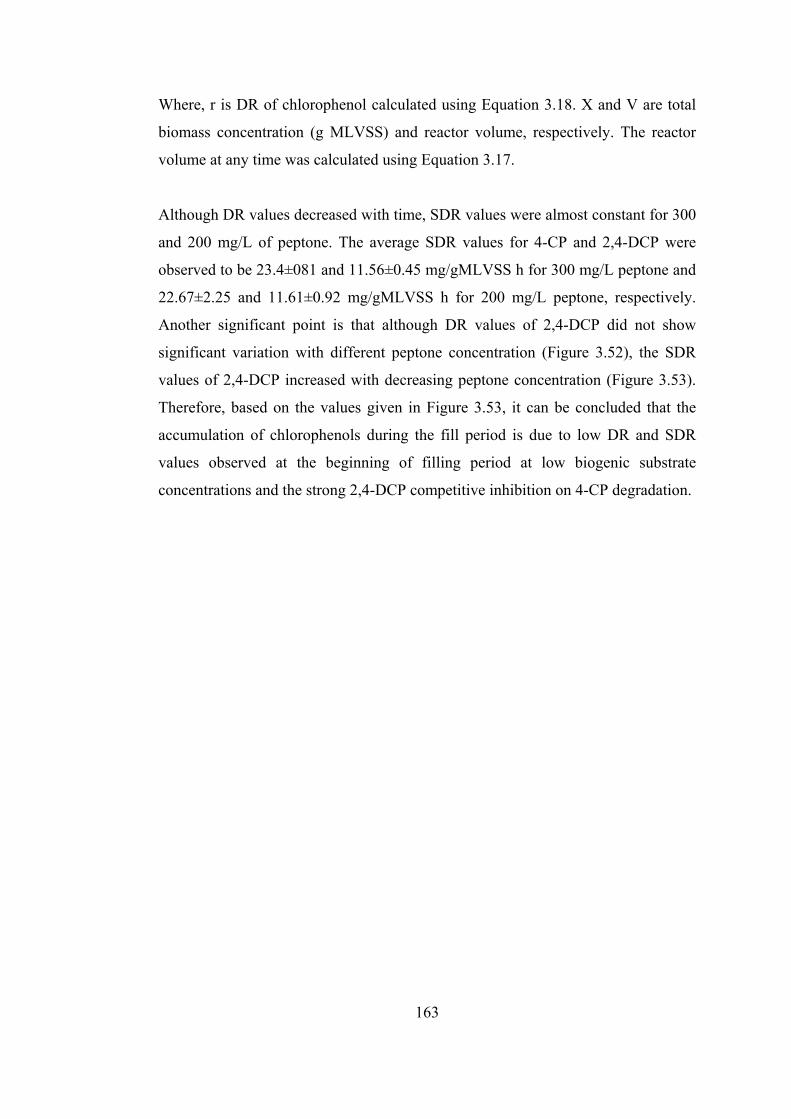
163
Where, r is DR of chlorophenol calculated using Equation 3.18. X and V are total
biomass concentration (g MLVSS) and reactor volume, respectively. The reactor
volume at any time was calculated using Equation 3.17.
Although DR values decreased with time, SDR values were almost constant for 300
and 200 mg/L of peptone. The average SDR values for 4-CP and 2,4-DCP were
observed to be 23.4±081 and 11.56±0.45 mg/gMLVSS h for 300 mg/L peptone and
22.67±2.25 and 11.61±0.92 mg/gMLVSS h for 200 mg/L peptone, respectively.
Another significant point is that although DR values of 2,4-DCP did not show
significant variation with different peptone concentration (Figure 3.52), the SDR
values of 2,4-DCP increased with decreasing peptone concentration (Figure 3.53).
Therefore, based on the values given in Figure 3.53, it can be concluded that the
accumulation of chlorophenols during the fill period is due to low DR and SDR
values observed at the beginning of filling period at low biogenic substrate
concentrations and the strong 2,4-DCP competitive inhibition on 4-CP degradation.
164
Rem
./Loa
d. R
ate
of 4
-CP
0.0
0.5
1.0
1.5
2.0
2.5
3.0 300 mg/L 200 mg/L100 mg/L 0 mg/L
Time (h)
0 2 4 6 8
Rem
./Lod
. ate
of 2
,4-D
CP
0.4
0.6
0.8
1.0
1.2
1.4
1.6
1.8 300 mg/L200 mg/L100 mg/L 0 mg/L
Figure 3.54. Effect of peptone concentration of removal/loading rates
of 4-CP and 2,4-DCP
The comparison of loading and degradation rates was also depicted in Figure 3.54.
The ratio of removal/loading rates were almost one during the filling of the reactor
when the initial peptone concentration was 300 and 200 mg/L. Whereas, for 100
and 0 mg/L of peptone, initial 4-CP removal/loading rates were at very low levels,
which led to the accumulation within the reactor.
165
These observations are contradictory to our previous findings as we observed that
decreasing peptone concentration did not affect the chlorophenols degradation
profiles in instantaneously fed SBRs possibly due to low chlorophenols removal
rates during the filling period of SBR. Also, different community structures may
have developed in different types of reactors and the community may have changed
in the reactors over time due to highly dynamic nature of bacterial community
(Kaewpipat and Grady, 2002). Zaidi and Mehta (1995) have reported that different
bacteria may give different response to the presence of alternative carbon source.
They reported that addition of glucose did not enhance the p-nitrophenol (PNP)
degradation of Corynebacterium strain Z4 and the bacterium utilized the two
substrates simultaneously. Glucose used at the same concentration, inhibited
degradation PNP in wastewater by Pseudomonas strain MS. However, glucose
increased the extent of degradation of PNP by Pseudomonas strain GR. Phenol also
enhanced the degradation of PNP in wastewater by Pseudomonas strain GR, but
had no effect on the degradation of PNP by Corynebacterium strain Z4. They also
reported that the concentration of toxic compound may also play important role as
the addition of glucose increased the PNP degradation by Corynebacterium strain
Z4 when PNP concentration was too low to support growth. Therefore, difference
in the community structures may be one of the reasons of observing different
outcomes. For example, Hu et al. (2005a) reported different competent biomass
fractions in three different reactor configurations. For example, the fractions of
biomass utilizing acetate, benzoate and 4-CP, in respective order, were 3.02, 5.52,
0.02% in anoxic/aerobic SBR; 34.34, 1.65, 0.03% in aerobic biofilm SBR and
53.33, 4.44 and 0.01% in aerobic SBR.
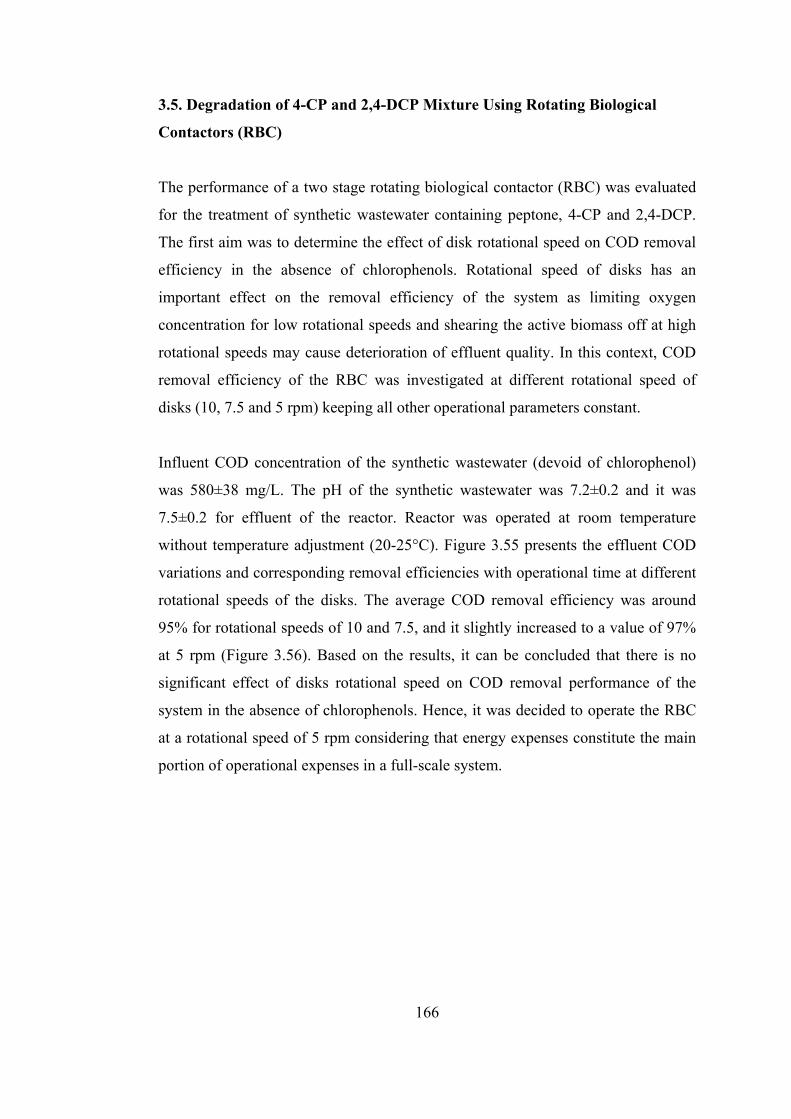
166
3.5. Degradation of 4-CP and 2,4-DCP Mixture Using Rotating Biological
Contactors (RBC)
The performance of a two stage rotating biological contactor (RBC) was evaluated
for the treatment of synthetic wastewater containing peptone, 4-CP and 2,4-DCP.
The first aim was to determine the effect of disk rotational speed on COD removal
efficiency in the absence of chlorophenols. Rotational speed of disks has an
important effect on the removal efficiency of the system as limiting oxygen
concentration for low rotational speeds and shearing the active biomass off at high
rotational speeds may cause deterioration of effluent quality. In this context, COD
removal efficiency of the RBC was investigated at different rotational speed of
disks (10, 7.5 and 5 rpm) keeping all other operational parameters constant.
Influent COD concentration of the synthetic wastewater (devoid of chlorophenol)
was 580±38 mg/L. The pH of the synthetic wastewater was 7.2±0.2 and it was
7.5±0.2 for effluent of the reactor. Reactor was operated at room temperature
without temperature adjustment (20-25°C). Figure 3.55 presents the effluent COD
variations and corresponding removal efficiencies with operational time at different
rotational speeds of the disks. The average COD removal efficiency was around
95% for rotational speeds of 10 and 7.5, and it slightly increased to a value of 97%
at 5 rpm (Figure 3.56). Based on the results, it can be concluded that there is no
significant effect of disks rotational speed on COD removal performance of the
system in the absence of chlorophenols. Hence, it was decided to operate the RBC
at a rotational speed of 5 rpm considering that energy expenses constitute the main
portion of operational expenses in a full-scale system.
167
Time (d)
0 5 10 15 20 25 30
CO
D (m
g/L)
-20
0
20
40
60
80
100
120
% re
mov
al
0
20
40
60
80
100
120
Effluent COD% removal
10 rpm 7.5 rpm 5 rpm
Figure 3.55. Variation of effluent COD and corresponding removal
efficiencies in RBC
Rotational speed (rpm)
4 5 6 7 8 9 10 11
Ave
rage
%C
OD
rem
oval
40
50
60
70
80
90
100
110
Figure 3.56. Effect of Rotational speed of Disks on the COD removal efficiency
After determination of optimum rotational speed of disks, the reactor was fed with
4-CP and 2,4-DCP mixture. Similar to SBR experiments, the ratio of feed 4-CP to
2,4-DCP was kept constant at a value of 2. In the first step of the RBC operation,
the readily degradable substrate, which was peptone, was fed to the reactor with a
168
concentration of 400 mg/L (around 400 mg/L COD) and chlorophenol
concentrations were increased gradually. In the second step of the study, the
concentrations of chlorophenols were kept constant (200 mg/L 4-CP and 100 mg/L
2,4-DCP) and peptone concentration was decreased gradually and finally, 4-CP and
2,4-DCP was fed to the system as sole carbon sources. Finally, the feed
chlorophenol concentrations were increased to find out the limits of the reactor.
Also, after acclimation to 4-CP and 2,4-DCP as a sole carbon sources, the system
was deacclimated by feeding only peptone around 2.5 months and then system was
fed with chlorophenols again to evaluate whether preacclimation decreases the time
needed for acclimation.
During the acclimation, the feeding of 4-CP and 2,4-DCP was started at
concentrations of 2 and 1 mg/L, which were gradually increased to around 20 mg/L
and 10 mg/L with respective order, within 15 days. Although complete degradation
of chlorophenols was observed up to this point without any degradation byproduct,
a straw yellow color due to CHMS accumulation appeared at the effluent of the
reactor. Although, both 4-CP and 2,4-DCP removals were almost complete, the
CHMS was not removed and it appeared without any decrease in its concentration
for around 1 month. Accumulation of biomass was observed at the corners of the
reactor, which was not observed for the feed devoid of chlorophenols. The
accumulation of biomass was due partly to insufficient mixing of the reactor
content at low rotational speed and it was observed that produced sludge had a quite
well settling ability. In addition, the dissolved oxygen concentration in the first
stage was lower than 1 mg/L, which caused a dense filamentous growth (Figure
3.57). When the reactor was fed with peptone in the absence of the chlorophenol,
although slightly thick film and filamentous growth was observed, the
concentration of oxygen was always higher than 1 mg/L. The decrease of oxygen
concentration in the presence of chlorophenol favored the filamentous growth. This
situation was more noteworthy in the first stage due to rapid removal of organic
matter (Figure 3.58), which was also reported in the study of Surampali and
Baumann (1997). The development of filamentous organism such as Beggiatoa at
169
low dissolved oxygen concentrations due to rapid removal of COD in the first stage
of the reactor was well known problem in RBC operation (Metcalf and Eddy,
1991). After one month, the rotational speed of the reactor was increased to 10 rpm
to increase dissolved oxygen transfer rate. However, the biomass on the disks was
almost completely sloughed off and the performance of the reactor further
deteriorated. It should be noted that although high COD removal efficiencies were
observed when the reactor was operated at a rotational speed of 5-10 rpm in the
absence of chlorophenols, the biomass could not attach on the disk surfaces when
the reactor was operated at a rotational speed of 10 rpm when the feed contained
mixture of 4-CP and 2,4-DCP. This observation leads to state that dominant species
in the presence of chlorophenols were more sensitive and they can easily be
detached from the surface of the disks. As the biomass on disks was almost
completely lost, the reactor was inoculated again with a fresh activated sludge not
previously exposed to chlorophenols. After fresh inoculation, the rotational speed
was adjusted to 5 rpm and the liquid phase of the reactor was aerated to have
around 3 mg/L of dissolved oxygen. Under these conditions, CHMS disappeared in
the effluent of RBC within a few days along with a complete removal of
chlorophenols. With the supplementation of air, in addition to complete
chlorophenols removal along with intermediates, filamentous growth on disks was
completely eliminated and development of a thin but dense biofilm was observed
(Figure 3.59). Air supplementation was also caused complete mixing of the reactor
content, which prevented the accumulation of biomass within the reactor. The
beneficial effect of air supplementation was also reported in the study of Surampali
and Baumann (1997). In another study, Kargi and Uygur (1997) also reported a
remarkable increase in the performance of the RBC unit with the liquid phase
aeration in the treatment of saline wastewater.
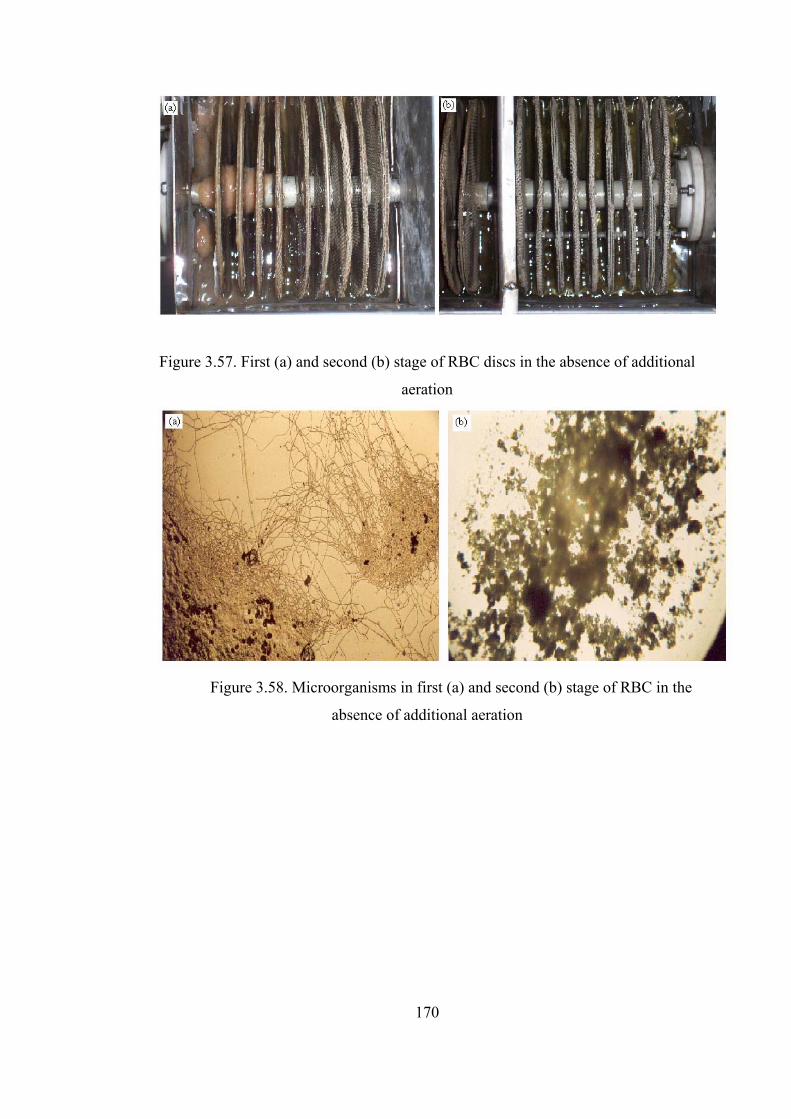
170
Figure 3.57. First (a) and second (b) stage of RBC discs in the absence of additional
aeration
Figure 3.58. Microorganisms in first (a) and second (b) stage of RBC in the
absence of additional aeration
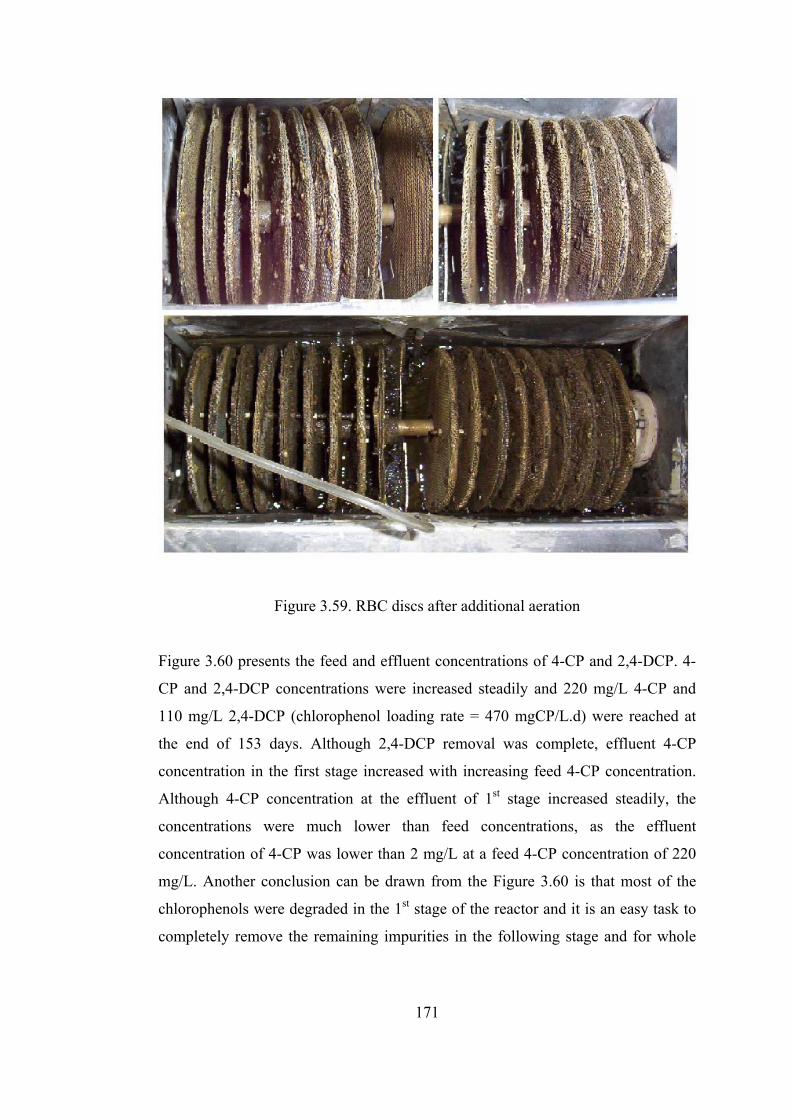
171
Figure 3.59. RBC discs after additional aeration
Figure 3.60 presents the feed and effluent concentrations of 4-CP and 2,4-DCP. 4-
CP and 2,4-DCP concentrations were increased steadily and 220 mg/L 4-CP and
110 mg/L 2,4-DCP (chlorophenol loading rate = 470 mgCP/L.d) were reached at
the end of 153 days. Although 2,4-DCP removal was complete, effluent 4-CP
concentration in the first stage increased with increasing feed 4-CP concentration.
Although 4-CP concentration at the effluent of 1st stage increased steadily, the
concentrations were much lower than feed concentrations, as the effluent
concentration of 4-CP was lower than 2 mg/L at a feed 4-CP concentration of 220
mg/L. Another conclusion can be drawn from the Figure 3.60 is that most of the
chlorophenols were degraded in the 1st stage of the reactor and it is an easy task to
completely remove the remaining impurities in the following stage and for whole
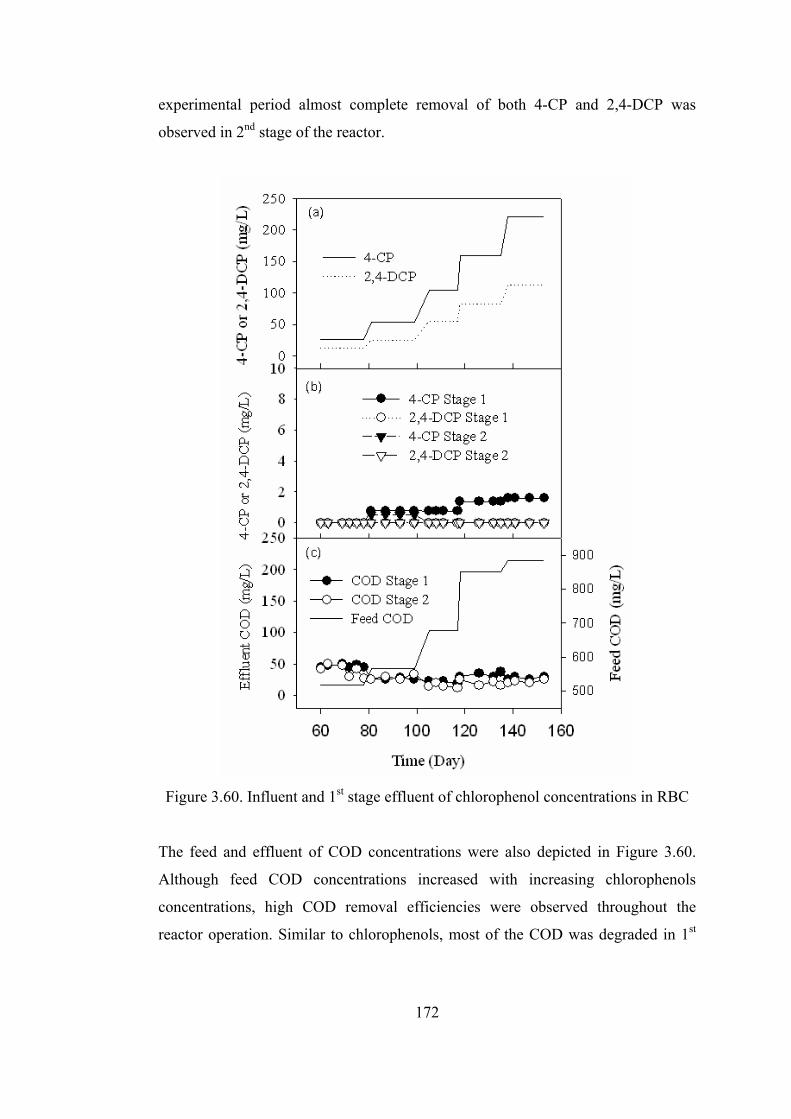
172
experimental period almost complete removal of both 4-CP and 2,4-DCP was
observed in 2nd stage of the reactor.
Figure 3.60. Influent and 1st stage effluent of chlorophenol concentrations in RBC
The feed and effluent of COD concentrations were also depicted in Figure 3.60.
Although feed COD concentrations increased with increasing chlorophenols
concentrations, high COD removal efficiencies were observed throughout the
reactor operation. Similar to chlorophenols, most of the COD was degraded in 1st
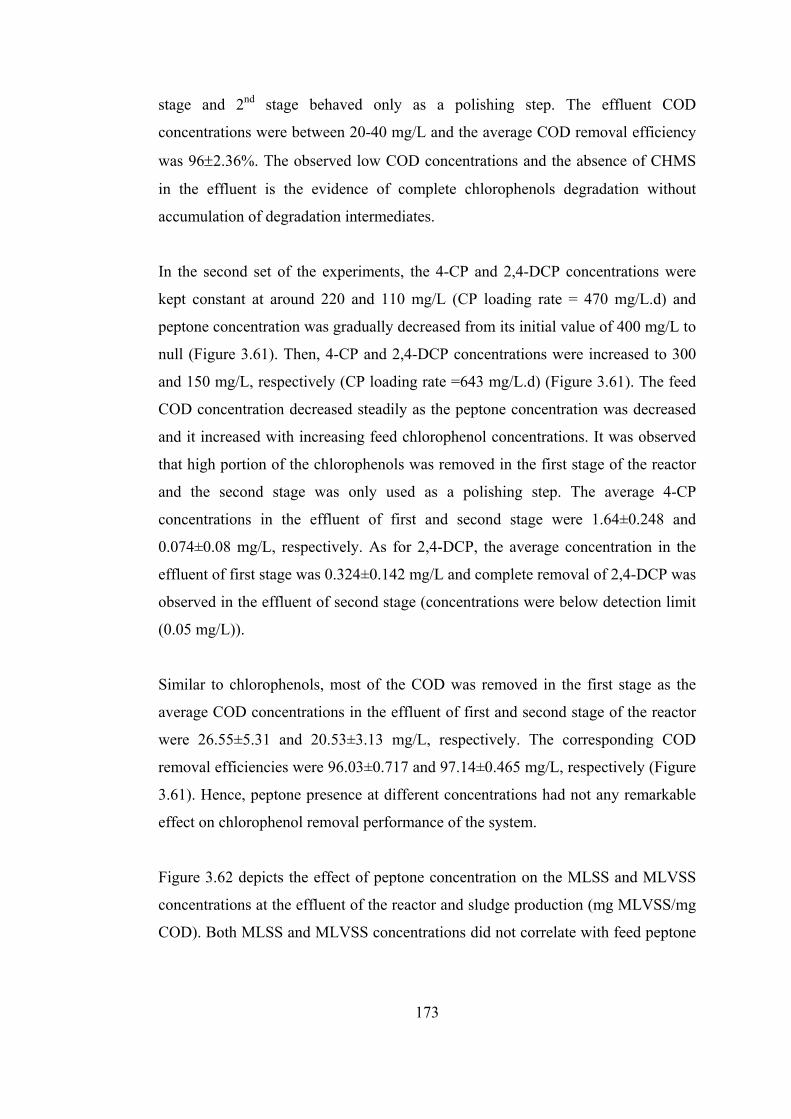
173
stage and 2nd stage behaved only as a polishing step. The effluent COD
concentrations were between 20-40 mg/L and the average COD removal efficiency
was 96±2.36%. The observed low COD concentrations and the absence of CHMS
in the effluent is the evidence of complete chlorophenols degradation without
accumulation of degradation intermediates.
In the second set of the experiments, the 4-CP and 2,4-DCP concentrations were
kept constant at around 220 and 110 mg/L (CP loading rate = 470 mg/L.d) and
peptone concentration was gradually decreased from its initial value of 400 mg/L to
null (Figure 3.61). Then, 4-CP and 2,4-DCP concentrations were increased to 300
and 150 mg/L, respectively (CP loading rate =643 mg/L.d) (Figure 3.61). The feed
COD concentration decreased steadily as the peptone concentration was decreased
and it increased with increasing feed chlorophenol concentrations. It was observed
that high portion of the chlorophenols was removed in the first stage of the reactor
and the second stage was only used as a polishing step. The average 4-CP
concentrations in the effluent of first and second stage were 1.64±0.248 and
0.074±0.08 mg/L, respectively. As for 2,4-DCP, the average concentration in the
effluent of first stage was 0.324±0.142 mg/L and complete removal of 2,4-DCP was
observed in the effluent of second stage (concentrations were below detection limit
(0.05 mg/L)).
Similar to chlorophenols, most of the COD was removed in the first stage as the
average COD concentrations in the effluent of first and second stage of the reactor
were 26.55±5.31 and 20.53±3.13 mg/L, respectively. The corresponding COD
removal efficiencies were 96.03±0.717 and 97.14±0.465 mg/L, respectively (Figure
3.61). Hence, peptone presence at different concentrations had not any remarkable
effect on chlorophenol removal performance of the system.
Figure 3.62 depicts the effect of peptone concentration on the MLSS and MLVSS
concentrations at the effluent of the reactor and sludge production (mg MLVSS/mg
COD). Both MLSS and MLVSS concentrations did not correlate with feed peptone
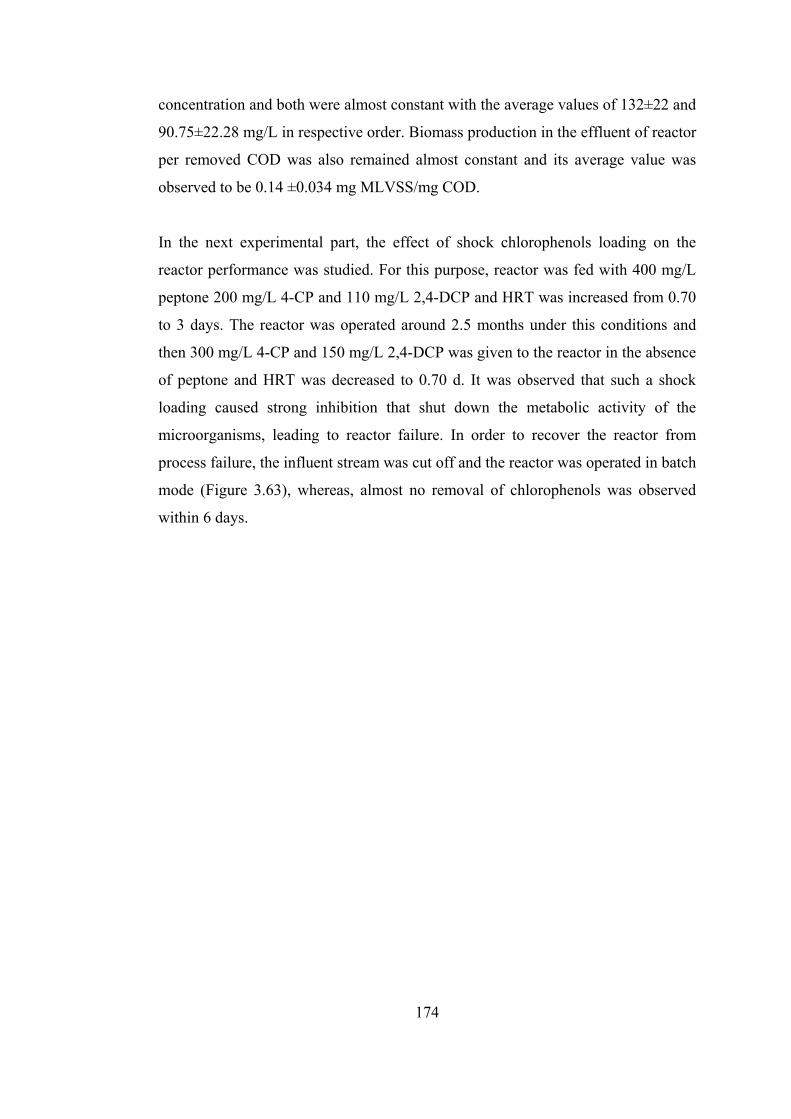
174
concentration and both were almost constant with the average values of 132±22 and
90.75±22.28 mg/L in respective order. Biomass production in the effluent of reactor
per removed COD was also remained almost constant and its average value was
observed to be 0.14 ±0.034 mg MLVSS/mg COD.
In the next experimental part, the effect of shock chlorophenols loading on the
reactor performance was studied. For this purpose, reactor was fed with 400 mg/L
peptone 200 mg/L 4-CP and 110 mg/L 2,4-DCP and HRT was increased from 0.70
to 3 days. The reactor was operated around 2.5 months under this conditions and
then 300 mg/L 4-CP and 150 mg/L 2,4-DCP was given to the reactor in the absence
of peptone and HRT was decreased to 0.70 d. It was observed that such a shock
loading caused strong inhibition that shut down the metabolic activity of the
microorganisms, leading to reactor failure. In order to recover the reactor from
process failure, the influent stream was cut off and the reactor was operated in batch
mode (Figure 3.63), whereas, almost no removal of chlorophenols was observed
within 6 days.
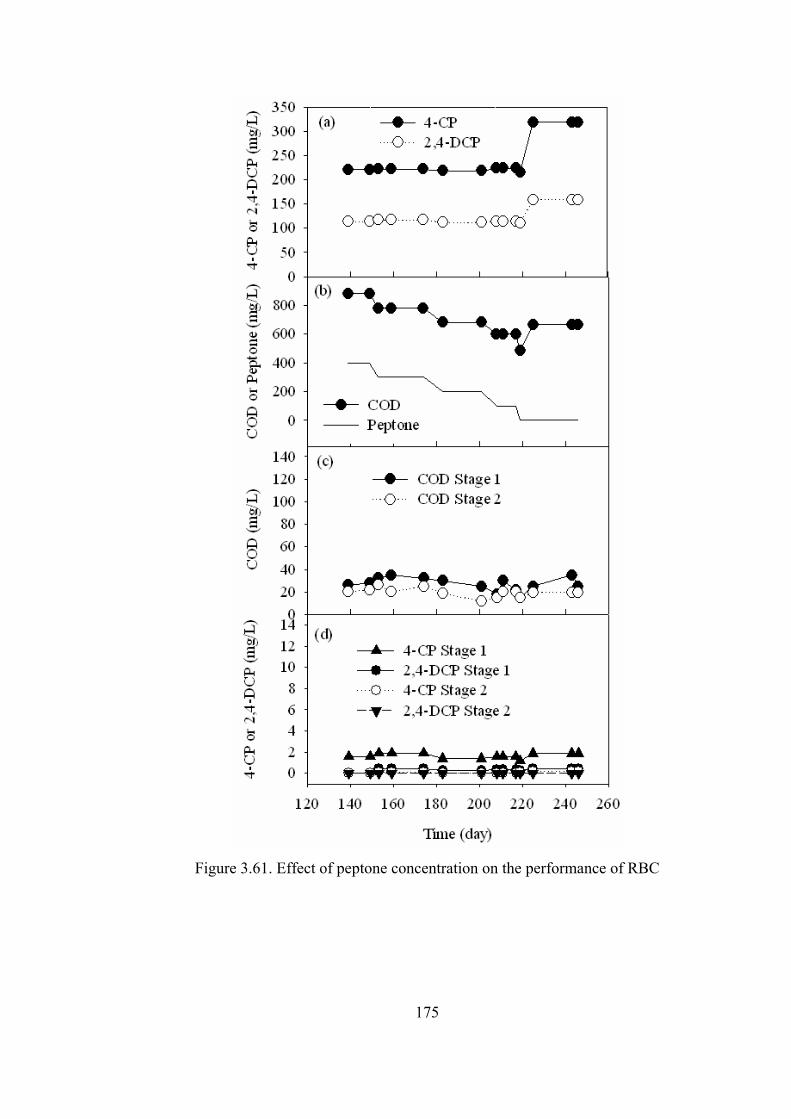
175
Figure 3.61. Effect of peptone concentration on the performance of RBC
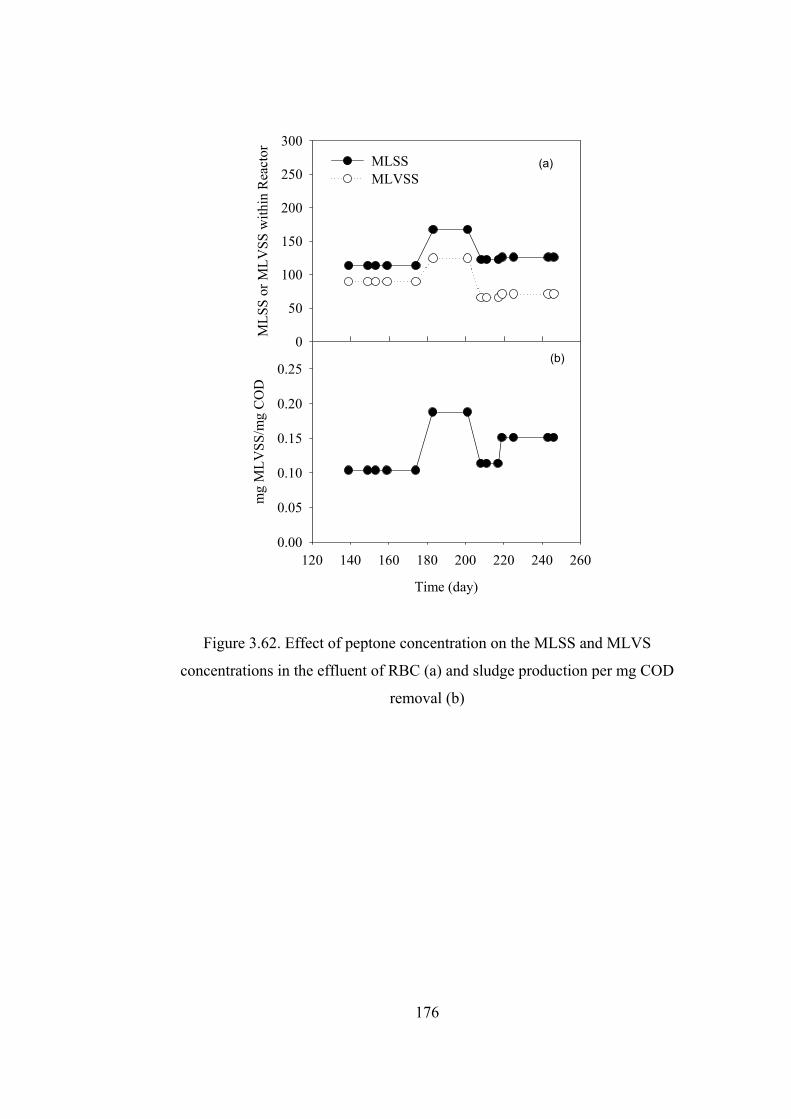
176
MLS
S or
MLV
SS w
ithin
Rea
ctor
0
50
100
150
200
250
300MLSSMLVSS
Time (day)
120 140 160 180 200 220 240 260
mg
MLV
SS/m
g C
OD
0.00
0.05
0.10
0.15
0.20
0.25
(a)
(b)
Figure 3.62. Effect of peptone concentration on the MLSS and MLVS
concentrations in the effluent of RBC (a) and sludge production per mg COD
removal (b)
177
Time (day)
0 1 2 3 4 5 6 7
4-C
P or
2,4
-DC
P (m
g/L)
0
50
100
150
200
250
300
350
4-CP2,4-DCP
Figure 3.63. Batch wise operation of RBC to recover the reactor from process
failure
After this observation, the reactor was fed again continuously with 400 mg/L of
peptone in the absence of chlorophenol for 3.5 months. The aim is deacclimate the
biomass and then evaluate the need of time to reacclimate the biomass to
chlorophenols. Hence, after 3.5 months of operation with peptone only,
chlorophenols were added again. Before addition of chlorophenols, it was observed
that biomass have a good ability of peptone removal as the 400 mg/L COD in the
influent decreased to 12 mg/L in the effluent. Figure 3.64 shows the feed and
effluent chlorophenols concentrations. The reactor can directly start with a high
removal efficiency when 4-CP and 2,4-DCP were started to be fed at 25 and 12.5
mg/L. Within16 days, 4-CP and 24-DCP concentrations were increased to 200 and
100 mg/L, respectively and no deterioration in the removal efficiency have been
observed. When reactor was fed with 400 mg/L peptone, 200 mg/L 4-CP and 100
mg/L 2,4-DCP, high COD removal efficiencies were also observed as the synthetic
wastewater COD of 915±13 mg/L decreased to 17±2 mg/L in the effluent. The high
COD removal was the indicative of complete removal of chlorophenols without
178
accumulation of by-products, which was also verified by HPLC measurements. On
day 37, peptone concentration was instantaneously decreased from 400 to 0 mg/L
and no deterioration in the removal efficiency was observed (Figure 3.64). Also, on
day 52, when the feed COD was 473±5 mg/L, 1st and 2nd stage COD of the reactor
were 10 and 7 mg/L, respectively. When feed 4-CP and 2,4-DCP concentrations
were 200 and 100 mg/L, respectively, the average effluent chlorophenols
concentrations between days 37 and 52 are given in Table 3.8.
Table 3.8. Average chlorophenols concentrations within days 37 and 52
Compound Influent
(mg/L)
Stg-1 Effluent
(mg/L)
Stg-2 Effluent
(mg/L)
4-CP 208.35±5.2 1.07±0.25 0.077±0.031
2,4-DCP 106.86±4.6 0.236±0.082 <0.050
179
4-C
P or
2,4
-DC
P (m
g/L)
0
100
200
300
Pept
one
(mg/
L)
0
100
200
300
400
5004-CP 2,4-DCPPeptone
Time (day)
0 10 20 30 40 50 60
4-C
P or
2,4
-DC
P (m
g/L)
0.0
0.5
1.0
1.5
2.04-CP Stage 14-CP Stage 22,4-DCP Stage 12,4-DCP Stage 2
(a)
(b)
Figure 3.64. Influent (a) and effluent (b) chlorophenols concentrations in RBC
As explained above no adverse effect of peptone exclusion was observed on the
performance of the reactor. In order to evaluate the effect of sudden peptone
exclusion from the feed of the reactor on chlorophenol removal rate, batch
experiments were carried out using sludge drawn from the reactor on day 32
(Figure 3.65). The RBC effluent was directly used to carry out batch experiments in
which average MLVSS concentration was around 110 mg/L.
180
2,4-
DC
P (m
g/L)
0.0
0.5
1.0
1.5
2.0
2.5w/o peptone 1w/o peptone 2w/ peptone 1w/peptone 2
Time (h)
0 1 2 3 4
4-C
P (m
g/L)
0
2
4
6w/o peptone 1w/o peptone 2w/peptone 1w/ peptone 2
Figure 3.65. Batch experiments conducted in the presence and absence of peptone
using sludge from RBC on day 32
No effect of peptone on chlorophenols removal pattern was observed also in batch
experiments (Figure 3.65).
181
Figure 3.66. Feed chlorophenols concentrations (a) and effluent CHMS as
absorbance at 380 nm (ABS380) (b) during the shock loading experiments
In the next stage of the study, effect of shock chlorophenols loading on the reactor
performance was deeply investigated. The chlorophenols were fed to the reactor as
sole carbon sources and the concentrations were increased as shown in Figure
3.66(a). The initial 4-CP and 2,4-DCP concentrations were around 200 and 100
mg/L, respectively, and the concentrations were increased up to 822.7±1.4 and
424.6±1.9 mg/L (total CP loading = 1781 mg/L.d) in respective order within 7 days.
As feed chlorophenols concentrations were increased, the effluent concentrations in
both stages increased linearly (Figure 3.67). For both stages, the effluent 4-CP
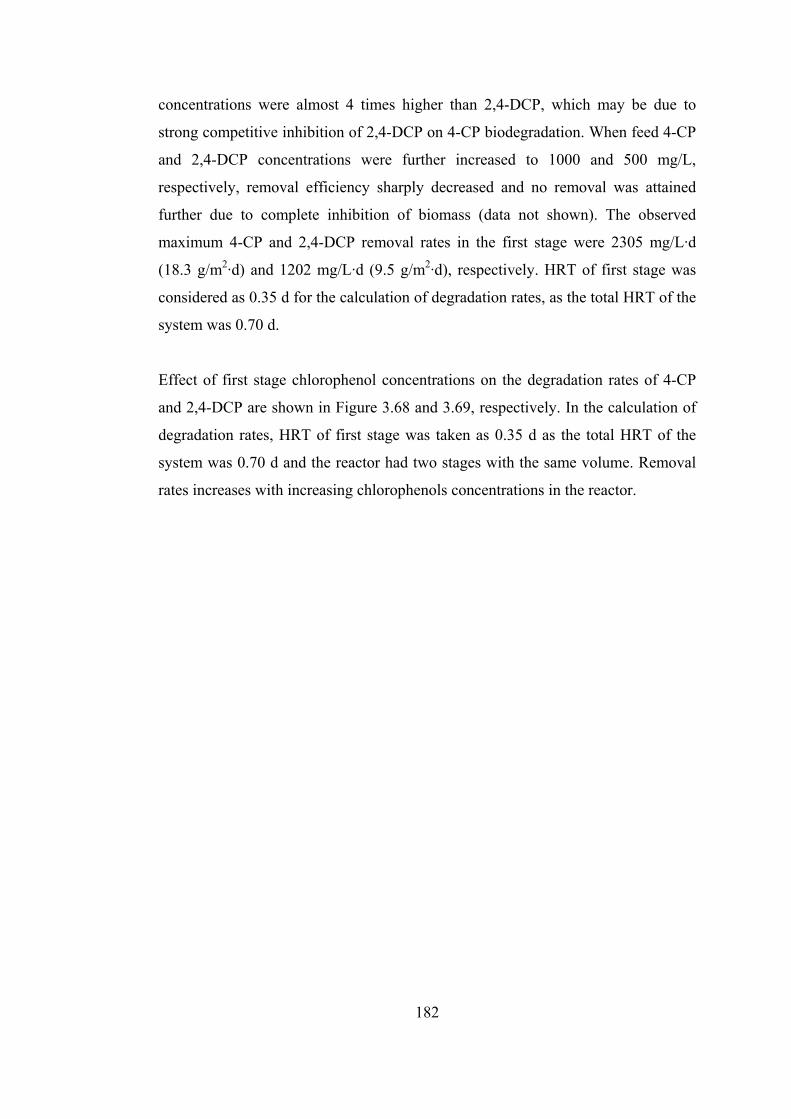
182
concentrations were almost 4 times higher than 2,4-DCP, which may be due to
strong competitive inhibition of 2,4-DCP on 4-CP biodegradation. When feed 4-CP
and 2,4-DCP concentrations were further increased to 1000 and 500 mg/L,
respectively, removal efficiency sharply decreased and no removal was attained
further due to complete inhibition of biomass (data not shown). The observed
maximum 4-CP and 2,4-DCP removal rates in the first stage were 2305 mg/L·d
(18.3 g/m2·d) and 1202 mg/L·d (9.5 g/m2·d), respectively. HRT of first stage was
considered as 0.35 d for the calculation of degradation rates, as the total HRT of the
system was 0.70 d.
Effect of first stage chlorophenol concentrations on the degradation rates of 4-CP
and 2,4-DCP are shown in Figure 3.68 and 3.69, respectively. In the calculation of
degradation rates, HRT of first stage was taken as 0.35 d as the total HRT of the
system was 0.70 d and the reactor had two stages with the same volume. Removal
rates increases with increasing chlorophenols concentrations in the reactor.
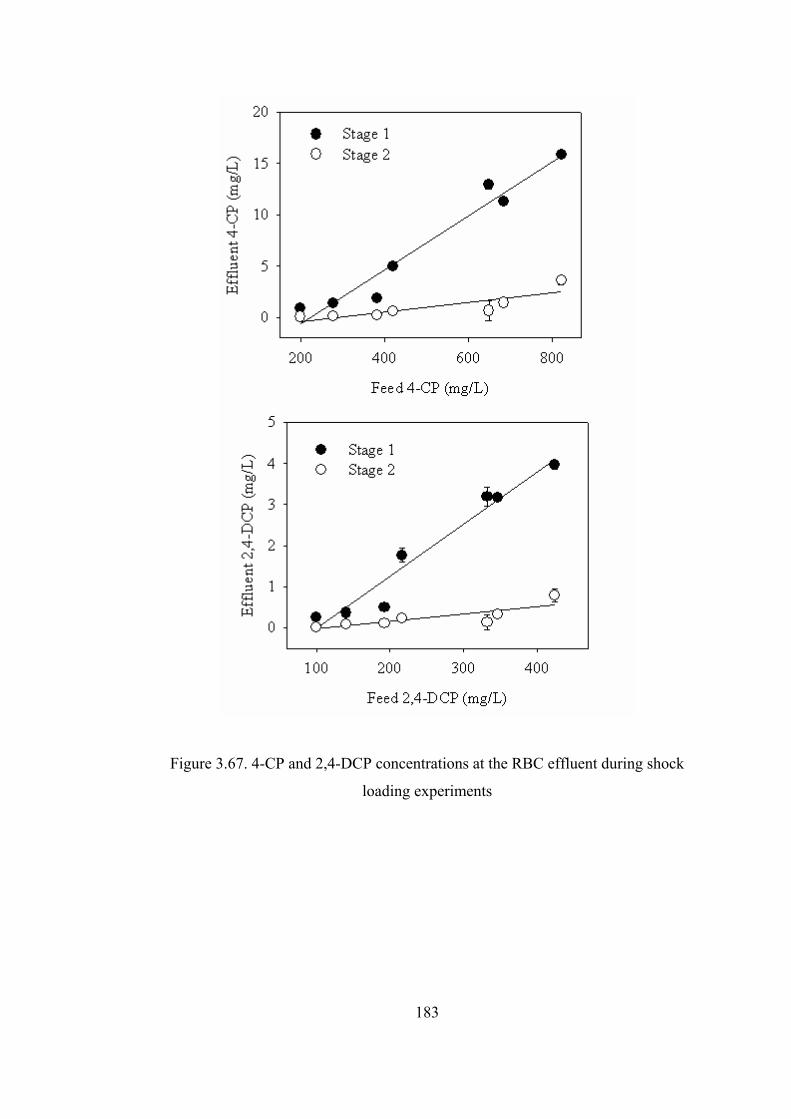
183
Figure 3.67. 4-CP and 2,4-DCP concentrations at the RBC effluent during shock
loading experiments
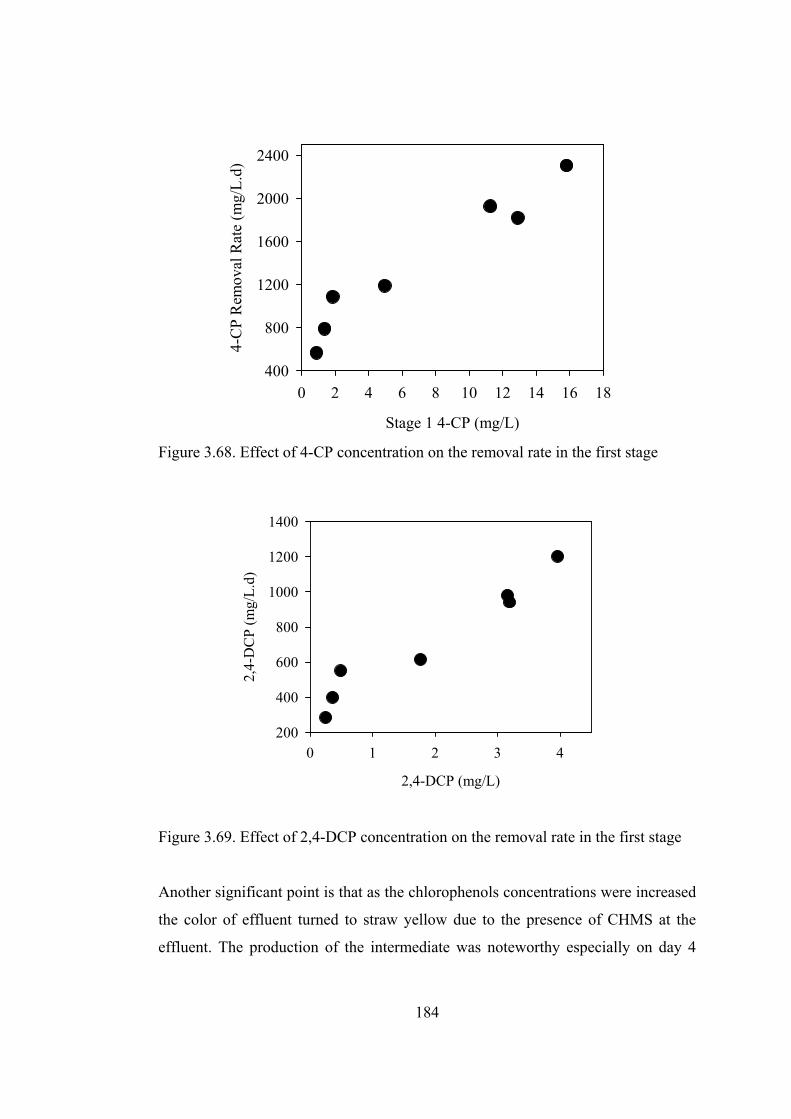
184
Stage 1 4-CP (mg/L)
0 2 4 6 8 10 12 14 16 18
4-C
P R
emov
al R
ate
(mg/
L.d)
400
800
1200
1600
2000
2400
Figure 3.68. Effect of 4-CP concentration on the removal rate in the first stage
2,4-DCP (mg/L)
0 1 2 3 4
2,4-
DC
P (m
g/L.
d)
200
400
600
800
1000
1200
1400
Figure 3.69. Effect of 2,4-DCP concentration on the removal rate in the first stage
Another significant point is that as the chlorophenols concentrations were increased
the color of effluent turned to straw yellow due to the presence of CHMS at the
effluent. The production of the intermediate was noteworthy especially on day 4
185
and 5 when feed 4-CP and 2,4-DCP concentrations were around 650 and 333 mg/L,
respectively. In Figure 3.70, effluents from second stage of the RBC on day 2 and 4
are illustrated. The maximum reached ABS380 were slightly lower than 1.0 and
using the extinction coefficient given by Farrell and Quilty (1999), the maximum
CHMS at the effluent can be calculated as around 3.8 mg/L. When feed 4-CP
concentration was 650 mg/L, the theoretically produced amount of CHMS
concentration was calculated as 813 mg/L, therefore the effluent CHMS
concentration is only 0.47% of its theoretical amount.
Figure 3.70. Effluent from second stage of RBC on day 2 and 4
Chlorophenols removal and loading rates are shown in Figure 3.71 and 3.72 for the
first and second stage, respectively. Loading rates were almost equal to removal
rates when 4-CP and 2,4-DCP loading rates in the first stage were 2300 and 1200
mg/L.d (total CP loading rate = 3500 mg/l.d), respectively. When the 4-CP and 2,4-
DCP loading rate increased to 2847 and 1441 mg/L.d (total CP loading = 4288
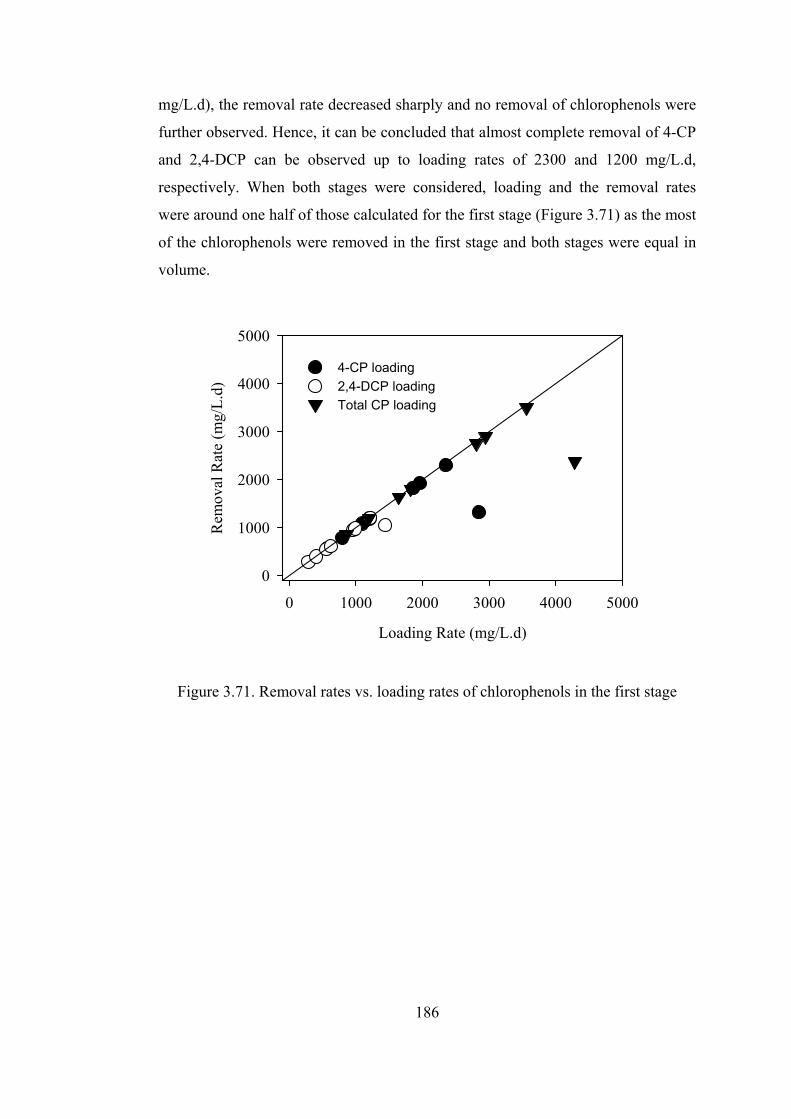
186
mg/L.d), the removal rate decreased sharply and no removal of chlorophenols were
further observed. Hence, it can be concluded that almost complete removal of 4-CP
and 2,4-DCP can be observed up to loading rates of 2300 and 1200 mg/L.d,
respectively. When both stages were considered, loading and the removal rates
were around one half of those calculated for the first stage (Figure 3.71) as the most
of the chlorophenols were removed in the first stage and both stages were equal in
volume.
Loading Rate (mg/L.d)
0 1000 2000 3000 4000 5000
Rem
oval
Rat
e (m
g/L.
d)
0
1000
2000
3000
4000
5000
4-CP loading2,4-DCP loadingTotal CP loading
Figure 3.71. Removal rates vs. loading rates of chlorophenols in the first stage
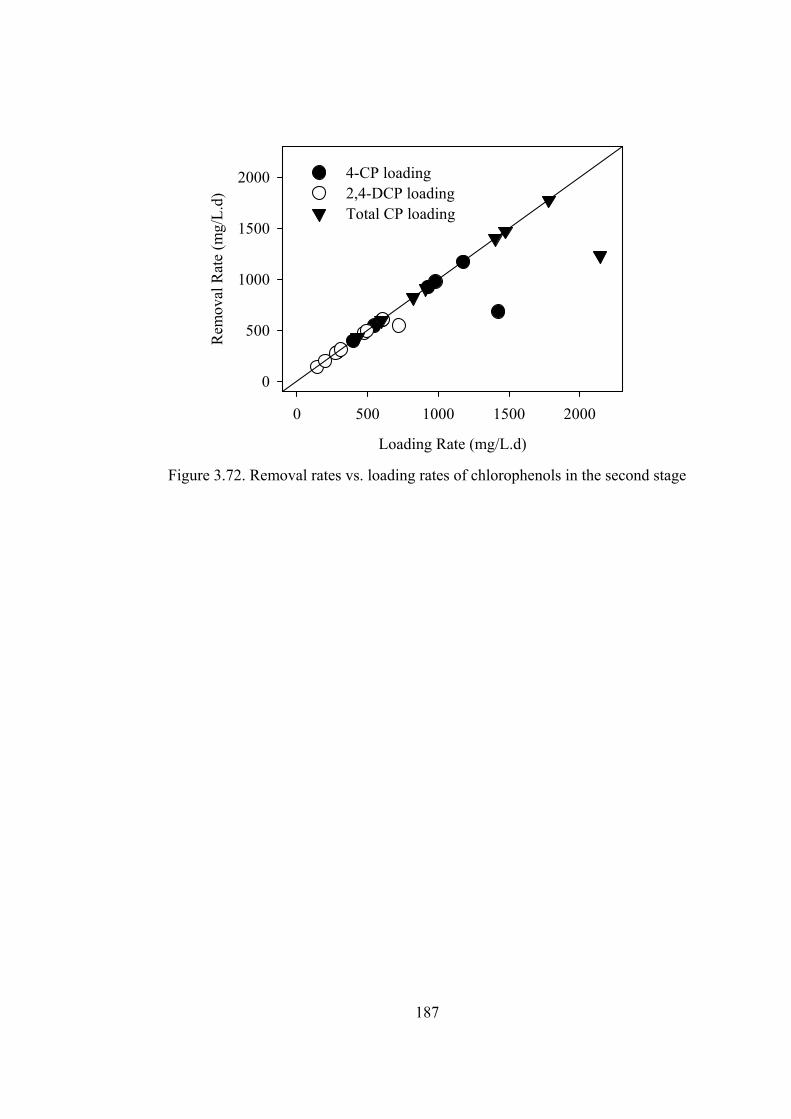
187
Loading Rate (mg/L.d)
0 500 1000 1500 2000
Rem
oval
Rat
e (m
g/L.
d)
0
500
1000
1500
2000 4-CP loading 2,4-DCP loading Total CP loading
Figure 3.72. Removal rates vs. loading rates of chlorophenols in the second stage
188
CHAPTER 4
CONCLUSIONS
The main conclusions that can be drawn from this study can be summarized as
follows:
Batch experiments
(1). Both 4-CP and 2,4-DCP started to inhibit their own degradation at 53 and 25
mg/L, respectively and the Andrews equation well described the inhibition
kinetics.
(2). Culture acclimated to mixture of 4-CP and 2,4DCP (Culture M) had higher 4-
CP and 2,4-DCP biodegradation rates than culture acclimated to 4-CP only
(Culture 4). Both of the mixed cultures settled well. Although the pure strains
isolated from mixed cultures were able to degrade chlorophenols, they did not
settle well under quiescent conditions.
(3). 2,4-DCP competitively inhibits 4-CP biodegradation. The competitive
inhibition was more remarkable in the case of culture acclimated to 4-CP only
compared to culture acclimated to mixture of 4-CP and 2,4-DCP.
Sequencing Batch Reactor (SBR) Experiments
(4). The complete degradation of chlorophenols up to 200 mg/L 4-CP and 100
189
mg/L 2,4 DCP was observed in SBRs. Although CHMS accumulated during
the degradation of 4-CP, the peak CHMS concentrations were only within 3-
10% of its stoichiometrically calculated value, which indicated simultaneous
removal of 4-CP and CHMS.
(5). Only specialist biomass was assumed to be responsible for chlorophenols
degradation and the fraction of specialist biomass was estimated equal to the
feed contribution of chlorophenols on COD basis. The developed models
based on this assumption well fitted to the experimental data.
(6). The specific degradation rates of chlorophenols increased with increasing feed
chlorophenols concentrations due to increase in competent biomass fraction.
Specific degradation rates calculated on the basis of competent biomass
concentrations (SDRc) were relatively constant and did not show any
correlation with feed 4-CP concentrations.
(7). High COD removal efficiencies and complete chlorophenol removals were
observed even in the absence of peptone. Decreasing peptone (biogenic
substrate) concentration did not cause significant change in 4-CP and 2,4-
DCP biodegradation patterns and developed models well fitted to the
experimental data.
(8). With long filling time, the accumulation of chlorophenols and the
intermediate can be avoided in SBRs. Therefore, filling and reaction times
should be decided based on the degradation kinetics and substrate interactions
in multi-substrate systems. In the SBR operated at 8 h filling time,
chlorophenols accumulated with decreasing peptone in the feed, whereas,
specific degradation rates increased. Chlorophenols accumulation was due to
the lag period after settling and strong competitive inhibition of 2,4-DCP on
4-CP degradation.
Rotating Biological Contactor (RBC) Experiments
(9). High chlorophenols (>98%) and COD (>94%) removals were achieved
throughout the reactor operation in the first stage and the second stage
190
behaved only as a polishing step.
(10). Gradual exclusion of peptone did not adversely affect the chlorophenols
removal performance of the RBC.
(11). Shock loading of 4-CP and 2,4-DCP up to 820 and 420 mg/L, respectively,
did not interfere remarkably with the system performance.
(12). Attached growth reactors can tolerate higher chlorophenols loads compared to
suspended growth reactors.
(13). Although the change of operational conditions may cause change of dominant
specie, the community was quite robust as Pseudomonas species were
generally dominant.
191
REFERENCES
1. Alemzadeh I., Vossoughi F., Houshmandi M., 2002. Phenol biodegradation
by rotating biological contactor. Biochem. Eng. J., 11, 19-23
2. Andrews J.F., 1968. A mathematical model for the continuous culture of
microorganisms utilizing inhibitory substrates. Biotechnol Bioeng., 10, 707-
723.
3. APHA (American Public Health Association), 1995. Standard methods for the
examination of water and wastewater, 19th Ed., Washington, DC.
4. Armenante P.M., Kafjewitz D., Lewandowski A. and Jou C., 1999.
Anaerobic-aerobic treatment of halogenated phenolic compounds. Wat. Res.,
333, 681-692.
5. Atlas R. M., 1993. Bioaugmentation to Enhance Microbial Bioremediation.
Chapter 2. In Biotreatment of Industrial and Hazardous Waste, McGraw-
Hill,Inc, 19-37.
6. Bali U., Şengül F., 2002. Performance of a fed-batch reactor treating a
wastewater containing 4-chlorophenol. Proc. Biochem., 37, 1317-1323.
7. Bali U., Şengül F., 2003. The fate and effect of 4-chlorophenol in an upflow
anaerobic fixed-bed reactor. Proc. Biochem., 38, 1201-1208.
8. Beadle C.A., Smith A.R., 1982. The purification and properties of 2,4-
dichlorophenol hydroxylase from a strain of Acinetobacter species. Eur J
Biochem, 123,323-332.
9. Biomeieux, 1996. Identification and Susceptibility Testing manual methods.
10. Buitron G., Gonzalez A., 1996. Characterization of the microorganisms from
an acclimated activated sludge degrading phenolic compounds. Water Sci.
Technol., 34, 289-294.
11. Buitron G., Gonzales A., Lopez-Marin L.M., 1998. Biodegradation of
192
phenolic compounds by an acclimated activated sludge and isolated bacteria.
Water Sci. Technol.; 371-378.
12. Buitron G., Schoeb M.E., Moreno-Andrede I., Moreno J.A., 2005. Evaluation
of two control strategies for a sequencing batch reactor degrading high
concentration peaks of 4-chlorophenol. Water Res., 39: 1015-1024.
13. Chen J., Rulkens W.H., Bruning H., 1997. Photochemical elimination of
phenols and COD in industrial wastewaters. Water Sci. Technol., 35, 231–
238.
14. Chiavola A., Baciocchi R., Irvine R.L., Gavasci R., Sirini P., 2004. Aerobic
biodegradation of 3-chlorophenol in a sequencing batch reactor: effect of
cometabolism. Water Sci. Technol. 50, 235-242.
15. Chudoba P., Capdeville B., Chudoba J. 1992. Explanation of biological
meaning of the S0/X0 ratio in batch cultivation. Water Sci. Technol., 26, 743-
751.
16. Çinar O., 2002. Factors influencing biodegradation of benzoate by
denitrifying bacterial enrichment cultures. Ph.D. Dissertation, Clemson
University, Clemson, SC.
17. Dilek F.B., Gokcay C.F., Yetis U., 1998. Combined effects of Ni (II) and Cr
(VI) on activated sludge. Water Res., 32,303-312.
18. Edwards V.H., 1970. The influence of high substrate concentrations on
microbial kinetics. Biotechnol. Bioeng., 12, 679-712.
19. Ellis T.G., Anselm C.V., 1999. Effect of batch discharges on extant
biodegradation kinetics in activated-sludge systems. Water Environ. Res., 71,
290-298.
20. Ellis T.G., Smets B.F., Magbanua B.S., Jr. Grady C.P.L.Jr., 1996a. Changes
in measured biodegradation kinetics during the long-term operation of
completely mixed activated sludge (CMAS) bioreactors. Water Sci. Technol.,
34, 35-42.
21. Ellis T.G., Barbeau D.S., Smets, B.F., Grady, C.P.L.Jr., 1996b. Respirometric
technique for determination of extant kinetic parameters describing
biodegradation. Water Environ. Res., 68, 917-926.
193
22. Ellis T.G., Eliosov B., 2004. Use of extant kinetic parameters to predict
effluent concentrations of specific organic compounds at full scale facilities.
Water Environ. Res., 76, 444-452.
23. Ettala M., Koskela J., Kiesila A., 1992. Removal of chlorophenols in a
municipal sewage treatment plant using activated sludge. Water Res.; 26,797-
804.
24. Fang B.H.H.P., Zhou G.M., 1999. Interaction of methanogens and denitrifiers
in degradation of phenols, journal of Environmental Eng., 125, 57-63.
25. Farrell A., Quilty B., 1999. Degradation of mono-chlorophenols by a mixed
community via a meta- cleavage pathway. Biodegradation, 10, 353-362.
26. Farrell A., Quilty B., 2002. Substrate-dependent autoaggregation of
Psedomonas putida CP1 during the degradation of mono-chlorophenols and
phenol. J. Ind. Microbiol. Biotechnol., 28, 316–324.
27. Gallizia I, McClean S., Banat I.B., 2003. Bacterial biodegradation of phenol
and 2,4-dichlorophenol. J. Chem. Technol. Biotechnol., 78,959–963.
28. Grady C.P.L.Jr., Smets B.F., Barbeau, D.S., 1996. Variability in kinetic
parameter estimates: a review of possible causes and a proposed terminology.
Wat. Res., 30, 742-748.
29. Grady, C.P.L. Jr., Daigger, G.T., Lim, H.C., 1999. Biological Wastewater
Treatment, 2 nd Edition, Revised and Expanded, Marcel Dekker, Inc., New
York, NY.
30. HACH, Water Analysis Handbook, 2nd ed., 1992, Loveland, HACH
Company.
31. Hale D.D. Reikene W., Wiegel J., 1994. Chlorophenol Degradation Chapter 4.
In Biological Degradation and Bioremediation Technologies of Toxic
Chemicals (G.R. Chaudry, Ed.), Timber Press, Portland, OR. pp. 74-91
32. Hall E. R., Randle W. G., 1994. Chlorinated Phenolics Removal From
Bleached Kraft Mill Wastewater in Three Secondary Treatment Process, Wat.
Sci. Tech., 29, 177-186.
33. Hao O.J., Kim, M.H., Seagren, E. A., Kim, H., 2002. Kinetics of phenol and
chlorophenol utilization by Acinetobacter species. Chemosphere, 46, 797-807.
194
34. Hill G.A., Milne B.J., Nawrocki P.A., 1996. Cometabolic degradaiton of 4-
chlorophenol by alcaligenes eutrophus. Appl. Microbiol. Biotechnol., 46, 163-
168.
35. Hollender, J., Hopp, J., Dott, W., 1997. Degradation of 4-chlorophenol via the
meta cleavage pathway by Comamonas testosteroni jh5. Appl. and Environ.
Microb., 63, 4567–4572.
36. Hu Z., Ferraina R.A., Ericson J.F., Smets B,F,, 2005. Effect of long-term
exposure, biogenic substrate presence, and electron acceptor conditions on the
biodegradation of multiple substituted benzoates and phenolates. Water Res.,
39, 3501-3510.
37. Hu Z., Ferraina R.A., Ericson J.F., MacKay A.A., Smets B.F., 2005. Biomass
characteristics in three sequencing batch reactors treating a wastewater
containing synthetic organic chemicals. Water Res., 39, 710-720.
38. Jarvinen K.T., Melin E.S., Puhakka J.A. 1994. High-rate Bioremediation of
Chlorophenol-Contaminated Groundwater at Low Temperatures, Environ.
Sci. Technol., 28, 2387-2392.
39. Jin P., Bhattacharya S.K., 1997. Toxicity and Biodegradation of
Chlorophenols in Anaerbic Propionate Enrichment Culture, Water Environ.
Res., 69, 938-947.
40. Kaewpipat K and Grady CPLJr, 2002. Microbial population dynamics in
laboratory-scale activated sludge reactors. Water Sci. Tech. 46, 19-27.
41. Kargi F, Eker S., 2004. Toxicity and batch biodegradation kinetics of 2,4
dichlorophenol by pure Pseudomonas putida culture. Enzyme Microb.
Technol.; 35, 424-428.
42. Kargi F., Eker S., 2005. Kinetics of 2,4-dichlorophenol degradation by
Pseudomonas putida CPI in batch culture., 2005, International
Biodeterioration and Biodegradation,55, 25-28.
43. Kargi F., Eker S., 2002. Comparison of performance of rotating perforated
tubes and rotating biodiscs biofilm reactors for wastewater treatment. Proc.
Biochem., 37, 1201-1206.
44. Kargi F., Eker S., Uygur A., 2005. Biological treatment of synthetic
195
wastewater containing 2,4 dichlorophenol (DCP) in an activated sludge unit.
J. Environ. Management, 76, 191-196.
45. Kargi F., Eker S., 2006. Effect of sludge age on performance of an activated
sludge unit treating 2,4-dichlorophenol-containing synthetic wastewater.
Enzyme and Microbial Technology, 38, 860-866.
46. Kargi F., Uygur A., 1997. Biological treatment of saline wastewater in a
rotating biodisc contactor by using halophilic organisms. Bioprocess Eng., 17,
81-85.
47. Kim J.H., Oh, K.K. Lee, S.T., Kim S.W., Hong, S.I., 2002. Biodegradation of
phenol and chlorophenols with defined mixed culture in shake-flasks and a
packed bed reactor. Proc. Biochem., 37, 1367-1373.
48. Kim M.H., Hao, O.J., 1999. Cometabolic degradation of chlorophenols by
Acinetobacter species. Wat. Res., 33, 562-574.
49. Kobayashi, H. and B. E. Rittmann, 1982. Microbial removal of hazardous
organic chemicals. Environ. Sci. Technol., 16, 170-181.
50. Kulkarni M. and Chaudhari A., 2006. Biodegradation of p-nitrophenol by P.
putida. Bioresource Technol., 97, 982-988.
51. Lackmann, R. K., Maier, W. J., Shamat, N. A. 1981. Removal of chlorinated
organics by conventional biological waste treatment. pp. 502-515. In:
Proceedings of the Thirty-Fifth Industrial Waste Conference, Purdue
University. Ann Arbor Science Publishers, Inc., Ann Arbor, MI.
52. Laura TL.P., McCarty P.L., Zehnder A.J.B., 1984. Secondary substrate
utilization of methylene chloride by an isolated strain of Pseudomonas sp.,
Appl. Environ. Microbiol., 40, 950-958.
53. Lepistö R. And Rintala J. 1994. The removal of chlorinated phenolic
compounds from chlorine bleaching effluents using thermophilic anaerobic
process, Wat. Sci. Tech., 29, 373-380.
54. Lora, P.O., Sjölund, M., Tracol, C., Morvan, J., 2000. Adaptation of an
inoculum to 2,4,6- Trichlorophenol biodegradation in an activated-sludge
bioreactor. Water Sci. Technol., 42, 179-183.
55. Lu C.J., Lee C.M., Huang C.Z., 1996. Biodegradation of chlorophenols by
196
immobilized pure-culture microorganisms. Water Sci. Tech., 34, 67-72.
56. Lu C.J., Tsai, Y.H., 1993. The effects of a secondary carbon source on the
biodegradation of recalcitrant compounds. Water Sci., Technol., 28, 97-101.
57. Lu C.J., Speitel G.E., 1988. Enhanced biological degradation of recalcitrant
compound by analogous enrichment. In: Proceedings of 1988 Annual
American Water Works Association Conference. Orlando, Florida.
58. Madigan, M.T., Martinko, J.M., Parker, J., 1997. Biology of microorganisms
(8th ed.). Englewood Cli.s, NJ: Prentice-Hall.
59. Magbanua B.S., Poole L.J., Grady C.P.L.Jr., 1988. Esitimation of the
competent biomass concentration for the degradation of synthetic organic
compounds in an activated sludge culture receiving a multicomponent feed.
Water Sci. Tech., 38, 55-62.
60. Mangat, S., Elefsiniotis, P., 1999. Biodegradation of the herbicide 2,4-
dichlorophenoxyacetic acid (2,4-D) in sequencing batch reactors. Wat. Res.,
33, 861-867.
61. McCarty P.L., Rittmann B.E., Reinhard M., 1981. Trace organics in
groundwater. Environ. Sci. Technol., 15, 40-51.
62. Melin E.S., 1997. Biodegradation and treatment of organic environmental
contaminants by fluidized-bed enrichment cultures. PhD thesis, Tampere
University of Technology, Tampere-Finland.
63. Melin E.S., Ferguson J.F., Puhakka J.A., 1997. Pentachlorophenol
biodegradation kinatics of an oligotrohic fluidized-bed enrichment culture.
Appl. Microbiol. Biotechnol., 47,675-682 .
64. Metcalf, Eddy, 1991. Metcalf & Eddy wastewater engineering. New York:
McGraw-Hill.
65. Mohan S.V., Rao N.C., Prasad K.K., Madhavi B.T.V., Sharma P.N., 2005.
Treatment of complex chemical wastewater in a sequencing batch reactor
(SBR) with an aerobic suspended growth configuration. Proc. Biochem., 40,
1501-1508.
197
66. Monteiro, A.A.M.G., Baventura, R.A.R., Rodrigues, A.E., 2000. Phenol
biodegradation by Pseudomonas putida DSM 548 in a batch reactor.
Biochem. Eng. J., 6, 45-49.
67. Moreno-Andrade I., Buitron G., 2004a. Evolution of the microbial activity
during the acclimation and deacclimation (starvation) of activated sludge to 4-
chlorophenol. International Water Associaiton-4th World Water Congress-
Marrakech.
68. Moreno-Andrade I., Buitron G., 2004b. Variation of the microbial activity
during the acclimation phase of a SBR system degrading 4-chlorophenol.
Water Sci. Tech., 50, 251-258.
69. Orhon D., Talinli I., Tünay O., 1989. The fate of 2,4-D in microbial cultures.
Water Res., 23, 1423–1430
70. Puhakka J.A., Jarvinen K., 1992. Aerobic Fluidized-Bed Treatment of
Polychlorinated Phenolic Wood Preservative Constituents, Water Res., 26, 6,
765-770.
71. Puhakka J.A., Makinen P.M., Lundin M., Ferguson J.F., 1994. Aerobic and
anaerobic biotransformations and treatment of chlorinated pulp bleach waste
constituents. Wat. Sci. Tech., 29,73-80.
72. Quan X., Shi H., Zhang Y., Wang J., Qian Y., 2003. Biodegradation of 2,4-
dichlorophenol in an air-lift honeycomb-like ceramic reactor. Process
Biochem., 38, 1545-1551.
73. Quan X., Shi H., Liu H., Lv P., Qian Y., 2004a. Enhancement of 2,4-
dichlorophenol degradation in conventional activated sludge systems
bioaugmented with mixed special culture. Water Res., 38, 245-253.
74. Quan X., Shi H., Zhang Y., Wang J., Qian Y, 2004b. Biodegradation of 2,4-
dichlorophenol and phenol in an airlift inner-loop bioreactor immobilized
with Achromobacter sp. Sepeation Purification Technol., 34, 97-103.
75. Quan X., Shi H., Hong L., Wang J., Qian Y., 2004c. Removal of 2,4-
dichlorophenol in a conventional activated sludge system through
bioaugmentation. Process Biochem., 39, 1701-1707.
76. Quan X., Yang Z., Shi H., Tang Q., Qian Y., 2005. The effect of a secondary
198
chlorophenol presence on the removal of 2,4-dichlorophenol (2,4-DCP) in
activated sludge system bioaugmented with 24-DCP degrading special
culture. Process Biochem., 40, 3462-3467.
77. Radjendirane, V., Bhat, M.A., Vaidyanathan, C.S., 1991. Affinity purification
and characterization of 2,4-dichlorophenol hydroxylase from Pseudomonas
cepacia. Arch. Biochem. Bioophys., 288, 169-176.
78. Radwan, K.H., Ramanujam, T.K., 1997. Studies on organic removal of 2,4-
dichlorophenol wastewaters using modified RBC. Bioprocess Eng., 16, 219-
223.
79. Rempel W., Turk O., Sikes J.E.G., 1992. Side-by-Side Activated Sludge Plot
Plant Investigations Focusing on Organochlories, Journal of Pulp and Paper
Science, 18, 80-85.
80. Rittmann B.E., McCarty P.L., 2001. Environmental biotechnology: principles
and applications. McGraw-Hill, New York.
81. Rittmann B.E., Crawford L., Tuck C.K., Namkung E., 1986. In situ
determination of kinetic parameters for biofilms: isolation and
characterization of oligotrophic biofilms. Biotechnol. Bioeng., 28, 1753-1760.
82. Rittmann B.E., McCarty P.L., Roberts P.V., 1980. Trace organics
biodegradation in aquifer recharge. Ground Water, 18, 236-243.
83. Rodgers M., 1999. Organic Carbon Removal Using a New Biofilm Reactor.
Water Res., 33, 1495-1499.
84. Rutgers M., Breure A.M., van Andel J.G., Duetz W.A, 1997. Growth yield
coefficients of Sphingomonas sp. strain P5 on various chlorophenols in
chemostat culture. Appl. Microbiol. Biotechnol., 48, 656-661.
85. Sae´z P.B., Rittmann B.E., 1991. Biodegradation kinetics of 4-chlorophenol,
an inhibitory co-metabolite. Res. J. Water Pollut. Control Fed. 63, 838-847.
86. Sae´z P.B. and Rittmann B.E., 1993. Biodegradation kinetics of a mixture
containing a primary substrate (phenol) and an inhibitory co-metabolite (4-
chlorophenol). Biodegradation 4, 3–21.
87. Sahinkaya E., Dilek F.B., 2005. Biodegradation of 4-chlorophenol by
acclimated and unacclimated activated sludge-evaluation of biokinetic
199
coefficients. Environ. Res. 99, 243-252.
88. Sahinkaya E., Dilek F.B., 2002. Effects of 2,4-Dichlorophenol on activated
sludge. Appl. Microbiol. Biotechnol. 59, 361-367.
89. Schmidt S.K., Scow K.M., Alexander. M. 1987. Kinetics of p-nitrophenol
mineralization by a Pseudomonas sp. Effects of second substrates. Appl.
Environ. Microbiol., 53, 2617-2623.
90. Shieh B.W.K., Puhakka J.A., Melin E., Tuhkanen T. 1990. Immobilized-cell
degradation of chlorophenols, Journal of Env.Eng., 116, 683-697.
91. Shin H.S., Yoo K.S., Park J.K., 1999. Removal of Polychlorinated Phenols in
Sequential Anaerobic-Aerobic Biofilm Reactors Packed with Tire Chips,
Water Environ. Res., 71, 363-367.
92. Shuler M.L., Kargi F., 1992. Bioprocess engineering. Prentice Hall, New
Jersey.
93. Soda S., Uesugi K., Ike M., Fujita M., 1999. Application of a floc-forming
genetically engineering microorganism to a sequencing batch reactor for
phenolic wastewater treatment. J Biosci Bioeng, 88, 85-91.
94. Sokol W., Howel J.A., 1981. Kinetics of phenol oxidation by washed cells.
Biotechnol. Bioeng., 23, 2039-2049.
95. Speitel G.E. Jr., Lu C-J, Turakhia M., Zhu X-J., 1989. Biodegradation of trace
concentrations of substituted phenols in granular activated carbon columns.
Environ Sci Technol., 23, 68-74.
96. Surampalli R.Y., Baumann E.R., 1997. Role of supplemental aeration in
improving overloaded first-stage RBC performance. Water, Air, and Soil Poll
98: 1–15.
97. Swaminathan G., Ramanujam T.K., 1999. Effect of substrate concentration on
biodegradation of 2,4-dichlorphenol using modified rotating biological
contactors. Bioprocess Eng 21, 169-173.
98. Tarighian, A., Hill, G., Headley, J., Pedras, S., 2003. Enhancement of 4-
chlorophenol biodegradation using glucose. Clean Techn. Environ. Policy, 5,
61-65.
200
99. Templeton, L.L., Grady, C.P.L., 1988. Effect of culture history on the
determination of biodegradation kinetics by batch and fed-batch techniques. J.
Water Pollut. Control Fed., 60, 651–658.
100. Tokuz, R.Y. 1991. Biotreatment of hazardous organic wastes using rotating
biological contactors. Environmental Progress, 10, 198-204
101. Tomei M.C., Annesini M.C., Luberti R., Cento G., Senia A., 2003. Kinetics
of 4-nitrophenol biodegradation in a sequencing batch reactor. Water Res., 37,
3803-3814.
102. Tomei M.C., Annesini M.C., Bussoletti S., 2004. 4-nitrophenol
biodegradation in a sequencing batch reactor: kinetic study and effect of
filling time. Water Res. 38, 375-384.
103. Uysal A., Turkman A., 2005. Effect of biosurfactant on 2,4-dichlorophenol
biodegradation in an activated sludge bioreactor. Process Biochem., 40, 2745-
2749.
104. Vallecillo A., Garcia-Encina P.A., Miranda M.P., Fdz-Polanco F., 2000.
Aerobic treatability and toxicity of chlorophenols. 4th International
Symposium on Environmental Biotechnology, Noordwijkerhout, The
Netherlands
105. Valo R.J., Haggblom M.M., Salkinoja-Salonen M., 1990. Bioremediation of
chlorophenol containing simulated ground water by immobilized bacteria.
Water Res. 24, 253-258.
106. Wang C.C., Lee C.M., Kuan C.H., 2000. Removal of 2,4-dichlorophenol by
suspended and immobilized Bacillus insolitus. Chemosphere 41.
107. Wang K.W., Baltzis B.C., Lewandowski G.A., 1996. Kinetics of phenol
biodegradation in the presence of glucose. Biotech. and Bioeng., 51, 87-94.
108. Wang S.J., Loh K.C., 1999. Facilitation of cometabolic degradation of 4-
chlorophenol using glucose as an added growth substrate. Biodegradation, 10,
261-269.
109. Wang S.J., Loh K.C., 2000. New cell growth pattern on mixed substrates
and substrate utilization in cometabolic transformation of 4-chlorophenol.
Water Res., 34, 3786-3794.
201
110. Wang S.J., Loh K.C., 2001. Biotransformation kinetics of Pseudomonas
putida for cometabolism of phenol and 4-chlorophenol in the presence of
sodium glutamate. Biodegradation, 12, 189-199.
111. Wang S.J., Loh K.C., Chua S.S., 2003. Prediction of critical cell growth
behavior of Pseudomonas putida to maximize the cometabolism of 4-
chlorophenol with phenol and sodium glutamate as carbon source. Enzyme
and Microb. Technol., 32, 422-430.
112. Wayman M., Tseng M.C., 1976. Inhibition threshold substrate
concentrations. Biotechnol. Bioeng., 18, 383–387.
113. Wiggings B.A., Jones S.H., Alexander M., 1987. Explanation for the
acclimation period preceding the mineralization of organic chemicals in
aquatic environments. Appl. Environ. Microbiol., 53,791-796.
114. Yang C.F., Lee C.M., Wang C.C., 2004. Chlorophenols degradation by
chlorophenol degrading bacteria Sphingomonas chlorophenolica in batch
reactor. International Water Associaiton-4th World Water Congress-
Marrakech.
115. Zaidi B.R., Mehta N.K., 1995. Effects of organic-compounds on the
degradation of p-nitrophenol in lake and industrial waste-water by inoculated
bacteria. Biodegradation, 6:275-281.
116. Zilouei H., Guieysse B., Mattiasson B., 2004. Bioremediation of
Chlorophenols at low Temperature in a Packed-Bed Bioreactor. International
Water Associaiton-4th World Water Congress-Marrakech.
202
CURRICULUM VITAE
PERSONAL INFORMATION
Surname, Name: Şahinkaya, Erkan
Nationality: Turkish (TC)
Date and Place of Birth: 09 September 1978 , Elazığ
Marital Status: Married
Phone: +90 312 210 26 52
Fax: +90 312 210 26 46
email: [email protected]
EDUCATION
Degree Institution Year of Graduation
MS METU Environmental Engineering 2001
BS Fırat University Environmental
Engineering
1998
High School Elazığ High School 1994
WORK EXPERIENCE
Year Place Enrollment
1999-2006 METU Department of Environmental
Engineering
Research Assistant
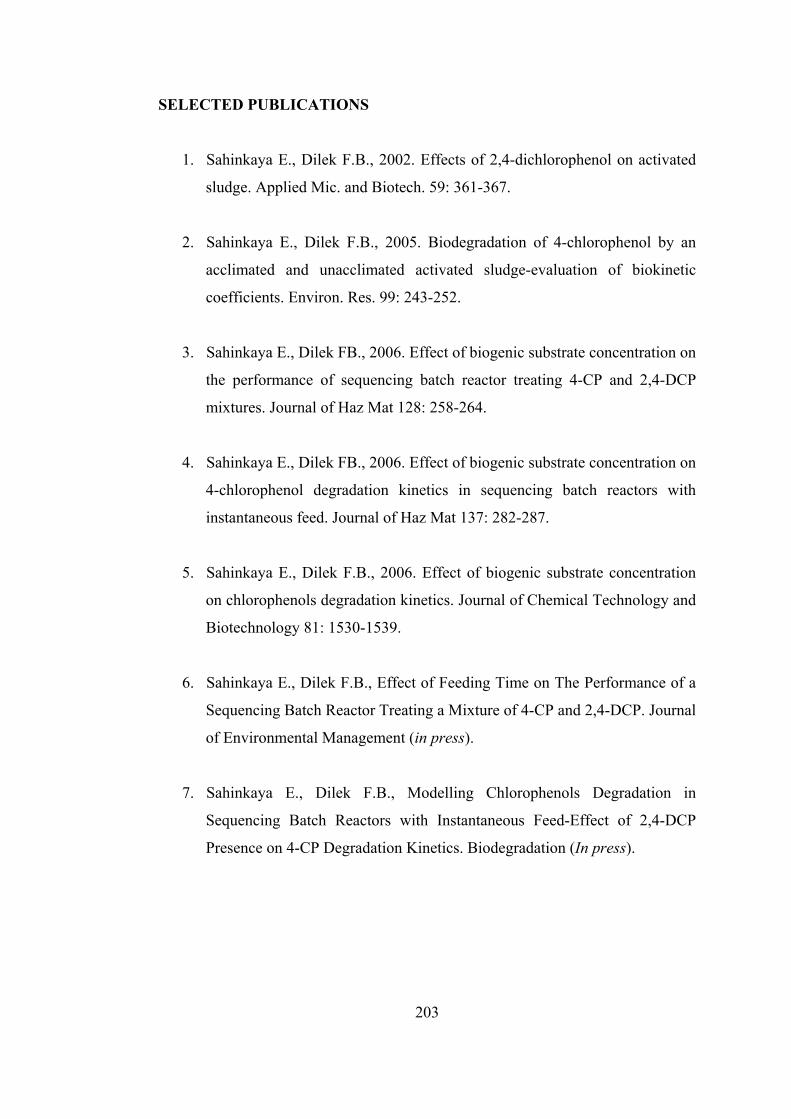
203
SELECTED PUBLICATIONS
1. Sahinkaya E., Dilek F.B., 2002. Effects of 2,4-dichlorophenol on activated
sludge. Applied Mic. and Biotech. 59: 361-367.
2. Sahinkaya E., Dilek F.B., 2005. Biodegradation of 4-chlorophenol by an
acclimated and unacclimated activated sludge-evaluation of biokinetic
coefficients. Environ. Res. 99: 243-252.
3. Sahinkaya E., Dilek FB., 2006. Effect of biogenic substrate concentration on
the performance of sequencing batch reactor treating 4-CP and 2,4-DCP
mixtures. Journal of Haz Mat 128: 258-264.
4. Sahinkaya E., Dilek FB., 2006. Effect of biogenic substrate concentration on
4-chlorophenol degradation kinetics in sequencing batch reactors with
instantaneous feed. Journal of Haz Mat 137: 282-287.
5. Sahinkaya E., Dilek F.B., 2006. Effect of biogenic substrate concentration
on chlorophenols degradation kinetics. Journal of Chemical Technology and
Biotechnology 81: 1530-1539.
6. Sahinkaya E., Dilek F.B., Effect of Feeding Time on The Performance of a
Sequencing Batch Reactor Treating a Mixture of 4-CP and 2,4-DCP. Journal
of Environmental Management (in press).
7. Sahinkaya E., Dilek F.B., Modelling Chlorophenols Degradation in
Sequencing Batch Reactors with Instantaneous Feed-Effect of 2,4-DCP
Presence on 4-CP Degradation Kinetics. Biodegradation (In press).
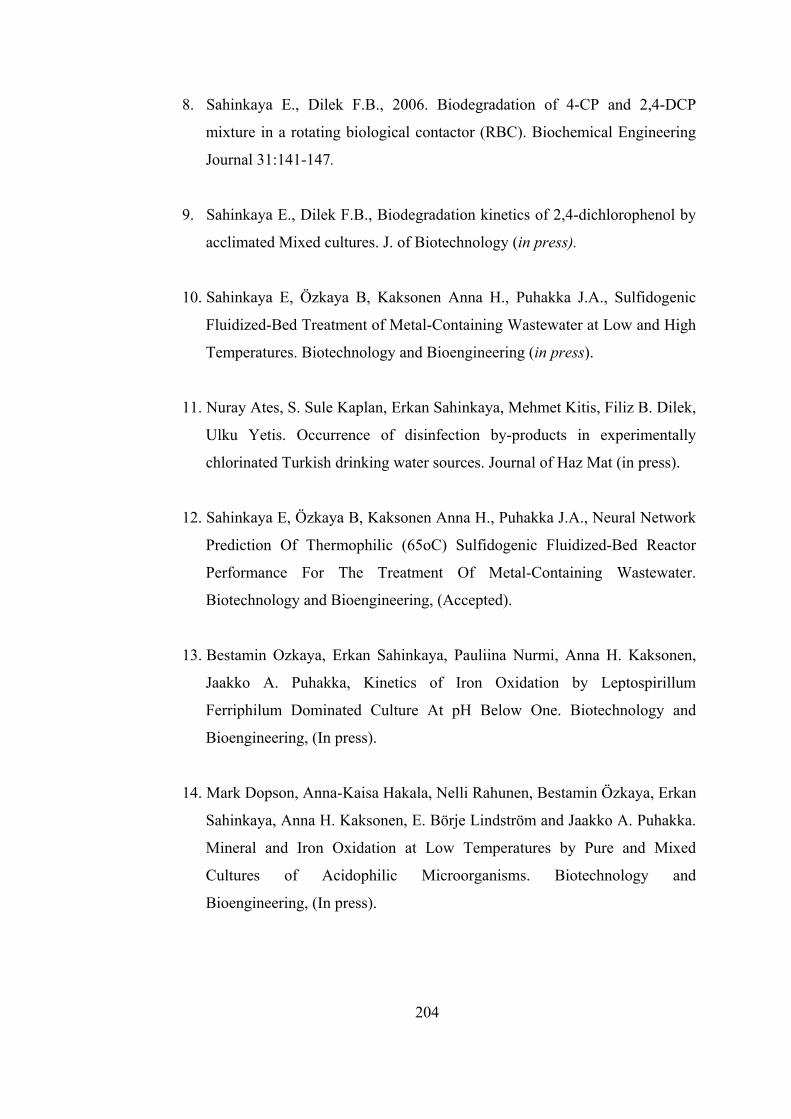
204
8. Sahinkaya E., Dilek F.B., 2006. Biodegradation of 4-CP and 2,4-DCP
mixture in a rotating biological contactor (RBC). Biochemical Engineering
Journal 31:141-147.
9. Sahinkaya E., Dilek F.B., Biodegradation kinetics of 2,4-dichlorophenol by
acclimated Mixed cultures. J. of Biotechnology (in press).
10. Sahinkaya E, Özkaya B, Kaksonen Anna H., Puhakka J.A., Sulfidogenic
Fluidized-Bed Treatment of Metal-Containing Wastewater at Low and High
Temperatures. Biotechnology and Bioengineering (in press).
11. Nuray Ates, S. Sule Kaplan, Erkan Sahinkaya, Mehmet Kitis, Filiz B. Dilek,
Ulku Yetis. Occurrence of disinfection by-products in experimentally
chlorinated Turkish drinking water sources. Journal of Haz Mat (in press).
12. Sahinkaya E, Özkaya B, Kaksonen Anna H., Puhakka J.A., Neural Network
Prediction Of Thermophilic (65oC) Sulfidogenic Fluidized-Bed Reactor
Performance For The Treatment Of Metal-Containing Wastewater.
Biotechnology and Bioengineering, (Accepted).
13. Bestamin Ozkaya, Erkan Sahinkaya, Pauliina Nurmi, Anna H. Kaksonen,
Jaakko A. Puhakka, Kinetics of Iron Oxidation by Leptospirillum
Ferriphilum Dominated Culture At pH Below One. Biotechnology and
Bioengineering, (In press).
14. Mark Dopson, Anna-Kaisa Hakala, Nelli Rahunen, Bestamin Özkaya, Erkan
Sahinkaya, Anna H. Kaksonen, E. Börje Lindström and Jaakko A. Puhakka.
Mineral and Iron Oxidation at Low Temperatures by Pure and Mixed
Cultures of Acidophilic Microorganisms. Biotechnology and
Bioengineering, (In press).