Embed Size (px)
Citation preview
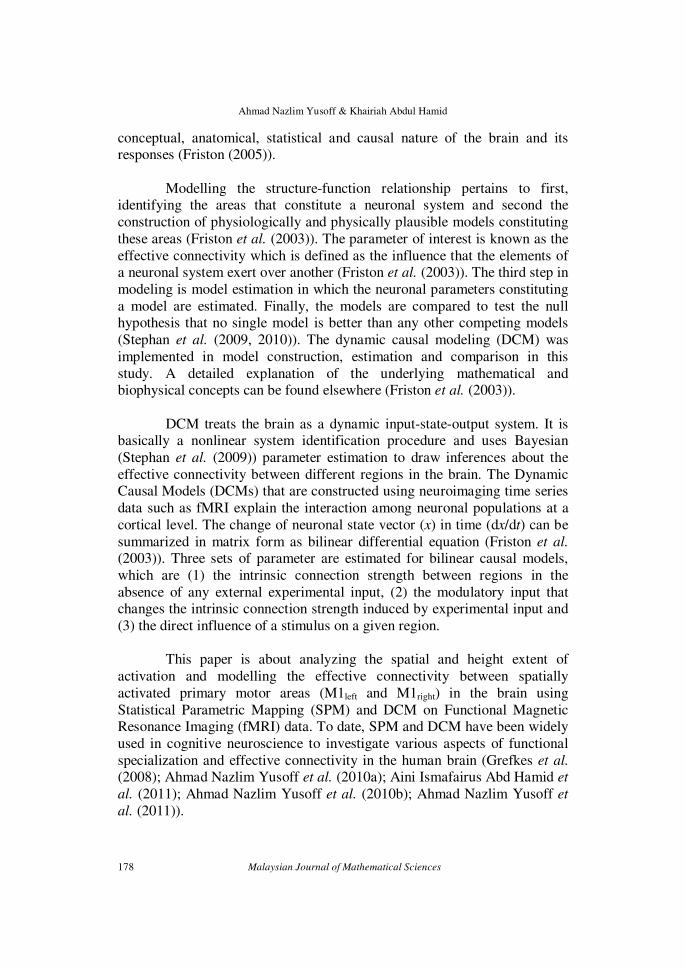
Malaysian Journal of Mathematical Sciences 6(2): 177-212 (2012)
Modelling Activation and Connectivity in the Brain:
An fMRI Study during Externally Triggered
Finger Tapping Task
Ahmad Nazlim Yusoff and Khairiah Abdul Hamid
Diagnostic Imaging and Radiotherapy Program,
School of Diagnostic and Applied Health Sciences,
Faculty of Health Sciences, Universiti Kebangsaan Malaysia,
Jalan Raja Muda Abdul Aziz, 50300 Kuala Lumpur, Malaysia
E-mail: [email protected]
ABSTRACT
Brain activation within and effective connectivity between two significantly activated left and right primary motor regions (M1left and M1right) were modelled using
functional magnetic resonance imaging datasets of seven subjects obtained from an externally triggered unilateral and bilateral finger tapping experiment. Unilateral tapping exhibited contra lateral activation while bilateral tapping activated both the M1left and M1right regions. Unlike bilateral tapping that exhibited a relatively equal change of M1left and M1right signal at the coordinates of maximum intensity, the value is significantly lower in M1left as compared to M1right for unilateral tapping. The effective connectivity between M1left and M1right during bilateral tapping of hand fingers can be explained by a bilinear causal model, which is averagely preferred by
five subjects (Dirichlet parameter estimate, αd ≈ 5). The regional connectivities are
however not gated (influenced) by any of the two M1s, ruling out the possibility of
the non-linear behavior of connections between both M1s. This study has been able to fit the effective connectivity between M1left and M1right with a bilinear model that has the lowest free energy (F) of -644.70 and the largest likelihood (4.77 × 1039),
posterior (ϕ = 1.00), expected (r = 0.67) and exceedance (ψ = 0.92) probabilities.
Keywords: Dynamic causal modeling, Bayesian model selection, bilinear model, expected probability, exceedance probability.
1. INTRODUCTION
Human brain can be thought of as a control center in a human body.
It acts as an instruction hub for various kinds of mechanism in the body.
Instructions are conveyed through the transmission of synaptic signal which is governed by the brain structure-function relationship (Nolte (2009)). The
relationship between the brain structure and function can be modeled.
Modeling involves investigating the underlying relationships between the
Ahmad Nazlim Yusoff & Khairiah Abdul Hamid
178 Malaysian Journal of Mathematical Sciences
conceptual, anatomical, statistical and causal nature of the brain and its responses (Friston (2005)).
Modelling the structure-function relationship pertains to first, identifying the areas that constitute a neuronal system and second the
construction of physiologically and physically plausible models constituting
these areas (Friston et al. (2003)). The parameter of interest is known as the
effective connectivity which is defined as the influence that the elements of a neuronal system exert over another (Friston et al. (2003)). The third step in
modeling is model estimation in which the neuronal parameters constituting
a model are estimated. Finally, the models are compared to test the null hypothesis that no single model is better than any other competing models
(Stephan et al. (2009, 2010)). The dynamic causal modeling (DCM) was
implemented in model construction, estimation and comparison in this
study. A detailed explanation of the underlying mathematical and biophysical concepts can be found elsewhere (Friston et al. (2003)).
DCM treats the brain as a dynamic input-state-output system. It is basically a nonlinear system identification procedure and uses Bayesian
(Stephan et al. (2009)) parameter estimation to draw inferences about the
effective connectivity between different regions in the brain. The Dynamic Causal Models (DCMs) that are constructed using neuroimaging time series
data such as fMRI explain the interaction among neuronal populations at a
cortical level. The change of neuronal state vector (x) in time (dx/dt) can be
summarized in matrix form as bilinear differential equation (Friston et al. (2003)). Three sets of parameter are estimated for bilinear causal models,
which are (1) the intrinsic connection strength between regions in the
absence of any external experimental input, (2) the modulatory input that changes the intrinsic connection strength induced by experimental input and
(3) the direct influence of a stimulus on a given region.
This paper is about analyzing the spatial and height extent of
activation and modelling the effective connectivity between spatially
activated primary motor areas (M1left and M1right) in the brain using
Statistical Parametric Mapping (SPM) and DCM on Functional Magnetic Resonance Imaging (fMRI) data. To date, SPM and DCM have been widely
used in cognitive neuroscience to investigate various aspects of functional
specialization and effective connectivity in the human brain (Grefkes et al. (2008); Ahmad Nazlim Yusoff et al. (2010a); Aini Ismafairus Abd Hamid et
al. (2011); Ahmad Nazlim Yusoff et al. (2010b); Ahmad Nazlim Yusoff et
al. (2011)).
Modelling Activation and Connectivity in the Brain:
An fMRI Study during Externally Triggered Finger Tapping Task
Malaysian Journal of Mathematical Sciences 179
2. METHODS
2.1 Subject
fMRI examinations were performed on 7 right-handed Malay
subjects (two males and five females). The subjects were given informed
consent and screening forms as required by the Institutional Ethics Committee (IEC). The subjects were interviewed on their health condition
prior to the scanning session. Prior to the fMRI scans, the subjects’
handedness was tested using the Edinburgh Handedness Inventory (Oldfield (1971)). The subjects were also told not to move their head during the scan.
Head movement will also cause artifacts on functional images due to the
voxels that are not correctly registered (or moving) during the scan resulting
in significant changes in signal intensity of that particular voxels over time. The immobilising devices were used together with the head coil in order to
minimise head movement.
2.2 fMRI Scans
fMRI examinations were conducted using a 1.5-tesla Magnetic
Resonance Imaging (MRI) system (Siemens Magnetom Vision VB33G) equipped with functional imaging option, Echo Planar Imaging (EPI)
capabilities and a Radiofrequency (RF) head coil used for signal
transmission and reception. Gradient Echo - Echo Planar Imaging (GRE-
EPI) pulse sequence with the following parameters were applied: Repetition Time (TR) = 5 s, Acquisition Time (TA) = 3 s, Echo Time (TE) = 66 ms,
Field of View (FOV) = 210 × 210 mm, flip angle = 90°, matrix size = 128 ×
128 and slice thickness = 4 mm.
Using the midsagittal scout images (TR = 15 ms, TE = 6 ms, FOV =
300 × 300 mm, flip angle = 30°, matrix size = 128 × 128 and magnetic field gradient = 15 mT/m) produced earlier, 35 axial slice positions (1 mm
interslice gap) were oriented in the anterior-posterior commissure (AC-PC)
plane. This covers the whole brain volume. In addition, high resolution
anatomical images of the entire brain were obtained using a strongly T1-weighted spin echo pulse sequence with the following parameters: TR =
1000 ms, TE = 30 ms, FOV = 210 × 210 mm, flip angle = 90°, matrix size =
128 × 128 and slice thickness = 4 mm.
Ahmad Nazlim Yusoff & Khairiah Abdul Hamid
180 Malaysian Journal of Mathematical Sciences
2.3 Experimental paradigm
The subjects were instructed on how to perform the motor activation
task and were allowed to practice prior to the scanning. The subjects had to
tap all four fingers against the thumb beginning with the thumb-index finger contact and proceeding to the other fingers in sequence which would then
begin anew with contact between thumb and index finger. This study used
an externally triggered finger tapping task. The tapping of the fingers were
triggered by the ticking sound produced by a signal generator that was connected to the speaker. The ticking sound was transmitted to the subject
through an air-filled tube and the headphone via an intercom. The tapping
rate was two times in one second (2 Hz), using an intermediate force between too soft and too hard.
A six-cycle active-rest paradigm which was alternately and
auditorily cued between active and rest was used with each cycle consisted of 10 series of measurements during active state and 10 series of
mesurements during resting state. The tapping of the fingers were done
unilaterally (UNIleft or UNIright) or bilaterally (BIL) in an alternate fashion. The tapping pace between the left and right hand fingers were kept in-
phased. Each functional measurement produces 20 axial slices in 3 s (one
image slice in 150 ms) with an inter-measurement interval of 2 s. The measurement started with active state. The imaging time for the whole
functional scans was 600 s (10 minutes) which produced 120 × 20 = 2400 images in total. A high resolution T2*-weighted images were obtained using
the voxel size of 1.64 mm × 1.64 mm × 4.00 mm.
2.4 Post-processing of data
The MRI data were analysed using MATLAB 7.4 – R2008a (Mathworks Inc. MA, USA) and Statistical Parametric Mapping (SPM8)
programming software. A conventional analysis based on the general linear
model was used to generate brain activation in the regions of interest using the T-statistic for each voxel. Individual subject analysis was performed at
corrected significant level (α) of 0.05. For group analysis, the fixed effects
analysis (FFX) was used and statistical inferences were also made at significant level (α) of 0.05, corrected for multiple comparisons (Friston et
al. (1996)).
The relative response change at the coordinates of maximum intensity for the right and left primary motor areas (M1left and M1right) for all
the tapping conditions was investigated using Statistical Packages for Social
Sciences (SPSS) software version 17.0. The relative response change
Modelling Activation and Connectivity in the Brain:
An fMRI Study during Externally Triggered Finger Tapping Task
Malaysian Journal of Mathematical Sciences 181
obtained from SPM analyses for M1left and M1right were compared by means
of independent t-test, i.e. the relative response change for M1left (due to right hand tapping) vs. the relative response change for M1right (due to left hand
tapping) and the relative response change for M1left vs. the relative response
change for M1right during bilateral tapping. The relationship between the
relative response change at the coordinates of maximum intensity for M1left and M1right for bilateral tapping was also investigated by means of simple
linear regression analysis to determine the existence of any temporal
relationship between the two activated areas across all subjects. The normality of the residuals as well as the linearity and homocedascity (equal
variance) between the predicted values and the residuals are clarified prior to
regression analysis. The independent t and regression analyses considered only the data that are obtained from fMRI measurements during active state.
All the results are reported based on significant level (α) of 0.05 with 95%
Confidence Interval (CI).
2.5 Dynamic Causal Modeling (DCM)
The effective connectivity among the activated Regions of Interest
(ROIs) during bilateral tapping was approached using Dynamic Causal Modeling (DCM10). The two brain regions each of which has a central role
in motor control were considered. The ROIs are M1left and M1right. The
anatomical location of the activation peak for these two regions having significant voxels (pcorrected < 0.05) was confirmed using the Anatomy
Toolbox (Eickoff et al. (2005)). These two ROIs for each individual were
co-registered with the activation peak obtained from the group analysis of
fixed effects (FFX). The peak coordinates for each ROI (defined as a sphere of 4 mm radius) was predetermined so that its displacement is within the 20-
mm radius from the peak activation obtained from the FFX activation map.
This 20-mm range was allowed for this study due to the relatively large M1 area in any individual. The individual peak coordinates must also be within
the same brain region (Grefkes et al. (2008)) with that of FFX, i.e. The
precentral gyrus (PCG). Subjects whose coordinates do not fulfill these two
criteria will be excluded from DCM analysis.
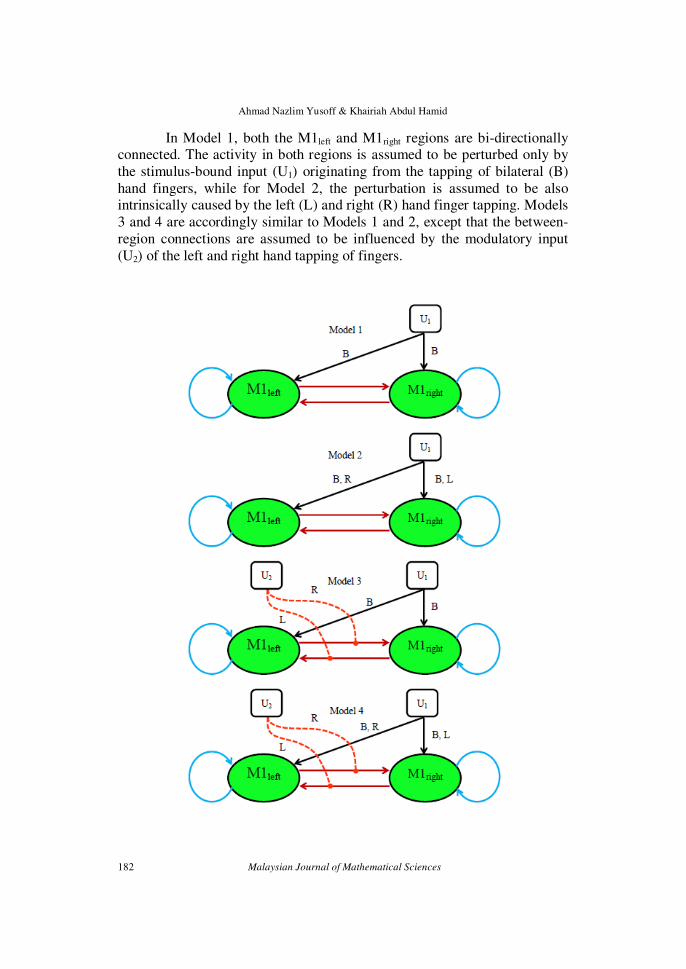
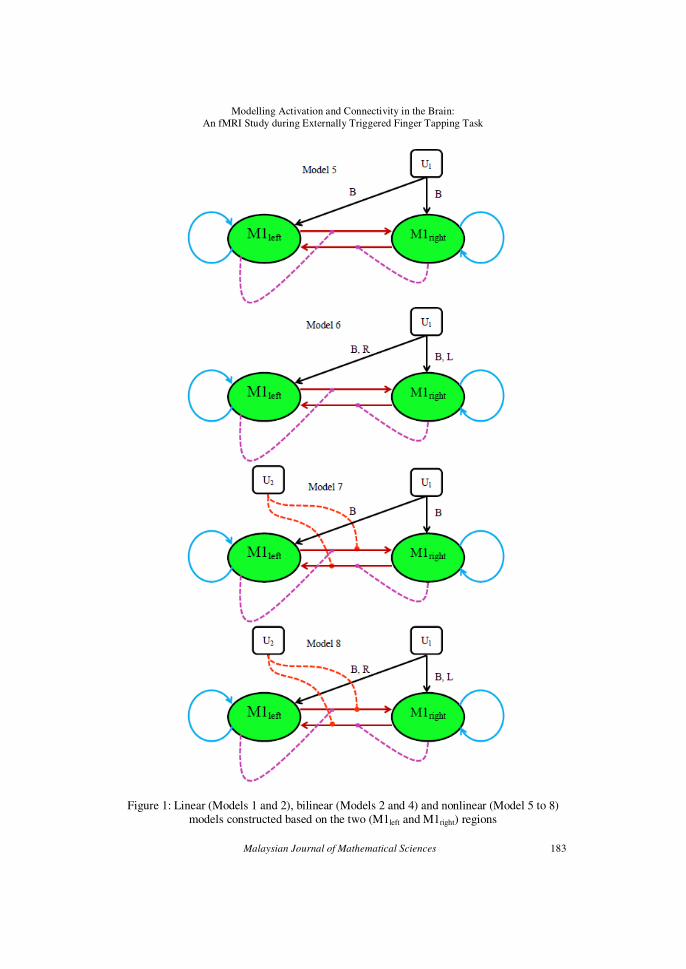
Figure 1 shows eight biologically and physically plausible linear
(Model 1 and 2), bilinear (Model 3 and 4) and nonlinear (Model 5 – 8) dynamic causal models for bilateral tapping of hand fingers, that are
constructed based on the two M1s coordinates of all the subjects that have
been found to be significantly activated at α = 0.05, corrected for multiple comparisons.
Ahmad Nazlim Yusoff & Khairiah Abdul Hamid
182 Malaysian Journal of Mathematical Sciences
In Model 1, both the M1left and M1right regions are bi-directionally connected. The activity in both regions is assumed to be perturbed only by
the stimulus-bound input (U1) originating from the tapping of bilateral (B)
hand fingers, while for Model 2, the perturbation is assumed to be also intrinsically caused by the left (L) and right (R) hand finger tapping. Models
3 and 4 are accordingly similar to Models 1 and 2, except that the between-
region connections are assumed to be influenced by the modulatory input
(U2) of the left and right hand tapping of fingers.
Modelling Activation and Connectivity in the Brain:
An fMRI Study during Externally Triggered Finger Tapping Task
Malaysian Journal of Mathematical Sciences 183
Figure 1: Linear (Models 1 and 2), bilinear (Models 2 and 4) and nonlinear (Model 5 to 8) models constructed based on the two (M1left and M1right) regions

Ahmad Nazlim Yusoff & Khairiah Abdul Hamid
184 Malaysian Journal of Mathematical Sciences
The attentional control on the movement of the left and right hand fingers that triggers simultaneously during the externally-triggered bilateral
tapping of hand fingers are thought to be the potential sources of U2. Models
5 – 8 are similar to Model 1 – 4 except that in addition to the stimulus-bound perturbation on regions and modulatory input on connections, the
connectivity between the two M1left and M1right regions are also gated by the
activity in the region itself. All models are assumed to have self connection
on each M1 region. All the models were fitted and inferred over all subjects using DCM10. The models were then compared by means of Bayesian
Model Selection (BMS) for group studies (Stephan et al. (2009, 2010)) to
test the null hypothesis that no single model is better than any other competing models and to obtain a model that has the best balance between
fit/accuracy and complexity. All the symbols, lines and arrows used in
Figure 1 are explained in Figure 2.
Figure 2: Definition of arrows, lines and symbols used in the dynamic causal models shown in Figure 1. U1 is the stimulus-bound perturbation while U2
is the stimulus-free contextual input
M1left M1right
U1 – direct influence of bilateral
(B,L or B,R) tapping on M1left and
M1right regions
U2 – indirect influence of
unilateral left (L) and and right
(R) hand tapping on M1left-
M1right connections
Direct influence of region M1left on M1left-M1right connection
Direct influence of region
M1right on M1right-M1leftconnection
Self
Connection,
modulated by U1
Self
Connection,
modulated by
U1
B, R
L B,L
Modelling Activation and Connectivity in the Brain:
An fMRI Study during Externally Triggered Finger Tapping Task
Malaysian Journal of Mathematical Sciences 185
3. RESULTS
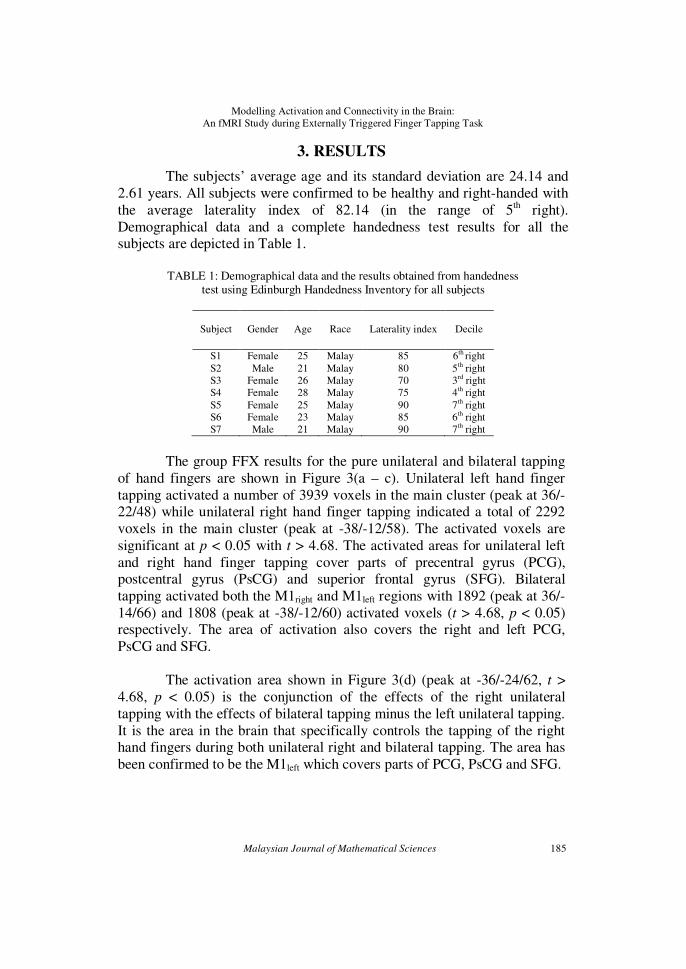
The subjects’ average age and its standard deviation are 24.14 and
2.61 years. All subjects were confirmed to be healthy and right-handed with
the average laterality index of 82.14 (in the range of 5th right).
Demographical data and a complete handedness test results for all the subjects are depicted in Table 1.
TABLE 1: Demographical data and the results obtained from handedness
test using Edinburgh Handedness Inventory for all subjects
Subject
Gender
Age
Race
Laterality index
Decile
S1 Female 25 Malay 85 6th
right
S2 Male 21 Malay 80 5th right
S3 Female 26 Malay 70 3rd
right
S4 Female 28 Malay 75 4th right
S5 Female 25 Malay 90 7th right
S6 Female 23 Malay 85 6th right
S7 Male 21 Malay 90 7th right
The group FFX results for the pure unilateral and bilateral tapping
of hand fingers are shown in Figure 3(a – c). Unilateral left hand finger
tapping activated a number of 3939 voxels in the main cluster (peak at 36/-22/48) while unilateral right hand finger tapping indicated a total of 2292
voxels in the main cluster (peak at -38/-12/58). The activated voxels are
significant at p < 0.05 with t > 4.68. The activated areas for unilateral left
and right hand finger tapping cover parts of precentral gyrus (PCG), postcentral gyrus (PsCG) and superior frontal gyrus (SFG). Bilateral
tapping activated both the M1right and M1left regions with 1892 (peak at 36/-
14/66) and 1808 (peak at -38/-12/60) activated voxels (t > 4.68, p < 0.05) respectively. The area of activation also covers the right and left PCG,
PsCG and SFG.
The activation area shown in Figure 3(d) (peak at -36/-24/62, t >
4.68, p < 0.05) is the conjunction of the effects of the right unilateral
tapping with the effects of bilateral tapping minus the left unilateral tapping.
It is the area in the brain that specifically controls the tapping of the right hand fingers during both unilateral right and bilateral tapping. The area has
been confirmed to be the M1left which covers parts of PCG, PsCG and SFG.

Ahmad Nazlim Yusoff & Khairiah Abdul Hamid
186 Malaysian Journal of Mathematical Sciences
There is only one activation cluster containing 1313 voxels from which 52.0% is in the left Brodmann Area (BA) 6 (15.9% activated), 14.7%
is in the left BA1 (21.0% activated), 11.8% is in the left BA4a (13.3%
activated) and 5.5% is in the left BA 4p (12.7% activated).
Similarly, Figure 3(e) indicates the area in the brain responsible for
controlling the tapping of the left hand fingers during both the unilateral left
and bilateral tapping. The activated area is the M1right covering parts of PCG and SFG. The activation area shown (peak at 42/-18/56, t > 4.68, p < 0.05)
was the conjunction of the effects of the left unilateral tapping with the
effects of bilateral tapping minus the right unilateral tapping. The activation cluster contains 743 voxels from which 54.4% of cluster is in the right BA6
(9.5% activated), 11.9% of cluster is in the right BA4a (8.0% activated),
6.9% of cluster is in the right BA1 (6.2% activated) and 6.8% of cluster is
in the right BA3b (5.5% activated).
Figure 3: Brain activation as explained in the text. The coordinates of maximum intensity are shown in the text box
36/-14/66 -38/-12/60 -38/-12/58 36/-22/48
42/-18/56 -36/-24/62
(a) (b) (c)
(d) (e)
Modelling Activation and Connectivity in the Brain:
An fMRI Study during Externally Triggered Finger Tapping Task
Malaysian Journal of Mathematical Sciences 187
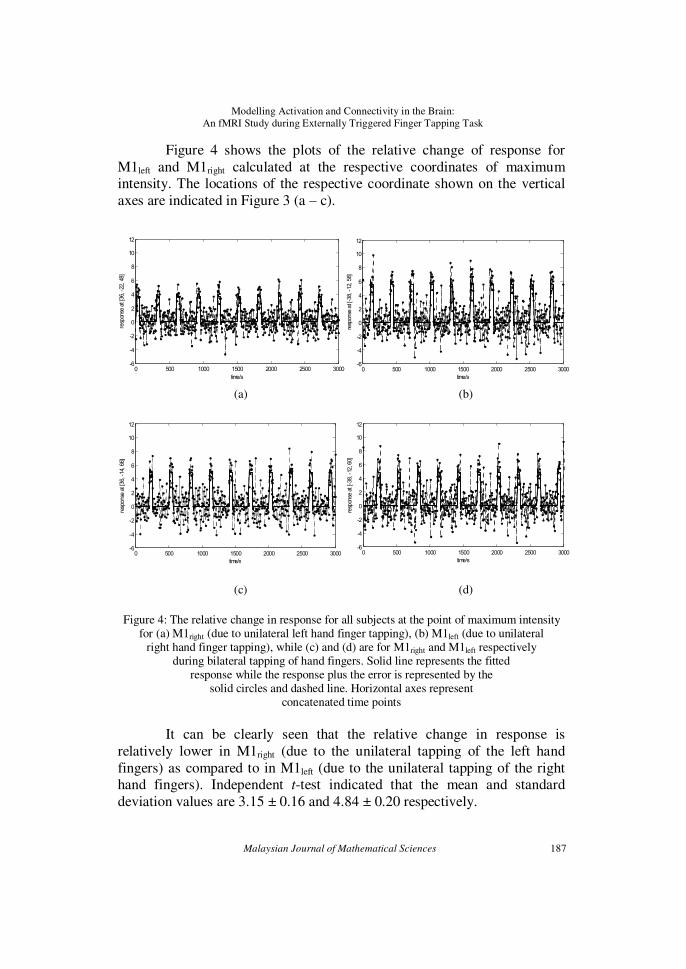
Figure 4 shows the plots of the relative change of response for
M1left and M1right calculated at the respective coordinates of maximum intensity. The locations of the respective coordinate shown on the vertical
axes are indicated in Figure 3 (a – c).
Figure 4: The relative change in response for all subjects at the point of maximum intensity
for (a) M1right (due to unilateral left hand finger tapping), (b) M1left (due to unilateral right hand finger tapping), while (c) and (d) are for M1right and M1left respectively
during bilateral tapping of hand fingers. Solid line represents the fitted response while the response plus the error is represented by the
solid circles and dashed line. Horizontal axes represent concatenated time points
It can be clearly seen that the relative change in response is
relatively lower in M1right (due to the unilateral tapping of the left hand
fingers) as compared to in M1left (due to the unilateral tapping of the right hand fingers). Independent t-test indicated that the mean and standard
deviation values are 3.15 ± 0.16 and 4.84 ± 0.20 respectively.
0 500 1000 1500 2000 2500 3000-6
-4
-2
0
2
4
6
8
10
12
time/s
response at [-38, -12, 58]
R
0 500 1000 1500 2000 2500 3000-6
-4
-2
0
2
4
6
8
10
12
time/s
response at [36, -22, 48]
0 500 1000 1500 2000 2500 3000-6
-4
-2
0
2
4
6
8
10
12
time/s
response at [36, -14, 66]
B
0 500 1000 1500 2000 2500 3000-6
-4
-2
0
2
4
6
8
10
12
time/s
response at [-38, -12, 60]
B
(a) (b)
(c) (d)
Ahmad Nazlim Yusoff & Khairiah Abdul Hamid
188 Malaysian Journal of Mathematical Sciences
The difference has been found to be significant [n = 140; p < 0.001; 95% CI (-2.12,-1.17)]. However, the change in response is about the same
in the M1left and M1right during bilateral tapping from which the values are
4.44 ± 0.18 and 4.36 ± 0.19 respectively and the difference has been found to be insignificant [n = 140; p = 0.77; 95% CI (-0.43, 0.58)].
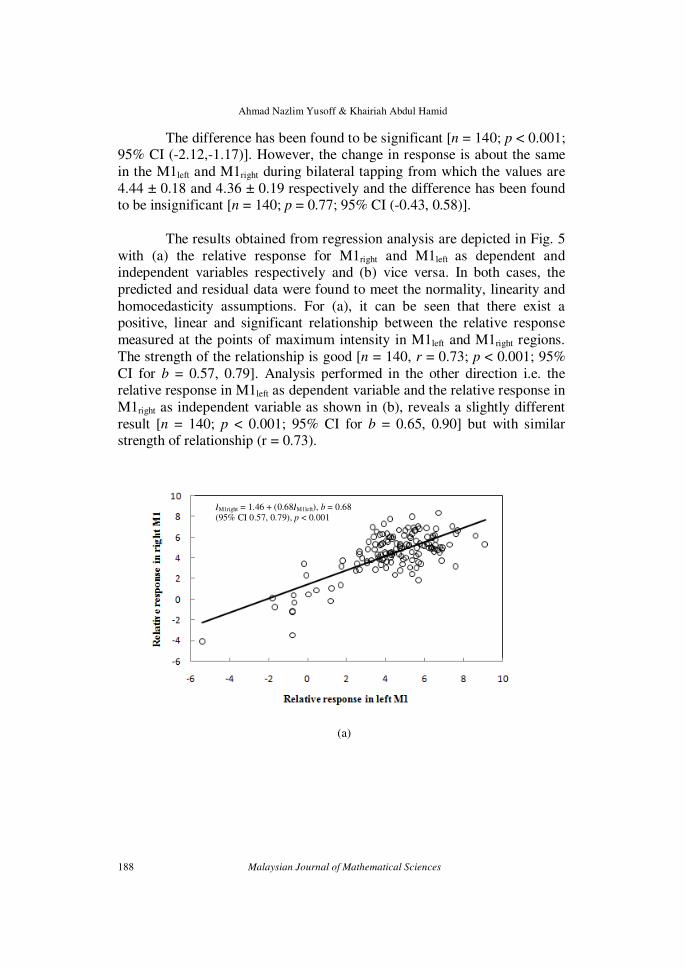
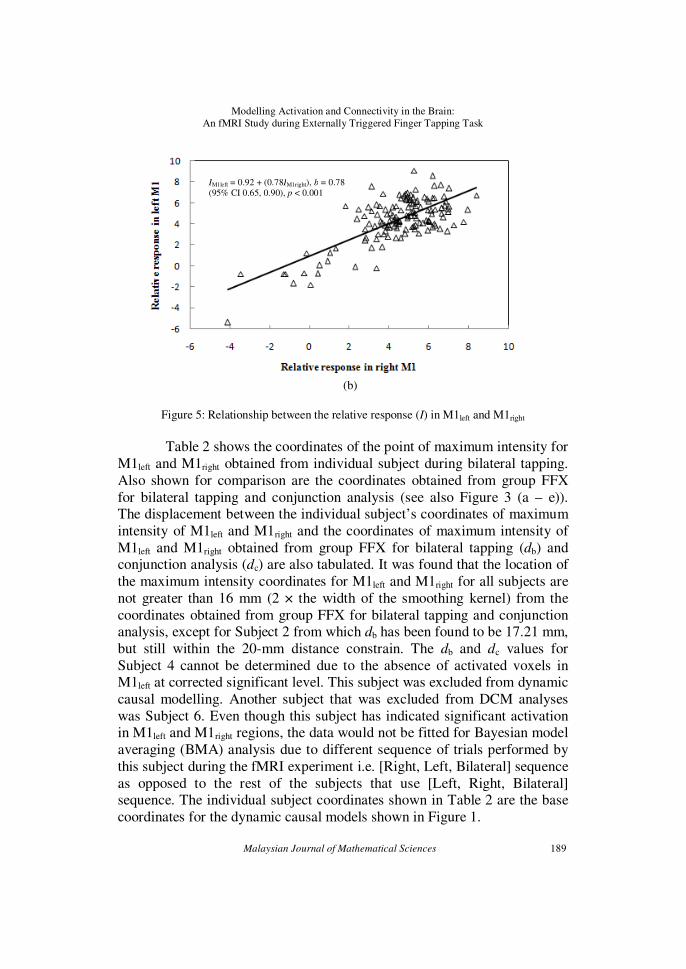
The results obtained from regression analysis are depicted in Fig. 5
with (a) the relative response for M1right and M1left as dependent and independent variables respectively and (b) vice versa. In both cases, the
predicted and residual data were found to meet the normality, linearity and
homocedasticity assumptions. For (a), it can be seen that there exist a positive, linear and significant relationship between the relative response
measured at the points of maximum intensity in M1left and M1right regions.
The strength of the relationship is good [n = 140, r = 0.73; p < 0.001; 95%
CI for b = 0.57, 0.79]. Analysis performed in the other direction i.e. the relative response in M1left as dependent variable and the relative response in
M1right as independent variable as shown in (b), reveals a slightly different
result [n = 140; p < 0.001; 95% CI for b = 0.65, 0.90] but with similar strength of relationship (r = 0.73).
IM1right = 1.46 + (0.68IM1left), b = 0.68
(95% CI 0.57, 0.79), p < 0.001
(a)
Modelling Activation and Connectivity in the Brain:
An fMRI Study during Externally Triggered Finger Tapping Task
Malaysian Journal of Mathematical Sciences 189
Figure 5: Relationship between the relative response (I) in M1left and M1right
Table 2 shows the coordinates of the point of maximum intensity for
M1left and M1right obtained from individual subject during bilateral tapping.
Also shown for comparison are the coordinates obtained from group FFX
for bilateral tapping and conjunction analysis (see also Figure 3 (a – e)). The displacement between the individual subject’s coordinates of maximum
intensity of M1left and M1right and the coordinates of maximum intensity of
M1left and M1right obtained from group FFX for bilateral tapping (db) and conjunction analysis (dc) are also tabulated. It was found that the location of
the maximum intensity coordinates for M1left and M1right for all subjects are
not greater than 16 mm (2 × the width of the smoothing kernel) from the
coordinates obtained from group FFX for bilateral tapping and conjunction analysis, except for Subject 2 from which db has been found to be 17.21 mm,
but still within the 20-mm distance constrain. The db and dc values for
Subject 4 cannot be determined due to the absence of activated voxels in M1left at corrected significant level. This subject was excluded from dynamic
causal modelling. Another subject that was excluded from DCM analyses
was Subject 6. Even though this subject has indicated significant activation in M1left and M1right regions, the data would not be fitted for Bayesian model
averaging (BMA) analysis due to different sequence of trials performed by
this subject during the fMRI experiment i.e. [Right, Left, Bilateral] sequence
as opposed to the rest of the subjects that use [Left, Right, Bilateral] sequence. The individual subject coordinates shown in Table 2 are the base
coordinates for the dynamic causal models shown in Figure 1.
IM1left = 0.92 + (0.78IM1right), b = 0.78
(95% CI 0.65, 0.90), p < 0.001
(b)

Ahmad Nazlim Yusoff & Khairiah Abdul Hamid
190 Malaysian Journal of Mathematical Sciences
TABLE 2: Individual coordinates of maximum intensity in M1left and M1right during bilateral
tapping and their displacement from the coordinates obtained from group FFX and conjunction analyses (also shown at the bottom of the table)
M1left coordinates
db/mm dc/mm M1right
coordinates db/mm dc/mm
Subject 1 -40/-10/56 4.90 15.75 40/-8/60 9.38 10.95 Subject 2 -38/-24/60 12.00 2.83 38/-30/60 17.21 13.27
Subject 3 -38/-14/64 4.47 10.39 36/-16/68 2.83 13.57 Subject 4 - - - 38/-18/56 10.95 4.00 Subject 5 -38/-20/54 10.00 9.17 44/-16/56 12.96 2.83 Subject 6 -30/-24/56 14.97 8.49 38/-16/62 4.90 7.48 Subject 7 -40/-10/56 4.90 15.75 40/-8/60 9.38 10.95
FFX Bilateral -38/-12/60 0 12.33 36/-14/66 0 12.33 Conjunction -36/-24/62 12.33 0 42/-18/56 12.33 0
db: Displacement of individual from group FFX coordinates of maximum intensity when overlaid onto the same space dc: Displacement of individual from conjunction coordinates of maximum intensity when overlaid onto the same space
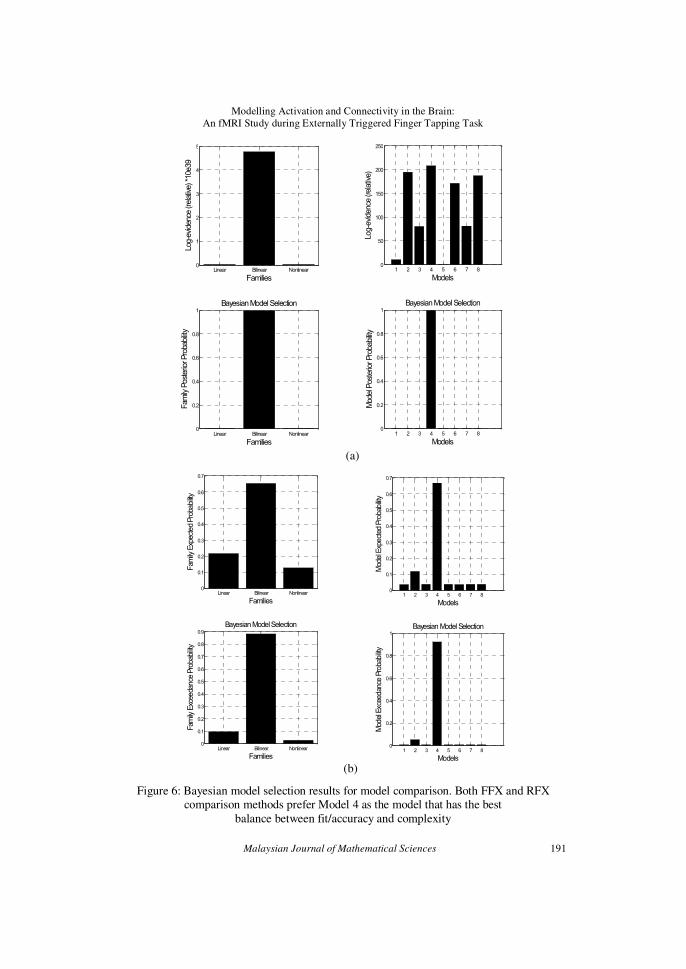
The results obtained from model comparison are shown in Figure 6
for BMS analysis of (a) FFX and (b) RFX (Stephan (2009)). The bar charts
on the left represent the results of family comparison. They clearly show the
preference of bilinear model family to linear and nonlinear model families. A detail model comparison results is shown by the bar charts on the right.
Bayesian model selection (BMS) has chosen Model 4 as the winning model
against the other seven models. The numerical results obtained from model comparison are tabulated in Table 3. From RFX analysis, it can be seen that
Model 4 has the lowest sum of free energy (ΣF) value but shows the highest
Dirichlet parameter estimate (αd), expected (r) and exceedance probabilities
(ψ). In FFX analysis, Model 4 has the highest likelihood and its probability
(ϕ). The fact that Model 4 is the winning model has been agreed upon by
RFX and FFX analyses. This indicates that Model 4 is the model that has the best balance between fit/accuracy and complexity. Thus, the null
hypothesis that no single model is better than any other model is rejected.
Modelling Activation and Connectivity in the Brain:
An fMRI Study during Externally Triggered Finger Tapping Task
Malaysian Journal of Mathematical Sciences 191
Figure 6: Bayesian model selection results for model comparison. Both FFX and RFX comparison methods prefer Model 4 as the model that has the best
balance between fit/accuracy and complexity
Linear Bilinear Nonlinear0
1
2
3
4
5
Log-evidence (relative) *10e39
Families
Linear Bilinear Nonlinear0
0.2
0.4
0.6
0.8
1
Family Posterior Probability
Families
Bayesian Model Selection
1 2 3 4 5 6 7 80
50
100
150
200
250
Log-evidence (relative)
Models
1 2 3 4 5 6 7 80
0.2
0.4
0.6
0.8
1
Model Posterior Probability
Bayesian Model Selection
Models
(a)
Linear Bilinear Nonlinear0
0.1
0.2
0.3
0.4
0.5
0.6
0.7
Fam
ily Expected Probability
Families
Linear Bilinear Nonlinear0
0.1
0.2
0.3
0.4
0.5
0.6
0.7
0.8
0.9
Fam
ily Exceedance Probability
Families
Bayesian Model Selection
1 2 3 4 5 6 7 80
0.1
0.2
0.3
0.4
0.5
0.6
0.7
Model Expected Probability
Models
Bayesian Model Selection
1 2 3 4 5 6 7 80
0.2
0.4
0.6
0.8
1
Model Exceedance Probability
Models
Bayesian Model Selection
(b)
Ahmad Nazlim Yusoff & Khairiah Abdul Hamid
192 Malaysian Journal of Mathematical Sciences
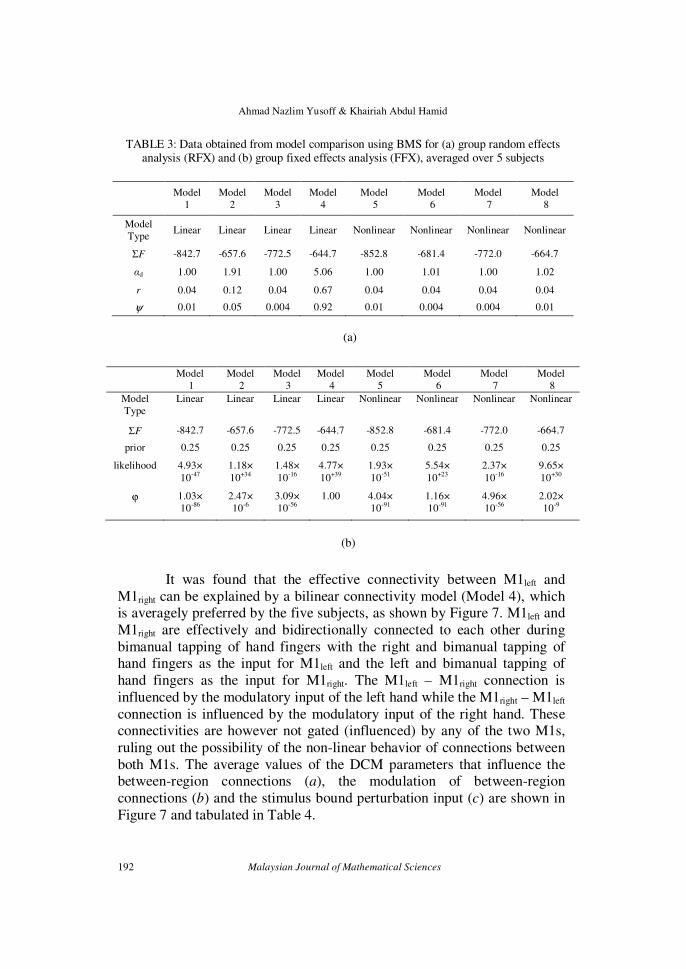
TABLE 3: Data obtained from model comparison using BMS for (a) group random effects analysis (RFX) and (b) group fixed effects analysis (FFX), averaged over 5 subjects
Model
1
Model
2
Model
3
Model
4
Model
5
Model
6
Model
7
Model
8
Model
Type Linear Linear Linear Linear Nonlinear Nonlinear Nonlinear Nonlinear
ΣF -842.7 -657.6 -772.5 -644.7 -852.8 -681.4 -772.0 -664.7
αd 1.00 1.91 1.00 5.06 1.00 1.01 1.00 1.02
r 0.04 0.12 0.04 0.67 0.04 0.04 0.04 0.04
ψ 0.01 0.05 0.004 0.92 0.01 0.004 0.004 0.01
Model
1
Model
2
Model
3
Model
4
Model
5
Model
6
Model
7
Model
8
Model
Type
Linear Linear Linear Linear Nonlinear Nonlinear Nonlinear Nonlinear
ΣF -842.7 -657.6 -772.5 -644.7 -852.8 -681.4 -772.0 -664.7
prior 0.25 0.25 0.25 0.25 0.25 0.25 0.25 0.25
likelihood 4.93×
10-47
1.18×
10+34
1.48×
10-16
4.77×
10+39
1.93×
10-51
5.54×
10+23
2.37×
10-16
9.65×
10+30
ϕ 1.03×
10-86
2.47×
10-6
3.09×
10-56
1.00 4.04×
10-91
1.16×
10-91
4.96×
10-56
2.02×
10-9
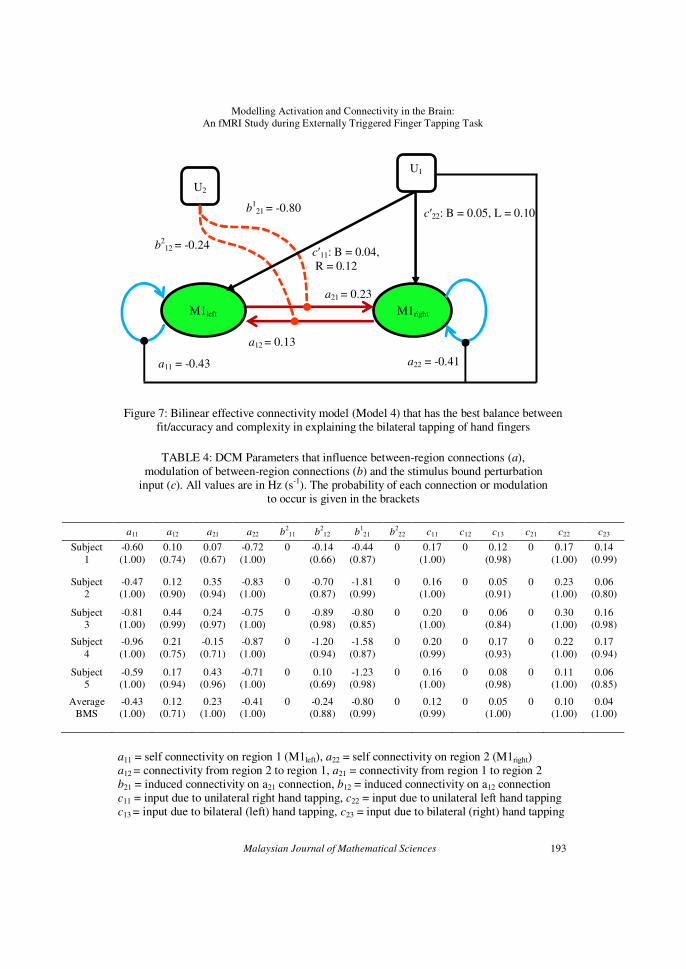
It was found that the effective connectivity between M1left and
M1right can be explained by a bilinear connectivity model (Model 4), which is averagely preferred by the five subjects, as shown by Figure 7. M1left and
M1right are effectively and bidirectionally connected to each other during
bimanual tapping of hand fingers with the right and bimanual tapping of hand fingers as the input for M1left and the left and bimanual tapping of
hand fingers as the input for M1right. The M1left – M1right connection is
influenced by the modulatory input of the left hand while the M1right – M1left
connection is influenced by the modulatory input of the right hand. These connectivities are however not gated (influenced) by any of the two M1s,
ruling out the possibility of the non-linear behavior of connections between
both M1s. The average values of the DCM parameters that influence the between-region connections (a), the modulation of between-region
connections (b) and the stimulus bound perturbation input (c) are shown in
Figure 7 and tabulated in Table 4.
(a)
(b)
Modelling Activation and Connectivity in the Brain:
An fMRI Study during Externally Triggered Finger Tapping Task
Malaysian Journal of Mathematical Sciences 193
Figure 7: Bilinear effective connectivity model (Model 4) that has the best balance between fit/accuracy and complexity in explaining the bilateral tapping of hand fingers
TABLE 4: DCM Parameters that influence between-region connections (a),
modulation of between-region connections (b) and the stimulus bound perturbation input (c). All values are in Hz (s-1). The probability of each connection or modulation
to occur is given in the brackets
a11 a12 a21 a22 b
211 b
212 b
121 b
222 c11 c12 c13 c21 c22 c23
Subject
1
-0.60
(1.00)
0.10
(0.74)
0.07
(0.67)
-0.72
(1.00)
0 -0.14
(0.66)
-0.44
(0.87)
0 0.17
(1.00)
0 0.12
(0.98)
0 0.17
(1.00)
0.14
(0.99)
Subject
2
-0.47
(1.00)
0.12
(0.90)
0.35
(0.94)
-0.83
(1.00)
0 -0.70
(0.87)
-1.81
(0.99)
0 0.16
(1.00)
0 0.05
(0.91)
0 0.23
(1.00)
0.06
(0.80)
Subject
3
-0.81
(1.00)
0.44
(0.99)
0.24
(0.97)
-0.75
(1.00)
0 -0.89
(0.98)
-0.80
(0.85)
0 0.20
(1.00)
0 0.06
(0.84)
0 0.30
(1.00)
0.16
(0.98)
Subject
4
-0.96
(1.00)
0.21
(0.75)
-0.15
(0.71)
-0.87
(1.00)
0 -1.20
(0.94)
-1.58
(0.87)
0 0.20
(0.99)
0 0.17
(0.93)
0 0.22
(1.00)
0.17
(0.94)
Subject
5
-0.59
(1.00)
0.17
(0.94)
0.43
(0.96)
-0.71
(1.00)
0 0.10
(0.69)
-1.23
(0.98)
0 0.16
(1.00)
0 0.08
(0.98)
0 0.11
(1.00)
0.06
(0.85)
Average
BMS
-0.43
(1.00)
0.12
(0.71)
0.23
(1.00)
-0.41
(1.00)
0 -0.24
(0.88)
-0.80
(0.99)
0 0.12
(0.99)
0 0.05
(1.00)
0 0.10
(1.00)
0.04
(1.00)
a11 = self connectivity on region 1 (M1left), a22 = self connectivity on region 2 (M1right) a12 = connectivity from region 2 to region 1, a21 = connectivity from region 1 to region 2 b21 = induced connectivity on a21 connection, b12 = induced connectivity on a12 connection c11 = input due to unilateral right hand tapping, c22 = input due to unilateral left hand tapping c13 = input due to bilateral (left) hand tapping, c23 = input due to bilateral (right) hand tapping
a21 = 0.23
b121 = -0.80
U1
M1left M1right
U2
b212 = -0.24
c′11: B = 0.04,
R = 0.12
c′22: B = 0.05, L = 0.10
a11 = -0.43 a22 = -0.41
a12 = 0.13
Ahmad Nazlim Yusoff & Khairiah Abdul Hamid
194 Malaysian Journal of Mathematical Sciences
4. DISCUSSION
4.1 Modelling the brain activation
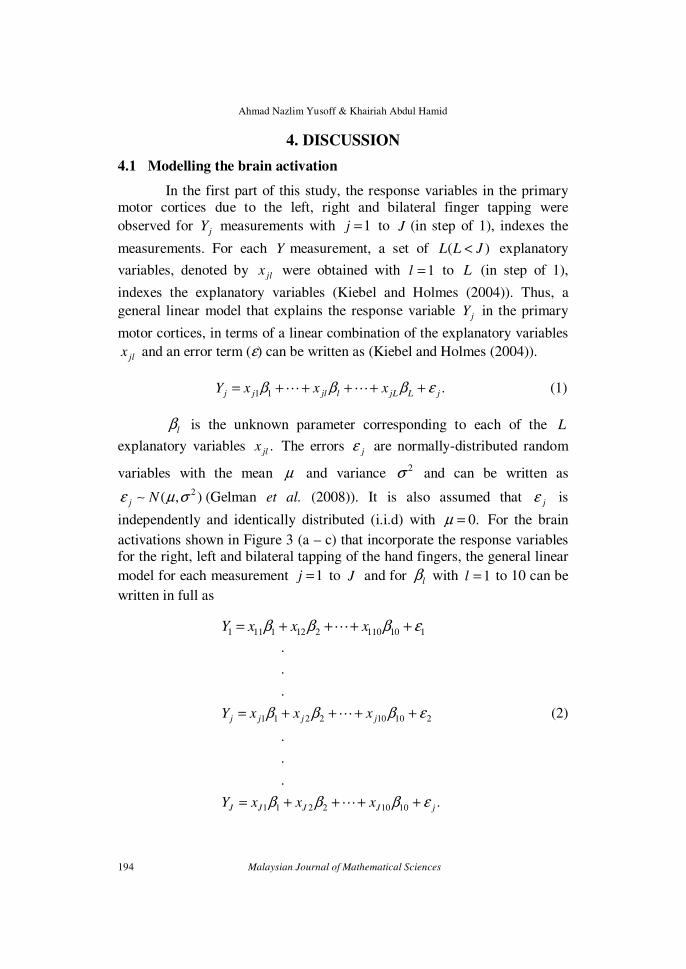
In the first part of this study, the response variables in the primary motor cortices due to the left, right and bilateral finger tapping were
observed for jY measurements with 1j = to J (in step of 1), indexes the
measurements. For each Y measurement, a set of ( )L L J< explanatory
variables, denoted by jlx were obtained with 1l = to L (in step of 1),
indexes the explanatory variables (Kiebel and Holmes (2004)). Thus, a
general linear model that explains the response variable jY in the primary
motor cortices, in terms of a linear combination of the explanatory variables
jlx and an error term (ε) can be written as (Kiebel and Holmes (2004)).
1 1 .j j jl l jL L jY x x xβ β β ε= + + + + +⋯ ⋯ (1)
lβ is the unknown parameter corresponding to each of the L
explanatory variables .jlx The errors jε are normally-distributed random
variables with the mean µ and variance 2σ and can be written as
2( , )j Nε µ σ∼ (Gelman et al. (2008)). It is also assumed that jε is
independently and identically distributed (i.i.d) with 0.µ = For the brain
activations shown in Figure 3 (a – c) that incorporate the response variables for the right, left and bilateral tapping of the hand fingers, the general linear
model for each measurement 1j = to J and for lβ with 1l = to 10 can be
written in full as
1 11 1 12 2 110 10 1Y x x xβ β β ε= + + + +⋯
.
.
.
1 1 2 2 10 10 2j j j jY x x xβ β β ε= + + + +⋯ (2)
.
.
.
1 1 2 2 10 10 .J J J J jY x x xβ β β ε= + + + +⋯
Modelling activation and connectivity in the brain:
An fMRI study during externally triggered finger tapping task
Malaysian Journal of Mathematical Sciences 195
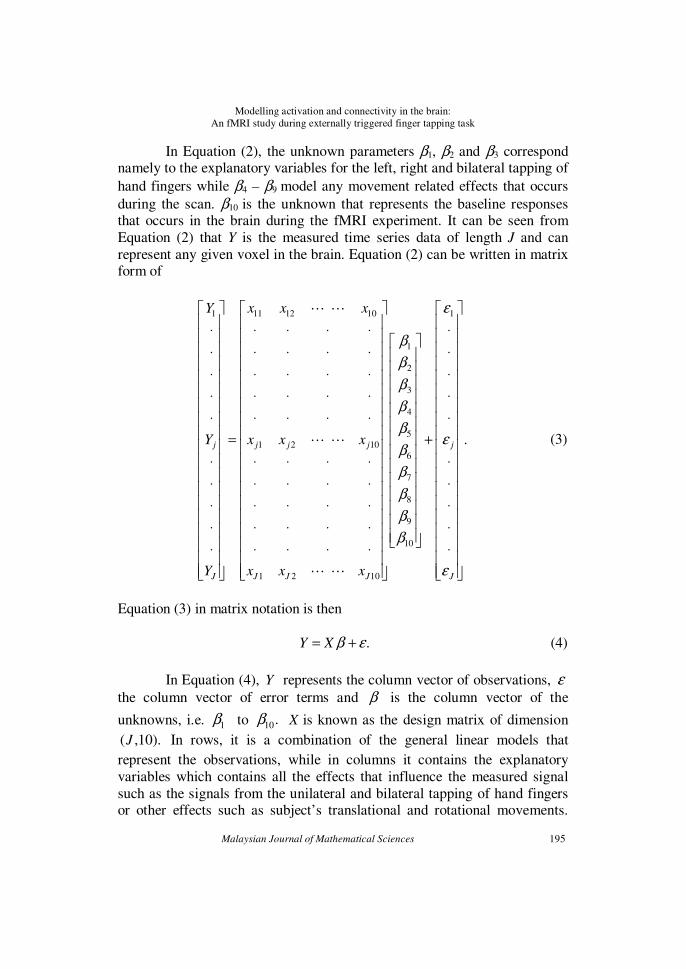
In Equation (2), the unknown parameters β1, β2 and β3 correspond namely to the explanatory variables for the left, right and bilateral tapping of
hand fingers while β4 – β9 model any movement related effects that occurs
during the scan. β10 is the unknown that represents the baseline responses that occurs in the brain during the fMRI experiment. It can be seen from
Equation (2) that Y is the measured time series data of length J and can
represent any given voxel in the brain. Equation (2) can be written in matrix form of
1 11 12 10
1
2
3
4
5
1 2 10
6
7
8
9
10
1 2 10
j j j j
J J J J
Y x x x
Y x x x
Y x x x
ββ
β
ββ
ββ
β
ββ
⋅ ⋅ ⋅ ⋅ ⋅ ⋅ ⋅ ⋅ ⋅ ⋅
⋅ ⋅ ⋅ ⋅ ⋅ ⋅ ⋅ ⋅ ⋅ ⋅
⋅ ⋅ ⋅ ⋅ ⋅ =
⋅ ⋅ ⋅ ⋅ ⋅ ⋅ ⋅ ⋅ ⋅ ⋅ ⋅ ⋅ ⋅ ⋅ ⋅
⋅ ⋅ ⋅ ⋅ ⋅ ⋅ ⋅ ⋅ ⋅ ⋅
⋯ ⋯
⋯ ⋯
⋯ ⋯
1
.j
J
ε
ε
ε
⋅ ⋅ ⋅ ⋅ ⋅ + ⋅ ⋅ ⋅ ⋅ ⋅
(3)
Equation (3) in matrix notation is then
.Y X β ε= + (4)
In Equation (4), Y represents the column vector of observations, ε
the column vector of error terms and β is the column vector of the
unknowns, i.e. 1β to 10.β X is known as the design matrix of dimension
( ,10).J In rows, it is a combination of the general linear models that
represent the observations, while in columns it contains the explanatory
variables which contains all the effects that influence the measured signal
such as the signals from the unilateral and bilateral tapping of hand fingers or other effects such as subject’s translational and rotational movements.
Ahmad Nazlim Yusoff & Khairiah Abdul Hamid
196 Malaysian Journal of Mathematical Sciences
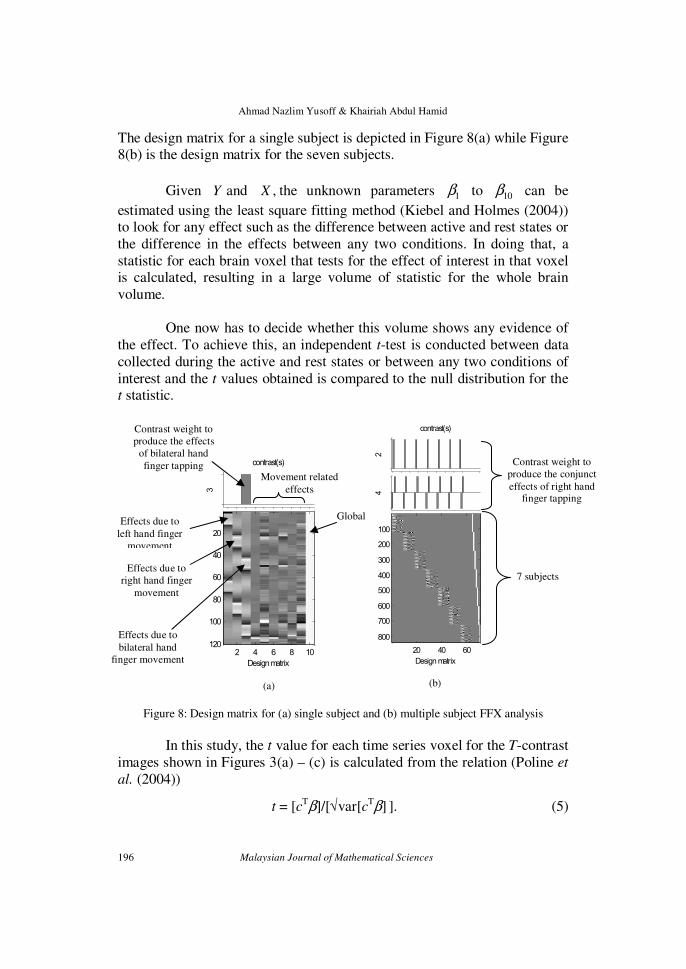
The design matrix for a single subject is depicted in Figure 8(a) while Figure 8(b) is the design matrix for the seven subjects.
Given Y and ,X the unknown parameters 1β to 10β can be
estimated using the least square fitting method (Kiebel and Holmes (2004)) to look for any effect such as the difference between active and rest states or
the difference in the effects between any two conditions. In doing that, a
statistic for each brain voxel that tests for the effect of interest in that voxel is calculated, resulting in a large volume of statistic for the whole brain
volume.
One now has to decide whether this volume shows any evidence of
the effect. To achieve this, an independent t-test is conducted between data
collected during the active and rest states or between any two conditions of
interest and the t values obtained is compared to the null distribution for the t statistic.
Figure 8: Design matrix for (a) single subject and (b) multiple subject FFX analysis
In this study, the t value for each time series voxel for the T-contrast
images shown in Figures 3(a) – (c) is calculated from the relation (Poline et
al. (2004))
t = [cTβ]/[√var[c
Tβ] ]. (5)
Design matrix
2 4 6 8 10
20
40
60
80
100
120
contrast(s)
3
Design matrix
20 40 60
100
200
300
400
500
600
700
800
contrast(s)
42
Movement related
effects
Effects due to
left hand finger
movement
Effects due to
right hand finger
movement
Effects due to
bilateral hand
finger movement
Contrast weight to
produce the effects
of bilateral hand
finger tapping
Global
7 subjects
Contrast weight to
produce the conjunct
effects of right hand finger tapping
(a) (b)
Modelling activation and connectivity in the brain:
An fMRI study during externally triggered finger tapping task
Malaysian Journal of Mathematical Sciences 197
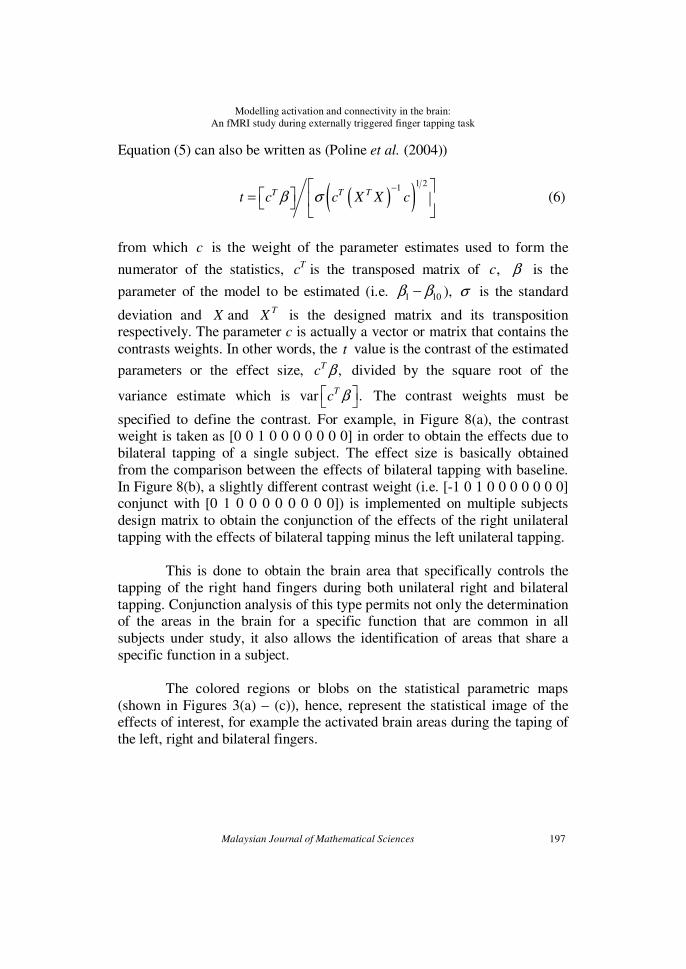
Equation (5) can also be written as (Poline et al. (2004))
( )( )1 2
1T T Tt c c X X cβ σ
− =
(6)
from which c is the weight of the parameter estimates used to form the
numerator of the statistics, Tc is the transposed matrix of ,c β is the
parameter of the model to be estimated (i.e. 1 10β β− ), σ is the standard
deviation and X and T
X is the designed matrix and its transposition respectively. The parameter c is actually a vector or matrix that contains the
contrasts weights. In other words, the t value is the contrast of the estimated
parameters or the effect size, ,Tc β divided by the square root of the
variance estimate which is var .T
c β The contrast weights must be
specified to define the contrast. For example, in Figure 8(a), the contrast weight is taken as [0 0 1 0 0 0 0 0 0 0] in order to obtain the effects due to
bilateral tapping of a single subject. The effect size is basically obtained
from the comparison between the effects of bilateral tapping with baseline.
In Figure 8(b), a slightly different contrast weight (i.e. [-1 0 1 0 0 0 0 0 0 0] conjunct with [0 1 0 0 0 0 0 0 0 0]) is implemented on multiple subjects
design matrix to obtain the conjunction of the effects of the right unilateral
tapping with the effects of bilateral tapping minus the left unilateral tapping.
This is done to obtain the brain area that specifically controls the
tapping of the right hand fingers during both unilateral right and bilateral
tapping. Conjunction analysis of this type permits not only the determination of the areas in the brain for a specific function that are common in all
subjects under study, it also allows the identification of areas that share a
specific function in a subject.
The colored regions or blobs on the statistical parametric maps
(shown in Figures 3(a) – (c)), hence, represent the statistical image of the effects of interest, for example the activated brain areas during the taping of
the left, right and bilateral fingers.

Ahmad Nazlim Yusoff & Khairiah Abdul Hamid
198 Malaysian Journal of Mathematical Sciences
The results are obtained from the application of t-test (T contrast) on
each voxel and by taking the p value smaller than a designated alpha (α)
value as significant. In other words, for a given voxel, the general linear model, by means of least square fitting, will figure out just what type that
voxel is by modelling it as a linear combination of the hypothetical time
series as discussed earlier (Kiebel & Holmes (2004)). The fitting or
estimation entails finding the parameter values (β1 – β10) such that the linear combination best fits the measured data.
4.2 Functional specialization and response change
Based on Figures 3 (a – c) and Figures 4 (a – d), it is quite interesting to see that M1right (the control of the left hand finger tapping)
shows a larger number of activated voxels but with a relatively lower
activation response as compared to M1left (the control of the right-hand finger tapping), as opposed to our previous study (Ahmad Nazlim Yusoff et
al. (2010a, 2010b, 2010c)) on multiple subjects performing self-paced
tapping of hand fingers, despite the fact that all the subjects in the present
and previous studies were right handed. This suggests that the spatial and height extent of activation may differ between externally triggered and self-
paced tapping of hand fingers.
In our previous study (Ahmad Nazlim Yusoff et al. (2010a, 2011)),
we found that the average activation area is larger in M1left during unilateral
right hand finger tapping as compared to M1right during unilateral left hand finger tapping. The study used a robust self-paced finger tapping. Prior to
the fMRI scan, the subjects were told that they need to tap their fingers two
times in one second using an intermediate force between too soft and too
hard. However, since all the subjects were right-handed, there would be a tendency for the subjects to tap their preferred hand fingers faster than their
non-preferred hand fingers, resulting in the rate effects that will cause higher
activation in terms of number of activated voxel. It has been reported that the rate effects will cause higher activation both in terms of signal intensity
and number of activated voxel (Jäncke et al. (1998)). In the present study,
the rate effects did not come into play since the tapping is externally triggered at a constant pace. The findings obtained from this study are
however in good agreement with a multiple subject fMRI study on unilateral
and bilateral sequential movement in right-handers (Jäncke et al. (1998) and
Lutz et al. (2005)). The authors reported that the right hemisphere showed more activation than the left hemisphere in both unilateral and bilateral task
at two tapping frequencies. Their interpretations are that right-handers
expend more effort to perform with their non-preferred hand. A stronger
Modelling activation and connectivity in the brain:
An fMRI study during externally triggered finger tapping task
Malaysian Journal of Mathematical Sciences 199
activation pattern in the right hemisphere is the result of trying to perform
the tapping task using a system that is slightly less competent with the implication that the more skilled and competent system will expend less
effort and will therefore provide a relatively weaker activation. Based on the
interpretation given above, it seemed that the influence of the average
effects of the sub-dominant hand is greater than the effects that would be produced by the dominant hand.
Interestingly, in contrast to the spatial extent of activation, the change in response for M1 obtained in this study is relatively higher in M1left
(during the right hand finger tapping) as compared to the change in response
measured in M1right (during the left hand finger tapping) see Figures 4(a) and (b). This finding is in contrast to the number of activated voxels which is
higher for the tapping of the left hand fingers as compared to tapping of the
right hand fingers. In relation to the discussion above, it can be assumed that
if the tapping pace is kept constant (using an external trigger) hand dominancy does not influence the height extent of activation as it does on
the spatial extent of activation. As a result, the higher change in response
observed in M1left is potentially due only to the tendency of these right-handers to press their fingers harder against the thumb using their dominant
hand fingers, whereby a larger force will activate a higher response. In an
fMRI study on ten right handed subjects that were instructed to squeeze the sphygmomanometer rubber bulb at different pressure level (Thickbroom et
al. (1998)) using finger flexion of their dominant hand, an increase in
response in terms of signal intensity, signal density and even voxel count
have been demonstrated as the pressure level (force) is increased. The finding in our study is also supported by another fMRI study on brain
activation during precision and power gripping by Kuhtz-Buschbeck et al.
(2008) that has revealed a positive linear relationship between the blood oxygenation level dependent (BOLD) signal intensity in the left M1 and
right cerebellum with the grip force. They have also managed to show in
their communication, a number of published coordinates of brain regions
with force-related increases in brain activity (activation) that have been obtained by many studies before. Interestingly, there are also other studies
that discover negative relationship between the force and brain activation
(i.e. deactivation) see for example Ward and Frackowiak (2003). However, the number is superseded by the studies that show brain activation increase
as the force is increased.

Ahmad Nazlim Yusoff & Khairiah Abdul Hamid
200 Malaysian Journal of Mathematical Sciences
For bilateral tapping of hand fingers, the number of activated voxels in M1left and M1right and their responses are about the same. This behavior
has also been found in our previous study (Ahmad Nazlim Yusoff et al.
(2011)) on self-paced tapping of hand fingers. A neural network study on bilateral hand movement conducted by Walsh et al. (2008) using structural
equation modeling (SEM) indicated that the activation during bilateral hand
movement is not supposed to be equal to the addition of the activation
obtained from unilateral left and right hand finger movements. They have also found that the intra hemispheric connectivity network within each
hemisphere was found to be different during unilateral tapping.
However, the connectivity network in one hemisphere is a mirror
image of the network in the other hemisphere during bilateral tapping. It has
also been previously suggested (Serrien et al. (2003)) that the increase in the
interaction between sensory motor cortices in both hemisphere is required for bilateral hand movement from which the activity in the non dominant
hemisphere is driven by the activity in the dominant hemisphere (Walsh et
al. (2008)). Another compelling study was by Grefkes et al. (2008) which used DCM to investigate the cortical network during unilateral and bilateral
hand movements. They reported that during bilateral hand movement, there
will be an increase in the intra hemispheric connectivity and transcallosal coupling of the supplementary motor area (SMA) and M1 which in turn
mediates the facilitation of neural activity, associated with bilateral hand
movement. Thus, it can be said that during bilateral tapping of hand fingers,
the average effects in both the M1left and M1right seemed to be contributed by the simultaneous control of both the left and right hand finger tapping. In
performing the tapping, all the subjects have two common objectives which
are 1) to tap their fingers according to the external trigger and 2) to perform a simultaneous and in-phased tapping of the left and right hand fingers. Such
coordination, according to the previous studies mentioned previously, will
generate a symbiotic network effect between the dominant and non dominant hemispheres, from which the dominant hemisphere will drive the
activation in the non dominant hemisphere resulting in an equal spatial
(area) and height (intensity) extent of activation in both M1left and M1right.
In relation to the discussion above, it is quite interesting to conclude
the mutual dependency between M1left and M1right during bilateral tapping of
hand fingers in the perspective of regression analysis results given in Figure 5(a) and (b). The results obtained from regression analysis represent, among
others, the temporal correlation between two activated areas, hence
functional connectivity. It can be clearly seen that the relative response in
M1left and M1right during bilateral tapping fulfilled a good, positive, linear
Modelling activation and connectivity in the brain:
An fMRI study during externally triggered finger tapping task
Malaysian Journal of Mathematical Sciences 201
and significant relationship with each other and in accordance with the
existence of a symbiotic network effect as mentioned in the previous paragraph. The increase in the relative response in one region will cause an
increase in the other. However, the study of functional connectivity is
limited by the regression model itself and is not mechanistic in nature and
would not be able to conclude on the causal nature of the activation in M1left and M1right. In order for the cause-effects relationship to be studied, DCM is
implemented on the present fMRI data and will be discussed in detail in the
next section.
The results shown in Figure 3 (d) and (e) reveal another interesting
behavior of brain activation in this study. The activations were obtained by subtracting the effects of a unilateral tapping from the effects of bilateral
tapping, conjunct with the effects of the other unilateral tapping. The
resultant of this conjunction of contrasts is an accentuation of the same
particular area in the brain that involved in the tapping of the left or right hand fingers during both the unilateral and bilateral taping. An example of
the design matrix used for this conjunction of contrast is shown in Figure
8(b) from which the same area in the brain involved in controlling both the unilateral and bilateral tapping of right hand fingers can be made visible. As
can be seen in Figure 3(d) and (e), the intriguing question is why does the
activation in the right hemisphere is very much smaller than the activation in the left hemisphere. One logical basis that can potentially be the answer to
the question appears to be in the fact that all subjects are right hand
dominant. It is suggested that, for right handed individuals, the same larger
motor area is recruited to be involved in performing the unilateral as well as the bilateral tapping using the dominant hand as compared to the non
dominant hand from which the same smaller area is involved in both the
unilateral and bilateral tapping. However, a continuation of this study onto a group of left handed subjects is necessary in order for a more accurate
interpretation of the results obtained in the present study.
4.3 The dynamic causal model and the effective connectivity
In the second part of this study, we investigated the effective
connectivity between the two primary motor areas, primarily the M1left and
M1right, using the dynamic causal modeling (DCM). The justifications of these two regions being selected were because they are significantly
activated at corrected p value (Figure 3) and their well known involvement
in controlling the tapping of the right and left hand fingers (Grefkes et al. (2008); Walsh et al. (2008); Ahmad Nazlim Yusoff et al. (2010a, 2011)).
Ahmad Nazlim Yusoff & Khairiah Abdul Hamid
202 Malaysian Journal of Mathematical Sciences
DCM uses a fully Bayesian approach i.e. Bayesian model selection (BMS), in comparing the linear, bilinear and non-linear models shown in
Figure 1 and in selecting the most optimum model among the competing
models. BMS is fully statistic in approach and computes an approximation to the model evidence p(y|m), which is the probability of obtaining the data
y, given the model m (Stephan et al. (2009)). It quantifies the properties of a
good model by explaining the data as accurately as possible and has minimal
complexity. All the eight models were compared by optimising the probability of conditional density for each model, given its respective log-
evidence. In another words, BMS determines the model which provides the
best balance between fit/accuracy and complexity given the fMRI data.
The fact that bilinear models family has been chosen in BMS
analysis (see Figure 6) indicates that the probable cortical network during
bilateral tapping of hand fingers is neither falls into group of models with quite a simple and straight forward kind of network as suggested by Model 1
and 2, nor it is from a much more complicated group of models with non
linear connectivity between regions as represented by Model 5 to 8. The optimum model rather falls in between the two extremes with connectivity
among the two regions being influenced by experimental modulation.
The most optimal model among the eight competing models was
finally chosen. The results obtained from BMS for both group RFX and FFX
analyses are in good agreement for Model 4, see Table 3. The lowest value
of the sum of negative free energy (ΣF) in both the FFX and RFX perspectives indicates that the best balance between accuracy and
complexity has been met by Model 4. Thermodynamically, the free energy
(F) is the difference between the energy of a system (E) and its entropy (S) (Friston (2010)), or
.F E S= − (7)
Analogously, in brain network modeling, E is simply the log-
evidence or log ( )p y m of a model. In Friston (2010) it is defined as the
surprise (or self information) about the joint occurrence of sensory input and
its causes (or unknown parameters, ϑ). According to Stephan et al. (2009), S can be represented by Kullback-Leibler (KL) divergence between the
approximating posterior density of the unknown parameters, q(ϑ) and the
true posterior distribution, p(ϑ|y,m). Equation (7) can thus be written as
Modelling activation and connectivity in the brain:
An fMRI study during externally triggered finger tapping task
Malaysian Journal of Mathematical Sciences 203
F = log p(y|m) - KL[q(ϑ),p(ϑ|y,m)] (8)
or
F = ⟨log p(y|ϑ,m)⟩q - KL[q(ϑ),p(ϑ|m)] (9) if approximation is made onto the conditional density of Equation (8).
In Equation (9), accuracy is the first term on the right side of the
equation which explains the probability of obtaining observed data y given a
particular model m with parameters ϑ, while complexity is reflected in the second term which contains the amount of information that can be obtained
from the data with regards to the parameters of a model, see Stephan et al.
(2009). The smallest difference between accuracy and complexity exhibited by Model 4 has the meaning that F is minimised in such a way that the
model parameters has been fitted well, from which the fitted data behave as
close as possible to the observed experimental data despite the complexity of
the model.
The Dirichlet parameter estimates, αd, the expected posterior
probability, r and the exceedance probability, ψ depicted in Table 3 are all the parameters used in BMS analyses to rank models at group RFX level.
The Dirichlet parameter estimates is a measure of effective number of
subjects in which a given model generated the observed data. The sum of all
αd is equal to the number of subjects plus the number of compared models
which is 13 in this study. With αd = 5.0640 ≈ 5 for Model 4, it can be said that the model has been agreed upon by all the five subjects. The exceedance
probability ψ is the probability that a given model is more likely than any
other model to give the observed experimental data. If ψ obtained for Model 4 from 8 models is 0.92 (or 92%), we can be 92% sure that the favoured model has a greater posterior probability (r = 0.67) than any other tested
models. As can be seen in Table 3(a), the sum of ψ for all models is unity. The histograms in Figure 6(b) graphically indicate the expected posterior
probability and the exceedance probability for all models. Both two
quantities for Model 4 are comparatively higher than any other models.
From Table 3(a), it can be concluded that all the values of ,dα ψ and r agree
very well that the bilateral tapping is best represented by Model 4.
Furthermore, these model has also shown firm evidence in FFX perspective
with a high posterior model probability ( 1.0000)ϕ = in getting the respective
log-evidence (or likelihood = 4.77 × 1039
), see Table 3(b) and Figure 6 (top).
Ahmad Nazlim Yusoff & Khairiah Abdul Hamid
204 Malaysian Journal of Mathematical Sciences
In view of the model structure used in this study that is assumed to be identical across subjects (Stephan et al. (2010)), the results obtained from
RFX for BMS is more reliable. More importantly, the results obtained from
group BMS studies whether in RFX or FFX perspectives, have been reported (Stephan et al. (2010)) to be able to take into consideration the
presence of outliers that could have arisen in any subject under study.
This study has been able to fit the effective connectivity between M1left and M1right with a bilinear model, see Figure 7. Thus, the null
hypothesis that no single model is better than any other model is rejected.
The effective connectivity is a dynamic quantity. It defines the influence within a physical system, i.e. the brain at cortical level, in response to the
external manipulations or inputs. The effective connectivity between M1left
and M1right shown in Figure 7 is driven by a stimulus-bound perturbation
input (U1). The source of these input is the coordination and control of bilateral tapping of hand fingers by the primary motor region, denoted by
(B) in the figure. Included in the model as U1 as well is the underlying
exclusive and respective control of the left and right hand finger tapping that is thought to come into play, intrinsically, during the bilateral tapping, and
are denoted by (L) or (R). Thus, it can be said that, the effective connectivity
between M1left and M1right that took place during bilateral tapping is bidirectional in nature and is caused by unilateral and bilateral control of
hand fingers by the subjects. Nevertheless, the effective connectivity
between the two regions was found to be not only initiated by the direct
input but was also influenced by modulatory input (U2), originating from the attentional movement in order for the tapping to be performed
simultaneously and in-phase between the left and right hand fingers. This
attentional movement is also assigned to the exclusive and respective control of the left and right hand finger tapping. In addition, the stimulus-bound
peturbation input modulates the self connectivity in each region to impose
saturation-like effects (Friston et al. (2003)). The effective connectivity between M1left and M1right however, is not gated (influenced) by any of the
two M1s, ruling out the possibility of non-linear behavior of connections
between M1left and M1right as indicated by Model 5 - Model 8 in Figure 1.
The DCM parameter values shown in Figure 7 are obtained from
Bayesian parameter averaging (BPA) computation from which the values
are shown in Table 4 together with the values for individual subject and the definition for various DCM parameters. The effective connectivity from
M1left to M1right was found to be larger than from M1left to M1right indicating a
higher transfer rate of signal from the left to right hemisphere as compared
to the contra direction during bilateral tapping. Despite the fact that bilateral

Modelling activation and connectivity in the brain:
An fMRI study during externally triggered finger tapping task
Malaysian Journal of Mathematical Sciences 205
tapping induced equal change in signal intensity and spatial extent of
activation in M1left and M1right as stated in an earlier discussion, the two quantities can be understood as the result of the underlying network
mechanism that has occurred. For a right handed subject performing
bilateral hand movement, the dominant hemisphere is the left hemisphere.
According to Serrien et al. (2003) and Walsh et al. (2008), an increase in the interaction between motor cortices from the two hemispheres is observed
during bilateral hand movement from which the dominant hemisphere will
drive the non dominant side causing the effective connectivity to be higher from left hemisphere to right hemisphere as compared to the connectivity in
the opposite direction.
It is also evident from Figure 7 and Table 4 that the strength of the
driving inputs that drive the activity and modulate the self connection in
both the M1left and M1right regions are about the same. As mentioned earlier,
in performing the bilateral tapping, the subjects will have to coordinate their fingers so that the tapping of both hands will be in-phase and according to
the external trigger. These two similar objectives that need to be fulfilled by
the subjects will certainly induce similar driving input into the M1left and M1right regions which in turn equally modulate self connection in M1left and
M1right.
As discussed above, the effective connectivity between M1left and
M1right is influenced by the modulatory input, U2. A stronger modulatory
input is needed to modulate the effective connectivity of a higher strength as indicated in Figure 7. The negative values of the effects of modulatory input
on M1left→M1right and M1right→M1left connections were due to the fact that
modulation on the connection reduces the influence that one region has on another.
4.4 The dynamic causal model for bilateral finger tapping:
a mathematical formulation
Finally, given an optimum causal model that would be able to
explain the network mechanism in the brain during bilateral tapping of hand
fingers, it is also very important to mathematically understand the exact mechanism within any one brain region used to construct the network and
how the activity within one brain region is influenced by experimental
manipulations. To achieve this, a minor modification is made onto the dynamic causal model shown in Figure 7 and is given in Figure 9.
Ahmad Nazlim Yusoff & Khairiah Abdul Hamid
206 Malaysian Journal of Mathematical Sciences
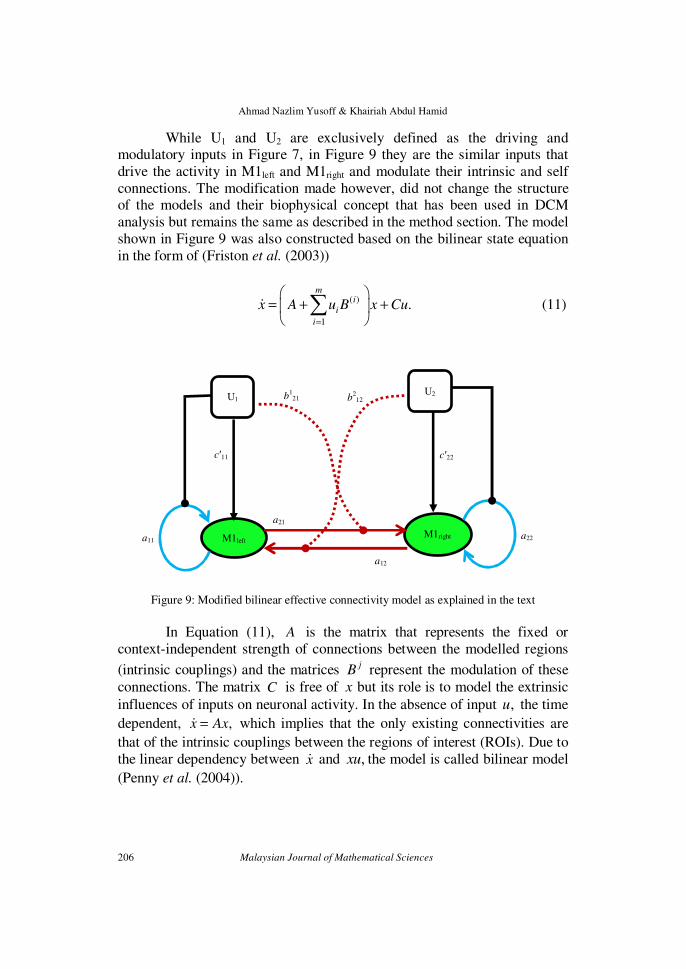
While U1 and U2 are exclusively defined as the driving and modulatory inputs in Figure 7, in Figure 9 they are the similar inputs that
drive the activity in M1left and M1right and modulate their intrinsic and self
connections. The modification made however, did not change the structure of the models and their biophysical concept that has been used in DCM
analysis but remains the same as described in the method section. The model
shown in Figure 9 was also constructed based on the bilinear state equation
in the form of (Friston et al. (2003))
( )
1
.m
i
i
i
x A u B x Cu=
= + +
∑ɺ (11)
Figure 9: Modified bilinear effective connectivity model as explained in the text
In Equation (11), A is the matrix that represents the fixed or
context-independent strength of connections between the modelled regions
(intrinsic couplings) and the matrices jB represent the modulation of these
connections. The matrix C is free of x but its role is to model the extrinsic
influences of inputs on neuronal activity. In the absence of input ,u the time
dependent, ,x Ax=ɺ which implies that the only existing connectivities are
that of the intrinsic couplings between the regions of interest (ROIs). Due to
the linear dependency between xɺ and ,xu the model is called bilinear model
(Penny et al. (2004)).
c′11 c′22
a11 a22
a21
b212 b
121
M1left M1right
U2
U1
a12
Modelling activation and connectivity in the brain:
An fMRI study during externally triggered finger tapping task
Malaysian Journal of Mathematical Sciences 207
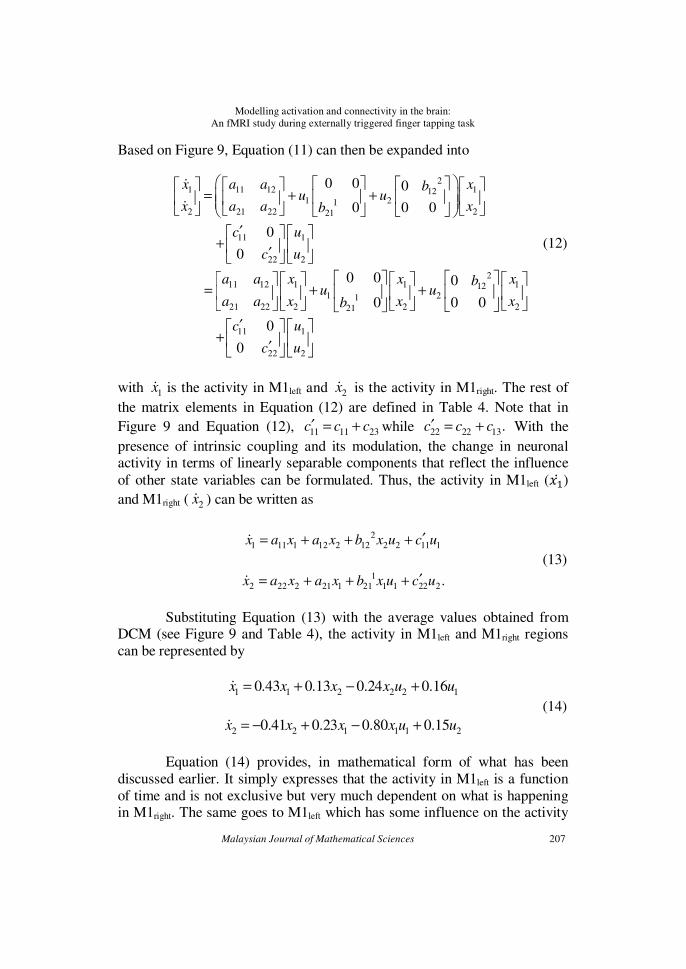
Based on Figure 9, Equation (11) can then be expanded into
21 11 12 112
1 212 21 22 221
0 0 0
0 0 0
x a a xbu u
x a a xb
= + +
ɺ
ɺ
11 1
22 2
0
0
c u
c u
′ + ′
(12)
211 12 1 1 112
1 2121 22 2 2 221
0 0 0
0 0 0
a a x x xbu u
a a x x xb
= + +
11 1
22 2
0
0
c u
c u
′ + ′
with 1xɺ is the activity in M1left and 2xɺ is the activity in M1right. The rest of
the matrix elements in Equation (12) are defined in Table 4. Note that in
Figure 9 and Equation (12), 11 11 23c c c′ = + while 22 22 13.c c c′ = + With the
presence of intrinsic coupling and its modulation, the change in neuronal activity in terms of linearly separable components that reflect the influence
of other state variables can be formulated. Thus, the activity in M1left (��� )
and M1right ( 2xɺ ) can be written as
2
1 11 1 12 2 12 2 2 11 1x a x a x b x u c u′= + + +ɺ
(13) 1
2 22 2 21 1 21 1 1 22 2.x a x a x b x u c u′= + + +ɺ
Substituting Equation (13) with the average values obtained from
DCM (see Figure 9 and Table 4), the activity in M1left and M1right regions
can be represented by
1 1 2 2 2 10.43 0.13 0.24 0.16x x x x u u= + − +ɺ
(14)
2 2 1 1 1 20.41 0.23 0.80 0.15x x x x u u= − + − +ɺ
Equation (14) provides, in mathematical form of what has been
discussed earlier. It simply expresses that the activity in M1left is a function
of time and is not exclusive but very much dependent on what is happening in M1right. The same goes to M1left which has some influence on the activity

Ahmad Nazlim Yusoff & Khairiah Abdul Hamid
208 Malaysian Journal of Mathematical Sciences
in M1right. The two regions are driven by the stimulus-bound perturbation input and from there on executed connectivity that are influenced by the
modulatory input. The modulation on connection has an effect of reducing
the influence one region has on another, rendering the values negative. The driving input also has some influence on modulating the self connection in
each particular region.
5. CONCLUSION
In conclusion, this study has been able to fit the observed fMRI data acquired from bilateral tapping of hand fingers performed by right handed
subjects to a general linear model for brain activation and to a bilinear
dynamic causal model for the effective connectivity between M1left and
M1right regions. The findings obtained from the analysis of brain activation correlated well with that of effective connectivity from which it has been
determined that the dominant hemisphere which is the left hemisphere has
some influence in promoting the activation in the non dominant hemisphere during bilateral finger tapping. The effective connectivities between M1left
and M1right were not only driven by the coordination and control of bilateral
tapping of hand fingers by the primary motor region but were also
influenced by the attentional movement of fingers in both hands in order for the tapping to be performed simultaneously, in-phase and following the
external trigger. Thus, the null hypothesis that no single model is better than
any other model is rejected. This study has revealed important fundamental information for future fMRI studies on motor coordination and is viable to
be implemented in clinical environment. However, due to the different
approaches used in the study of hand finger movement employing various tasks and methods, we found that it is quite difficult for a direct comparison
with the results obtained from other studies to be made.
ACKNOWLEDGEMENT
The authors would like to thank Sa’don Samian, the MRI
Technologist of the Universiti Kebangsaan Malaysia Hospital (HUKM), for the assistance in the scanning and the Department of Radiology, Universiti
Kebangsaan Malaysia Hospital for the permission to use the MRI scanner.
The authors were also indebted to Dr. Stephan Kiebel and Dr. Carsten Müller from Max Planck Institute for Human Cognitive and Brain Sciences,
Leipzig, Germany, for valuable discussions on experimental methods and
data analyses. The Discussion part of this article was written at the Max

Modelling activation and connectivity in the brain:
An fMRI study during externally triggered finger tapping task
Malaysian Journal of Mathematical Sciences 209
Planck Institute during a research attachment. This work was supported by
the research grants IRPA 09-02-02-0119EA296 and eScience Fund 06-01-02-SF0548, the Ministry of Science, Technology and Innovation of
Malaysia.
REFERENCES
Ahmad Nazlim Yusoff, Aini Ismafairus Abd Hamid, Khairiah Abdul
Hamid, Wan Ahmad Kamil Wan Abdullah, Mazlyfarina Mohamad.
2011. Functional specialization and effective connectivity during self-paced unimanual and bimanual tapping of hand fingers: An
extended analysis using dynamic causal modeling and Bayesian
model selection for group studies. Malaysian Medical and Health
Science Journal. 7(2): 17 - 36.
Ahmad Nazlim Yusoff, Mazlyfarina Mohamad, Aini Ismafairus Abd Hamid, Wan Ahmad Kamil Wan Abdullah, Mohd Harith Hashim and
Nurul Zafirah Zulkifli. 2010a. Functional specialization and effective
connectivity in cerebral motor cortices: An fMRI study on seven right handed female subjects. Malaysian Journal of Medicine and Health
Sciences. 6(2): 71 - 92.
Ahmad Nazlim Yusoff, Mazlyfarina Mohamad, Khairiah Abdul Hamid,
Aini Ismafairus Abd Hamid, Hanani Abdul Manan and Mohd Harith
Hashim. 2010b. Intrinsic couplings between the primary motor area (M1) and supplementary motor area (SMA) during unilateral finger
tapping task. Akademi Sains Malaysia Journal of Science. 4(2): 158 -
172.
Ahmad Nazlim Yusoff, Mazlyfarina Mohamad, Khairiah Abdul Hamid, Aini Ismafairus Abd Hamid, Hanani Abdul Manan and Mohd Harith
Hashim. 2010c. Activation characteristics of the primary motor (M1)
and supplementary motor (SMA) areas during robust unilateral finger
tapping task. Malaysian Journal of Health Sciences. 8(2): 43 - 49.
Aini Ismafairus Abd Hamid, Ahmad Nazlim Yusoff, Siti Zamratol-Mai Sarah Mukari, Khairiah Abdul Hamid, Mazlyfarina Mohamad and
Hanani Abdul Manan. 2011. Brain activation during addition and
subtraction task in noise and in quiet. Malaysian Journal of Medical
Sciences. 18(3): 3 - 15.
Ahmad Nazlim Yusoff & Khairiah Abdul Hamid
210 Malaysian Journal of Mathematical Sciences
Büchel, C. and Friston, K. 2000. Assesing interactions among neuronal systems using functional neuroimaging. Neural Networks. 13: 871 -
882.
Eickhoff, S. B., Stephan, K. E., Mohlberg, H., Grefkes, C., Fink, G. R.,
Amunts, K. and Zilles, K. 2005. A new SPM toolbox for combining
probabilistic cytoarchitectonic maps and functional imaging data.
Neuroimage. 25: 1325 - 1335.
Friston, K. J. 2005. Models of brain function in neuroimaging. Annual
Review in Psychology. 56: 57 - 87.
Friston, K. J. 2010. The free energy principle: a rough guide to the brain?
Trends in Cognitive Sciences. 13(7): 293 - 301.
Friston, K. J., Harrison, L. and Penny, W. 2003. Dynamic causal modeling.
Neuroimage. 19: 1273 - 1302.
Friston, K. J., Holmes, A. Poline, J. B., Price, C. J. and Frith, C. D. 1996.
Detecting activations in PET and fMRI: Levels of inference and
power. Neuroimage. 40: 223 - 235.
Gelman, A., Carlin, J. B., Stern, H. S. and Rubin, D. B. 2004. Bayesian
Data Analysis, 2nd Ed. Boca Raton: Chapman and Hall/CRC.
Grefkes, C., Eickhoff, S. B., Nowak, D. A., Dafotakis, M. and Fink, G. R.
2008. Dynamic intra- and interhemispheric interactions during
unilateral and bilateral hand movements assessed with fMRI and DCM. Neuroimage. 41: 1382 - 1394.
Jäncke, L., Peters, M., Schlaug, G., Posse, S., Steinmetz, H. and Müller-Gärtner, H. W. 1998. Differential magnetic resonance signal change
in human sensori motor cortex to finger movements of different rate
of the dominant and subdominant hand. Cognitive Brain Research. 6:
279 - 284.
Kiebel, S. and Holmes, A. 2004. The general linear model. In Frackowiak,
R.S.J., Friston, K. J., Price, C. J., Zeki, S., Ashburner, J. and Penny, W. D. (eds.) Human brain function, pp. 725 - 760. Elsevier Academic
Press, Amsterdam.
Modelling activation and connectivity in the brain:
An fMRI study during externally triggered finger tapping task
Malaysian Journal of Mathematical Sciences 211
Kuhtz-Buschbeck, J. P., Gilster, R., Wolff, S., Ulmer, S., Siebner, H. and
Jansen, O. 2008. Brain activity is similar during precision and power gripping with light force: An fMRI study. Neuroimage. 40: 1469 -
1481.
Lutz, K., Koeneke, S., Wüstenberg, T. and Jäncke, L. 2005. Asymmetry of cortical activation during maximum and convenient tapping speed.
Neuroscience Letter. 373: 61 - 66.
Nolte, J. 2009. The human brain: An introduction to its functional anatomy
6th Ed. Philadelphia: Mosby Elsevier.
Oldfield, R.C. 1971. The assessment and analysis of handedness: The
Edinburgh Inventory. Neuropsychologia. 9: 97 - 113.
Penny, W. D., Stephan, K. E., Mechelli, A. and Friston, K. J. 2004. Comparing dynamic causal models. Neuroimage. 22: 1157 - 1172.
Poline, J. B., Kherif, F., and Penny, W. D. 2004. Contrast and classical inference. In Frackowiak, R.S.J., Friston, K. J., Price, C. J., Zeki, S.,
Ashburner, J. & Penny, W. D. (eds.) Human brain function, pp. 761 -
779. Elsvier Academic Press, Amsterdam.
Serrien, D. J., Cassidy, M. J. and Brown, P. 2003. The importance of the
dominant hemisphere in the organisation of bimanual movements.
Human Brain Mapping. 18(4): 296 - 305.
Stephan, K. E., Kasper, L., Harrison, L. M., Daunizeau, J., den Ouden, H.
E. M., Breakspear, M. and Friston, K. J. 2008. Nonlinear dynamic causal models for fMRI. Neuroimage. 42: 649 - 662.
Stephan, K. E., Penny, W. D., Daunizeau, J., Moran, R. J. and Friston, K. J.
2009. Bayesian model selection for group studies. Neuroimage. 46: 1004 - 1017.
Stephan, K. E., Penny, W. D., Moran R. J., den Ouden, H. E. M., Daunizeau, J. and Friston, K. J. 2010. Ten simple rules for dynamic
causal modeling. Neuroimage. 49: 3099 - 3109.
Ahmad Nazlim Yusoff & Khairiah Abdul Hamid
212 Malaysian Journal of Mathematical Sciences
Thickbroom, G. W., Phillips, B. A., Morris, I., Byrnes, M. L. and Mastaglia, F. L. 1998. Isometric force-related activity in sensorimotor cortex
measured with functional MRI. Experimental Brain Research. 121:
59 - 64.
Walsh, R. R., Small, S. L., Chen, E. E. and Solodkin, A. 2008. Network
acivation during bimanual movements in humans. Neuroimage. 43:
540 - 553.
Ward, N. S. and Frackowiak, R. S. 2003. Age-related changes in the neural
correlates of motor performance. Brain. 126: 873 - 888.


![Untitled-1 [img.staticmb.com] · 22 SQ.KM. ACTIVATION AREA DHOLERA INTERNATIONAL AIRPORT METRO CONNECTIVITY Port City of Dholera SIR will be developed 6 times bigger city then China's](https://img.pdfslide.us/doc/110x75/5e6e5695d481404e662a7295/untitled-1-img-22-sqkm-activation-area-dholera-international-airport-metro.jpg)


![Inflight Broadband Connectivity Using Cellular Networks · leverages multiple BS (a.k.a eNodeB in LTE terminology) activation as a mean to increase network capacity [3]. As such,](https://img.pdfslide.us/doc/110x75/6113f4b186e6e226295f34fb/inflight-broadband-connectivity-using-cellular-leverages-multiple-bs-aka-enodeb.jpg)