Embed Size (px)
Citation preview
Modeling of Coastal Inundation, Storm Surge, and Relative Sea-Level Rise at Naval Station Norfolk, Norfolk, Virginia, U.S.A.
Honghai Li†, Lihwa Lin†, and Kelly A. Burks-Copes‡
†U.S. Army Engineer Research & Development CenterCoastal and Hydraulics Laboratory3909 Halls Ferry RoadVicksburg, MS 39180-6199, [email protected]
‡U.S. Army Engineer Research & Development CenterEnvironmental Laboratory3909 Halls Ferry RoadVicksburg, MS 39180-6199, U.S.A.
ABSTRACT
Li, H.; Lin, L., and Burks-Copes, K.A., 2013. Modeling of coastal inundation, storm surge, and relative sea-level rise atNaval Station Norfolk, Norfolk, Virginia, U.S.A. Journal of Coastal Research, 29(1), 18–30. Coconut Creek (Florida),ISSN 0749-0208.
The potential risk and effects of storm-surge damage caused by the combination of hurricane-force waves, tides, andrelative sea-level-rise (RSLR) scenarios were examined at the U.S. Naval Station, Norfolk, Virginia. A hydrodynamic andsediment transport modeling system validated with measured water levels from Hurricane Isabel was used to simulatetwo synthesized storms representing 50-year and 100-year return-period hurricanes, a northeaster, and five futureRSLR scenarios to evaluate the combined impacts of inundation on this military installation in the lower ChesapeakeBay. The naval base topography and nearshore water body of Hampton Roads were included in the coastal modelingsystem (CMS), a suite of surge, circulation, wave, sediment transport, and morphology evolution models. The modelingdomain was a rectangular area covering the entire Naval Station Norfolk in the Hampton Roads and the mouths of theJames and Elizabeth rivers. A variable-resolution grid system was created with a finer resolution of 10 m in the navalbase and a coarser resolution of 300 m in the regions away from the base. The boundary-forcing conditions to the CMSwere regional storm surge produced by the ADvanced CIRCulation (ADCIRC),and wave conditions by the SimulatingWAve Nearshore (SWAN) model. The CMS calculated the local water-surface elevation and storm-surge inundation forcombined RSLR, surge, waves, and wind. Results indicate that synthetic storms would cause extensive inundation ofcoastal land around the naval base. Approximately 60% of the land would be under water with the 100-year storm for thepresent sea level, and 80% for estimated RSLR of 2 m.
ADDITIONAL INDEX WORDS: Nearshore hydrodynamic modeling, waves, synthetic tropical storms, extratropicalstorms, Hurricane Isabel, land flooding.
INTRODUCTION
Global sea-level rise (SLR) ranging from 0.5 to 2 m has been
predicted over the next century, from 2000 to 2100 (IPCC, 2007;
Pfeffer, Harper, and O’Neel, 2008). Relative SLR (RSLR) can be
greater than the global trend because of local effects such as
subsidence. The combination of an increase in SLR and coastal
storms, including hurricanes (tropical storms) and winter
storms (extratropical storms), will increase the risk of storm-
surge inundation in exposed coastal regions. On average, 1.6
hurricanes per year in the last century have made landfall on
the U.S. coastline (Smith, 1999). For the East Coast of the
United States, Hirsch, DeGaetano, and Colucci (2001) devel-
oped a climatology of winter storms based on historical data
and estimated an average of 12 storms for each winter season.
Sea-level rise combined with strong storms will worsen beach
erosion, increase damage to coastal infrastructure, and cause
major shoreline change (McLean et al., 2001). It is essential to
quantify the risk associated with SLR and storm damage to
provide decision makers with relevant guidance regarding
existing and future coastal infrastructure development.
Military coastal installations and facilities support a range of
activities vital to national security and provide significant
benefits to the local economy. These facilities carry out diverse
tasks from outdoor training activities (ground, ports, harbors,
and navigation) to air combat. The Naval Station Norfolk, in
Norfolk, Virginia, was selected as a demonstration site for a
risk-assessment study to understand the effects of RSLR and
coastal storms on the physical installation as well as nearshore
physical processes. The coastal modeling system (CMS) was
applied to calculate the inundation and navigation channel
shoaling for various future RSLR scenarios. Herein, we
describe the implications of potential RSLR estimates and
storm surges on total inundation; a subsequent paper will
discuss results relating to sediment transport and navigation
channel shoaling.
METHODOLOGY
The CMS is an integrated suite of numerical models for
simulating water-surface elevation, current, waves, sediment
DOI: 10.2112/JCOASTRES-D-12-00056.1 received 17 March 2012;accepted in revision 17 June 2012.Published Pre-print online 17 September 2012.� Coastal Education & Research Foundation 2013
Coconut Creek, Florida January 2013Journal of Coastal Research 29 1 18–30
Report Documentation Page Form ApprovedOMB No. 0704-0188
Public reporting burden for the collection of information is estimated to average 1 hour per response, including the time for reviewing instructions, searching existing data sources, gathering andmaintaining the data needed, and completing and reviewing the collection of information. Send comments regarding this burden estimate or any other aspect of this collection of information,including suggestions for reducing this burden, to Washington Headquarters Services, Directorate for Information Operations and Reports, 1215 Jefferson Davis Highway, Suite 1204, ArlingtonVA 22202-4302. Respondents should be aware that notwithstanding any other provision of law, no person shall be subject to a penalty for failing to comply with a collection of information if itdoes not display a currently valid OMB control number.
1. REPORT DATE JAN 2013
2. REPORT TYPE N/A
3. DATES COVERED -
4. TITLE AND SUBTITLE Modeling of Coastal Inundation, Storm Surge, and Relative Sea-LevelRise at Naval Station Norfolk, Norfolk, Virginia, USA
5a. CONTRACT NUMBER
5b. GRANT NUMBER
5c. PROGRAM ELEMENT NUMBER
6. AUTHOR(S) Li, Honghai; Lin, Lihwa; Burks-Copes, Kelly A.
5d. PROJECT NUMBER
5e. TASK NUMBER
5f. WORK UNIT NUMBER
7. PERFORMING ORGANIZATION NAME(S) AND ADDRESS(ES) US Army Engineer Research and Development Center, Coastal andHydraulics Laboratory, Vicksburg, MS; US Army Engineer Researchand Development Center, Environmental Laboratory, Vicksburg, MS
8. PERFORMING ORGANIZATIONREPORT NUMBER
9. SPONSORING/MONITORING AGENCY NAME(S) AND ADDRESS(ES) 10. SPONSOR/MONITOR’S ACRONYM(S)
11. SPONSOR/MONITOR’S REPORT NUMBER(S)
12. DISTRIBUTION/AVAILABILITY STATEMENT Approved for public release, distribution unlimited
13. SUPPLEMENTARY NOTES The original document contains color images.
14. ABSTRACT The potential risk and effects of storm-surge damage caused by the combination of hurricane-force waves,tides, and relative sea-level-rise (RSLR) scenarios were examined at the U.S. Naval Station, Norfolk,Virginia. A hydrodynamic and sediment transport modeling system validated with measured water levelsfrom Hurricane Isabel was used to simulate two synthesized storms representing 50-year and 100-yearreturn-period hurricanes, a northeaster, and five future RSLR scenarios to evaluate the combined impactsof inundation on this military installation in the lower Chesapeake Bay. The naval base topography andnearshore water body of Hampton Roads were included in the coastal modeling system (CMS), a suite ofsurge, circulation, wave, sediment transport, and morphology evolution models. The modeling domain wasa rectangular area covering the entire Naval Station Norfolk in the Hampton Roads and the mouths of theJames and Elizabeth rivers. A variable-resolution grid system was created with a finer resolution of 10 min the naval base and a coarser resolution of 300 m in the regions away from the base. Theboundary-forcing conditions to the CMS were regional storm surge produced by the ADvancedCIRCulation (ADCIRC),and wave conditions by the Simulating WAve Nearshore (SWAN) model. TheCMS calculated the local water-surface elevation and storm-surge inundation for combined RSLR, surge,waves, and wind. Results indicate that synthetic storms would cause extensive inundation of coastal landaround the naval base. Approximately 60% of the land would be under water with the 100-year storm forthe present sea level, and 80% for estimated RSLR of 2 m.
15. SUBJECT TERMS

16. SECURITY CLASSIFICATION OF: 17. LIMITATION OF ABSTRACT
UU
18. NUMBEROF PAGES
13
19a. NAME OFRESPONSIBLE PERSON
a. REPORT unclassified
b. ABSTRACT unclassified
c. THIS PAGE unclassified
Standard Form 298 (Rev. 8-98) Prescribed by ANSI Std Z39-18
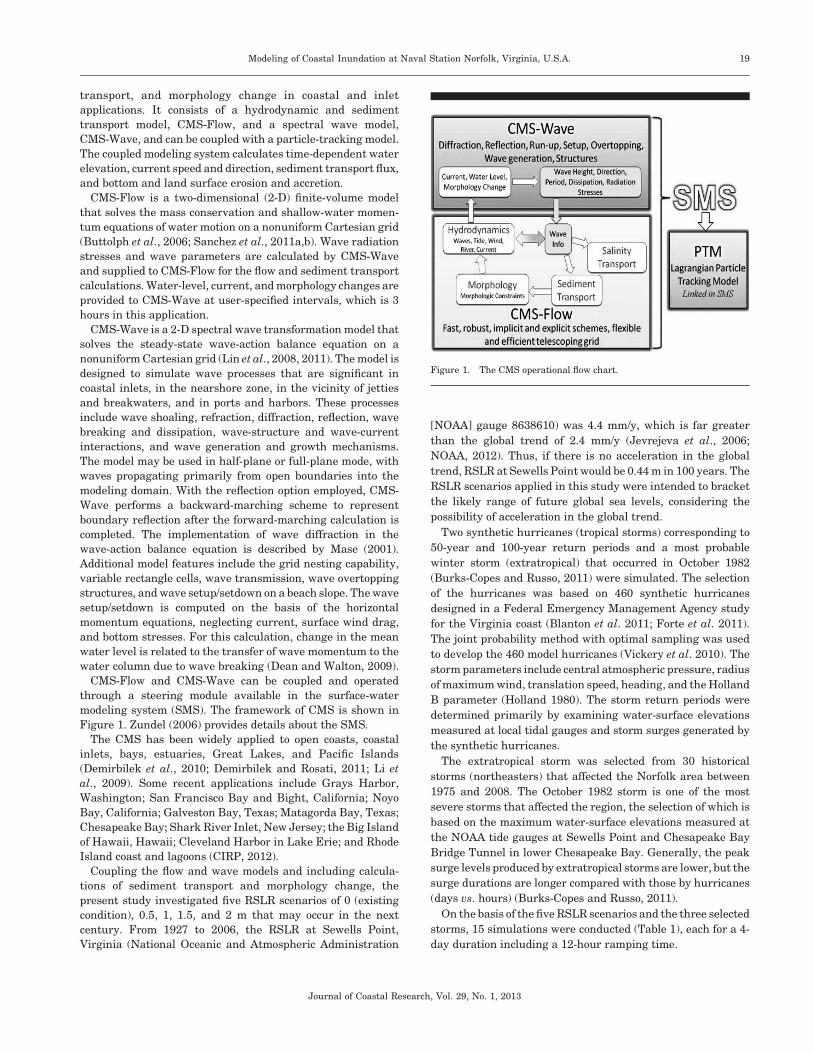
transport, and morphology change in coastal and inlet
applications. It consists of a hydrodynamic and sediment
transport model, CMS-Flow, and a spectral wave model,
CMS-Wave, and can be coupled with a particle-tracking model.
The coupled modeling system calculates time-dependent water
elevation, current speed and direction, sediment transport flux,
and bottom and land surface erosion and accretion.
CMS-Flow is a two-dimensional (2-D) finite-volume model
that solves the mass conservation and shallow-water momen-
tum equations of water motion on a nonuniform Cartesian grid
(Buttolph et al., 2006; Sanchez et al., 2011a,b). Wave radiation
stresses and wave parameters are calculated by CMS-Wave
and supplied to CMS-Flow for the flow and sediment transport
calculations. Water-level, current, and morphology changes are
provided to CMS-Wave at user-specified intervals, which is 3
hours in this application.
CMS-Wave is a 2-D spectral wave transformation model that
solves the steady-state wave-action balance equation on a
nonuniform Cartesian grid (Lin et al., 2008, 2011). The model is
designed to simulate wave processes that are significant in
coastal inlets, in the nearshore zone, in the vicinity of jetties
and breakwaters, and in ports and harbors. These processes
include wave shoaling, refraction, diffraction, reflection, wave
breaking and dissipation, wave-structure and wave-current
interactions, and wave generation and growth mechanisms.
The model may be used in half-plane or full-plane mode, with
waves propagating primarily from open boundaries into the
modeling domain. With the reflection option employed, CMS-
Wave performs a backward-marching scheme to represent
boundary reflection after the forward-marching calculation is
completed. The implementation of wave diffraction in the
wave-action balance equation is described by Mase (2001).
Additional model features include the grid nesting capability,
variable rectangle cells, wave transmission, wave overtopping
structures, and wave setup/setdown on a beach slope. The wave
setup/setdown is computed on the basis of the horizontal
momentum equations, neglecting current, surface wind drag,
and bottom stresses. For this calculation, change in the mean
water level is related to the transfer of wave momentum to the
water column due to wave breaking (Dean and Walton, 2009).
CMS-Flow and CMS-Wave can be coupled and operated
through a steering module available in the surface-water
modeling system (SMS). The framework of CMS is shown in
Figure 1. Zundel (2006) provides details about the SMS.
The CMS has been widely applied to open coasts, coastal
inlets, bays, estuaries, Great Lakes, and Pacific Islands
(Demirbilek et al., 2010; Demirbilek and Rosati, 2011; Li et
al., 2009). Some recent applications include Grays Harbor,
Washington; San Francisco Bay and Bight, California; Noyo
Bay, California; Galveston Bay, Texas; Matagorda Bay, Texas;
Chesapeake Bay; Shark River Inlet, New Jersey; the Big Island
of Hawaii, Hawaii; Cleveland Harbor in Lake Erie; and Rhode
Island coast and lagoons (CIRP, 2012).
Coupling the flow and wave models and including calcula-
tions of sediment transport and morphology change, the
present study investigated five RSLR scenarios of 0 (existing
condition), 0.5, 1, 1.5, and 2 m that may occur in the next
century. From 1927 to 2006, the RSLR at Sewells Point,
Virginia (National Oceanic and Atmospheric Administration
[NOAA] gauge 8638610) was 4.4 mm/y, which is far greater
than the global trend of 2.4 mm/y (Jevrejeva et al., 2006;
NOAA, 2012). Thus, if there is no acceleration in the global
trend, RSLR at Sewells Point would be 0.44 m in 100 years. The
RSLR scenarios applied in this study were intended to bracket
the likely range of future global sea levels, considering the
possibility of acceleration in the global trend.
Two synthetic hurricanes (tropical storms) corresponding to
50-year and 100-year return periods and a most probable
winter storm (extratropical) that occurred in October 1982
(Burks-Copes and Russo, 2011) were simulated. The selection
of the hurricanes was based on 460 synthetic hurricanes
designed in a Federal Emergency Management Agency study
for the Virginia coast (Blanton et al. 2011; Forte et al. 2011).
The joint probability method with optimal sampling was used
to develop the 460 model hurricanes (Vickery et al. 2010). The
storm parameters include central atmospheric pressure, radius
of maximum wind, translation speed, heading, and the Holland
B parameter (Holland 1980). The storm return periods were
determined primarily by examining water-surface elevations
measured at local tidal gauges and storm surges generated by
the synthetic hurricanes.
The extratropical storm was selected from 30 historical
storms (northeasters) that affected the Norfolk area between
1975 and 2008. The October 1982 storm is one of the most
severe storms that affected the region, the selection of which is
based on the maximum water-surface elevations measured at
the NOAA tide gauges at Sewells Point and Chesapeake Bay
Bridge Tunnel in lower Chesapeake Bay. Generally, the peak
surge levels produced by extratropical storms are lower, but the
surge durations are longer compared with those by hurricanes
(days vs. hours) (Burks-Copes and Russo, 2011).
On the basis of the five RSLR scenarios and the three selected
storms, 15 simulations were conducted (Table 1), each for a 4-
day duration including a 12-hour ramping time.
Figure 1. The CMS operational flow chart.
Journal of Coastal Research, Vol. 29, No. 1, 2013
Modeling of Coastal Inundation at Naval Station Norfolk, Virginia, U.S.A. 19
DATA
A collection of coastline information, topographic and
bathymetric data, and land surface features in the Hampton
Roads area was acquired to develop grids for the CMS
simulations. The coastline information in the lower Chesa-
peake Bay was available from the shoreline database of the
National Geophysical Data Center (2011). The aerial photo-
graphs were obtained from Google Earth Pro 5.1 (2011). The
light detection and ranging (LIDAR) Network (USACE Army
Geospatial Center, 2012) provided the land detail topography
for Naval Station Norfolk at 1-m resolution and was included in
the CMS to describe local land features, such as buildings,
roads, airport, and other major infrastructure. Topographic
and bathymetric information in other land and water areas was
provided with 10-m resolution from the coastal digital elevation
model of Virginia Beach (Taylor et al., 2008).
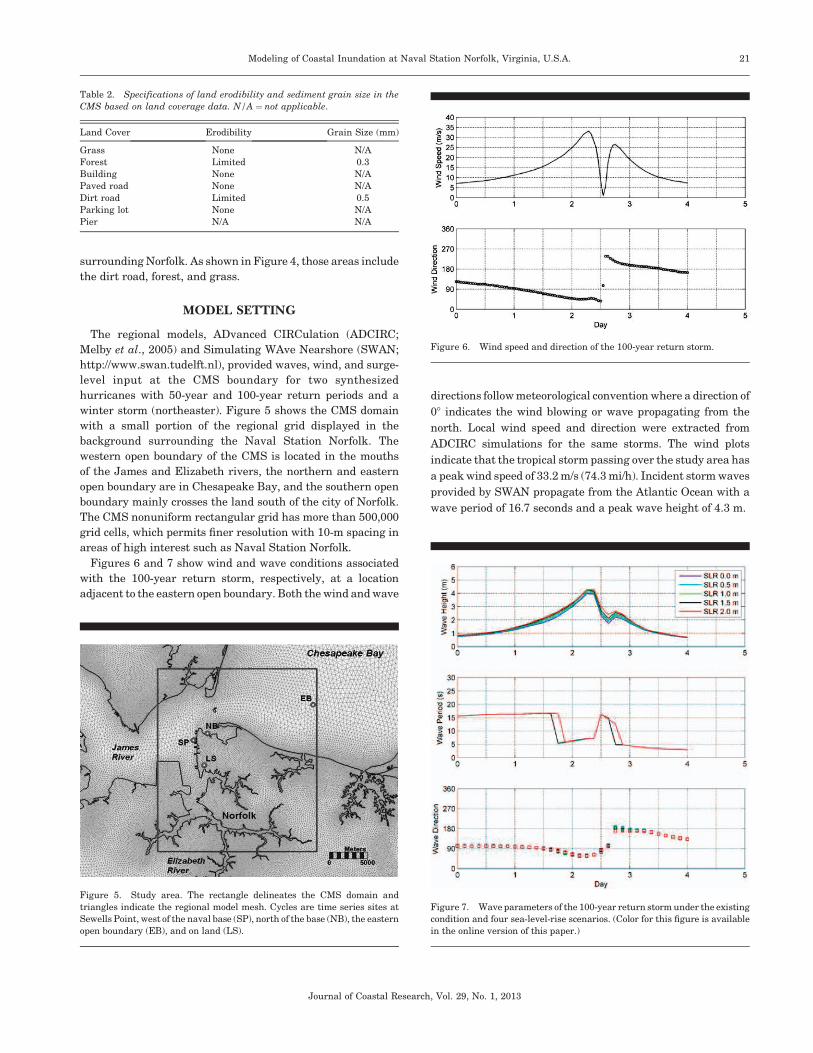
Figure 2 shows water depth and land surface elevations
relative to mean sea level (MSL), from the two data sets. The
figure displays the deep-draft Hampton Roads navigation
channel running across the northern portion of the domain,
the Norfolk Harbor entrance channel that runs north to south
located just west of the Naval Station, and a few small channels
to the military piers on the Naval Station waterfront. The data
range from the highest elevation of more than 30 m above MSL,
including building heights (negative values), to more than 30 m
below MSL in the navigation channel (positive values). The red
color in the lower left corner indicates the Craney Island
Dredged Material Management Area. The dikes built sur-
rounding the area have a height of about 12 m above MSL.
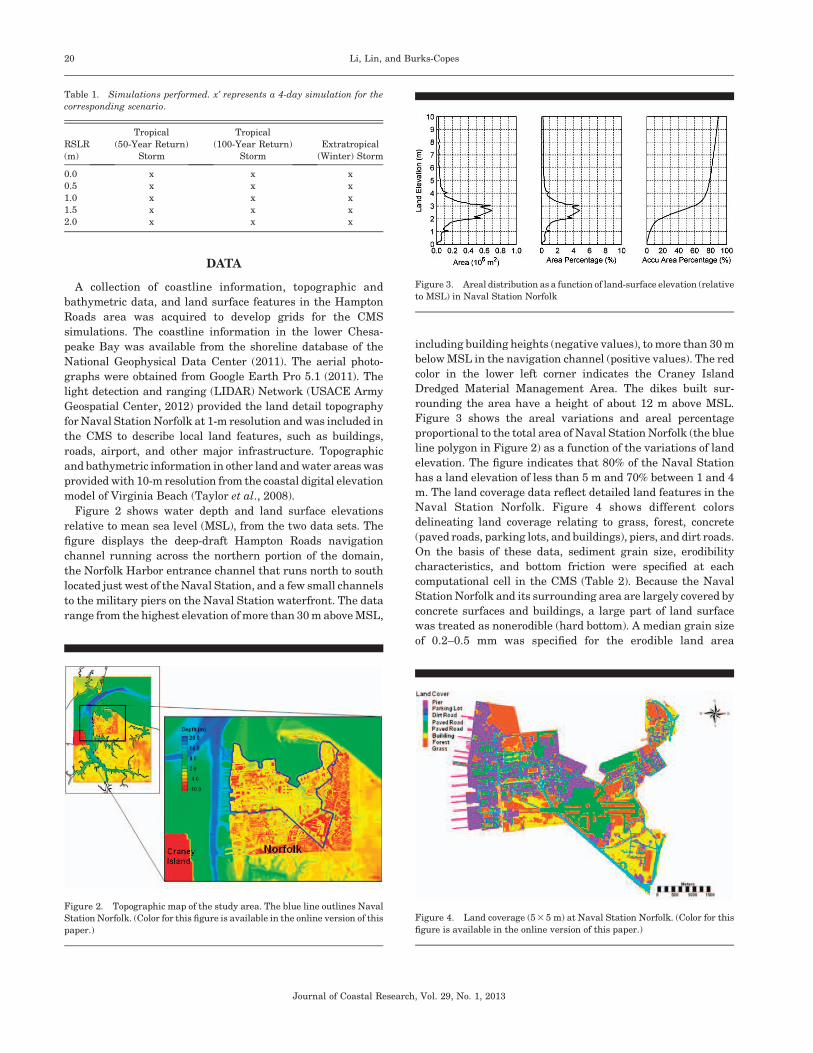
Figure 3 shows the areal variations and areal percentage
proportional to the total area of Naval Station Norfolk (the blue
line polygon in Figure 2) as a function of the variations of land
elevation. The figure indicates that 80% of the Naval Station
has a land elevation of less than 5 m and 70% between 1 and 4
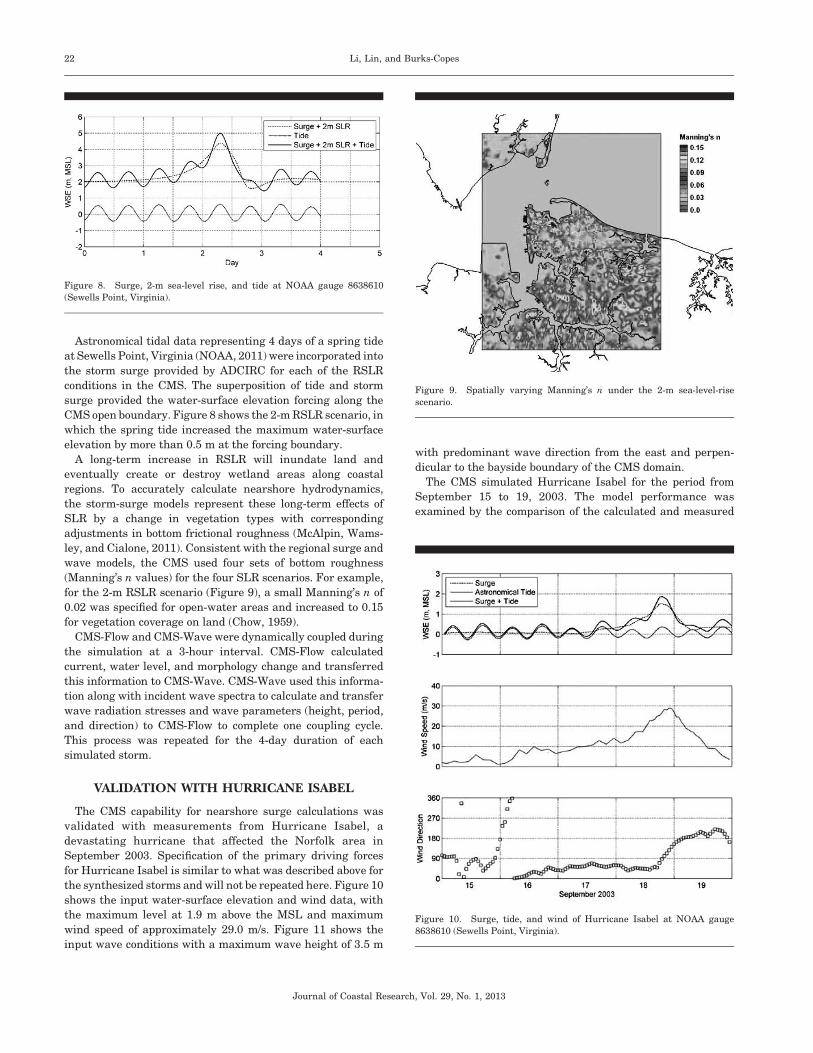
m. The land coverage data reflect detailed land features in the
Naval Station Norfolk. Figure 4 shows different colors
delineating land coverage relating to grass, forest, concrete
(paved roads, parking lots, and buildings), piers, and dirt roads.
On the basis of these data, sediment grain size, erodibility
characteristics, and bottom friction were specified at each
computational cell in the CMS (Table 2). Because the Naval
Station Norfolk and its surrounding area are largely covered by
concrete surfaces and buildings, a large part of land surface
was treated as nonerodible (hard bottom). A median grain size
of 0.2–0.5 mm was specified for the erodible land area
Table 1. Simulations performed. x’ represents a 4-day simulation for the
corresponding scenario.
RSLR
(m)
Tropical
(50-Year Return)
Storm
Tropical
(100-Year Return)
Storm
Extratropical
(Winter) Storm
0.0 x x x
0.5 x x x
1.0 x x x
1.5 x x x
2.0 x x x
Figure 2. Topographic map of the study area. The blue line outlines Naval
Station Norfolk. (Color for this figure is available in the online version of this
paper.)
Figure 3. Areal distribution as a function of land-surface elevation (relative
to MSL) in Naval Station Norfolk
Figure 4. Land coverage (53 5 m) at Naval Station Norfolk. (Color for this
figure is available in the online version of this paper.)
Journal of Coastal Research, Vol. 29, No. 1, 2013
20 Li, Lin, and Burks-Copes
surrounding Norfolk. As shown in Figure 4, those areas include
the dirt road, forest, and grass.
MODEL SETTING
The regional models, ADvanced CIRCulation (ADCIRC;
Melby et al., 2005) and Simulating WAve Nearshore (SWAN;
http://www.swan.tudelft.nl), provided waves, wind, and surge-
level input at the CMS boundary for two synthesized
hurricanes with 50-year and 100-year return periods and a
winter storm (northeaster). Figure 5 shows the CMS domain
with a small portion of the regional grid displayed in the
background surrounding the Naval Station Norfolk. The
western open boundary of the CMS is located in the mouths
of the James and Elizabeth rivers, the northern and eastern
open boundary are in Chesapeake Bay, and the southern open
boundary mainly crosses the land south of the city of Norfolk.
The CMS nonuniform rectangular grid has more than 500,000
grid cells, which permits finer resolution with 10-m spacing in
areas of high interest such as Naval Station Norfolk.
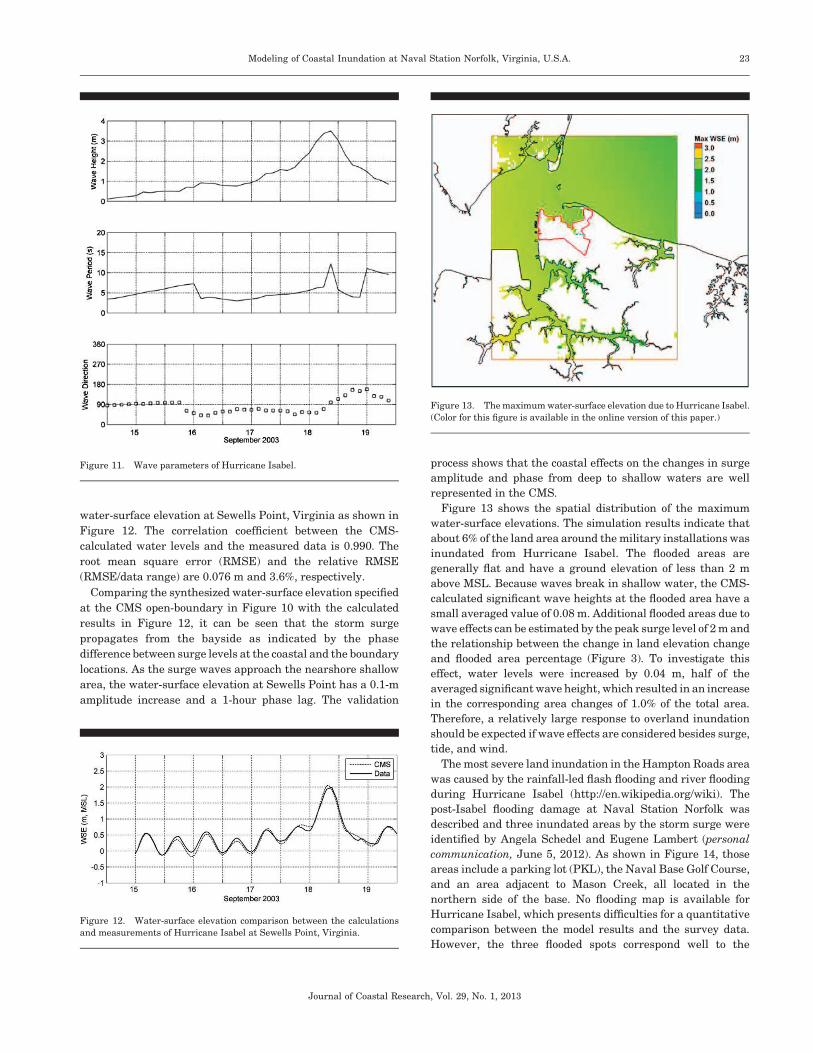
Figures 6 and 7 show wind and wave conditions associated
with the 100-year return storm, respectively, at a location
adjacent to the eastern open boundary. Both the wind and wave
directions follow meteorological convention where a direction of
08 indicates the wind blowing or wave propagating from the
north. Local wind speed and direction were extracted from
ADCIRC simulations for the same storms. The wind plots
indicate that the tropical storm passing over the study area has
a peak wind speed of 33.2 m/s (74.3 mi/h). Incident storm waves
provided by SWAN propagate from the Atlantic Ocean with a
wave period of 16.7 seconds and a peak wave height of 4.3 m.
Table 2. Specifications of land erodibility and sediment grain size in the
CMS based on land coverage data. N/A ¼ not applicable.
Land Cover Erodibility Grain Size (mm)
Grass None N/A
Forest Limited 0.3
Building None N/A
Paved road None N/A
Dirt road Limited 0.5
Parking lot None N/A
Pier N/A N/A
Figure 5. Study area. The rectangle delineates the CMS domain and
triangles indicate the regional model mesh. Cycles are time series sites at
Sewells Point, west of the naval base (SP), north of the base (NB), the eastern
open boundary (EB), and on land (LS).
Figure 6. Wind speed and direction of the 100-year return storm.
Figure 7. Wave parameters of the 100-year return storm under the existing
condition and four sea-level-rise scenarios. (Color for this figure is available
in the online version of this paper.)
Journal of Coastal Research, Vol. 29, No. 1, 2013
Modeling of Coastal Inundation at Naval Station Norfolk, Virginia, U.S.A. 21
Astronomical tidal data representing 4 days of a spring tide
at Sewells Point, Virginia (NOAA, 2011) were incorporated into
the storm surge provided by ADCIRC for each of the RSLR
conditions in the CMS. The superposition of tide and storm
surge provided the water-surface elevation forcing along the
CMS open boundary. Figure 8 shows the 2-m RSLR scenario, in
which the spring tide increased the maximum water-surface
elevation by more than 0.5 m at the forcing boundary.
A long-term increase in RSLR will inundate land and
eventually create or destroy wetland areas along coastal
regions. To accurately calculate nearshore hydrodynamics,
the storm-surge models represent these long-term effects of
SLR by a change in vegetation types with corresponding
adjustments in bottom frictional roughness (McAlpin, Wams-
ley, and Cialone, 2011). Consistent with the regional surge and
wave models, the CMS used four sets of bottom roughness
(Manning’s n values) for the four SLR scenarios. For example,
for the 2-m RSLR scenario (Figure 9), a small Manning’s n of
0.02 was specified for open-water areas and increased to 0.15
for vegetation coverage on land (Chow, 1959).
CMS-Flow and CMS-Wave were dynamically coupled during
the simulation at a 3-hour interval. CMS-Flow calculated
current, water level, and morphology change and transferred
this information to CMS-Wave. CMS-Wave used this informa-
tion along with incident wave spectra to calculate and transfer
wave radiation stresses and wave parameters (height, period,
and direction) to CMS-Flow to complete one coupling cycle.
This process was repeated for the 4-day duration of each
simulated storm.
VALIDATION WITH HURRICANE ISABEL
The CMS capability for nearshore surge calculations was
validated with measurements from Hurricane Isabel, a
devastating hurricane that affected the Norfolk area in
September 2003. Specification of the primary driving forces
for Hurricane Isabel is similar to what was described above for
the synthesized storms and will not be repeated here. Figure 10
shows the input water-surface elevation and wind data, with
the maximum level at 1.9 m above the MSL and maximum
wind speed of approximately 29.0 m/s. Figure 11 shows the
input wave conditions with a maximum wave height of 3.5 m
with predominant wave direction from the east and perpen-
dicular to the bayside boundary of the CMS domain.
The CMS simulated Hurricane Isabel for the period from
September 15 to 19, 2003. The model performance was
examined by the comparison of the calculated and measured
Figure 8. Surge, 2-m sea-level rise, and tide at NOAA gauge 8638610
(Sewells Point, Virginia).
Figure 9. Spatially varying Manning’s n under the 2-m sea-level-rise
scenario.
Figure 10. Surge, tide, and wind of Hurricane Isabel at NOAA gauge
8638610 (Sewells Point, Virginia).
Journal of Coastal Research, Vol. 29, No. 1, 2013
22 Li, Lin, and Burks-Copes
water-surface elevation at Sewells Point, Virginia as shown in
Figure 12. The correlation coefficient between the CMS-
calculated water levels and the measured data is 0.990. The
root mean square error (RMSE) and the relative RMSE
(RMSE/data range) are 0.076 m and 3.6%, respectively.
Comparing the synthesized water-surface elevation specified
at the CMS open-boundary in Figure 10 with the calculated
results in Figure 12, it can be seen that the storm surge
propagates from the bayside as indicated by the phase
difference between surge levels at the coastal and the boundary
locations. As the surge waves approach the nearshore shallow
area, the water-surface elevation at Sewells Point has a 0.1-m
amplitude increase and a 1-hour phase lag. The validation
process shows that the coastal effects on the changes in surge
amplitude and phase from deep to shallow waters are well
represented in the CMS.
Figure 13 shows the spatial distribution of the maximum
water-surface elevations. The simulation results indicate that
about 6% of the land area around the military installations was
inundated from Hurricane Isabel. The flooded areas are
generally flat and have a ground elevation of less than 2 m
above MSL. Because waves break in shallow water, the CMS-
calculated significant wave heights at the flooded area have a
small averaged value of 0.08 m. Additional flooded areas due to
wave effects can be estimated by the peak surge level of 2 m and
the relationship between the change in land elevation change
and flooded area percentage (Figure 3). To investigate this
effect, water levels were increased by 0.04 m, half of the
averaged significant wave height, which resulted in an increase
in the corresponding area changes of 1.0% of the total area.
Therefore, a relatively large response to overland inundation
should be expected if wave effects are considered besides surge,
tide, and wind.
The most severe land inundation in the Hampton Roads area
was caused by the rainfall-led flash flooding and river flooding
during Hurricane Isabel (http://en.wikipedia.org/wiki). The
post-Isabel flooding damage at Naval Station Norfolk was
described and three inundated areas by the storm surge were
identified by Angela Schedel and Eugene Lambert (personal
communication, June 5, 2012). As shown in Figure 14, those
areas include a parking lot (PKL), the Naval Base Golf Course,
and an area adjacent to Mason Creek, all located in the
northern side of the base. No flooding map is available for
Hurricane Isabel, which presents difficulties for a quantitative
comparison between the model results and the survey data.
However, the three flooded spots correspond well to the
Figure 11. Wave parameters of Hurricane Isabel.
Figure 12. Water-surface elevation comparison between the calculations
and measurements of Hurricane Isabel at Sewells Point, Virginia.
Figure 13. The maximum water-surface elevation due to Hurricane Isabel.
(Color for this figure is available in the online version of this paper.)
Journal of Coastal Research, Vol. 29, No. 1, 2013
Modeling of Coastal Inundation at Naval Station Norfolk, Virginia, U.S.A. 23
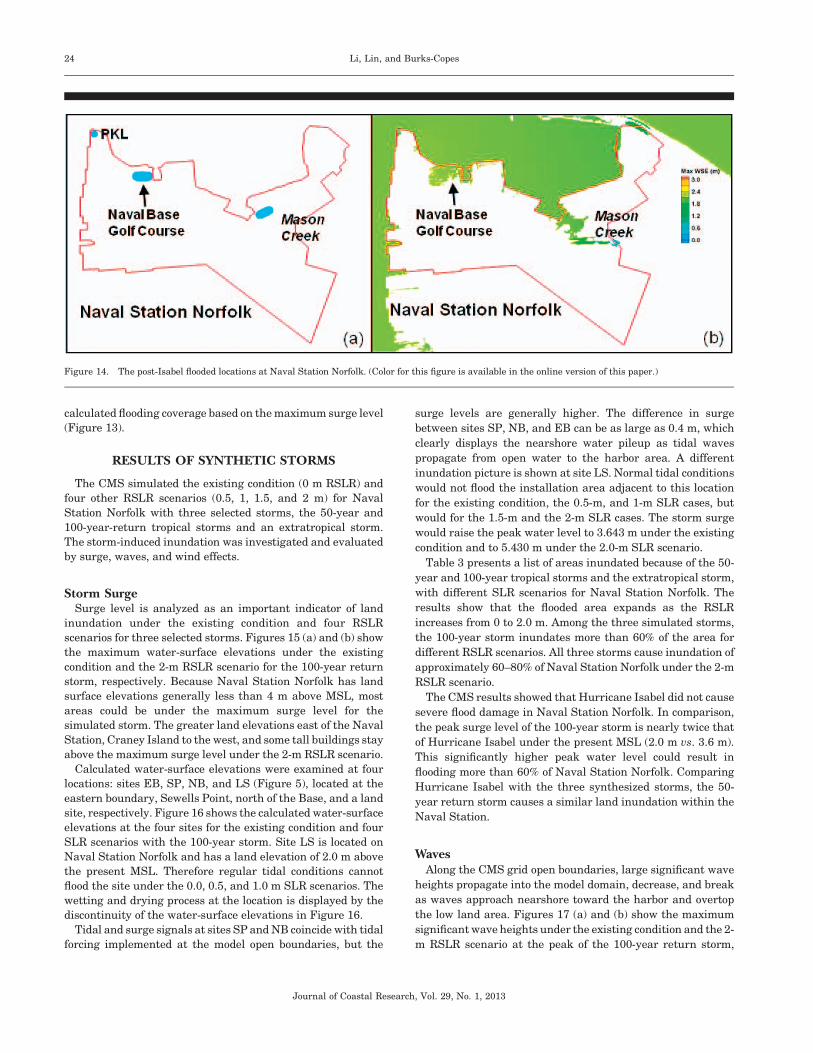
calculated flooding coverage based on the maximum surge level
(Figure 13).
RESULTS OF SYNTHETIC STORMS
The CMS simulated the existing condition (0 m RSLR) and
four other RSLR scenarios (0.5, 1, 1.5, and 2 m) for Naval
Station Norfolk with three selected storms, the 50-year and
100-year-return tropical storms and an extratropical storm.
The storm-induced inundation was investigated and evaluated
by surge, waves, and wind effects.
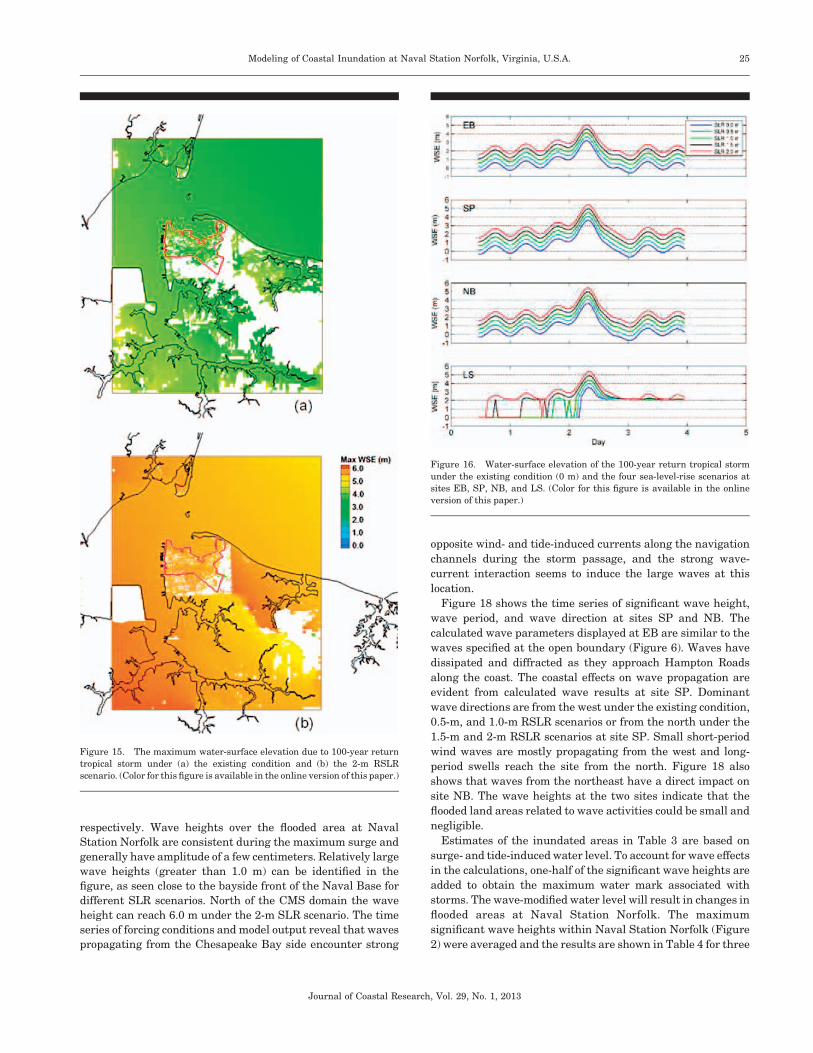
Storm SurgeSurge level is analyzed as an important indicator of land
inundation under the existing condition and four RSLR
scenarios for three selected storms. Figures 15 (a) and (b) show
the maximum water-surface elevations under the existing
condition and the 2-m RSLR scenario for the 100-year return
storm, respectively. Because Naval Station Norfolk has land
surface elevations generally less than 4 m above MSL, most
areas could be under the maximum surge level for the
simulated storm. The greater land elevations east of the Naval
Station, Craney Island to the west, and some tall buildings stay
above the maximum surge level under the 2-m RSLR scenario.
Calculated water-surface elevations were examined at four
locations: sites EB, SP, NB, and LS (Figure 5), located at the
eastern boundary, Sewells Point, north of the Base, and a land
site, respectively. Figure 16 shows the calculated water-surface
elevations at the four sites for the existing condition and four
SLR scenarios with the 100-year storm. Site LS is located on
Naval Station Norfolk and has a land elevation of 2.0 m above
the present MSL. Therefore regular tidal conditions cannot
flood the site under the 0.0, 0.5, and 1.0 m SLR scenarios. The
wetting and drying process at the location is displayed by the
discontinuity of the water-surface elevations in Figure 16.
Tidal and surge signals at sites SP and NB coincide with tidal
forcing implemented at the model open boundaries, but the
surge levels are generally higher. The difference in surge
between sites SP, NB, and EB can be as large as 0.4 m, which
clearly displays the nearshore water pileup as tidal waves
propagate from open water to the harbor area. A different
inundation picture is shown at site LS. Normal tidal conditions
would not flood the installation area adjacent to this location
for the existing condition, the 0.5-m, and 1-m SLR cases, but
would for the 1.5-m and the 2-m SLR cases. The storm surge
would raise the peak water level to 3.643 m under the existing
condition and to 5.430 m under the 2.0-m SLR scenario.
Table 3 presents a list of areas inundated because of the 50-
year and 100-year tropical storms and the extratropical storm,
with different SLR scenarios for Naval Station Norfolk. The
results show that the flooded area expands as the RSLR
increases from 0 to 2.0 m. Among the three simulated storms,
the 100-year storm inundates more than 60% of the area for
different RSLR scenarios. All three storms cause inundation of
approximately 60–80% of Naval Station Norfolk under the 2-m
RSLR scenario.
The CMS results showed that Hurricane Isabel did not cause
severe flood damage in Naval Station Norfolk. In comparison,
the peak surge level of the 100-year storm is nearly twice that
of Hurricane Isabel under the present MSL (2.0 m vs. 3.6 m).
This significantly higher peak water level could result in
flooding more than 60% of Naval Station Norfolk. Comparing
Hurricane Isabel with the three synthesized storms, the 50-
year return storm causes a similar land inundation within the
Naval Station.
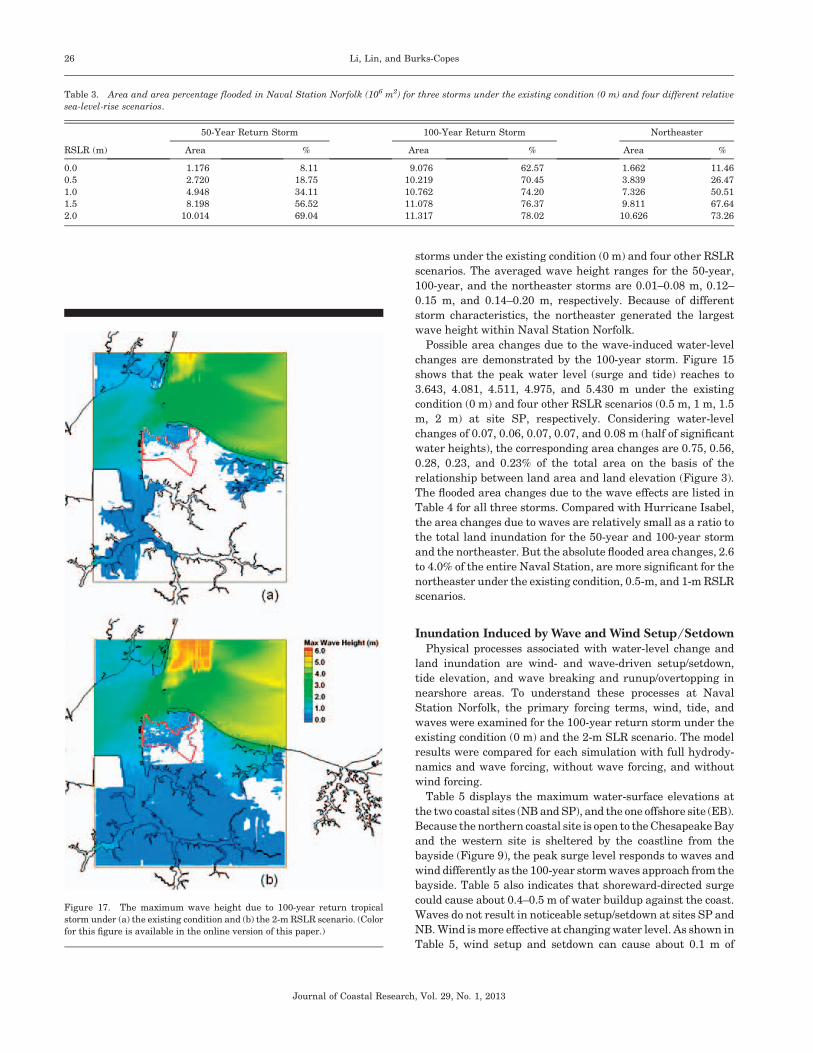
WavesAlong the CMS grid open boundaries, large significant wave
heights propagate into the model domain, decrease, and break
as waves approach nearshore toward the harbor and overtop
the low land area. Figures 17 (a) and (b) show the maximum
significant wave heights under the existing condition and the 2-
m RSLR scenario at the peak of the 100-year return storm,
Figure 14. The post-Isabel flooded locations at Naval Station Norfolk. (Color for this figure is available in the online version of this paper.)
Journal of Coastal Research, Vol. 29, No. 1, 2013
24 Li, Lin, and Burks-Copes
respectively. Wave heights over the flooded area at Naval
Station Norfolk are consistent during the maximum surge and
generally have amplitude of a few centimeters. Relatively large
wave heights (greater than 1.0 m) can be identified in the
figure, as seen close to the bayside front of the Naval Base for
different SLR scenarios. North of the CMS domain the wave
height can reach 6.0 m under the 2-m SLR scenario. The time
series of forcing conditions and model output reveal that waves
propagating from the Chesapeake Bay side encounter strong
opposite wind- and tide-induced currents along the navigation
channels during the storm passage, and the strong wave-
current interaction seems to induce the large waves at this
location.
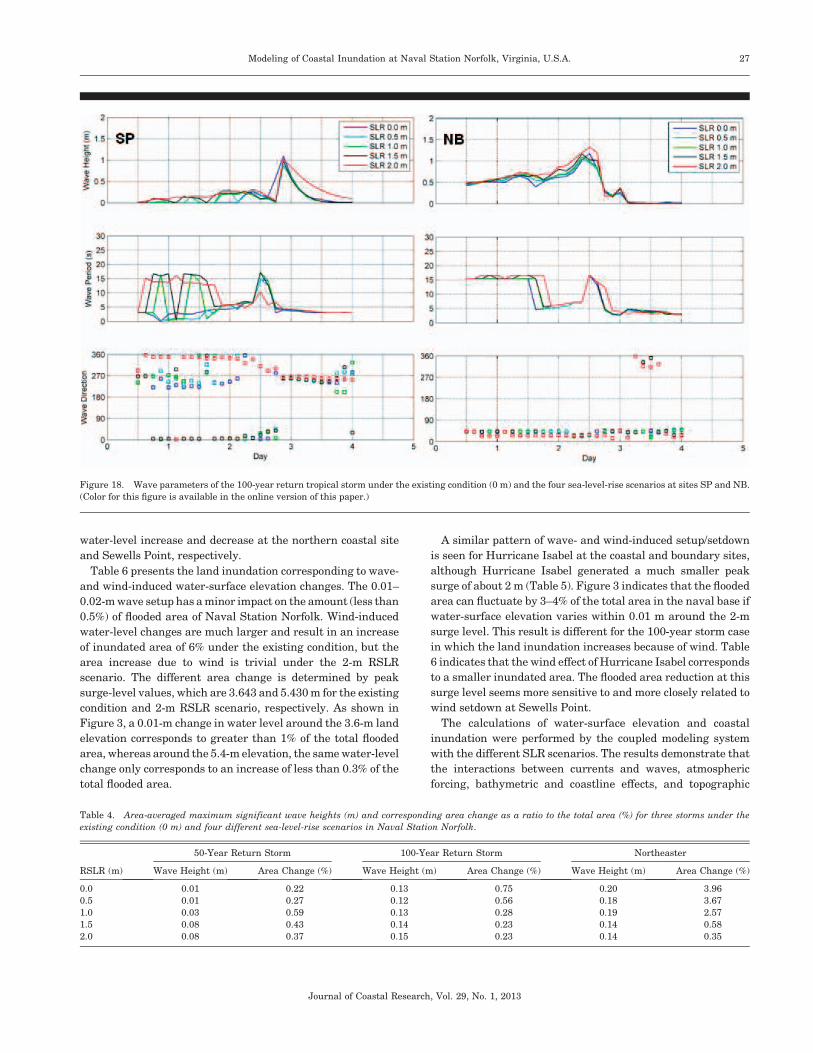
Figure 18 shows the time series of significant wave height,
wave period, and wave direction at sites SP and NB. The
calculated wave parameters displayed at EB are similar to the
waves specified at the open boundary (Figure 6). Waves have
dissipated and diffracted as they approach Hampton Roads
along the coast. The coastal effects on wave propagation are
evident from calculated wave results at site SP. Dominant
wave directions are from the west under the existing condition,
0.5-m, and 1.0-m RSLR scenarios or from the north under the
1.5-m and 2-m RSLR scenarios at site SP. Small short-period
wind waves are mostly propagating from the west and long-
period swells reach the site from the north. Figure 18 also
shows that waves from the northeast have a direct impact on
site NB. The wave heights at the two sites indicate that the
flooded land areas related to wave activities could be small and
negligible.
Estimates of the inundated areas in Table 3 are based on
surge- and tide-induced water level. To account for wave effects
in the calculations, one-half of the significant wave heights are
added to obtain the maximum water mark associated with
storms. The wave-modified water level will result in changes in
flooded areas at Naval Station Norfolk. The maximum
significant wave heights within Naval Station Norfolk (Figure
2) were averaged and the results are shown in Table 4 for three
Figure 16. Water-surface elevation of the 100-year return tropical storm
under the existing condition (0 m) and the four sea-level-rise scenarios at
sites EB, SP, NB, and LS. (Color for this figure is available in the online
version of this paper.)
Figure 15. The maximum water-surface elevation due to 100-year return
tropical storm under (a) the existing condition and (b) the 2-m RSLR
scenario. (Color for this figure is available in the online version of this paper.)
Journal of Coastal Research, Vol. 29, No. 1, 2013
Modeling of Coastal Inundation at Naval Station Norfolk, Virginia, U.S.A. 25
storms under the existing condition (0 m) and four other RSLR
scenarios. The averaged wave height ranges for the 50-year,
100-year, and the northeaster storms are 0.01–0.08 m, 0.12–
0.15 m, and 0.14–0.20 m, respectively. Because of different
storm characteristics, the northeaster generated the largest
wave height within Naval Station Norfolk.
Possible area changes due to the wave-induced water-level
changes are demonstrated by the 100-year storm. Figure 15
shows that the peak water level (surge and tide) reaches to
3.643, 4.081, 4.511, 4.975, and 5.430 m under the existing
condition (0 m) and four other RSLR scenarios (0.5 m, 1 m, 1.5
m, 2 m) at site SP, respectively. Considering water-level
changes of 0.07, 0.06, 0.07, 0.07, and 0.08 m (half of significant
water heights), the corresponding area changes are 0.75, 0.56,
0.28, 0.23, and 0.23% of the total area on the basis of the
relationship between land area and land elevation (Figure 3).
The flooded area changes due to the wave effects are listed in
Table 4 for all three storms. Compared with Hurricane Isabel,
the area changes due to waves are relatively small as a ratio to
the total land inundation for the 50-year and 100-year storm
and the northeaster. But the absolute flooded area changes, 2.6
to 4.0% of the entire Naval Station, are more significant for the
northeaster under the existing condition, 0.5-m, and 1-m RSLR
scenarios.
Inundation Induced by Wave and Wind Setup/SetdownPhysical processes associated with water-level change and
land inundation are wind- and wave-driven setup/setdown,
tide elevation, and wave breaking and runup/overtopping in
nearshore areas. To understand these processes at Naval
Station Norfolk, the primary forcing terms, wind, tide, and
waves were examined for the 100-year return storm under the
existing condition (0 m) and the 2-m SLR scenario. The model
results were compared for each simulation with full hydrody-
namics and wave forcing, without wave forcing, and without
wind forcing.
Table 5 displays the maximum water-surface elevations at
the two coastal sites (NB and SP), and the one offshore site (EB).
Because the northern coastal site is open to the Chesapeake Bay
and the western site is sheltered by the coastline from the
bayside (Figure 9), the peak surge level responds to waves and
wind differently as the 100-year storm waves approach from the
bayside. Table 5 also indicates that shoreward-directed surge
could cause about 0.4–0.5 m of water buildup against the coast.
Waves do not result in noticeable setup/setdown at sites SP and
NB. Wind is more effective at changing water level. As shown in
Table 5, wind setup and setdown can cause about 0.1 m of
Figure 17. The maximum wave height due to 100-year return tropical
storm under (a) the existing condition and (b) the 2-m RSLR scenario. (Color
for this figure is available in the online version of this paper.)
Table 3. Area and area percentage flooded in Naval Station Norfolk (106 m2) for three storms under the existing condition (0 m) and four different relative
sea-level-rise scenarios.
RSLR (m)
50-Year Return Storm 100-Year Return Storm Northeaster
Area % Area % Area %
0.0 1.176 8.11 9.076 62.57 1.662 11.46
0.5 2.720 18.75 10.219 70.45 3.839 26.47
1.0 4.948 34.11 10.762 74.20 7.326 50.51
1.5 8.198 56.52 11.078 76.37 9.811 67.64
2.0 10.014 69.04 11.317 78.02 10.626 73.26
Journal of Coastal Research, Vol. 29, No. 1, 2013
26 Li, Lin, and Burks-Copes
water-level increase and decrease at the northern coastal site
and Sewells Point, respectively.
Table 6 presents the land inundation corresponding to wave-
and wind-induced water-surface elevation changes. The 0.01–
0.02-m wave setup has a minor impact on the amount (less than
0.5%) of flooded area of Naval Station Norfolk. Wind-induced
water-level changes are much larger and result in an increase
of inundated area of 6% under the existing condition, but the
area increase due to wind is trivial under the 2-m RSLR
scenario. The different area change is determined by peak
surge-level values, which are 3.643 and 5.430 m for the existing
condition and 2-m RSLR scenario, respectively. As shown in
Figure 3, a 0.01-m change in water level around the 3.6-m land
elevation corresponds to greater than 1% of the total flooded
area, whereas around the 5.4-m elevation, the same water-level
change only corresponds to an increase of less than 0.3% of the
total flooded area.
A similar pattern of wave- and wind-induced setup/setdown
is seen for Hurricane Isabel at the coastal and boundary sites,
although Hurricane Isabel generated a much smaller peak
surge of about 2 m (Table 5). Figure 3 indicates that the flooded
area can fluctuate by 3–4% of the total area in the naval base if
water-surface elevation varies within 0.01 m around the 2-m
surge level. This result is different for the 100-year storm case
in which the land inundation increases because of wind. Table
6 indicates that the wind effect of Hurricane Isabel corresponds
to a smaller inundated area. The flooded area reduction at this
surge level seems more sensitive to and more closely related to
wind setdown at Sewells Point.
The calculations of water-surface elevation and coastal
inundation were performed by the coupled modeling system
with the different SLR scenarios. The results demonstrate that
the interactions between currents and waves, atmospheric
forcing, bathymetric and coastline effects, and topographic
Figure 18. Wave parameters of the 100-year return tropical storm under the existing condition (0 m) and the four sea-level-rise scenarios at sites SP and NB.
(Color for this figure is available in the online version of this paper.)
Table 4. Area-averaged maximum significant wave heights (m) and corresponding area change as a ratio to the total area (%) for three storms under the
existing condition (0 m) and four different sea-level-rise scenarios in Naval Station Norfolk.
RSLR (m)
50-Year Return Storm 100-Year Return Storm Northeaster
Wave Height (m) Area Change (%) Wave Height (m) Area Change (%) Wave Height (m) Area Change (%)
0.0 0.01 0.22 0.13 0.75 0.20 3.96
0.5 0.01 0.27 0.12 0.56 0.18 3.67
1.0 0.03 0.59 0.13 0.28 0.19 2.57
1.5 0.08 0.43 0.14 0.23 0.14 0.58
2.0 0.08 0.37 0.15 0.23 0.14 0.35
Journal of Coastal Research, Vol. 29, No. 1, 2013
Modeling of Coastal Inundation at Naval Station Norfolk, Virginia, U.S.A. 27
features are all contributing to changes in calculated hydrody-
namic variables and inundated areas.
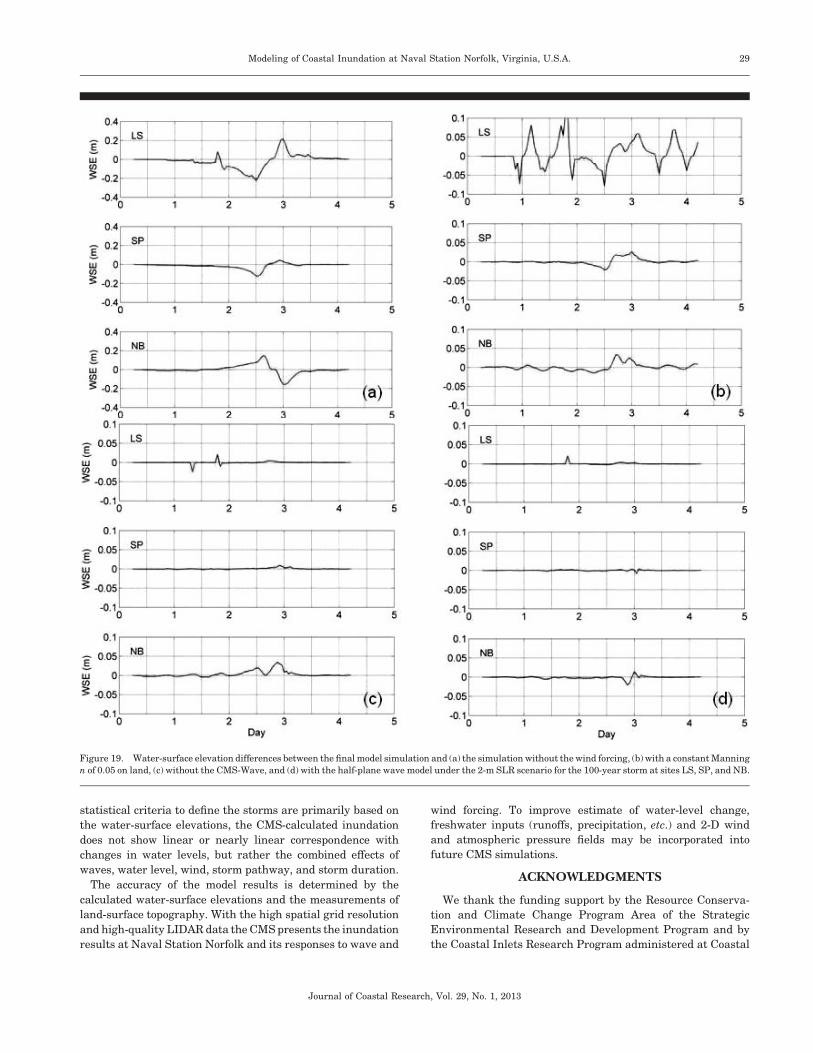
Figure 19 shows sensitivity results of water-surface eleva-
tions under the 2-m SLR scenario for the 100-year storm at
sites LS, SP, and NB. The comparisons are between the final
model setup and the simulations without the wind forcing, with
a constant Manning n of 0.05 on land, without the CMS-Wave,
and with the half-plane wave model in Figures 19 (a), (b), (c),
and (d), respectively. Clearly, the wind setup/setdown causes
the greatest departure of water-surface elevation from the
mean water level under the storm condition and the switch
from the full-plane wave model to the half-plane model
produces the least water-level changes. Water-surface eleva-
tions show stronger response to the changes in wind and
bottom friction at the shallow water site (LS). Because the 100-
year storm has a direct impact on the northern side of Naval
Station Norfolk (Figures 6 and 7), both wind and waves induce
large water-level changes at site NB. Wave-induced water-level
changes seem insignificant at the nearshore sites LS and SP
due to wave diffraction, dissipation, and breaking.
Associated with the water-level changes due to different
physical processes, the area inundation can be greatly affected
in the coastal region. Therefore, it is necessary to apply a
comprehensive model, such as the CMS, to study storm surge
and storm-induced coastal flooding.
CONCLUSIONS
The CMS, a coupled numerical modeling system of waves,
circulation, and sediment transport, was applied to simulate
nearshore surge and waves, to estimate inundation, and to
examine potential effects of SLR triggered by climate change
and storm surge surrounding Naval Station Norfolk. The CMS
was validated for water elevation for Hurricane Isabel, and
calculated water-surface elevations showed good agreement
with measurements at Sewells Point, Virginia. Additional
model simulations were conducted for two synthesized tropical
storms (50-year return and 100-year return), and one extra-
tropical storm (northeaster) under the existing condition (the
present MSL) and four RSLR scenarios, 0.5, 1, 1.5, and 2 m.
The model results indicated that Hurricane Isabel produced
a maximum surge of 2 m MSL along the coast and inundated
6% of Naval Station Norfolk. The maximum surge level
induced by the 100-year storm reached 3.643 m MSL under
the existing condition and to 5.430 m MSL under the 2-m RSLR
scenario. Extensive inundation occurred for both of these
scenarios. For the three simulated storms the surge levels are
high enough to inundate approximately 60–80% of Naval
Station Norfolk under the 2-m RSLR scenario. However, the
high land area east of the Naval Station, the dredge material
placement site at Craney Island, and some tall buildings stay
above the extreme surge level during the 100-year return-
period storm.
Incident waves were provided along the CMS grid open
boundaries. For Hurricane Isabel the nearshore significant
peak wave height was 3.5 m. For the synthesized storms
significant wave heights were dependent on water depth. Both
long-period swells and short-period wind waves were calculat-
ed within the CMS domain. The 100-year return-period storm
had peak wave heights ranging from 2.5 to 3.8 m under the
existing condition and four SLR scenarios. Significant wave
heights on Naval Station Norfolk had small amplitudes that
averaged between 0.01 to 0.2 m; larger waves of greater than 1
m occurred at the seaward limit of the naval base.
Considering surge and tide only, Hurricane Isabel would
inundate 6% of the land area in Naval Station Norfolk. Among
the synthesized storms, the 50-year return storm generates the
lowest surge level and inundates the smallest land area at
Naval Station Norfolk under the same RSLR conditions. On the
other hand, the 100-year return storm with the highest surge
level inundates the largest land area.
Surge-level changes induced by waves could increase the
inundation by 1% of the total area in Naval Base Norfolk for
Hurricane Isabel. A minimum inundated area change of 0.22%
and a maximum of 3.96% could be related to the waves for the
synthesized 50-year storm and the northeaster under the
existing condition, respectively. Wave and wind effects on
storm surge were examined using Hurricane Isabel and the
100-year storm. Wave setup/setdown is related to 0.01–0.02 m
of water-level change, which results in less than 0.5% of
changes in flooded area in Naval Station Norfolk. However,
wind setup/setdown correspond to 0.01 m of water-level
changes and induce greater than 1% and 0.3% of total area
changes under the existing condition and the 2-m RSLR
scenario, respectively.
The CMS study evaluated coastal inundation caused by
storm surge, waves, and wind with global SLR. The model
results indicate that Naval Station Norfolk would sustain
limited inundation under the existing sea-level condition for
storms less than a 50-year return period. Because the
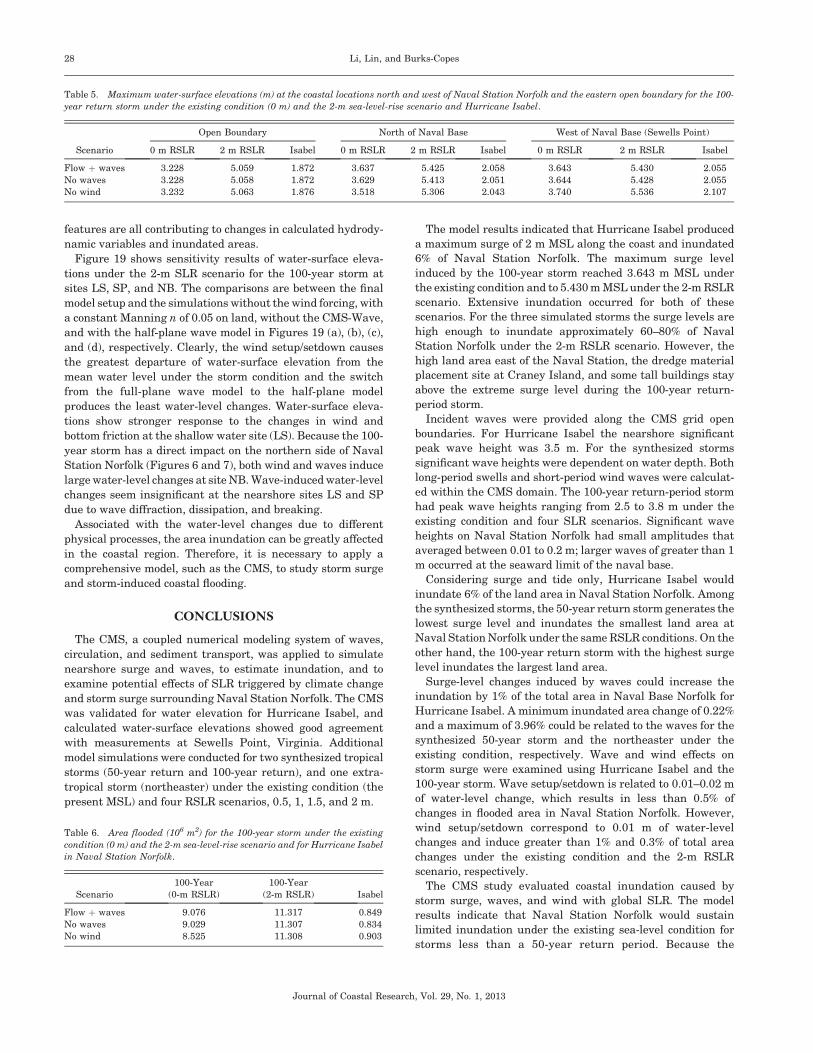
Table 5. Maximum water-surface elevations (m) at the coastal locations north and west of Naval Station Norfolk and the eastern open boundary for the 100-
year return storm under the existing condition (0 m) and the 2-m sea-level-rise scenario and Hurricane Isabel.
Scenario
Open Boundary North of Naval Base West of Naval Base (Sewells Point)
0 m RSLR 2 m RSLR Isabel 0 m RSLR 2 m RSLR Isabel 0 m RSLR 2 m RSLR Isabel
Flow þ waves 3.228 5.059 1.872 3.637 5.425 2.058 3.643 5.430 2.055
No waves 3.228 5.058 1.872 3.629 5.413 2.051 3.644 5.428 2.055
No wind 3.232 5.063 1.876 3.518 5.306 2.043 3.740 5.536 2.107
Table 6. Area flooded (106 m2) for the 100-year storm under the existing
condition (0 m) and the 2-m sea-level-rise scenario and for Hurricane Isabel
in Naval Station Norfolk.
Scenario
100-Year
(0-m RSLR)
100-Year
(2-m RSLR) Isabel
Flow þ waves 9.076 11.317 0.849
No waves 9.029 11.307 0.834
No wind 8.525 11.308 0.903
Journal of Coastal Research, Vol. 29, No. 1, 2013
28 Li, Lin, and Burks-Copes
statistical criteria to define the storms are primarily based on
the water-surface elevations, the CMS-calculated inundation
does not show linear or nearly linear correspondence with
changes in water levels, but rather the combined effects of
waves, water level, wind, storm pathway, and storm duration.
The accuracy of the model results is determined by the
calculated water-surface elevations and the measurements of
land-surface topography. With the high spatial grid resolution
and high-quality LIDAR data the CMS presents the inundation
results at Naval Station Norfolk and its responses to wave and
wind forcing. To improve estimate of water-level change,
freshwater inputs (runoffs, precipitation, etc.) and 2-D wind
and atmospheric pressure fields may be incorporated into
future CMS simulations.
ACKNOWLEDGMENTS
We thank the funding support by the Resource Conserva-
tion and Climate Change Program Area of the Strategic
Environmental Research and Development Program and by
the Coastal Inlets Research Program administered at Coastal
Figure 19. Water-surface elevation differences between the final model simulation and (a) the simulation without the wind forcing, (b) with a constant Manning
n of 0.05 on land, (c) without the CMS-Wave, and (d) with the half-plane wave model under the 2-m SLR scenario for the 100-year storm at sites LS, SP, and NB.
Journal of Coastal Research, Vol. 29, No. 1, 2013
Modeling of Coastal Inundation at Naval Station Norfolk, Virginia, U.S.A. 29
and Hydraulics Laboratory under the Navigation Program for
Headquarters, U.S. Army Corps of Engineers (USACE). We
are grateful for the late Dr. Nicholas C. Kraus for his
inspiration and encouragement toward the CMS application
to this study. We also thank Dr. Julie D. Rosati, Dr. Zeki
Demirbilek, and Ms. Mary A. Cialone of USACE, and two
anonymous reviewers for reviewing and providing construc-
tive comments on the manuscript. Permission was granted by
the Chief, USACE, to publish this information.
LITERATURE CITED
Blanton, B.; Stillwell, L.; Roberts, H.H.; Atkinson, J.; Zou, S.; Forte,M.; Hanson, J.L., and Luettich, R., 2011. Coastal Storm SurgeAnalysis: Computational System, Submittal 1.2 to FEMA. Coastaland Hydraulics Laboratory Technical Report ERDC/CHL-TR-11-1. Vicksburg, Mississippi: U.S. Army Engineer Research andDevelopment Center.
Burks-Copes, K.A. and Russo, E.J., 2011. Risk Quantification forSustaining Coastal Military Installation Assets and MissionCapabilities. Interim Technical Report. Vicksburg, Mississippi:U.S. Army Engineer Research and Development Center: Environ-mental Laboratory.
Buttolph, A.M.; Reed, C.W.; Kraus, N.C.; Ono, N.; Larson, M.;Camenen, B.; Hanson, H.; Wamsley, T., and Zundel, A.K., 2006.Two-Dimensional Depth-Averaged Circulation Model CMS-M2D:Version 3.0, Report 2, Sediment Transport and MorphologyChange. Coastal and Hydraulics Laboratory Technical ReportERDC/CHL-TR-06-7. Vicksburg, Mississippi: U.S. Army EngineerResearch and Development Center.
Chow, V.T., 1959. Open-Channel Hydraulics. New York: McGraw-HillBook Co., 680 p.
CIRP (Coastal Inlets Research Program). http://cirp.usace.army.mil(accessed January 3, 2012).
Dean, R.G. and Walton, T.L., 2009. Wave setup. In: Kim, Y.C (ed.),Handbook of Coastal and Ocean Engineering. Singapore: WorldScientific, pp. 1–23.
Demirbilek, Z.; Lin, L.; Smith, J.; Hayter, E.; Smith, E.; Gailani, J.Z.;Norwood, G.J., and Michaelsen, D.R., 2010. Waves, Hydrodynamicsand Sediment Transport Modeling at Grays Harbor, WA. Coastaland Hydraulics Laboratory ERDC/CHL-TR-10-13. Vicksburg, Mis-sissippi: U.S. Army Engineer Research and Development Center.
Demirbilek, Z. and Rosati, J.D., 2011. Verification and Validation ofthe Coastal Modeling System, Report 1: Summary Report. Coastaland Hydraulics Laboratory. ERDC/CHL TR-11-10, Vicksburg,Mississippi: U.S. Army Engineer Research and DevelopmentCenter, Coastal and Hydraulics Laboratory.
Forte, M.F.; Hanson, J.L.; Stillwell, L.; Blanchard-Montgomery, M.;Blanton, B.; Leuttich, R.; Roberts, H.; Atkinson, J., and Miller, J.,2011. Coastal Storm Surge Analysis System: Digital ElevationModel, Submittal 1.1 to FEMA. Coastal and Hydraulics LaboratoryTechnical Report ERDC/CHL-TR-11-1. Vicksburg, Mississippi:U.S. Army Engineer Research and Development Center.
Google Earth Pro 5.1. URL: http://earth.google.com (accessed Decem-ber 5, 2011).
Hirsch, M.E.; DeGaetano, A.T., and Colucci, S.J., 2001. An east coastwinter storm climatology. Journal of Climate, 14, 882–899.
Holland, G.J., 1980. An analytic model of the wind and pressureprofiles in hurricanes. Monthly Weather Review, 108, 1212–1218.
IPCC (Intergovernmental Panel on Climate Change), 2007. Fourthassessment report. Available online at: http://www.ipcc.ch/ (ac-cessed July 23, 2012).
Jevrejeva, S.; Grinsted, A.; Moore, J.C., and Holgate, S., 2006.Nonlinear trends and multiyear cycles in sea level records. Journalof Geophysical Research, 111, C09012, doi: 10.1029/2005JC003229.
Li, H.; Brown, M.E.; Smith, T.D., and Podoski, J.H., 2009. Evaluationof Proposed Channel on Circulation and Morphology Change atKawaihae Harbor and Pelekane Bay, Island of Hawaii, HI. Coastaland Hydraulics Laboratory ERDC/CHL-TR-09-19. Vicksburg,
Mississippi: U.S. Army Engineer Research and DevelopmentCenter.
Lin, L.; Demirbilek, Z.; Mase, H.; Zheng, J., and Yamada, F., 2008.CMS-Wave: A Nearshore Spectral Wave Processes Model forCoastal Inlets and Navigation Projects. Coastal and HydraulicsLaboratory Technical Report ERDC/CHL TR-08-13. Vicksburg,MS: U.S. Army Engineer Research and Development Center.
Lin, L., Demirbilek, Z., Thomas, R., and Rosati, III, J., 2011.Verification and Validation of the Coastal Modeling System, Report2: CMS-Wave. Coastal and Hydraulics Laboratory TechnicalReport ERDC/CHL-TR-11-10. Vicksburg, Mississippi: U.S. ArmyEngineer Research and Development Center.
Mase, H., 2001. Multidirectional random wave transformation modelbased on energy balance equation. Coastal Engineering Journal,43(4), 317–337.
McAlpin, T.; Wamsley, T., and Cialone, M., 2011. Methodology forModeling the Effects of Sea Level Rise with the ADCIRC NumericalModel. ERDC/CHL TN-CHETN-IV-x. Vicksburg, Mississippi: U.S.Army Engineer Research and Development Center.
McLean, R.F.; Tsyban, A.; Burkett, A.; Codignotto, J.O.; Forbes, D.L.;Mimura, N.; Beamish, R.J., and Ittekkot, V., 2001. Coastal zonesand marine ecosystems. In: Mccarthy, J.J.; Canziani, O.F.; Leary,N.A.; Dokken, D.J., and White, K.S. (eds.), Climate Change 2001:Impacts, Adaptation and Vulnerability. Cambridge, U.K.: Cam-bridge University Press, pp. 343–380.
Melby, J.A.; Thompson, E.F.; Cialone, M.A.; Smith, J.M.; Borgman,L.E.; Demirbilek, Z.; Hanson, J.L., and Lin, L., 2005. Life-CycleAnalysis of Mid-Bay and Poplar Island Projects, Chesapeake Bay,Maryland. Coastal and Hydraulics Laboratory Technical ReportERDC/CHL-TR-05-12. Vicksburg, Mississippi: U.S. Army Engi-neer Research and Development Center.
National Geophysical Data Center (NGDC). http://www.ngdc.noaa.gov/mgg/shorelines/shorelines (accessed December 5, 2011).
National Oceanic and Atmospheric Administration (NOAA). http://tidesandcurrents.noaa.gov (accessed December 19, 2011).
National Oceanic and Atmospheric Administration (NOAA). http://tidesandcurrents.noaa.gov/sltrends/sltrends_station.shtml?stnid¼8638610 (accessed January 9, 2012).
Pfeffer, W.T.; Harper, J.T., and O’Neel, S., 2008. Kinematicconstraints on glacier contributions to 21st-century sea-level rise.Science, 321, 1340–1343.
Sanchez, A.; Wu, W.; Beck, T.M.; Li, H.; Rosati, J.D.; Demirbilek, Z.,and Brown, M., 2011a. Verification and Validation of the CoastalModeling System, Report 4: Sediment Transport and MorphologyChange. Coastal and Hydraulics Laboratory Technical ReportERDC/CHL-TR-11-10. Vicksburg, Mississippi: U.S. Army Engi-neer Research and Development Center.
Sanchez, A.; Wu, W.; Beck, T.M.; Li, H.; Rosati, J III; Thomas, R.;Rosati, J.D.; Demirbilek, Z.; Brown, M., and Reed, C., 2011b.Verification and Validation of the Coastal Modeling System, Report3: Hydrodynamics. Coastal and Hydraulics Laboratory TechnicalReport ERDC/CHL-TR-11-10. Vicksburg, Mississippi: U.S. ArmyEngineer Research and Development Center.
Simulating WAves Nearshore (SWAN). http://www.swan.tudelft.nl(accessed December 19, 2011).
Smith, E., 1999. Atlantic and east coast hurricanes 1900–98: afrequency and intensity study for the twenty-first century. Bulletinof the American Meteorological Society, 80(12), 2717–2720.
Taylor, L.A.; Eakins, B.W.; Carignan, K.S.; Warnken, R.R.; Sazonova,T.; Schoolcraft, D.C., and Sharman, G.F., 2008. Digital ElevationModel of Virginia Beach, Virginia: Procedures, Data Sources andAnalysis. NOAA Technical Memorandum NESDIS NGDC-7.Boulder, Colorado: National Geophysical Data Geophysics Divi-sion.
USACE (U.S. Army Corps of Engineers) Army Geospatial Center.http://www.agc.army.mil/ (accessed February 29, 2012).
Vickery, P.; Wadhera, D.; Cox, A.; Cardone, V.; Hanson, J., andBlanton, B., 2010. Coastal Storm Surge Analysis System, StormForcing, Intermediate Submission Report 1. 3, FEMA Region III.
Zundel, A.K., 2006. Surface-water modeling system reference manual—Version 9. 2. Provo, Utah: Brigham Young University EnvironmentalModeling Research Laboratory.
Journal of Coastal Research, Vol. 29, No. 1, 2013
30 Li, Lin, and Burks-Copes