Embed Size (px)
Citation preview

1556-603x/17©2017ieee February 2017 | ieee Computational intelligenCe magazine 29
Digital Object Identifier 10.1109/MCI.2016.2627669Date of publication: 6 January 2017 Corresponding Author: Hai-Lin Liu (e-mail: [email protected]).
Abstract—When planning the Tracking Areas (TAs) for a Long Term Evolution (LTE) network, the main concern of mobile operators is to achieve the minimization of both location update cost and paging cost. This paper proposes a new green field TA planning model using multi-objective optimization with constraints, aiming at finding a better trade-off between the two conflicting objectives. This new model integrates the network geographical information, therefore making it more realistic. Considering the impact of constraints, we design an evolutionary multi-objective algo-rithm based on a population decomposition strategy for the proposed model. Information about infeasible solutions can be fully utilized by population decomposition and thus the
Lei Chen and Hai-Lin LiuGuangdong University of Technology, Guangzhou, CHINA
Zhun FanGuangdong Provincial Key Laboratory of Digital Signal and Image Processing, Shantou University, Shantou, CHINA
Shengli Xie Guangdong University of Technology, Guangzhou, CHINA
Erik D. GoodmanBEACON Center for the Study of Evolution in Action, Michigan State University, USA
Modeling the Tracking Area Planning Problem Using an Evolutionary Multi-Objective Algorithm
©isto
ckphoto
.com/Vertig
o3d

30 ieee Computational intelligenCe magazine | February 2017
algorithmic efficiency can be greatly improved. A new cod-ing scheme inspired by the famous four-color theorem is specially designed for this multi-objective TA planning model. Computer simulations are conducted and the quality of the new model is confirmed by comparing the results of the multi-objective model with those of a single-objective model. The essential role of the population decomposition strategy has also been identified by comparing the proposed algorithm with the Multi-objective Evolutionary Algorithm based on Decomposition (MOEA/D).
I. Introduction
ith the development of mobile communication networks, the LTE network has become ever
more popular around the world. The study of LTE networks has become a hot issue in the theo-
ry and practice of contemporary mobile communication net-works [1]. Location management is an essential task in LTE networks, and it can directly affect the stability, security and performance of the networks. Location management in LTE networks aims at quickly tracking where the users are, and this tracking makes it possible to deliver calls, short message services and other mobile phone services to the users in a timely way.
In the management of an LTE network, cells are bound together to form a series of TAs, and then the TAs are further grouped into TA lists (TALs). The main function of TALs is to track the locations of a user equipment (UE). Each TAL has an identifier known as its Tracking Area Identity (TAI), which is used for the location update of UEs. All the Base Stations (BSs) in the same TAL broadcast the same TAI regularly through a broadcast control channel. UEs can recognize the TAI and store it in the subscriber identity module (SIM) when registering with the network. If the registered TAI of a UE is found differ-ent from the current broadcast TAI, location update is triggered. Thus, when a user enters a different TAL, the UE’s location needs to be updated. Obviously, the more the TAL boundary crossings is, the more location updates the network performs. In the process of location update, UE updates its location and noti-fies its current location to the network [2]. When there is a phone call for a UE, the network will search for this UE. This search is known as paging. The most simple and intuitive way of paging is to check each cell one by one, which is called the blanket polling paging. This registered TAL information can nar-row the search into a certain TAL, because only the cells belong-ing to the TAL where the UE is registered need to be paged.
Paging and location update lead to two different kinds of costs which are termed as location management cost. If we enlarge the TAL to the extreme situation, namely, making all the cells into one TAL, we can eliminate the location update cost completely. However, the large size of the TAL leads to the need to search more cells to ensure a successful paging, which means more resources need to be expended. In addition, the load of every single cell increases because of frequent paging. In the limit, the paging success rate decreases so that the entire network becomes unstable and its service quality cannot be
guaranteed. At the other extreme, by making each cell an inde-pendent TAL, we can minimize the paging cost of the entire network, but we also maximize the location update cost. In fact, the two objectives are conflicting: having TALs with few cells means a larger location update cost but a smaller paging cost, while having TALs with many cells means a smaller loca-tion update cost but a larger paging cost.
Although the TAL scheme can make TA planning more flexible, it may increase the network complexity and bring some adverse effects [3]. Since a simple and stable LTE network is more desirable in the early stage of network construction, we consider TA planning in a green field, where each TAL has only one TA in this paper. It is actually a multi-objective opti-mization problem aiming at finding a rational trade-off between the paging cost and the location update cost. Although the two objectives are clear, the details can be very complicated. TA planning is affected by many other factors, such as the paging capacity of the mobility management entity (MME) and geographical features. The first contribution of this paper is that we build a multi-objective TA planning model by integrating the network area geographic information. A new constraint of adjacent cells with no shared boundary crossing should be assigned to different TAs, is introduced based on the assumption that each cell must have at least one connected road to the others. This multi-objective model can provide a set of trade-off solutions for TA planning, and thus give the deci-sion makers more options, especially taking the anticipated growth trajectories and technology changes into account.
Evolutionary Multi-objective Optimization (EMO) algo-rithms are a type of population-based heuristic algorithms, which use a set of individuals (called population) to search the Pareto optimal solutions of a multi-objective optimization prob-lem. The main advantage of EMO algorithms over classical approaches in solving multi-objective optimization problems is that many trade-off solutions can be obtained in a single run. Recently, decomposition based EMO algorithms, such as MOEA/D [28] were reported to achieve good performance in various application domains [29]. Article with Liu et al. [30] proposed a new version of MOEA/D by decomposing a multi-objective optimization problem to a number of multi-objective subproblems (M2M). By M2M decomposition, the population is decomposed into a number of subpopulations and similar resources are assigned to optimize each multi-objective subprob-lem. The second contribution of this paper is the design of a new M2M-based EMO algorithm for the proposed TA plan-ning model, which lies in two aspects. Firstly, a novel coding scheme based on the famous four-color theorem [33] is designed to encode the solutions. A two-step decoding method based on the coding scheme is designed to decode the solutions. The first step of decoding tends to merge several small TAs into a big one while the second step tends to split a big TA into sev-eral small ones. The new coding scheme can be beneficial to balance the two objectives and help to find better trade-off solu-tions for the multi-objective TA planning model. Secondly, an M2M decomposition [30] based constraint handling strategy is
W
February 2017 | ieee Computational intelligenCe magazine 31
designed to make better use of the information about both feasible and infeasible solutions. In general, feasibility rules [34] based constraint handling methods place a higher value on feasi-ble solutions, which tend to ignore the impor-tant function that infeasible solutions perform in searching. However, study with Deb [35] has shown that, if properly used, the information about infeasible solutions can effectively enhance the search efficiency. Due to this fact, we apply the M2M decomposition strategy [30] to make better use of infeasi-ble solutions. The population is decomposed into a number of subpopulations in M2M framework, and every individual mere-ly competes with its counterparts belonging to the same sub-population so that the infeasible solutions are more likely to survive than they would be in a single-population EMO algo-rithm, because of less selection pressure. In this way, a certain number of promising infeasible solutions will be kept in the evolutionary process to guide the population search. The M2M decomposition strategy can also be beneficial in maintaining the population diversity [30].
Three generated networks are used to simulate the real situ-ation of user movements and geographic information. Com-parison experiments are conducted to investigate the effectiveness and efficiency of the proposed multi-objective TA planning model and the M2M decomposition strategy for solv-ing this model. The results obtained by solving this new model are compared with those of a single-objective TA planning model proposed by Subrata and Zomaya [8]. The simulation results show that the proposed multi-objective model can achieve better trade-offs between the location update cost and paging cost. We also compare the results obtained by optimiz-ing the proposed model using M2M and MOEA/D. The main difference between the two algorithms is that M2M utilizes the population decomposition strategy, while MOEA/D does not. Simulation results show that M2M achieves both better con-vergence and diversity than MOEA/D.
The remainder of this paper is organized as follows: Sec-tion II explains the related work. Section III describes the formulation of the TA planning problem and the multi-objective model proposed in this paper. Section IV presents the design of the EMO algorithm based on the M2M decomposition to solve the proposed model. In Section V, simulation experiments of three generated networks are con-ducted, and experimental results are shown and analyzed. Finally, we conclude the paper in Section VI.
II. Related WorkA TA is similar to the concept of a Location Area (LA) in the GSM network, and LA planning has been extensively studied. These models and methods for LA planning apply to TA plan-ning in LTE networks as well [24]. Thus we also review some of the relevant work about LA planning.
Most LA planning models consider only one objective, either in the form of paging cost, location update cost or a
linear combination of the two costs. For instance, the paging cost was ignored [4] or considered as a constraint [5], [6] by the authors. They claimed that minimizing the location update cost was advantageous since paging capacity can be easier to quanti-fy as a constraint. The authors in [7] treated bandwidth as a scarce resource and tried to minimize the paging cost. A weight factor should be provided when combining paging cost and location update cost together using the weighted sum approach [8], [9], [22]. The solutions obtained in this way are sensitive to the weight used in forming the objective function. Tcha et al. proposed a cutting plane algorithm for an integer program-ming model of LA planning problem [10]. Since LA planning is an NP-hard problem [10], many heuristic algorithms, such as Artificial Neural Network (ANN) [11], Simulated Annealing (SA) [5], [6], [12], Evolutionary Algorithm (EA) [13]–[16] and Greed Search (GS) [17] have been used to address this problem. Computational complexity of heuristic algorithms for LA planning is also concerned by researchers. Gondim et al. intro-duced the elitist individuals preserving based crossover and edge-based mutation to accelerate the convergence of their new EA for LA partitioning [16]. The computational efficiency of SA, taboo search, and genetic algorithm for the LA planning problem was studied and compared in [18].
Meanwhile, some researchers studied the TA/LA planning problem from different aspects, and a lot of beneficial achieve-ments have been made. Toril et al. proposed a automatic meth-od for TA replanning by analyzing the frequency of user movements and change of traffic trends in an LTE network [19]. A new TAL configuration method was introduced by Ikeda et al. to detect the burst of location updates from the location update records [20]. Lee et al. [21] proposed an integer programming model for graph partitioning. Cayirci and Aky-ildiz used the number of LA boundary crossings as the measure of location update cost, and proved that the location update cost can be minimized by minimizing the inter-LA traffic flow in the network [22]. Krichen et al. extended the classical LA planning problem by including additional objectives and con-straints [23]. An integer programming model was developed to achieve better trade-offs between the network performance and TA reconfiguration cost in [24]. A multi-layer LA design model, which allows an LA paging several areas, was studied and analyzed by Park and Soni [25].
EMO algorithms are powerful tools for solving complex optimization problems. The applications of EMO algorithms in engineering have been becoming increasingly popular and perfect. Dorn et al. applied NSGA-II (a fast and elitist
Location management in LTE networks aims at quickly tracking where the users are, and this tracking makes it possible to deliver calls, short message services and other mobile phone services to the users in a timely way.

32 ieee Computational intelligenCe magazine | February 2017
multi-objective genetic algorithm proposed by Deb et al. [26]) to manage the watershed water quality [27]. Feng et al. studied MOEA/D and its application in control-structure integrated multi-objective design for flexible spacecrafts [29]. Liu et al. proposed an iterative power control scheme to plan WCDMA networks by an EMO algorithm [31]. Ishibuchi et al. investigated the performance of three EMO algorithms in optimizing many-objective knapsack problems [32]. More ref-erences about EMO algorithms and their applications can be found in [35].
III. The TA Planning Problem
A. Problem StatementThe geographical coverage area of an LTE network is partitioned into cells, where each cell is served by a single BS and managed by a single MME. The MME is used to record the TA where the UE is registered. The essential task of TA planning is to group cells to form a
set of TAs that can give the network relatively low location update cost and paging cost under the condition of guaranteeing the service quality. Every BS and MME can only process a limit-ed number of paging requests per second, which means their capacities must not be exceeded in TA planning (so are con-straints). According to the analysis, a location update occurs only when a mobile user crosses the TA boundary. So it is reasonable to take the number of TA boundary crossings as the measure of location update cost. The user movements among TAs weigh heavily in the process of TA planning, while the geographic environment can directly affect user movements. For instance, regions with many roads tend to have more user mobility than regions cut off by high mountains or similar obstacles. Therefore, the influence of geographic environment is considered when we undertake TA planning. On the one hand, we try to avoid situa-tions in which groups of cells with no roads connecting them are assigned to the same TA. On the other hand, the TA bound-ary should avoid crossing roads or paralleling roads in order to reduce the so-called Ping-Pong effect.
B. Multi-objective TA Planning ModelIn general, most mobile users move on roads and thus the number of mobile users on the roads can give a good approxi-mation to that of all mobile users in the network. Considering this, we assume that user movements are confined to the roads and only consider the traffic movement on the roads. It means that the TA boundary causes no location updates if there is no road connecting the adjacent cells separated by the boundary. Fig. 1 illustrates an instance of this situation in part of an LTE network. There is a river between cell 1 and cell 2, which hin-ders user movements between them. The result is that no loca-tion update occurs at the boundary between cell 1 and cell 2 if it is also set as a boundary between two TAs, according to our hypothesis. Geographic information can be directly ref lected by the traffic f low on each grade (traffic carrying capacity) of road of the network, and the exact traffic f low data on each road can be obtained by using statistical method. Roads in an LTE network can be classified into different types according to their traffic f low in a realistic TA planning scenario. The straightforward process of modeling TA planning problem in this paper is illustrated in Fig. 2.
In our study, roads are roughly divided into three different types: main roads, streets, and alleys. The main notations used in the following equations are listed as follows:
, , ...,N1 2" ,: the corresponding cell index set, where N is the total number of cells in the network.
Cell 3
Cell 2
Cell1
The River
FigUrE 1 An example of location update between cells.
Number of Users Telephone Trac
Paging Prediction
TA Planning
Geo
grap
hic
Info
rmat
ion
FigUrE 2 The main flowchart of TA planning.
Every BS and MME can only process a limited number of paging requests per second, which means their capacities must not be exceeded in TA planning (so are constraints).

February 2017 | ieee Computational intelligenCe magazine 33
, , ...,R R Rk k kS1 2 k" ,: the indexes of roads of type k ( , , ...,k K1 2= ), where K is the total number of road types and Sk is the total number of roads of type k.
, , ...,k k ks s sN1 2 ks" , : the indexes of cells passed by road s of type ( ,k k 1=, ..., , , , ..., ),K s S2 1 2 k= w h e r e Nks
( )N Nks # is the total number of cells passed by this road.Since it is very common that a lot of roads need to be con-
structed in cities with a high population density, we also assume that each cell has at least one road passing through. As we have explained, boundary crossings can be used as a measure of loca-tion update cost, and the total location update cost in a network can be measured by the total number of mobile user TA bound-ary crossings. In this paper, we develop this idea and use the aver-age road traffic flow as the measure of location update cost. The average road traffic flow can be used to estimate TA boundary crossings according to the hypothesis. The calculation of location update cost between different TAs is therefore transformed into counting the average traffic flow on each grade of road crossing the TA boundaries. The first objective of the proposed model is to minimize location update cost, which can be expressed as:
,f dlc k kn
N
s
S
k
K
k k1
1
11s s
kk
s sn n
s
n n1 1m==
-
==+ +/// (1)
where ksn and ksn 1+ represent the indexes of two cells. If cell i and cell j are assigned to the same TA, dij = 0, otherwise dij = 1. k ks sn n 1m + represents the traffic flow between cell ksn and cell ksn 1+
on type k roads. The average traffic flow on each road can be estimated by statistical methods in real situations. User traffic flow on each road for rush hour would normally be used to obtain results compatible with good quality of service. In our simulations, we assume that average user traffic flow on each type of road over rush hour is subject to uniform distributions over certain intervals. Other distributions can also be easily applied to simulate the traffic flow on each type of road with-out disturbing the applicability of the proposed model and optimization procedures.
The second objective of the model is to minimize the paging cost. When the network search for a UE, it pages the TA where the UE is registered. The paging cost of cell i can be measured by its paging load pi) , which is determined not only by the cost of paging the mobile users in cell i, but also the cost of paging the other users belonging to the TA where cell i is contained. pi) can be calculated by ( )p p p d1
ji i j ij= + -) / , where pi and pj
represent the paging load generated by the UEs in cell i and cell j, respectively. dij has the same meaning with above description. Generally speaking, it is independent of whether a UE is called, and the paging cost generated by each cell is also independent. Thus, the total paging cost of the whole network should be the summation of the total paging costs of the N cells:
( ( )) .f p p p d1pc ii
N
i j ijji
N
1 1
= = + -)
= =
/ // (2)
In addition to the two objectives, there are also many con-straints that the model should satisfy, as described here. For the sake of readability of the section, the following notations are used:
xq1
0cell is assigned to MME otherwise
iiq = '
y10
cell and cell are adjacentotherwise
i jij = '
h
l10
cell is assigned to TAotherwise.
iih = '
More explicitly, our multi-objective TA planning model is:
imize( )
,minf d
f p p d1
lc k k k kn
N
sS
kK
pc i j ijjiN
1
1
11
1
s s s s
kkn n n n
s
1 1m=
= + -=
-
==
=
+ +
` j*
///// (3)
subject to the following constraints:1) Each cell must be assigned to exactly one MME.
, .x i1iqq
6=/ (4)
2) Each cell must be assigned to exactly one TA.
, .l i1ihh
6=/ (5)
3) Each MME must be assigned to the TA to which its cor-responding cell is assigned.
,
, .
l l
x x h q
1
1
If
then
ihh
jh
iqq
jq 6 6
=
=
// (6)
4) The paging capacity of each BS must not be exceeded.
, ,p P iiBS 61) (7)
where p) is the total paging load in TA i.5) The paging traffic capacity of each MME must not be
exceeded.
, ,x p T qMMEiq
ii 61/ (8)
where pi represents the traffic load in cell i.
The calculation of location update cost between different TAs is therefore transformed into counting the average traffic flow on each grade of road crossing the TA boundaries.
34 ieee Computational intelligenCe magazine | February 2017
6) Adjacent cells not sharing a boundary crossing should be assigned to different TAs.
,
,y
l l0 1
0If andthen
ij ij
ihh
jh
m = =
=/ (9)
where ijm is the traffic flow between cell i and cell j. It is worth noting that rationality of this constraint is based on the assump-tion that each cell has at least one road connected to other cells.
IV. An EMO Algorithm Based on the M2M Decomposition for the Multi-objective TA Planning Model
A. Encoding MethodWhen applying an EMO algorithm to the proposed model, we first need to properly encode the solutions (TA configurations). The encoding scheme (or representation) is an important aspect of an EMO algorithm, especially for a discrete optimiza-tion problem. The crossover, mutation and selection of the individuals are realized in terms of representations. In this paper, a new encoding scheme inspired by the four-color theo-rem is designed to encode and decode the solutions. In mathe-
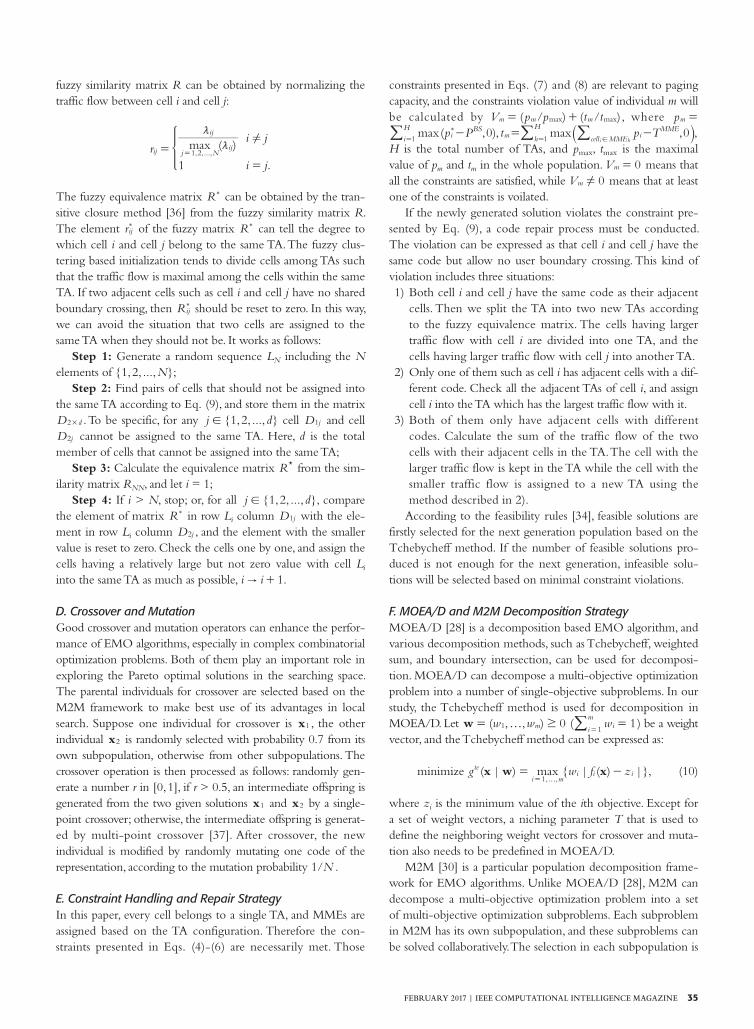
matics, the four-color theorem can be stated as: no more than four colors are needed to color all the regions of the plane so that no two adjacent regions have the same color for any given contiguous regions [33]. According to this theorem, a fixed length representation vector, which is encoded by only four numbers , , , 1 2 3 4 , with a size equal to the number of cells in the network, are used to encode the solutions. The ith code in the representation represents the ith cell in the network. Cells with the same code should be grouped together when decod-ing the representations. Fig. 3 gives an example of the repre-sentation for a network with ten cells.
This representation corresponds to a rough TA configura-tion in an LTE network without considering any constraints. It means that cells 1, 2, 10, cells 3, 5, 7, cells 4, 6, and cells 8, 9 should be grouped respectively, to form four different TAs.
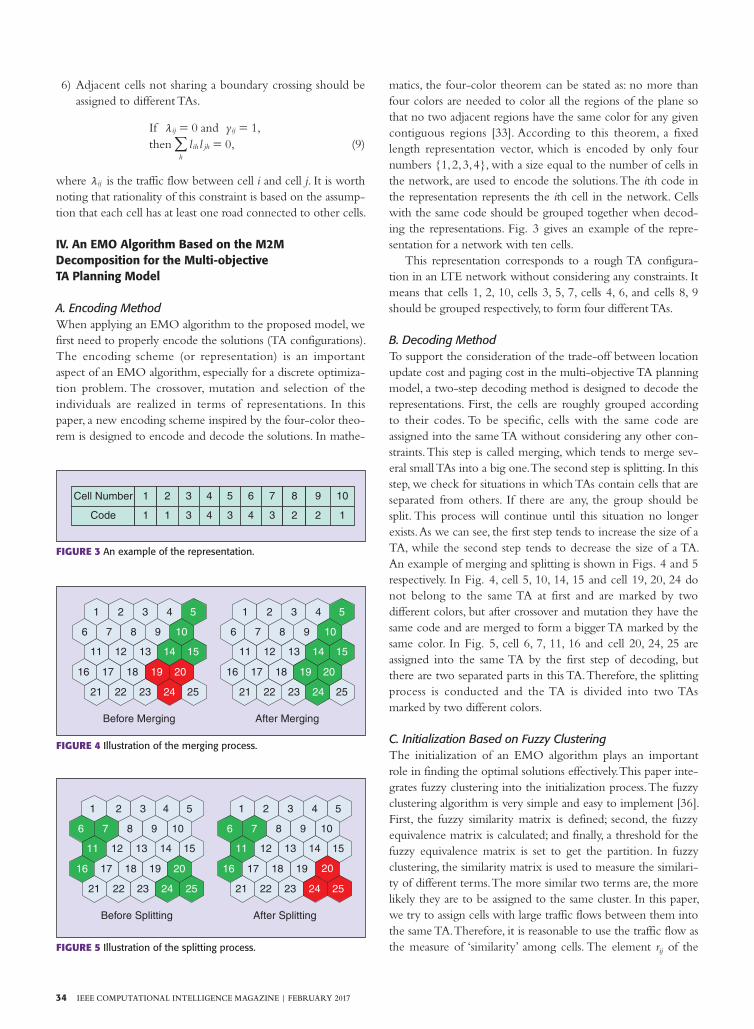
B. Decoding MethodTo support the consideration of the trade-off between location update cost and paging cost in the multi-objective TA planning model, a two-step decoding method is designed to decode the representations. First, the cells are roughly grouped according to their codes. To be specific, cells with the same code are assigned into the same TA without considering any other con-straints. This step is called merging, which tends to merge sev-eral small TAs into a big one. The second step is splitting. In this step, we check for situations in which TAs contain cells that are separated from others. If there are any, the group should be split. This process will continue until this situation no longer exists. As we can see, the first step tends to increase the size of a TA, while the second step tends to decrease the size of a TA. An example of merging and splitting is shown in Figs. 4 and 5 respectively. In Fig. 4, cell 5, 10, 14, 15 and cell 19, 20, 24 do not belong to the same TA at first and are marked by two different colors, but after crossover and mutation they have the same code and are merged to form a bigger TA marked by the same color. In Fig. 5, cell 6, 7, 11, 16 and cell 20, 24, 25 are assigned into the same TA by the first step of decoding, but there are two separated parts in this TA. Therefore, the splitting process is conducted and the TA is divided into two TAs marked by two different colors.
C. Initialization Based on Fuzzy ClusteringThe initialization of an EMO algorithm plays an important role in finding the optimal solutions effectively. This paper inte-grates fuzzy clustering into the initialization process. The fuzzy clustering algorithm is very simple and easy to implement [36]. First, the fuzzy similarity matrix is defined; second, the fuzzy equivalence matrix is calculated; and finally, a threshold for the fuzzy equivalence matrix is set to get the partition. In fuzzy clustering, the similarity matrix is used to measure the similari-ty of different terms. The more similar two terms are, the more likely they are to be assigned to the same cluster. In this paper, we try to assign cells with large traffic flows between them into the same TA. Therefore, it is reasonable to use the traffic flow as the measure of ‘similarity’ among cells. The element rij of the
Before Splitting After Splitting
1 2 3 4 5
6 7 8 9 10
11 12 13 14 15
16 17 18 19 20
21 22 23 24 25
1 2 3 4 5
6 7 8 9 10
11 12 13 14 15
16 17 18 19 20
21 22 23 24 25
FigUrE 5 Illustration of the splitting process.
Before Merging After Merging
1 2 3 4 5
6 7 8 9 10
11 12 13 14 15
16 17 18 19 20
21 22 23 24 25
1 2 3 4 5
6 7 8 9 10
11 12 13 14 15
16 17 18 19 20
21 22 23 24 25
FigUrE 4 Illustration of the merging process.
Cell Number 1 2 3 4 5 6 7 8 9 10
Code 1 1 3 4 3 4 3 2 2 1
FigUrE 3 An example of the representation.
February 2017 | ieee Computational intelligenCe magazine 35
fuzzy similarity matrix R can be obtained by normalizing the traffic flow between cell i and cell j:
( )
.
maxri j
i j1, ,...,ij j N
ij
ij
1 2
!m
m
=
==*
The fuzzy equivalence matrix R) can be obtained by the tran-sitive closure method [36] from the fuzzy similarity matrix R. The element rij) of the fuzzy matrix R) can tell the degree to which cell i and cell j belong to the same TA. The fuzzy clus-tering based initialization tends to divide cells among TAs such that the traffic flow is maximal among the cells within the same TA. If two adjacent cells such as cell i and cell j have no shared boundary crossing, then Rij
) should be reset to zero. In this way, we can avoid the situation that two cells are assigned to the same TA when they should not be. It works as follows:
Step 1: Generate a random sequence LN including the N elements of , , ..., N1 2 ;
Step 2: Find pairs of cells that should not be assigned into the same TA according to Eq. (9), and store them in the matrix D d2# . To be specific, for any , , ..., j d1 2! cell D j1 and cell D j2 cannot be assigned to the same TA. Here, d is the total member of cells that cannot be assigned into the same TA;
Step 3: Calculate the equivalence matrix R* from the sim-ilarity matrix RNN, and let i = 1;
Step 4: If i > N, stop; or, for all , , ..., j d1 2! , compare the element of matrix R) in row Li column D j1 with the ele-ment in row Li column D j2 , and the element with the smaller value is reset to zero. Check the cells one by one, and assign the cells having a relatively large but not zero value with cell Li into the same TA as much as possible, i i 1" + .
D. Crossover and MutationGood crossover and mutation operators can enhance the perfor-mance of EMO algorithms, especially in complex combinatorial optimization problems. Both of them play an important role in exploring the Pareto optimal solutions in the searching space. The parental individuals for crossover are selected based on the M2M framework to make best use of its advantages in local search. Suppose one individual for crossover is x1 , the other individual x2 is randomly selected with probability 0.7 from its own subpopulation, otherwise from other subpopulations. The crossover operation is then processed as follows: randomly gen-erate a number r in [ , ]0 1 , if r > 0.5, an intermediate offspring is generated from the two given solutions x1 and x2 by a single-point crossover; otherwise, the intermediate offspring is generat-ed by multi-point crossover [37]. After crossover, the new individual is modified by randomly mutating one code of the representation, according to the mutation probability /N1 .
E. Constraint Handling and Repair StrategyIn this paper, every cell belongs to a single TA, and MMEs are assigned based on the TA configuration. Therefore the con-straints presented in Eqs. (4)-(6) are necessarily met. Those
constraints presented in Eqs. (7) and (8) are relevant to paging capacity, and the constraints violation value of individual m will be calculated by (V maxmax mm m= / ) ( / )t tp p + , where pm =
( , , ,max maxt p T 0MMEcell MMEi
BSi
Hm h
Hi1 1 i h
= -)
!= =, )p P 0- ` j/ / /
H is the total number of TAs, and pmax, tmax is the maximal value of pm and tm in the whole population. V 0m = means that all the constraints are satisfied, while V 0m ! means that at least one of the constraints is voilated.
If the newly generated solution violates the constraint pre-sented by Eq. (9), a code repair process must be conducted. The violation can be expressed as that cell i and cell j have the same code but allow no user boundary crossing. This kind of violation includes three situations:1) Both cell i and cell j have the same code as their adjacent
cells. Then we split the TA into two new TAs according to the fuzzy equivalence matrix. The cells having larger traffic flow with cell i are divided into one TA, and the cells having larger traffic flow with cell j into another TA.
2) Only one of them such as cell i has adjacent cells with a dif-ferent code. Check all the adjacent TAs of cell i, and assign cell i into the TA which has the largest traffic flow with it.
3) Both of them only have adjacent cells with different codes. Calculate the sum of the traffic flow of the two cells with their adjacent cells in the TA. The cell with the larger traffic flow is kept in the TA while the cell with the smaller traffic flow is assigned to a new TA using the method described in 2).
According to the feasibility rules [34], feasible solutions are firstly selected for the next generation population based on the Tchebycheff method. If the number of feasible solutions pro-duced is not enough for the next generation, infeasible solu-tions will be selected based on minimal constraint violations.
F. MOEA/D and M2M Decomposition StrategyMOEA/D [28] is a decomposition based EMO algorithm, and various decomposition methods, such as Tchebycheff, weighted sum, and boundary intersection, can be used for decomposi-tion. MOEA/D can decompose a multi-objective optimization problem into a number of single-objective subproblems. In our study, the Tchebycheff method is used for decomposition in MOEA/D. Let ( , , )w w w 0m1 f $= ( w 1ii
m
1=
=/ ) be a weight
vector, and the Tchebycheff method can be expressed as:
imize ( | ) | ( ) |,x w xmin maxg w f z, ,
te
i mi i i
1= -
f= (10)
where zi is the minimum value of the ith objective. Except for a set of weight vectors, a niching parameter T that is used to define the neighboring weight vectors for crossover and muta-tion also needs to be predefined in MOEA/D.
M2M [30] is a particular population decomposition frame-work for EMO algorithms. Unlike MOEA/D [28], M2M can decompose a multi-objective optimization problem into a set of multi-objective optimization subproblems. Each subproblem in M2M has its own subpopulation, and these subproblems can be solved collaboratively. The selection in each subpopulation is
36 ieee Computational intelligenCe magazine | February 2017
independent, which means that each individual needs to only compete with its counterparts located in the same subpopula-tion in the process of selection. Therefore, infeasible solutions are more likely to survive than they would be in a
single-population algorithm because of less selection pressure. In this way, a certain number of good infeasible solutions will be kept to make the population search more effective. What is more, M2M has a strong capability to maintain the population diversity, which is desirable in multi-objective optimization.
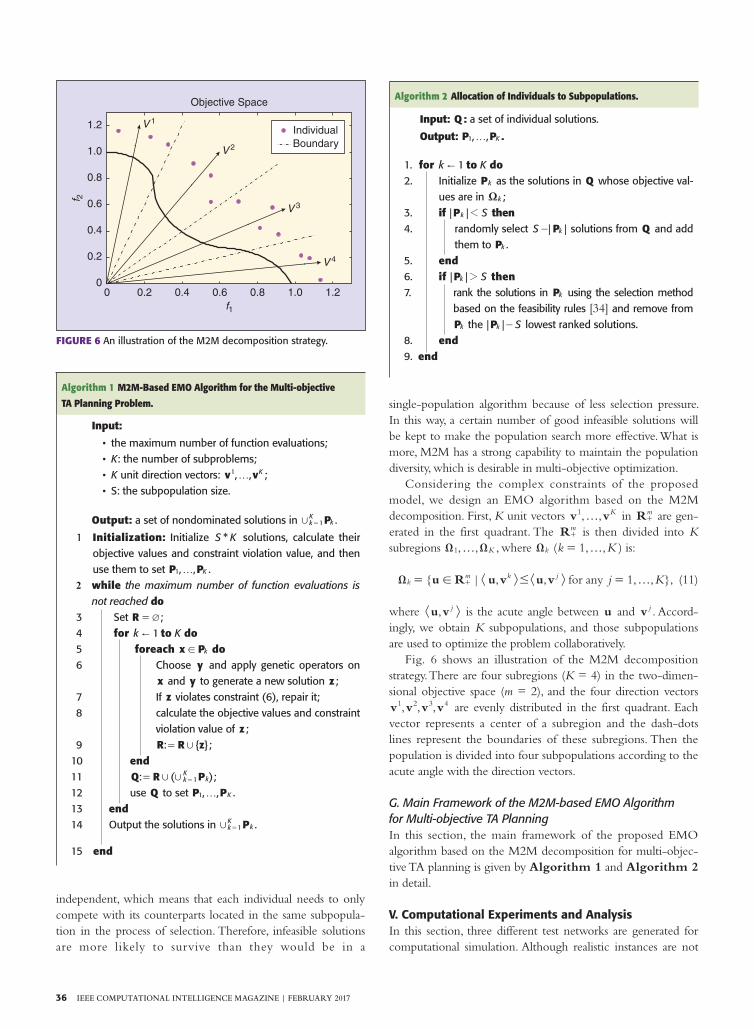
Considering the complex constraints of the proposed model, we design an EMO algorithm based on the M2M decomposition. First, K unit vectors , ,v vK1 f in Rm
+ are gen-erated in the first quadrant. The Rm
+ is then divided into K subregions , ,Ω ΩK1 f , where Ωk ( , ,k K1 f= ) is:
| , , , , ,u R u v u v j K1for anyΩkm k j f! #G H G H= =+ (11)
where ,u v jG H is the acute angle between u and v j . Accord-ingly, we obtain K subpopulations, and those subpopulations are used to optimize the problem collaboratively.
Fig. 6 shows an illustration of the M2M decomposition strategy. There are four subregions (K = 4) in the two-dimen-sional objective space (m = 2), and the four direction vectors , , ,v v v v1 2 3 4 are evenly distributed in the first quadrant. Each
vector represents a center of a subregion and the dash-dots lines represent the boundaries of these subregions. Then the population is divided into four subpopulations according to the acute angle with the direction vectors.
G. Main Framework of the M2M-based EMO Algorithm for Multi-objective TA PlanningIn this section, the main framework of the proposed EMO algorithm based on the M2M decomposition for multi-objec-tive TA planning is given by Algorithm 1 and Algorithm 2 in detail.
V. Computational Experiments and AnalysisIn this section, three different test networks are generated for computational simulation. Although realistic instances are not
0 0.2 0.4 0.6 0.8 1.0 1.20
0.2
0.4
0.6
0.8
1.0
1.2
Objective Space
f1
f 2
V 1
V 2
V 3
V 4
IndividualBoundary
FigUrE 6 An illustration of the M2M decomposition strategy.
Algorithm 1 M2M-Based EMO Algorithm for the Multi-objective
TA Planning Problem.
input:
• the maximum number of function evaluations; • K: the number of subproblems; • K unit direction vectors: v v, , K1 f ; • S: the subpopulation size.
Output: a set of nondominated solutions in PkK
k1, = .
1 initialization: Initialize *S K solutions, calculate their objective values and constraint violation value, and then use them to set P P, , K1 f .
2 while the maximum number of function evaluations is not reached do
3 Set r Q= ; 4 for k 1! to K do 5 foreach x Pk! do 6 Choose y and apply genetic operators on
x and y to generate a new solution z ; 7 If z violates constraint (6), repair it; 8 calculate the objective values and constraint
violation value of z ; 9 R R z: ,= ;10 end11 Q R P: ( )k
Kk1, ,= = ;
12 use Q to set P P, , K1 f .13 end14 Output the solutions in Pk
Kk1, = .
15 end
Algorithm 2 Allocation of individuals to Subpopulations.
input: Q : a set of individual solutions.
Output: P P, , K1 f .
1. for k 1! to K do2. Initialize Pk as the solutions in Q whose objective val-
ues are in kX ;3. if P| | Sk 1 then4. randomly select P| |S k- solutions from Q and add
them to Pk .5. end6. if P| | Sk 2 then7. rank the solutions in Pk using the selection method
based on the feasibility rules [34] and remove from Pk the P| | Sk - lowest ranked solutions.
8. end9. end

February 2017 | ieee Computational intelligenCe magazine 37
studied, the general principles of this study can provide useful reference to the realistic TA planning. The three test networks are all generated based on the principles which can reflect the true nature of realistic TA planning instances. Fig. 4 shows the network with a total of 25 cells (network 1), and the net-works with 30 cells (network 2) and 81 cells (network 3) have a similar structure to network 1. The numerical experiments conducted mainly have two goals:
Identify the effectiveness and rationality of the proposed multi-objective TA planning model.
Show the effectiveness of the M2M-based EMO algorithm to solve the proposed model.For the first goal, a single-objective model proposed by
Subrata and Zomaya [8] is used as a comparison. The same assumptions and parameters of the three networks are used to ensure fair comparisons. The single-objective model established in [8] combines location update cost and paging cost to form a single-objective by the weighted sum method, where the cost of a location update is considered to be ten times more than that of a paging. Three artificial intelligence techniques: SA, TS and EA are developed and applied in [8]. In our study, the EA is applied to their model and serves as a contrast. As is well known, the quality of solutions found by an EA can be highly related to the number of iterations (function evaluations) that the algorithm uses. To be fair, the algorithms for the two mod-els were both executed until the same maximum number of function evaluations are reached. For the second goal, we com-pare the results obtained by solving the proposed TA planning model using M2M to MOEA/D.
A. The Parameters of the NetworksIn our model, the road traffic density distributions of the three networks are known in advance. We generate the traffic flow of each road according to its type by sampling from uniform dis-tributions for the three networks to simulate the real situation. The cells crossed by each road and the limits of the traffic dis-tributions for each type of roads are shown in Tables 1, 2 and 3.
The other control parameters are defined as follows: The paging capacity of each cell: /P s28BS = . The telephone traffic load capacity of each MME:
/P s1500MME = . The total paging pi of cell i is generated from a Poisson dis-tribution with rate parameter 6m = .
The population size is M = 100; the maximum number of function evaluations is M500 ) for the 5 × 5 and 5 × 6 networks; maximum function evaluations is , M1 000 ) for the 9 × 9 network.
The number of the subproblems is K = 10, and the size of each subpopulation is S = 10.
B. Experimental Results and AnalysisTen different groups of parameters for each network are gen-erated for simulation to show the universality of the proposed model. For direct comparison, the weighted sum of the
TABlE 2 The road traffic density distributions in the 5 × 6 network.
rOAd TyPE
NUMBEr TrAFFic FlOw
cEllS crOSSEd By rOAdS
1. MAIn rOAd
4 [200, 400] 3, 8, 13, 18, 22, 23, 24, 29, 30
26, 21, 16, 17, 18, 19, 20, 25
5, 10, 14, 19, 23, 28
3, 4, 10, 15
2. STreeT 7 [100, 250] 8, 3, 4, 5
3, 8, 12, 11
5, 10, 15
11, 12, 18, 23, 28
6, 21, 16, 11
16, 17, 12
26, 27
3. Alley 4 [50, 150] 8, 13, 19, 23, 28, 27
1, 2, 3, 8, 9
7, 4, 5, 9
11, 12, 13
TABlE 1 The road traffic density distributions in the 5 × 5 network.
rOAd TyPE
NUMBEr TrAFFic FlOw
cEllS crOSSEd By rOAdS
1. MAIn rOAd
4 [200, 400] 11, 12, 17, 22, 23, 24, 25
21, 22, 18, 14, 15
5, 9, 13, 18, 23
3, 8, 9, 10
2. STreeT 7 [100, 250] 2, 3, 4, 5
3, 8, 13, 18
4, 8, 12
9, 10, 15, 20, 24
17, 13, 14, 10
18, 19, 15
19, 23
3. Alley 4 [50, 150] 6, 11, 16, 21, 22
2, 7
8, 4, 5
11, 12, 13
The three test networks are all generated based on the principles which can reflect the true nature of realistic TA planning instances.

38 ieee Computational intelligenCe magazine | February 2017
solutions obtained by solving the multi-objective model is calculated using the same weights of the single-objective model. The solution with the minimal weighted sum value is compared with the best solution found by the single-objec-
tive model. Tables 4, 5 and 6 present their location update cost, paging cost and their weighted sum cost for the ten dif-ferent groups of parameters. The results show that the multi-objective model can significantly outperform the single-objective model in terms of the weighted sum. It lives up to our expectation that multi-objective formulations for the TA planning problem are more effective than the sin-gle-objective model.
A multi-objective optimization problem has a set of Pareto optimal solutions, and their images in the objective space are called Pareto Front (PF). The convergence of an EMO algo-rithm can be measured by the closeness of its obtained solu-tions to the PF. Since each element of PF represents a trade-off among the objectives, the diversity along the PF is also impor-tant when measuring the quality of obtained solutions. In our experiments, the quality of obtained solutions by EMO algo-rithms is measured by the HyperVolume (HV)-metric which can measure the convergence to the PF and the diversity along the PF at the same time [38]. Let ( , , )y yy m1 f=) ) ) be a refer-ence point in the objective space which is dominated by any point in the PF, and S be a set of obtained approximation to the PF. Then the HV-metric value of S (with regard to the ref-erence point )y) is the volume of the region which is domi-nated by S and dominates .y) The reference point
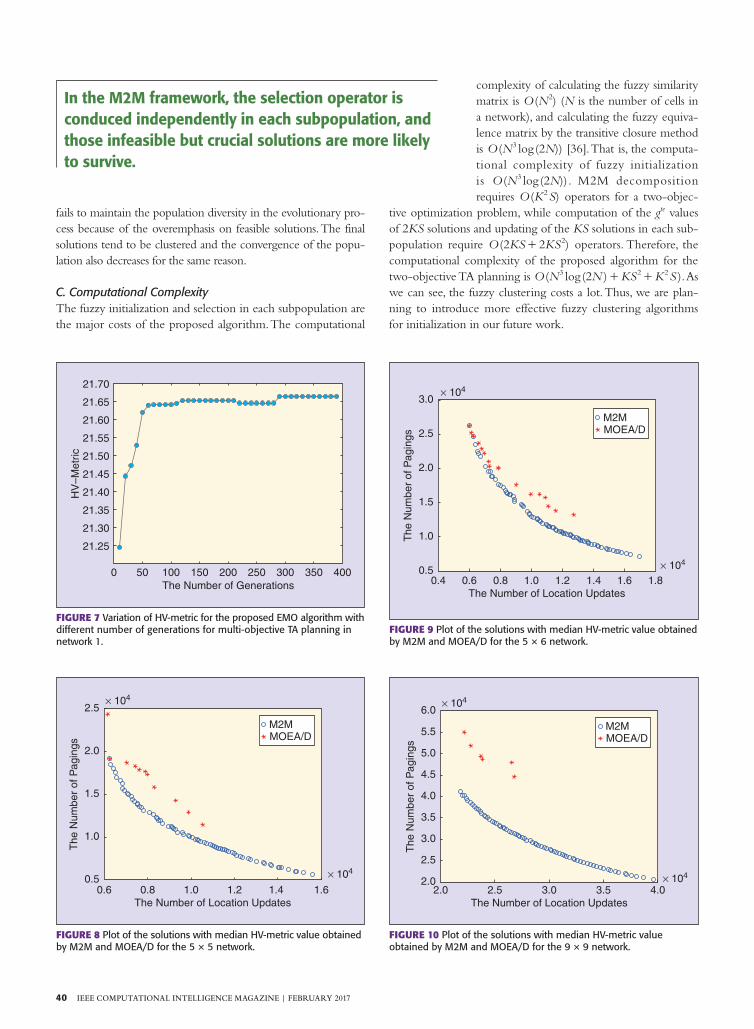
( , )8 10 3 10y 4 5) )=) is used in our study. The larger the HV-metric is, the better the algorithm performance is. Consider-ing the randomness of EMO algor ithms, M2M and MOEA/D both run 15 times for each test network. The best, worst, median, mean and standard deviation of HV-metric val-ues in the 15 independent runs for each network are shown in Table 7. It indicates that the solutions obtained by M2M have both better convergence and diversity than MOEA/D in terms of the HV-metric. To investigate the sensitivity of solu-tions quality to the setting of maximum number of genera-tions, we plot the HV-metric of solutions obtained by the proposed algorithm with different number of generations for network 1 in Fig. 7.
TABlE 4 The Location Update Cost (LUC), Paging Cost (PC) and Weight Sum Cost (WSC) of network 1 for 10 groups of test parameters.
NETwOrk 1 MUlTi-OBjEcTivE MOdEl SiNglE-OBjEcTivE MOdEl
grOUP lUc Pc wSc lUc Pc wSc
1 6550 16996 82496 6680 23579 90379
2 6220 19569 81769 5958 22583 82163
3 5526 25999 81259 8114 17573 98713
4 5682 21991 78811 6656 17112 83672
5 5024 21272 71512 5730 24587 81887
6 6004 18638 78678 7736 16697 94057
7 6214 23456 85596 5862 24360 82980
8 5462 22799 77419 6904 18388 87428
9 4802 26519 74539 5968 24574 84254
10 5554 19359 74899 6120 25043 86243
TABlE 3 The road traffic density distributions in the 9 × 9 network.
rOAd TyPE
NUMBEr TrAFFic FlOw
cEllS crOSSEd By rOAdS
1. MAIn rOAd
4 [200, 400] 10, 11, 12, 21, 22, 23,
24, 25, 26, 35, 44, 54, 63
9, 8, 17, 25, 24, 34, 51,
59, 68, 76, 75, 74, 73
5, 14, 22, 31, 40,
41, 42, 51, 60, 70, 71, 80
3, 13, 21, 30, 39, 38, 47, 55, 64
2. STreeT 7 [100, 250] 2, 3, 4, 5, 6, 7, 8, 9
3, 12, 20, 19, 28, 29,
37, 46
6, 15, 23, 32, 40, 41
33, 34, 35, 44, 53, 61, 62
59, 51, 42, 34, 35, 36, 27, 18
77, 69, 60, 61, 53, 43, 44, 45
50, 49, 57, 66, 74, 75
3. Alley 7 [50, 150] 28, 37, 46, 47, 48, 56, 55,
64, 73
1, 2, 3, 12, 20, 30, 31, 32
16, 7, 8, 9
55, 56, 57, 58, 59, 60, 52
65, 66, 67, 76
78, 70, 71, 72
79, 80, 81

February 2017 | ieee Computational intelligenCe magazine 39
It is clear that the proposed algorithm is not very sensitive to the setting of maximum number of generations since its HV-metric is very stable after 300 generations of evolution.
Figs. 8-10 plot the distributions of the solutions with the median HV-metric obtained by M2M versus MOEA/D (not using the M2M decomposition strategy) for the three networks. From these figures, we can compare the convergence and diversi-ty of the solutions obtained by M2M and MOEA/D in an intui-tive way. Obviously, M2M using the population decomposition
strategy outperforms MOEA/D both in convergence and diver-sity. It is because of the M2M population strategy that the infor-mation of infeasible solutions can be fully utilized to guide the population search. Since the TA planning problem has a lot of complex constraints, some infeasible solutions can be very crucial during the evolutionary process. In the M2M framework, the selection operator is conduced independently in each subpopula-tion, and those infeasible but crucial solutions are more likely to survive. The algorithm without the M2M population strategy
TABlE 7 Best, worst, median, mean, and standard deviation of HV-metric values obtained by M2M and MOEA/D in 15 independent runs for each network.
neTwOrk AlgOrIThM BeST wOrST MedIAn MeAn STd
1 M2M 22.0228 21.3033 21.69178 21.68115 0.194377
MOeA/d 21.6442 21.0631 21.33346 21.33535 0.210806
2 M2M 21.6862 21.1803 21.41088 21.39275 0.188406
MOeA/d 21.3409 20.5926 20.93512 20.9217 0.272798
3 M2M 18.4156 17.7834 18.10996 18.14175 0.194861
MOeA/d 17.6228 17.0018 17.32225 17.3455 0.204509
TABlE 5 The Location Update Cost (LUC), Paging Cost (PC) and Weight Sum Cost (WSC) of network 2 for 10 groups of test parameters.
NETwOrk 2 MUlTi-OBjEcTivE MOdEl SiNglE-OBjEcTivE MOdEl
grOUP lUc Pc wSc lUc Pc wSc
1 5994 26235 86175 5994 26235 86175
2 6372 21159 84879 7648 18019 94499
3 6258 24310 86890 9086 17267 108127
4 6576 24512 90272 7566 19440 95100
5 6816 23519 91679 6928 23736 93016
6 6410 23014 87114 6992 25375 95295
7 7212 21704 93824 6934 21210 90550
8 5762 26430 84050 7868 18321 97001
9 7090 21038 91938 8338 21322 104702
10 7346 21217 94677 10080 15132 115932
TABlE 6 The Location Update Cost (LUC), Paging Cost (PC) and Weight Sum Cost (WSC) of network 3 for 10 groups of test parameters.
NETwOrk 3 MUlTi-OBjEcTivE MOdEl SiNglE-OBjEcTivE MOdEl
grOUP lUc Pc wSc lUc Pc wSc
1 16148 70297 231777 18210 57814 239914
2 15274 50119 202859 18738 55787 243167
3 14238 54597 196977 17596 54089 230049
4 14490 60501 205401 19330 60836 254136
5 15114 54757 205897 18288 60033 242913
6 13762 50298 187918 18576 60557 246317
7 13872 57336 196056 18572 54191 239911
8 15274 50119 202859 18378 60369 244149
9 14238 54597 196977 17776 61728 239488
10 14490 60501 205401 17446 63466 237926
40 ieee Computational intelligenCe magazine | February 2017
fails to maintain the population diversity in the evolutionary pro-cess because of the overemphasis on feasible solutions. The final solutions tend to be clustered and the convergence of the popu-lation also decreases for the same reason.
C. Computational ComplexityThe fuzzy initialization and selection in each subpopulation are the major costs of the proposed algorithm. The computational
complexity of calculating the fuzzy similarity matrix is ( )O N2 (N is the number of cells in a network), and calculating the fuzzy equiva-lence matrix by the transitive closure method is ( ( ))logO N N23 [36]. That is, the computa-tional complexity of fuzzy initialization is ( ( ))logO N N23 . M2M decomposition requires ( )O K S2 operators for a two-objec-
tive optimization problem, while computation of the gte values of 2KS solutions and updating of the KS solutions in each sub-population require ( )O KS KS2 2 2+ operators. Therefore, the computational complexity of the proposed algorithm for the two-objective TA planning is ( (logO N N23 2 2) KS K S+ + ). As we can see, the fuzzy clustering costs a lot. Thus, we are plan-ning to introduce more effective fuzzy clustering algorithms for initialization in our future work.
0 50 100 150 200 250 300 350 400
21.25
21.30
21.35
21.40
21.45
21.50
21.55
21.60
21.65
21.70
The Number of Generations
HV
–Met
ric
FigUrE 7 Variation of hV-metric for the proposed eMO algorithm with different number of generations for multi-objective TA planning in network 1.
0.5
1.0
1.5
2.0
2.5
M2MMOEA/D
× 104
× 104
0.6 0.8 1.0 1.2 1.4 1.6The Number of Location Updates
The
Num
ber
of P
agin
gs
FigUrE 8 Plot of the solutions with median hV-metric value obtained by M2M and MOeA/d for the 5 × 5 network.
0.5
1.0
1.5
2.0
2.5
3.0
× 104
× 104
0.4 0.6 0.8 1.0 1.2 1.4 1.6 1.8The Number of Location Updates
The
Num
ber
of P
agin
gsM2MMOEA/D
FigUrE 9 Plot of the solutions with median hV-metric value obtained by M2M and MOeA/d for the 5 × 6 network.
2.0 2.5 3.0 3.5 4.0× 104
× 104
2.0
2.5
3.0
3.5
4.0
4.5
5.0
5.5
6.0
The Number of Location Updates
The
Num
ber
of P
agin
gs
M2MMOEA/D
FigUrE 10 Plot of the solutions with median hV-metric value obtained by M2M and MOeA/d for the 9 × 9 network.
In the M2M framework, the selection operator is conduced independently in each subpopulation, and those infeasible but crucial solutions are more likely to survive.

February 2017 | ieee Computational intelligenCe magazine 41
VI. ConclusionIn this paper, a novel constrained multi-objective model for TA planning is proposed. The geographic information-based multi-objective model has demonstrated its potential to significantly reduce both the location update cost and paging cost in com-parison with the results of a single-objective TA planning model. Moreover, it can also provide a set of solutions for deci-sion makers to select from, so as to make the TA planning more flexible and adaptable to real-world circumstances. An EMO algorithm based on the M2M decomposition strategy is designed to solve the model. Fuzzy clustering based on the geographic information is applied for initialization to enhance the exploration. A specially designed coding method based on the four-color theorem is utilized to encode and decode the solutions. The experimental results have shown not only the validity of the proposed multi-objective model, but also the effectiveness of the M2M decomposition strategy to solve this multi-objective constrained optimization model.
AcknowledgmentThis work was supported in part by Natural Science Founda-tion of China (61673121, 61332002 and 61175073), in part by the Natural Science Foundation of Guangdong Province (2014A030313507), and in part by the Projects of Science and Technology of Guangzhou (2014J4100209, 201508010008).
References[1] S. Sesia, I. Toufik, and M. Baker, LTE: The UMTS Long Term Evolution. New York: Wiley, 2009.
[2] R. Subrata and A. Y. Zomaya, “Location management in mobile computing: A sur-vey,” Parallel Computing Research Lab, Univ. Western Australia, Tech. Rep. 2001.
[3] T. Deng, X. Wang, P. Fan, and K. Li, “Modeling and performance analysis of tracking area list-based location management scheme in LTE networks,” IEEE Trans. Veh. Technol., vol. 65, no. 8, pp. 6417-6431, Aug. 2016.
[4] M. Munguia-Macario, D. Munoz-Rodriguez, and C. Molina, “Optimal adaptive lo-cation area design and inactive location areas,” in Proc. 47th IEEE Vehicular Technology Conf., May 1997, pp. 510–514.
[5] N. B. Prajapati, R. R. Agravat, and M. I. Hasan, “Simulated annealing for loca-tion area planning in cellular networks,” Applicat. Graph Theory Wireless Ad Hoc Networks. Sensor Networks, vol. 2, no. 1, pp. 1–7, Mar. 2010.
[6] I. Demirkol, C. Ersoy, and M. U. Caglayan, “Location area planning and cell-to-switch assignment in cellular networks,” IEEE Trans. Wireless Commun., vol. 3, no. 3, pp. 880–890, May 2004.
[7] A. Abutaleb and V. O. K. Li, “Paging strategy optimization in personal communica-tion systems,” Wireless Networks, vol. 3, no. 3, pp. 195–204, Aug. 1997.
[8] R. Subrata and A. Y. Zomaya, “A comparison of three artif icial life techniques for reporting cell planning in mobile computing,” IEEE Trans. Parallel Distrib. Syst., vol. 14, no. 2, pp. 142–153, Feb. 2003.
[9] R. Subrata and A. Y. Zomaya, “Evolving cellular automata for location management in mobile computing networks,” IEEE Trans. Parallel Distrib. Syst., vol. 14, no. 1, pp. 13–26, Jan. 2003.
[10] D. W. Tcha, T. J. Choi, and Y. S. Myung, “Location-area partition in a cellular radio network,” J. Oper. Res. Soc., vol. 48, pp. 1076–1081, Nov. 1997.
[11] T. Ozugur, “Multiobjective hierarchical location and routing area optimization in GPRS and UMTS networks,” in Proc. IEEE Int. Conf. Communications, New York, Apr. 2002, pp. 579–584.
[12] I. Demirkol, C. Ersoy, M. U. Caglayan, and H. Delic, “Location area planning in cel-lular networks using simulated annealing,” in Proc. 20th Annu. Joint Conf. IEEE Computer Communications, Apr. 2001, pp. 13–20.
[13] V. Berrocal-Plaza, M. A. Vega-Rodriguez, J. M. Sanchez-Perez, and J. A. Gomez-Pulido, “Solving the location areas problem with strength pareto evolutionary algo-rithm,” in Proc. 13th IEEE Int. Symp. Computational Intelligence and Informatics, Budapest, Nov. 2012, pp. 49–54.
[14] S. R. Parija, P. K. Sahu, and S. S. Singh, “Evolutionary algorithm for cost reduction in cellular network,” in Proc. Annu. IEEE India Conf., Dec. 2014, pp. 1–6.
[15] T. Wang, S. Hwang, and C. Tseng, “Registration area planning for PCS networks using genetic algorithms,” IEEE Trans. Veh. Technol., vol. 47, no. 3, pp. 987–995, Aug. 1998.
[16] P. R. L. Gondim, “Genetic algorithms and the location area partitioning problem in cellular networks,” in Proc. 46th IEEE Vehicular Technology Conf., Apr. 1996, pp. 1835–1838.
[17] J. Plehn, “The design of location areas in a GSM-network,” in Proc. 45th IEEE Vehicu-lar Technology Conf, July 1995, pp. 871–875.
[18] P. Demestichas, N. Georgantas, E. Tzifa, V. Demesticha, M. Striki, M. Kilani-oti, and M. Theologou, “Computationally eff icient algorithms for location area planning in future cellular systems,” Comput. Commun., vol. 23, pp. 1263–1280, July 2000.
[19] M. Toril, S. Luna-Ramirez, and V. Wille, “Automatic replanning of tracking areas in cellular networks,” IEEE Trans. Veh. Technol., vol. 62, no. 5, pp. 2005–2013, June 2013.
[20] S. Ikeda, N. Kami, and T. Yoshikawa, “A tracking area list configuration method to mitigate burst location updates,” in Proc. 5th IEEE Int. Conf. Consumer Electronics, 2014, pp. 258–263.
[21] C. Y. Lee, S. J. Kim, and T. Park, “A design of multi-layered location registration areas in microcellular systems,” Telecommun. Syst., vol. 14, no. 1, pp. 107–120, Aug. 2000.
[22] E. Cayirci and I. F. Akyildiz, “Optimal location area design to minimize registra-tion signaling traff ic in wireless systems,” IEEE Trans. Mobile Comput., vol. 2, no. 1, pp. 76–85, Apr. 2003.
[23] S. Krichen, O. Abdelkhalek, and A. Guitouni, “A bi-objective location area plan-ning for wireless phone network,” Int. J. Appl. Decis. Sci., vol. 5, no. 4, pp. 342–369, 2012.
[24] S. M. Razavia, D. Yuan, F. Gunnarssonb, and J. Moeb, “Performance and cost trade-off in tracking area reconfiguration: A pareto-optimization approach,” Comput. Networks, vol. 56, no. 1, pp. 157–168, Jan. 2012.
[25] C. H. Park and S. Soni, “A simulated annealing based solution approach for the two-layered location registration and paging areas partitioning problem in cellular mobile networks,” Eur. J. Oper. Res., vol. 178, no. 2, pp. 579–594, Apr. 2007.
[26] K. Deb, A. Pratap, S. Agarwal, and T. Meyarivan, “A fast and elitist multiobjective genetic algorithm: NSGA-II,” IEEE Trans. Evol. Comput., vol. 6, no. 2, pp. 182–197, Apr. 2002.
[27] J. L. Dprn and S. R. Ranjithan, “Evolutionary multiobjective optimization in water-shed water quality management,” in Proc. EMO, Apr. 2003, pp. 692–706.
[28] Q. Zhang and H. Li, “MOEA/D: A multiobjective evolutionary algorithm based on decomposition,” IEEE Trans. Evol. Comput., vol. 11, no. 6, pp. 712–731, Dec. 2007.
[29] Z. Feng, Q. Zhang, Q. Tang, T. Yang, and J. Ge, “Control-structure integrated multiobjective design for f lexible spacecraft using MOEA/D,” Struct. Multidiscip. Optim., vol. 50, no. 2, pp. 347–362, Feb. 2014.
[30] H.-L. Liu, F. Gu, and Q. Zhang, “Decomposition of a multiobjective optimization problem into a number of simple multiobjective subproblems,” IEEE Trans. Evol. Comput., vol. 18, no. 3, pp. 450–455, Jun. 2014.
[31] H.-L. Liu, F. Gu, Y. Cheung, and S. Xie, “On solving WCDMA network planning using iterative power control scheme and evolutionary multiobjective algorithm,” IEEE Comput. Intell. Mag., vol. 9, no. 1, pp. 44–52, Feb. 2014.
[32] H. Ishibuchi, N. Akedo, and Y. Nojima, “Behavior of multiobjective evolutionary algorithms on many-objective knapsack problems,” IEEE Trans. Evol. Comput., vol. 19, no. 2, pp. 264–283, Apr. 2015.
[33] N. Robertson, D. Sanders, P. Seymour, and R. Thomas, “The four-colour theorem,” J. Combin. Theory, vol. 70, no. 1, pp. 2–44, May 1997.
[34] K. Deb, “An eff icient constraint handling method for genetic algorithms,” Comput. Methods Appl. Mech. Eng., vol. 186, no. 2–4, pp. 311–338, June 2000.
[35] K. Deb, Multi-Objective Optimization Using Evolutionary Algorithms. New York: Wiley, 2001.
[36] G. Deng, J. Li, and H. Li, “An algorithm for computing transitive openings of fuzzy similarity relation,” ICIC Express Lett., vol. 4, pp. 589–594, Apr. 2010.
[37] E. Santos, E. Hruschka, and N. Ebecken, “Evolutionary algorithm using random multi-point crossover operator for learning Bayesian network structures,” in Proc. Int. Conf. Machine Learning and Applications, Dec. 2010, pp. 430–435.
[38] E. Zitzler, “Evolutionary algorithms for multiobjective optimization: Methods and applications,” Ph.D. dissertation, Swiss Federal Inst. Technol. (ETH), Zurich, Switzer-land, 1999.