Embed Size (px)
Citation preview
Volume 6, Aug 2007 - Mar 2008Issue 2
Modeling the Round Earth through Diagramsby Shamin PadalkarHomi Bhabha Centre for Science Education, Tata Institute of Fundamental Research, IndiaJayashree RamadasHomi Bhabha Centre for Science Education, Tata Institute of Fundamental Research, IndiaReceived: 07/24/07, Revised: 10/31/07, Posted: 01/30/08
The Astronomy Education Review, Issue 2, Volume 6:54-74, 2008
© 2008, Shamin Padalkar. Copyright assigned to the Association of Universities for Research inAstronomy, Inc.
Abstract
Earlier studies have found that students, including adults, have problems understanding the scientificallyaccepted model of the Sun-Earth-Moon system and explaining day-to-day astronomical phenomena basedon it. We have been examining such problems in the context of recent research on visual-spatial reasoning.Working with middle school students in India, we have developed a pedagogical sequence to build themental model of the Earth and tried it in three schools for socially and educationally disadvantagedstudents. This pedagogy was developed on the basis of (1) a reading of current research in imagery andvisual-spatial reasoning and (2) students’ difficulties identified during the course of pretests andinterviews. Visual-spatial tools such as concrete (physical) models, gestures, and diagrams are usedextensively in the teaching sequence. The building of a mental model is continually integrated withdrawing inferences to understand and explain everyday phenomena. The focus of this article is inferencesdrawn with diagrams.
1. UNDERLYING THEORETICAL FRAMEWORK
A sound understanding of basic astronomical concepts calls for the building up of visual-spatial mentalmodels of the Earth (and other celestial objects) and explaining everyday phenomena with reasoning basedon these models. Such explanations of phenomena, such as the day-night cycle, seasons, and phases of theMoon, are fairly complex, requiring coordination of views from several points on Earth and from outsidethe Earth. Our interest is in studying such models and reasoning processes in middle school students.
Research in astronomy education has addressed students’ understanding of concepts such as the shape ofEarth and its position in the universe (Albanese, Danhoni Neves, & Vicentini 1997; Baxter 1991).Research also has identified early intuitive models consistent with local experience, such as flat Earth(Vosniadou & Brewer 1994), and models that are influenced by cultural cosmologies, such as an Earth
Citation: Padalkar, S. and Ramadas, J. (2008) Modeling the round earth through diagrams. Astronomy Education Review, 6 (2), 54-74.
floating in the sea (Samarapungavan, Vosniadou, & Brewer 1996). When exposed to scientific informationthat the Earth is round, students typically form a synthetic model, such as an ellipsoidal Earth or hollowEarth, or a dual-Earth model that includes a flat Earth and another spherical Earth in the sky (Vosniadou &Brewer 1994 ). By Grade 7, most students in urban literate environments have learned that we live on around Earth that is suspended in space. Even so, it is rare that students are able to use this model ininterpreting and reasoning about everyday phenomena.
Mental models in elementary astronomy are of a visual-spatial kind. The reasoning based on these modelsrequires abilities such as spatial visualization (the ability to imagine spatial forms and movements,including translation and rotations) and spatial orientation (perspective taking) (Hegarty & Waller 2004 ).In an earlier study on understanding phases of the Moon, we found that students of architecture and designwho were equipped with visualization and drawing tools were able to come up with correct explanationsfaster and more accurately than were physics postgraduates (Padalkar & Subramaniam 2007).
It is important to distinguish between reasoning used in the process of scientific discovery and that neededduring the process of learning. In scientific discovery, a model is built on the basis of observational data,along with reasoning that might be inductive, deductive, or abductive in nature. Model-based reasoning isan active area of research in science studies. The case of school learning is different. A rigorousevidence-based argument for the roundness of the Earth, requiring coordination of observations separatedspatially across the globe and temporally over days and months, is far too complex for, and perhaps notaccessible to, school-age students. Besides, such an argument is superfluous when most students at thislevel already "know" that the Earth is round and that it rotates about its axis. What is possible andmeaningful for students might be a pedagogical argument developed through real-life experience andvisual-spatial imagination, and reinforced through tools like concrete models, gestures, and diagrams.
2. USE OF CONCRETE MODELS, GESTURES, AND DIAGRAMSTOWARD BUILDING MENTAL MODELS
In this article, we present some observations from the first part of our study in elementary astronomy. Thispart concerns middle school students’ understanding of the Earth as a round, unsupported object in space,rotating about its axis and attracting objects toward itself because of gravity. Of these properties, our focushere is on the roundness (sphericity) of the Earth, with the other properties dealt with peripherally at thispoint. For a previous effort to develop a pedagogy for the Earth, see Vijapurkar (2007).
Concrete models are often used in the initial stages of instruction in elementary astronomy. In going fromqualitative descriptions to more rigorous reasoning and inference, one makes increasing use of schematicdiagrams. The link between the concrete model and the diagram, however, must be maintained for one tokeep testing the diagrammatic inferences against the physical situation. We found gestures to beparticularly useful for this purpose.
A frequently used sequence in our pedagogy has been concrete model (or activity)-gestures-diagrams,albeit with many variations on this basic theme. Thus, typically, a subconcept—for example, roundness,horizon, or size—was introduced through concrete experiences involving activities or concrete models (orsometimes gestures followed by concrete models).The aim then was to guide students from these concreteexperiences toward abstract diagrams through the intermediary use of gestures. This strategy was based onthe premise that spatial reasoning is facilitated by kinesthetic experience (Tversky 2005; Klatzky &Loomis 1998). We expected that once the diagrammatic representation made sense to the students, they
would be able to draw inferences on the basis of these diagrams. We conjecture that gestures might bemore abstract than concrete models, but they might be less abstract and more intuitive than diagrams.Gestures have some specific advantages over diagrams in being dynamic, three dimensional, and fluid. Ithas to be noted, however, that in everyday conversation, we use innumerable subtle gestures thatcontinually fill the gap between what we speak or draw, and what we mean. It would be difficult to noteall these gestures. First of all, they are so much part of the language (or the activity) that they may be usedalmost imperceptibly. Second, gestures may not have any meaning independent of the language or activitythat they support. Third, well-developed conventions to note gestures may not exist. Adequate treatment ofgestures would require a separate presentation giving due consideration to the dynamic and fluid nature ofgestures. In this article, we focus on diagrams, with only brief descriptions of the gestures.
In dealing with complex visual-spatial models of the kind used in elementary astronomy, one might usedrawings to reduce the working memory load while carrying out spatial visualization and spatialorientation tasks. Drawings enable us to organize information and exploit generalizations. By providingworkable mental models of actual or theoretical worlds, drawings reduce the complexity of reasoning(Tversky 2005). On the other hand, if drawings are ambiguous, contain extra information, or displayunfamiliar conventions, students may misinterpret them and develop alternative conceptions (Mishra 1999).
Drawings have a major advantage over gestures and body movements in that they are permanent overspace and time. Schematic diagrams have the further strength of analysis and abstraction, so they can beused as tools for an extended process of reasoning and inference. Two major limitations of diagrams in theastronomy context are that they are flat and static. Thus, even after schematization into diagrams, wecontinued to use gestures, in combination with diagrams, to make explicit the three-dimensional nature ofthe celestial objects, particularly the Earth. Later, in developing further the concept of rotation, we tookinto account the fact that static drawings have some inherent limitation for conveying motion. Motion isbetter internalized through concrete models, gestures, and body motion.
In the low-resource environment that prevails in these schools, concrete models, gestures, and diagramswere the best means for understanding the roundness of the Earth and deriving its consequences. Wepresent the diagrams and some of the questions that we posed during our intervention, which requiredstudents to draw conclusions based on their own diagrams.
3. CONTEXT OF THE STUDY
The teaching was carried out in three classes of Grade 7 students in three different schools. Two are ruralschools near Kolhapur, a small town, and the third is in a slum area of Mumbai. All three schools are inthe state of Maharashtra in India. One of the rural schools is a local school in a farming village, and theother is a residential school in the same region that serves children from nomadic tribes. There was a totalof 64 students in the three classes, 20 girls and 44 boys (see Table 1).
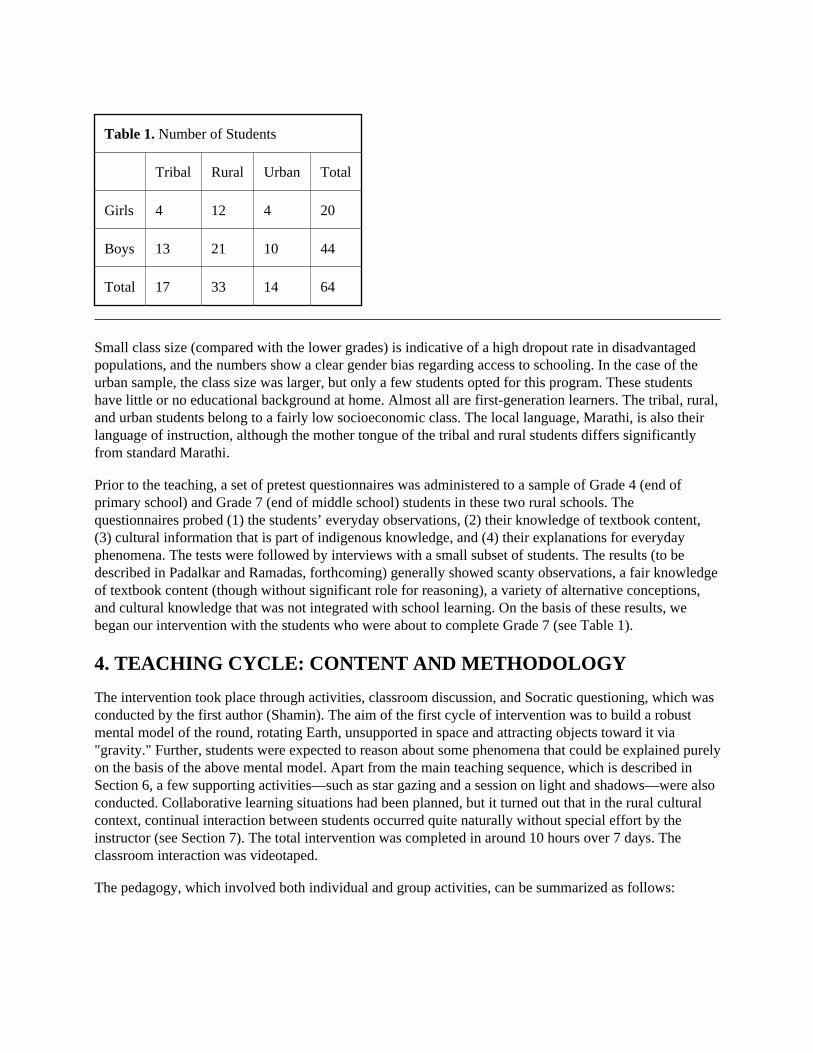
Table 1. Number of Students
Tribal Rural Urban Total
Girls 4 12 4 20
Boys 13 21 10 44
Total 17 33 14 64
Small class size (compared with the lower grades) is indicative of a high dropout rate in disadvantagedpopulations, and the numbers show a clear gender bias regarding access to schooling. In the case of theurban sample, the class size was larger, but only a few students opted for this program. These studentshave little or no educational background at home. Almost all are first-generation learners. The tribal, rural,and urban students belong to a fairly low socioeconomic class. The local language, Marathi, is also theirlanguage of instruction, although the mother tongue of the tribal and rural students differs significantlyfrom standard Marathi.
Prior to the teaching, a set of pretest questionnaires was administered to a sample of Grade 4 (end ofprimary school) and Grade 7 (end of middle school) students in these two rural schools. Thequestionnaires probed (1) the students’ everyday observations, (2) their knowledge of textbook content,(3) cultural information that is part of indigenous knowledge, and (4) their explanations for everydayphenomena. The tests were followed by interviews with a small subset of students. The results (to bedescribed in Padalkar and Ramadas, forthcoming) generally showed scanty observations, a fair knowledgeof textbook content (though without significant role for reasoning), a variety of alternative conceptions,and cultural knowledge that was not integrated with school learning. On the basis of these results, webegan our intervention with the students who were about to complete Grade 7 (see Table 1).
4. TEACHING CYCLE: CONTENT AND METHODOLOGY
The intervention took place through activities, classroom discussion, and Socratic questioning, which wasconducted by the first author (Shamin). The aim of the first cycle of intervention was to build a robustmental model of the round, rotating Earth, unsupported in space and attracting objects toward it via"gravity." Further, students were expected to reason about some phenomena that could be explained purelyon the basis of the above mental model. Apart from the main teaching sequence, which is described inSection 6, a few supporting activities—such as star gazing and a session on light and shadows—were alsoconducted. Collaborative learning situations had been planned, but it turned out that in the rural culturalcontext, continual interaction between students occurred quite naturally without special effort by theinstructor (see Section 7). The total intervention was completed in around 10 hours over 7 days. Theclassroom interaction was videotaped.
The pedagogy, which involved both individual and group activities, can be summarized as follows:
Night-sky observations to estimate and measure directions and elevations of stars using the handestimation method and to keep notes of positions of the stars. Hand and body gestures were also usedto mimic the shape of the constellations (details are available from the first author). Making an astrolabe to measure elevations of stars. Observation and experimentation, particularly involving light. Reading of interactive text material based on the history of the discovery of the shape of the Earth. Concrete models and photographs to help transform between egocentric (intrinsic) representation andallocentric (extrinsic) representation. Mimicking both structure and motion (apparent and absolute motion of celestial objects) throughhand gestures and body movements, based on previous findings that the kinesthetic sense is basic toour understanding of space, including spatial properties and spatial operations (Tversky 2005). Diagrams from various possible viewpoints to help make the representations increasingly extrinsic,schematized, and communicable.
5. CONVENTIONAL DIAGRAMS OF THE ROUND EARTH
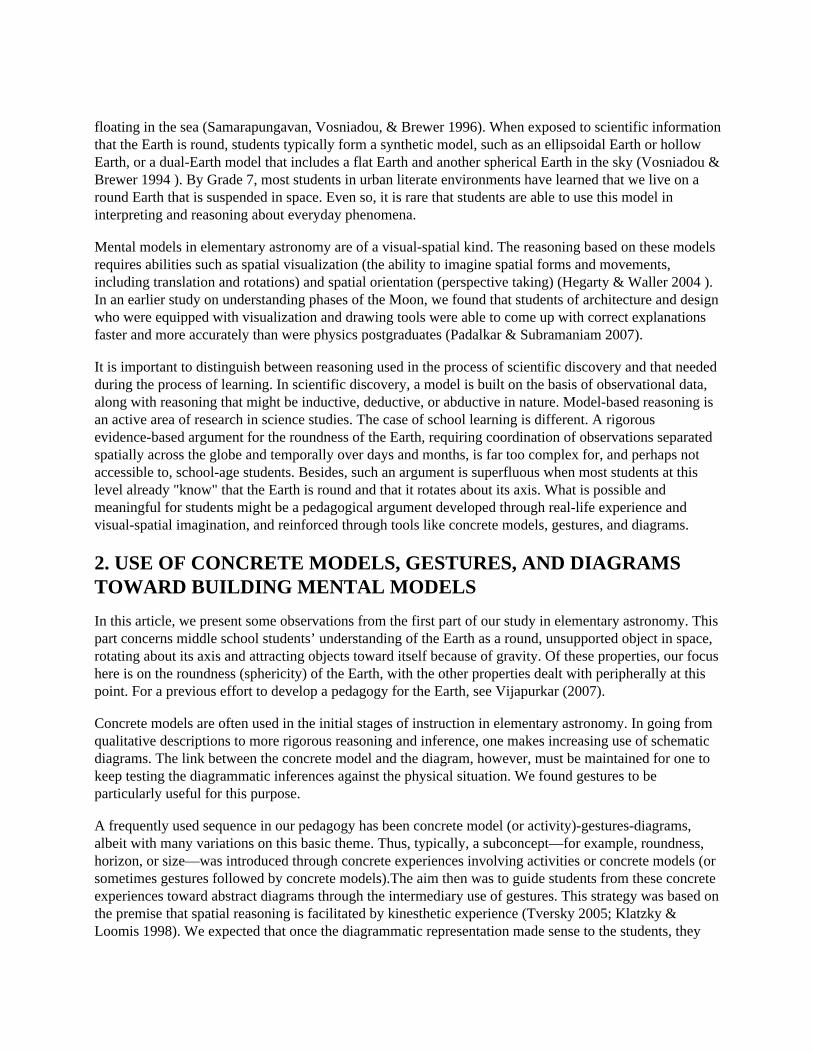
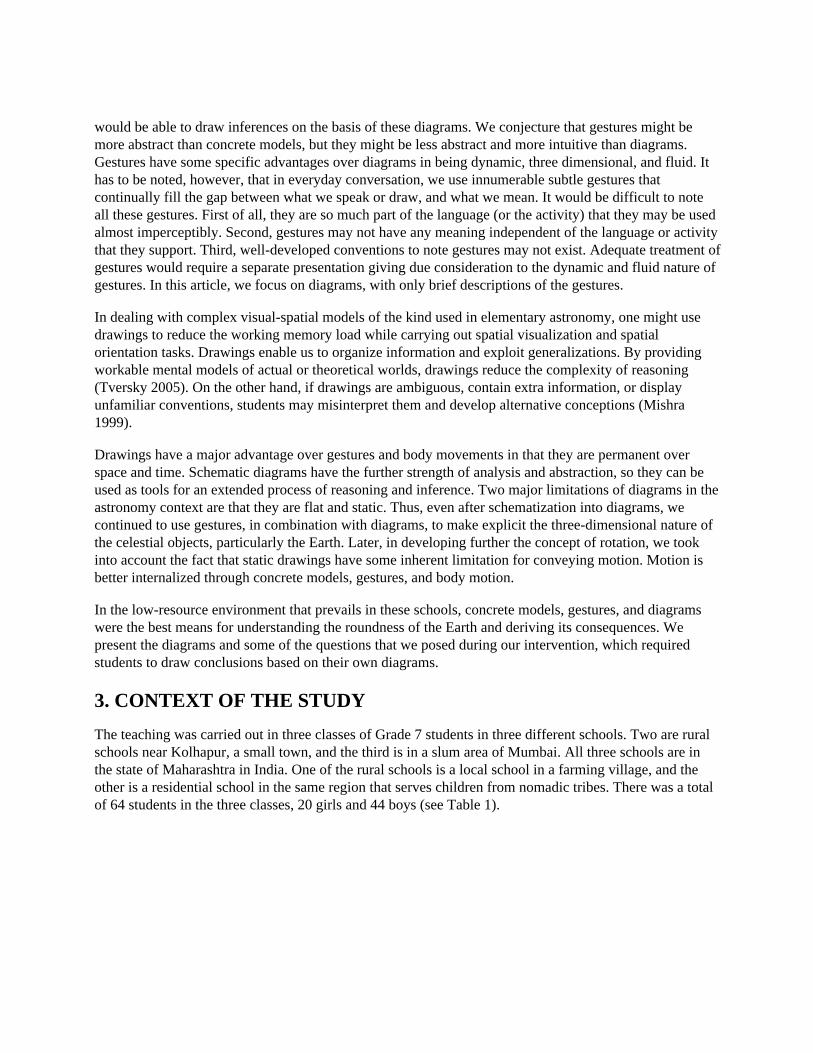
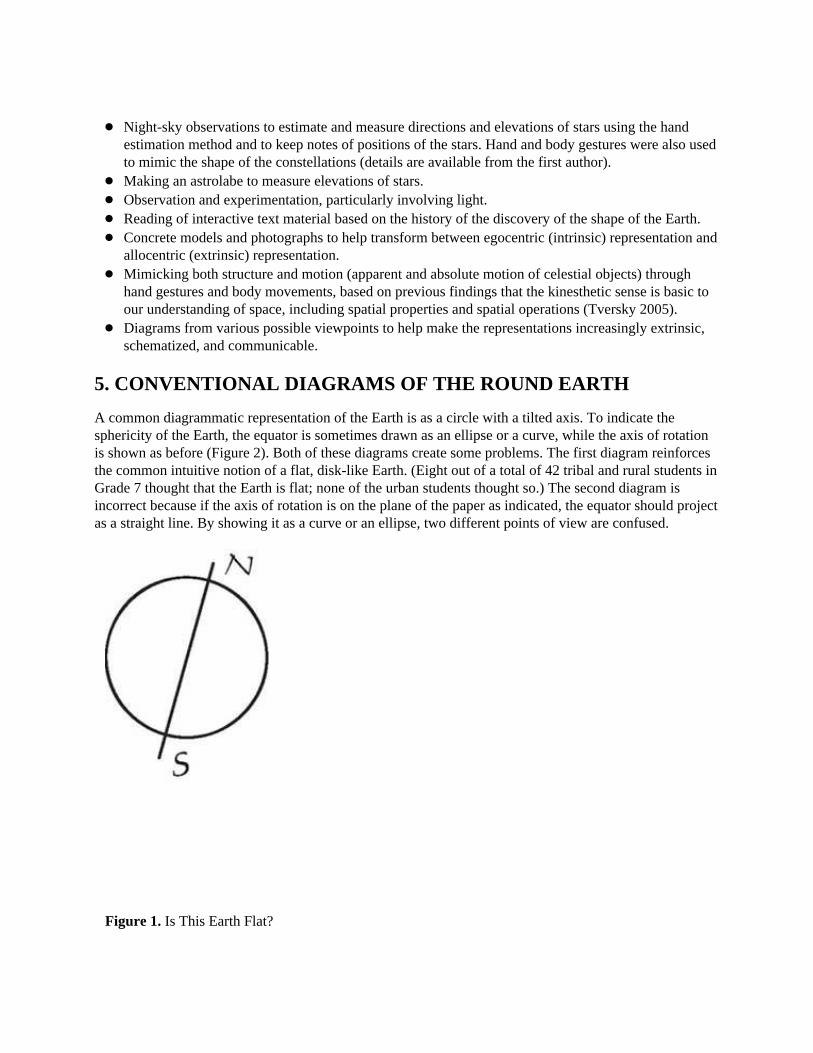
A common diagrammatic representation of the Earth is as a circle with a tilted axis. To indicate thesphericity of the Earth, the equator is sometimes drawn as an ellipse or a curve, while the axis of rotationis shown as before (Figure 2). Both of these diagrams create some problems. The first diagram reinforcesthe common intuitive notion of a flat, disk-like Earth. (Eight out of a total of 42 tribal and rural students inGrade 7 thought that the Earth is flat; none of the urban students thought so.) The second diagram isincorrect because if the axis of rotation is on the plane of the paper as indicated, the equator should projectas a straight line. By showing it as a curve or an ellipse, two different points of view are confused.
Figure 1. Is This Earth Flat?
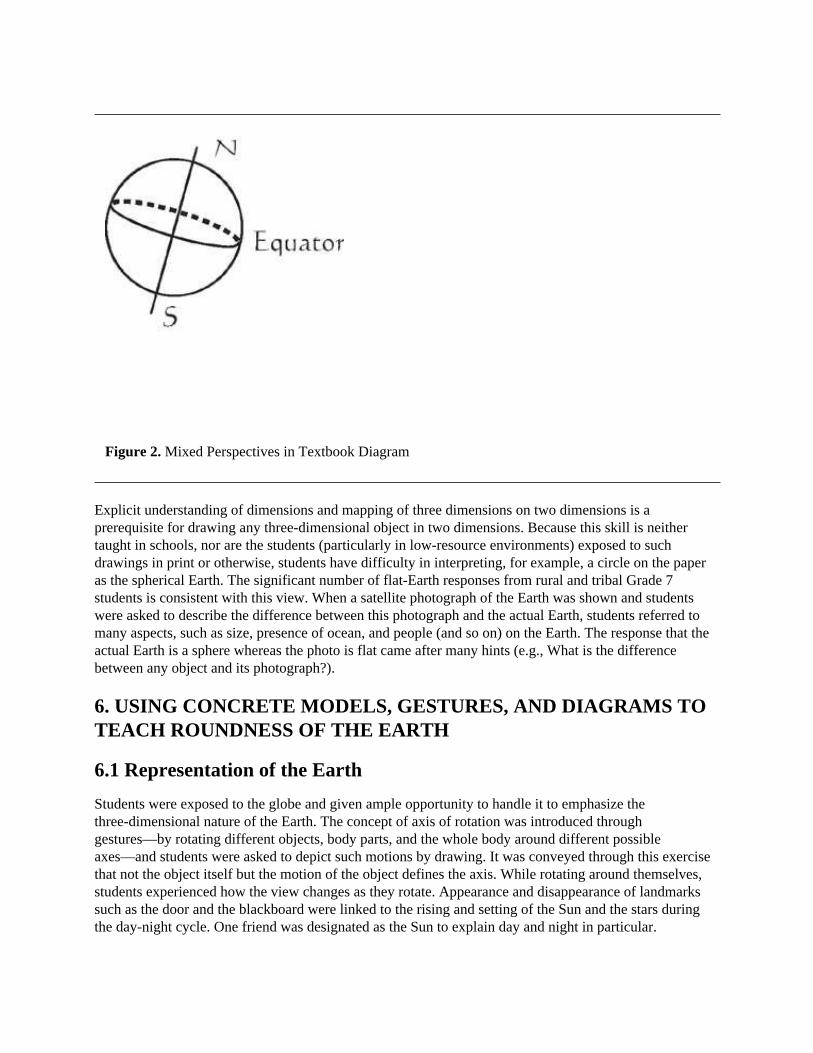
Figure 2. Mixed Perspectives in Textbook Diagram
Explicit understanding of dimensions and mapping of three dimensions on two dimensions is aprerequisite for drawing any three-dimensional object in two dimensions. Because this skill is neithertaught in schools, nor are the students (particularly in low-resource environments) exposed to suchdrawings in print or otherwise, students have difficulty in interpreting, for example, a circle on the paperas the spherical Earth. The significant number of flat-Earth responses from rural and tribal Grade 7students is consistent with this view. When a satellite photograph of the Earth was shown and studentswere asked to describe the difference between this photograph and the actual Earth, students referred tomany aspects, such as size, presence of ocean, and people (and so on) on the Earth. The response that theactual Earth is a sphere whereas the photo is flat came after many hints (e.g., What is the differencebetween any object and its photograph?).
6. USING CONCRETE MODELS, GESTURES, AND DIAGRAMS TOTEACH ROUNDNESS OF THE EARTH
6.1 Representation of the Earth
Students were exposed to the globe and given ample opportunity to handle it to emphasize thethree-dimensional nature of the Earth. The concept of axis of rotation was introduced throughgestures—by rotating different objects, body parts, and the whole body around different possibleaxes—and students were asked to depict such motions by drawing. It was conveyed through this exercisethat not the object itself but the motion of the object defines the axis. While rotating around themselves,students experienced how the view changes as they rotate. Appearance and disappearance of landmarkssuch as the door and the blackboard were linked to the rising and setting of the Sun and the stars duringthe day-night cycle. One friend was designated as the Sun to explain day and night in particular.
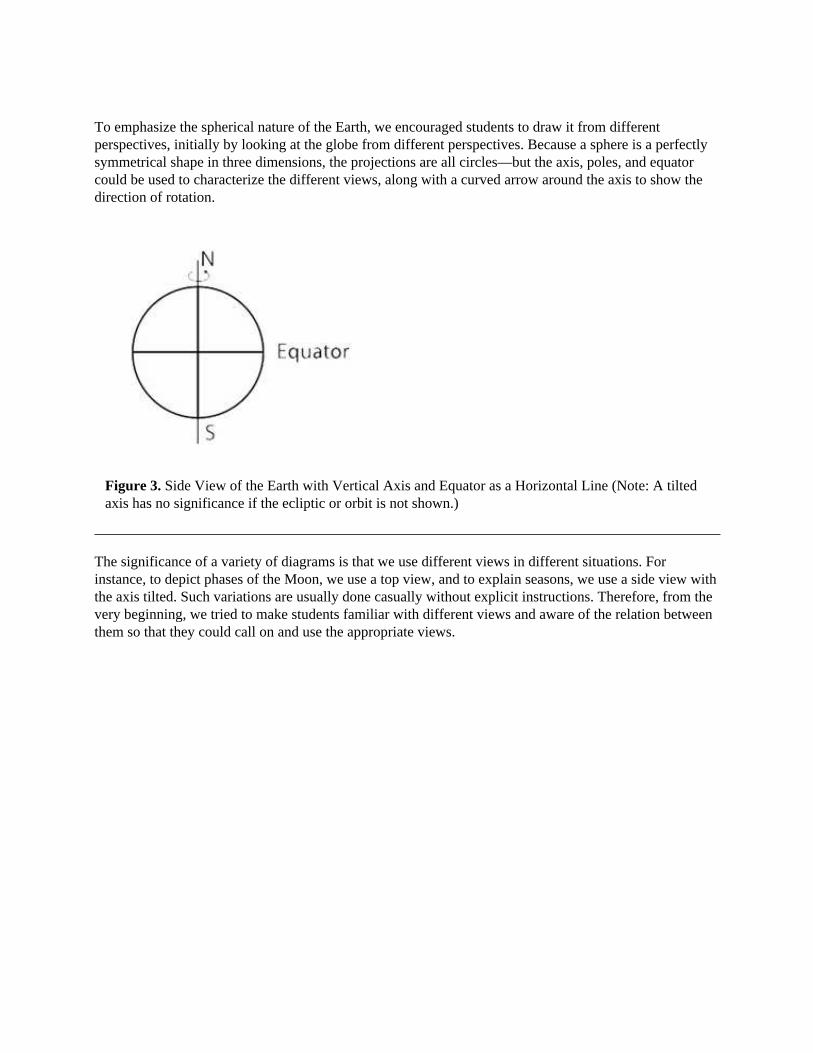
To emphasize the spherical nature of the Earth, we encouraged students to draw it from differentperspectives, initially by looking at the globe from different perspectives. Because a sphere is a perfectlysymmetrical shape in three dimensions, the projections are all circles—but the axis, poles, and equatorcould be used to characterize the different views, along with a curved arrow around the axis to show thedirection of rotation.
Figure 3. Side View of the Earth with Vertical Axis and Equator as a Horizontal Line (Note: A tiltedaxis has no significance if the ecliptic or orbit is not shown.)
The significance of a variety of diagrams is that we use different views in different situations. Forinstance, to depict phases of the Moon, we use a top view, and to explain seasons, we use a side view withthe axis tilted. Such variations are usually done casually without explicit instructions. Therefore, from thevery beginning, we tried to make students familiar with different views and aware of the relation betweenthem so that they could call on and use the appropriate views.
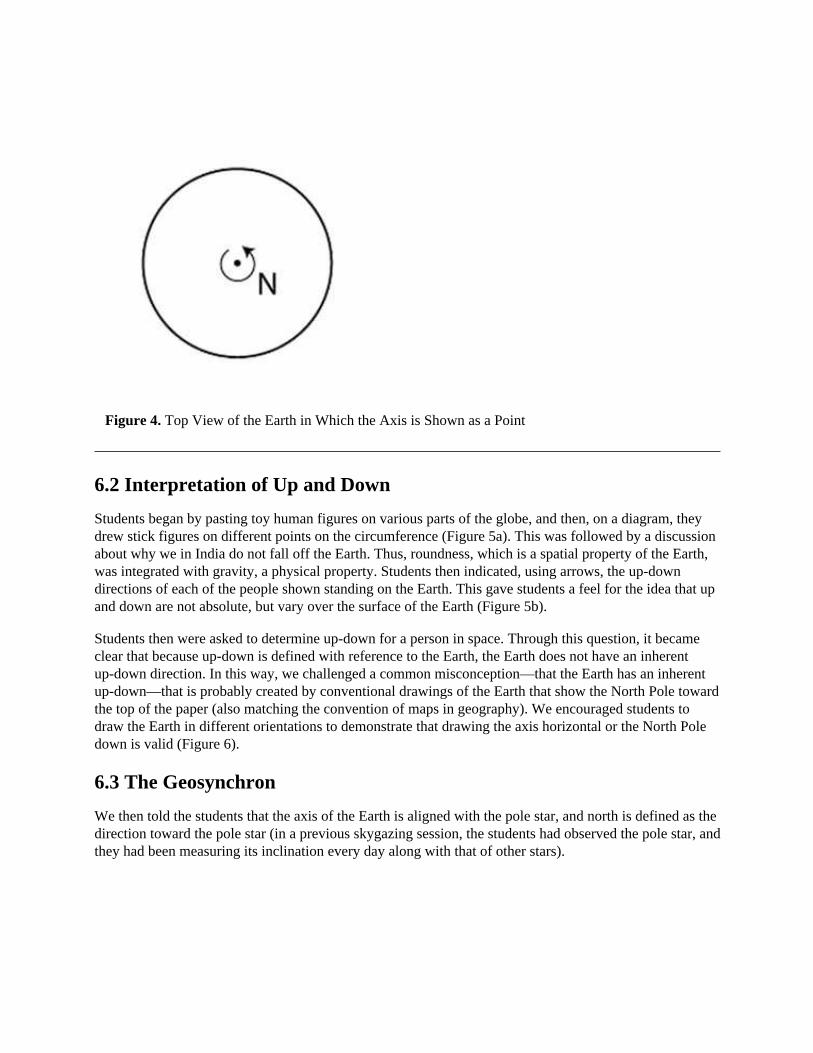
Figure 4. Top View of the Earth in Which the Axis is Shown as a Point
6.2 Interpretation of Up and Down
Students began by pasting toy human figures on various parts of the globe, and then, on a diagram, theydrew stick figures on different points on the circumference (Figure 5a). This was followed by a discussionabout why we in India do not fall off the Earth. Thus, roundness, which is a spatial property of the Earth,was integrated with gravity, a physical property. Students then indicated, using arrows, the up-downdirections of each of the people shown standing on the Earth. This gave students a feel for the idea that upand down are not absolute, but vary over the surface of the Earth (Figure 5b).
Students then were asked to determine up-down for a person in space. Through this question, it becameclear that because up-down is defined with reference to the Earth, the Earth does not have an inherentup-down direction. In this way, we challenged a common misconception—that the Earth has an inherentup-down—that is probably created by conventional drawings of the Earth that show the North Pole towardthe top of the paper (also matching the convention of maps in geography). We encouraged students todraw the Earth in different orientations to demonstrate that drawing the axis horizontal or the North Poledown is valid (Figure 6).
6.3 The Geosynchron
We then told the students that the axis of the Earth is aligned with the pole star, and north is defined as thedirection toward the pole star (in a previous skygazing session, the students had observed the pole star, andthey had been measuring its inclination every day along with that of other stars).
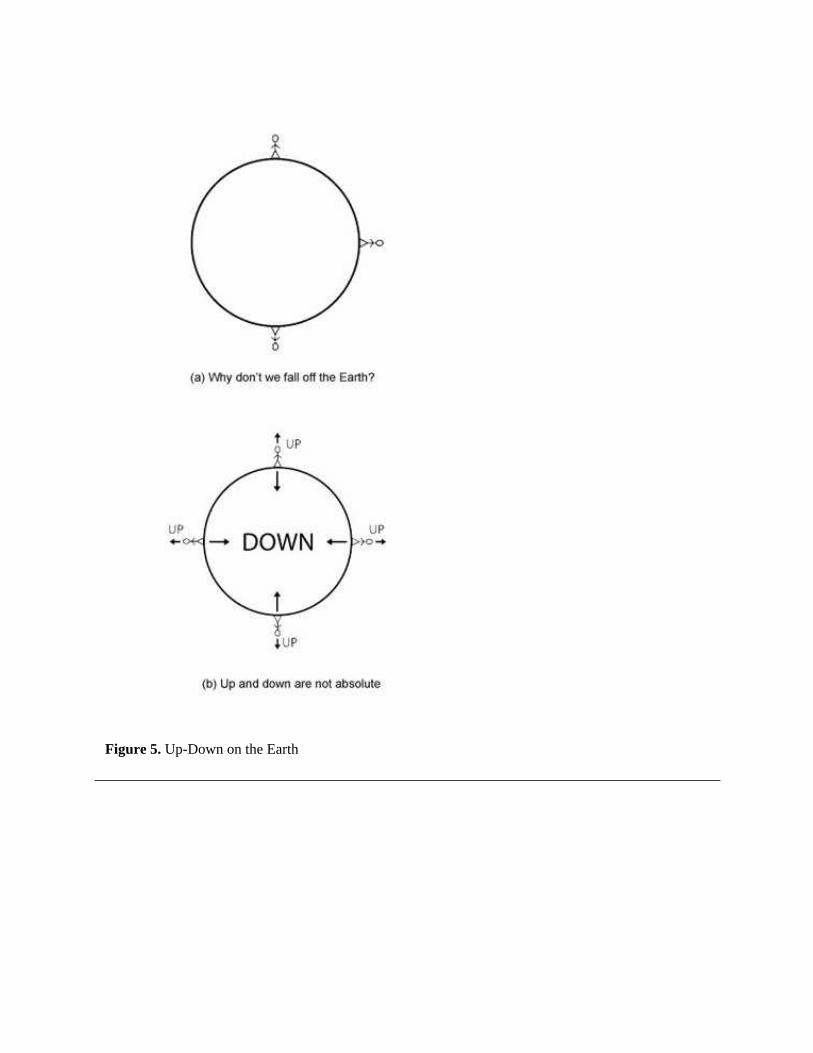
Figure 5. Up-Down on the Earth
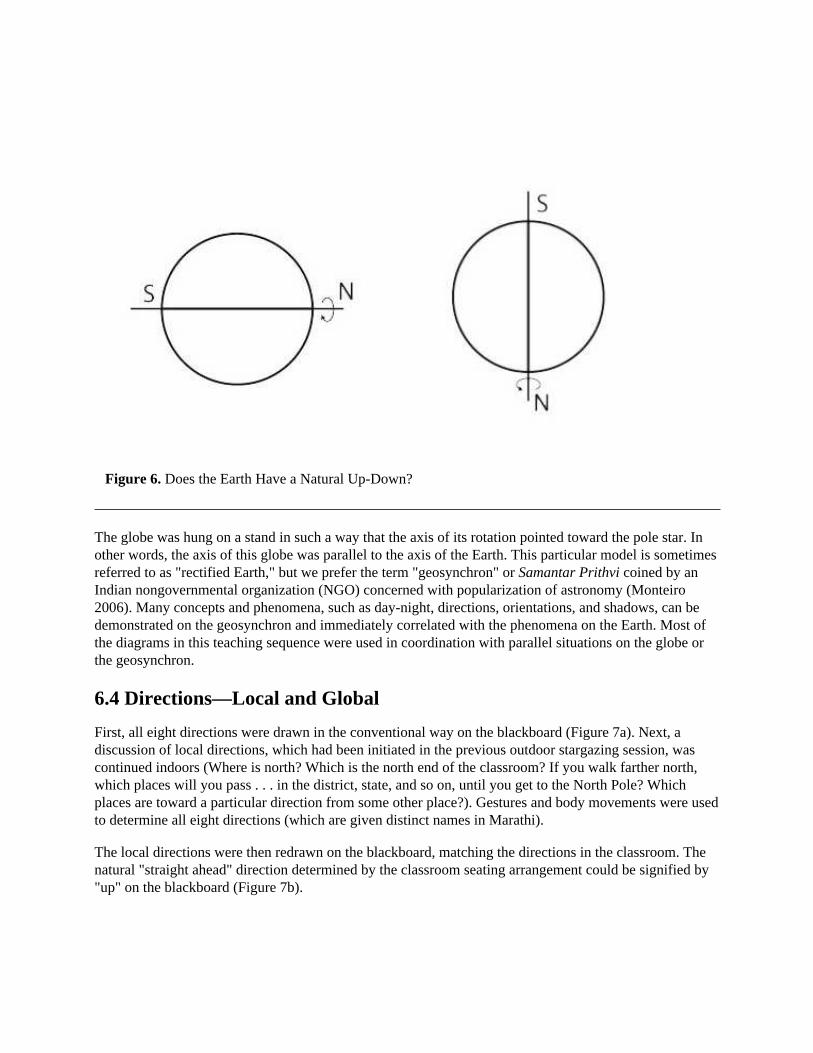
Figure 6. Does the Earth Have a Natural Up-Down?
The globe was hung on a stand in such a way that the axis of its rotation pointed toward the pole star. Inother words, the axis of this globe was parallel to the axis of the Earth. This particular model is sometimesreferred to as "rectified Earth," but we prefer the term "geosynchron" or Samantar Prithvi coined by anIndian nongovernmental organization (NGO) concerned with popularization of astronomy (Monteiro2006). Many concepts and phenomena, such as day-night, directions, orientations, and shadows, can bedemonstrated on the geosynchron and immediately correlated with the phenomena on the Earth. Most ofthe diagrams in this teaching sequence were used in coordination with parallel situations on the globe orthe geosynchron.
6.4 Directions—Local and Global
First, all eight directions were drawn in the conventional way on the blackboard (Figure 7a). Next, adiscussion of local directions, which had been initiated in the previous outdoor stargazing session, wascontinued indoors (Where is north? Which is the north end of the classroom? If you walk farther north,which places will you pass . . . in the district, state, and so on, until you get to the North Pole? Whichplaces are toward a particular direction from some other place?). Gestures and body movements were usedto determine all eight directions (which are given distinct names in Marathi).
The local directions were then redrawn on the blackboard, matching the directions in the classroom. Thenatural "straight ahead" direction determined by the classroom seating arrangement could be signified by"up" on the blackboard (Figure 7b).
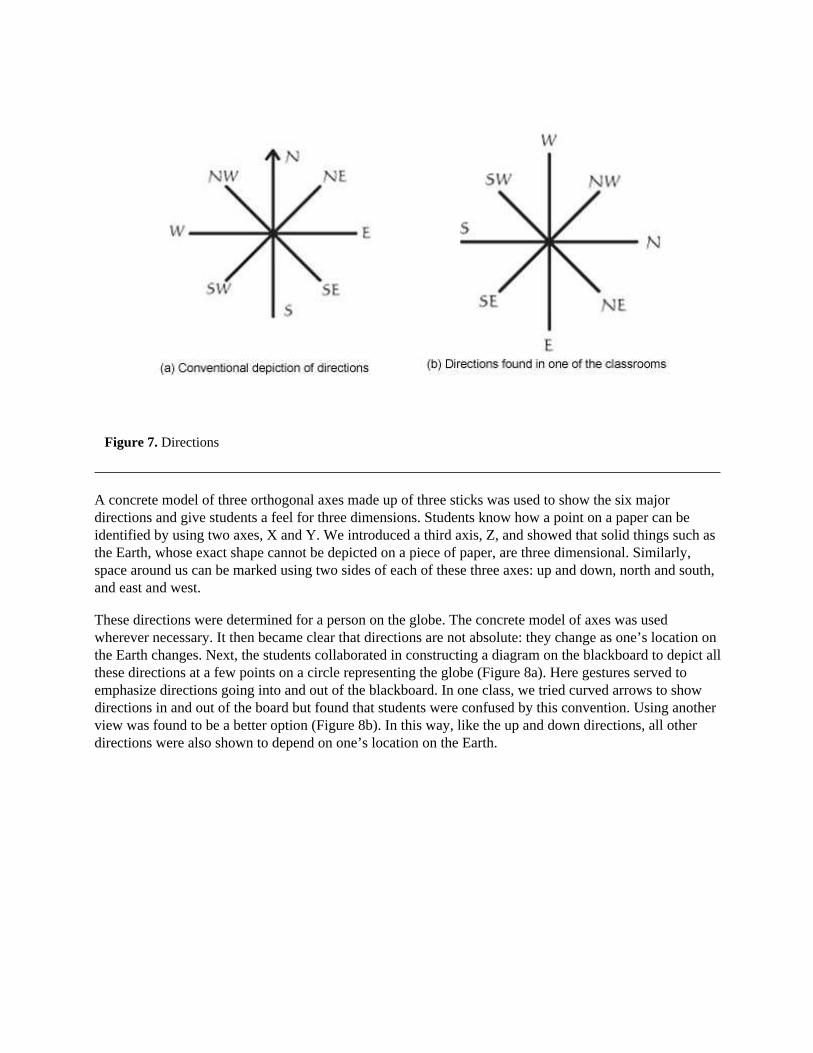
Figure 7. Directions
A concrete model of three orthogonal axes made up of three sticks was used to show the six majordirections and give students a feel for three dimensions. Students know how a point on a paper can beidentified by using two axes, X and Y. We introduced a third axis, Z, and showed that solid things such asthe Earth, whose exact shape cannot be depicted on a piece of paper, are three dimensional. Similarly,space around us can be marked using two sides of each of these three axes: up and down, north and south,and east and west.
These directions were determined for a person on the globe. The concrete model of axes was usedwherever necessary. It then became clear that directions are not absolute: they change as one’s location onthe Earth changes. Next, the students collaborated in constructing a diagram on the blackboard to depict allthese directions at a few points on a circle representing the globe (Figure 8a). Here gestures served toemphasize directions going into and out of the blackboard. In one class, we tried curved arrows to showdirections in and out of the board but found that students were confused by this convention. Using anotherview was found to be a better option (Figure 8b). In this way, like the up and down directions, all otherdirections were also shown to depend on one’s location on the Earth.
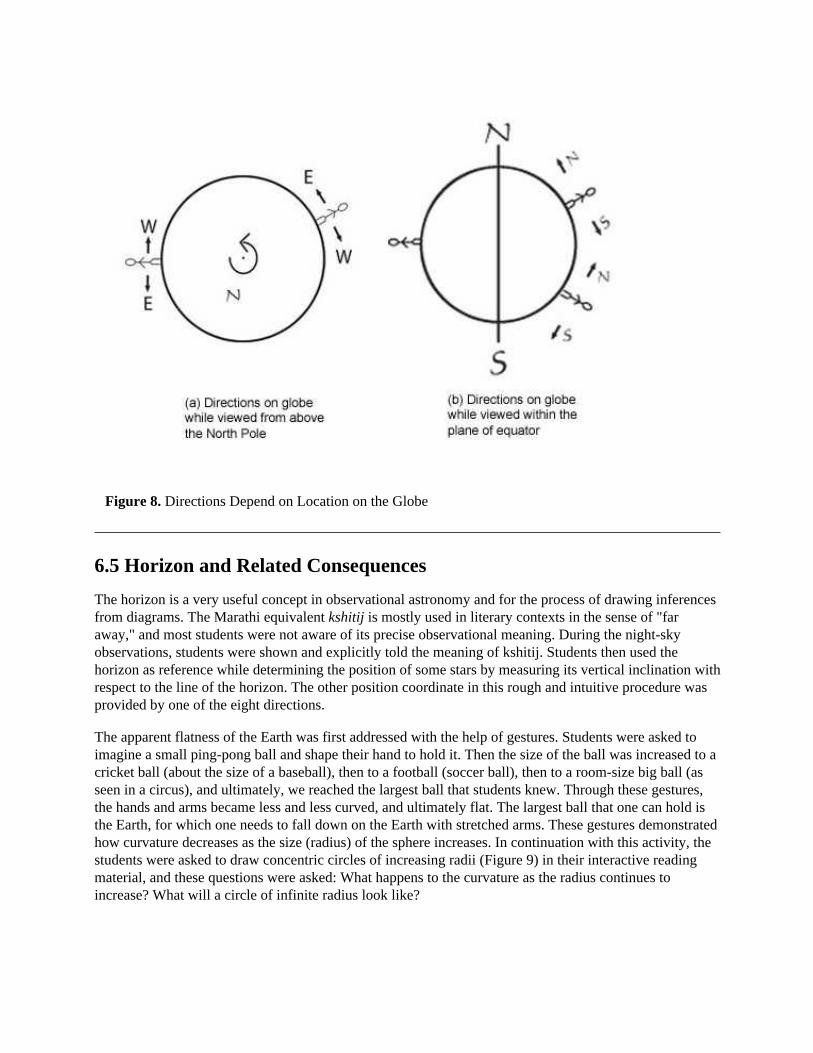
Figure 8. Directions Depend on Location on the Globe
6.5 Horizon and Related Consequences
The horizon is a very useful concept in observational astronomy and for the process of drawing inferencesfrom diagrams. The Marathi equivalent kshitij is mostly used in literary contexts in the sense of "faraway," and most students were not aware of its precise observational meaning. During the night-skyobservations, students were shown and explicitly told the meaning of kshitij. Students then used thehorizon as reference while determining the position of some stars by measuring its vertical inclination withrespect to the line of the horizon. The other position coordinate in this rough and intuitive procedure wasprovided by one of the eight directions.
The apparent flatness of the Earth was first addressed with the help of gestures. Students were asked toimagine a small ping-pong ball and shape their hand to hold it. Then the size of the ball was increased to acricket ball (about the size of a baseball), then to a football (soccer ball), then to a room-size big ball (asseen in a circus), and ultimately, we reached the largest ball that students knew. Through these gestures,the hands and arms became less and less curved, and ultimately flat. The largest ball that one can hold isthe Earth, for which one needs to fall down on the Earth with stretched arms. These gestures demonstratedhow curvature decreases as the size (radius) of the sphere increases. In continuation with this activity, thestudents were asked to draw concentric circles of increasing radii (Figure 9) in their interactive readingmaterial, and these questions were asked: What happens to the curvature as the radius continues toincrease? What will a circle of infinite radius look like?
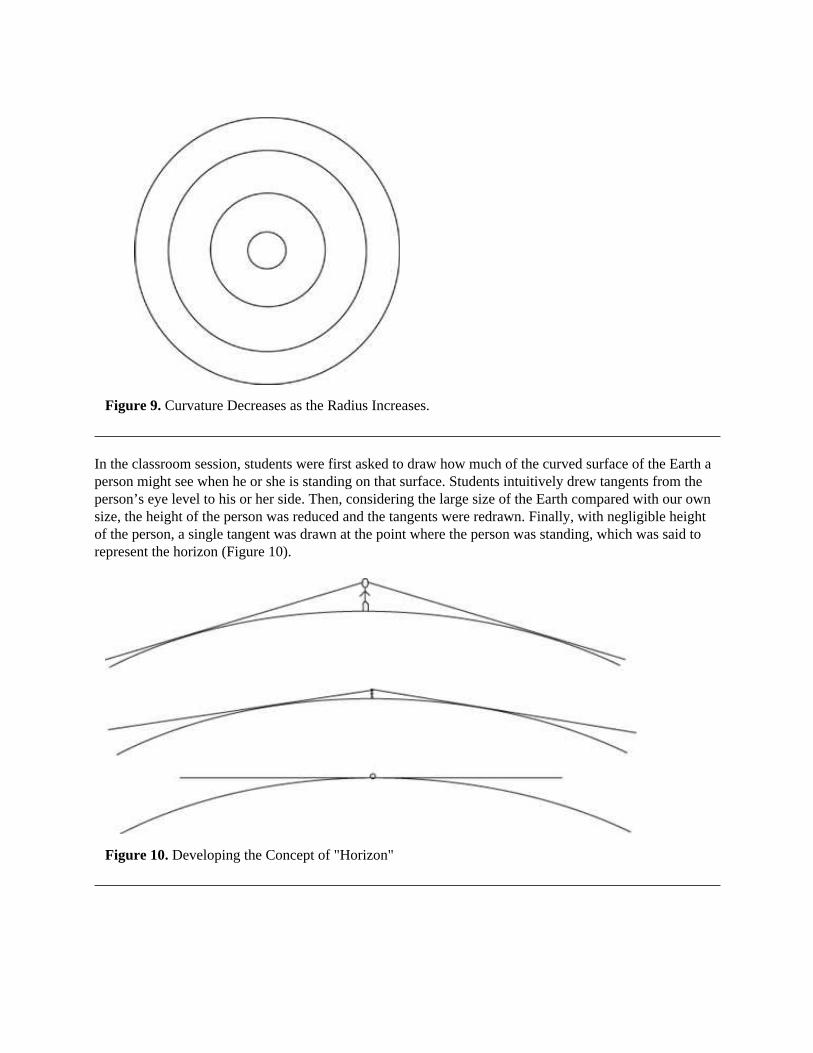
Figure 9. Curvature Decreases as the Radius Increases.
In the classroom session, students were first asked to draw how much of the curved surface of the Earth aperson might see when he or she is standing on that surface. Students intuitively drew tangents from theperson’s eye level to his or her side. Then, considering the large size of the Earth compared with our ownsize, the height of the person was reduced and the tangents were redrawn. Finally, with negligible heightof the person, a single tangent was drawn at the point where the person was standing, which was said torepresent the horizon (Figure 10).
Figure 10. Developing the Concept of "Horizon"
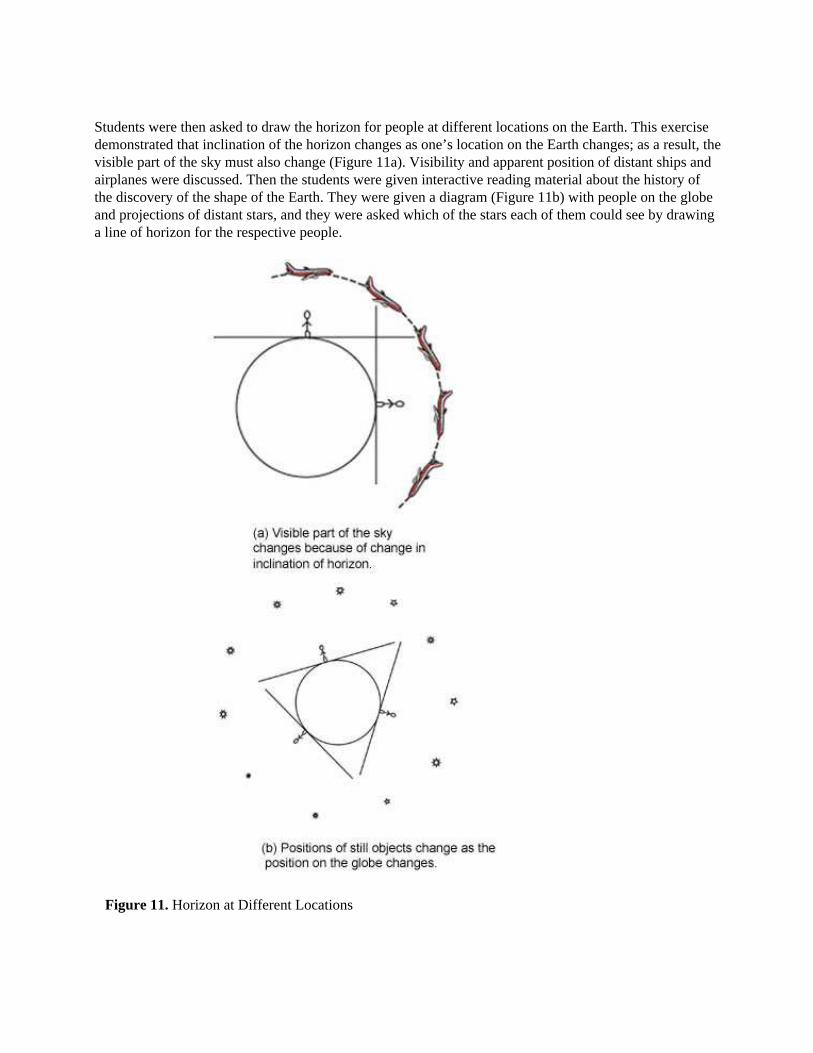
Students were then asked to draw the horizon for people at different locations on the Earth. This exercisedemonstrated that inclination of the horizon changes as one’s location on the Earth changes; as a result, thevisible part of the sky must also change (Figure 11a). Visibility and apparent position of distant ships andairplanes were discussed. Then the students were given interactive reading material about the history ofthe discovery of the shape of the Earth. They were given a diagram (Figure 11b) with people on the globeand projections of distant stars, and they were asked which of the stars each of them could see by drawinga line of horizon for the respective people.
Figure 11. Horizon at Different Locations
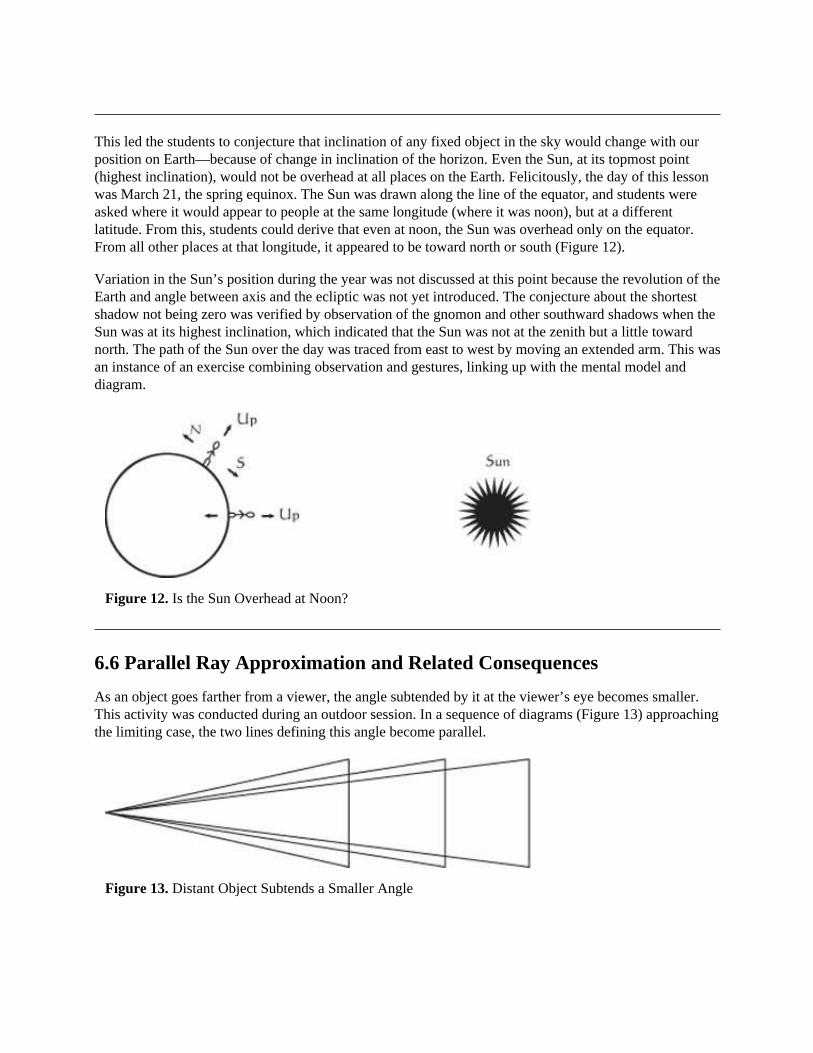
This led the students to conjecture that inclination of any fixed object in the sky would change with ourposition on Earth—because of change in inclination of the horizon. Even the Sun, at its topmost point(highest inclination), would not be overhead at all places on the Earth. Felicitously, the day of this lessonwas March 21, the spring equinox. The Sun was drawn along the line of the equator, and students wereasked where it would appear to people at the same longitude (where it was noon), but at a differentlatitude. From this, students could derive that even at noon, the Sun was overhead only on the equator.From all other places at that longitude, it appeared to be toward north or south (Figure 12).
Variation in the Sun’s position during the year was not discussed at this point because the revolution of theEarth and angle between axis and the ecliptic was not yet introduced. The conjecture about the shortestshadow not being zero was verified by observation of the gnomon and other southward shadows when theSun was at its highest inclination, which indicated that the Sun was not at the zenith but a little towardnorth. The path of the Sun over the day was traced from east to west by moving an extended arm. This wasan instance of an exercise combining observation and gestures, linking up with the mental model and diagram.
Figure 12. Is the Sun Overhead at Noon?
6.6 Parallel Ray Approximation and Related Consequences
As an object goes farther from a viewer, the angle subtended by it at the viewer’s eye becomes smaller.This activity was conducted during an outdoor session. In a sequence of diagrams (Figure 13) approachingthe limiting case, the two lines defining this angle become parallel.
Figure 13. Distant Object Subtends a Smaller Angle
The Sun rays reaching the surface of Earth are similarly approximated to be parallel because the diameterof the Earth is very small in comparison with the distance between the Sun and the Earth.
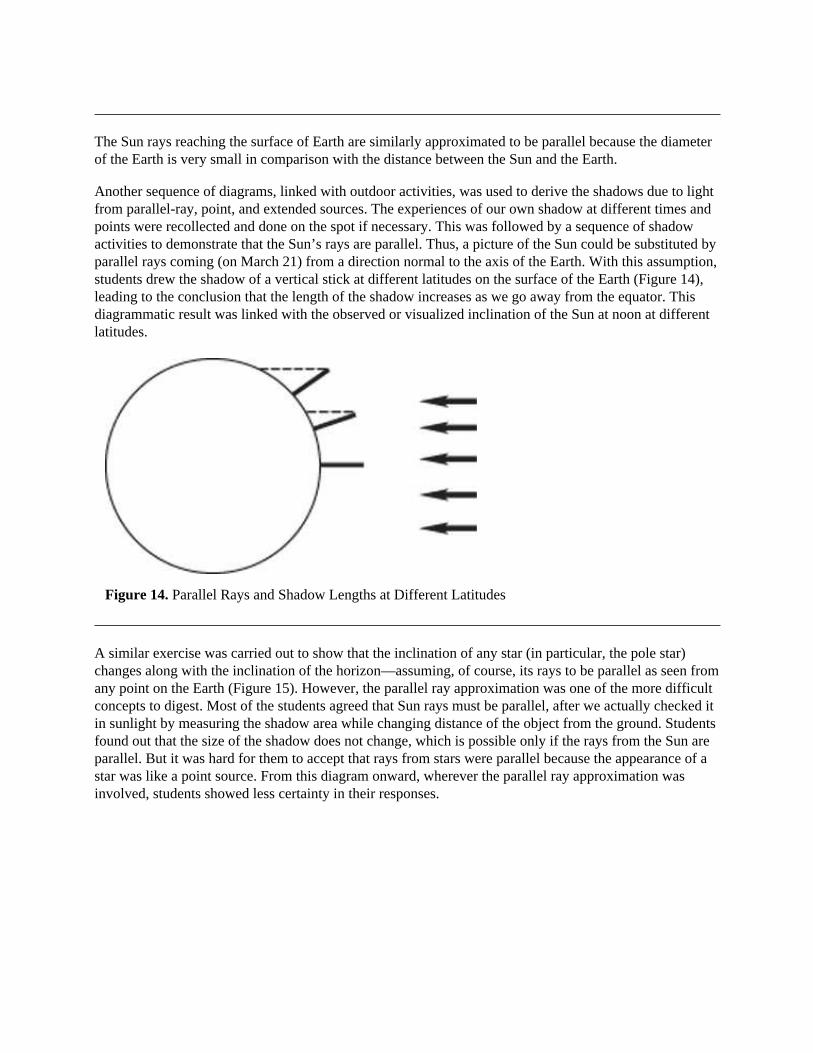
Another sequence of diagrams, linked with outdoor activities, was used to derive the shadows due to lightfrom parallel-ray, point, and extended sources. The experiences of our own shadow at different times andpoints were recollected and done on the spot if necessary. This was followed by a sequence of shadowactivities to demonstrate that the Sun’s rays are parallel. Thus, a picture of the Sun could be substituted byparallel rays coming (on March 21) from a direction normal to the axis of the Earth. With this assumption,students drew the shadow of a vertical stick at different latitudes on the surface of the Earth (Figure 14),leading to the conclusion that the length of the shadow increases as we go away from the equator. Thisdiagrammatic result was linked with the observed or visualized inclination of the Sun at noon at different latitudes.
Figure 14. Parallel Rays and Shadow Lengths at Different Latitudes
A similar exercise was carried out to show that the inclination of any star (in particular, the pole star)changes along with the inclination of the horizon—assuming, of course, its rays to be parallel as seen fromany point on the Earth (Figure 15). However, the parallel ray approximation was one of the more difficultconcepts to digest. Most of the students agreed that Sun rays must be parallel, after we actually checked itin sunlight by measuring the shadow area while changing distance of the object from the ground. Studentsfound out that the size of the shadow does not change, which is possible only if the rays from the Sun areparallel. But it was hard for them to accept that rays from stars were parallel because the appearance of astar was like a point source. From this diagram onward, wherever the parallel ray approximation wasinvolved, students showed less certainty in their responses.
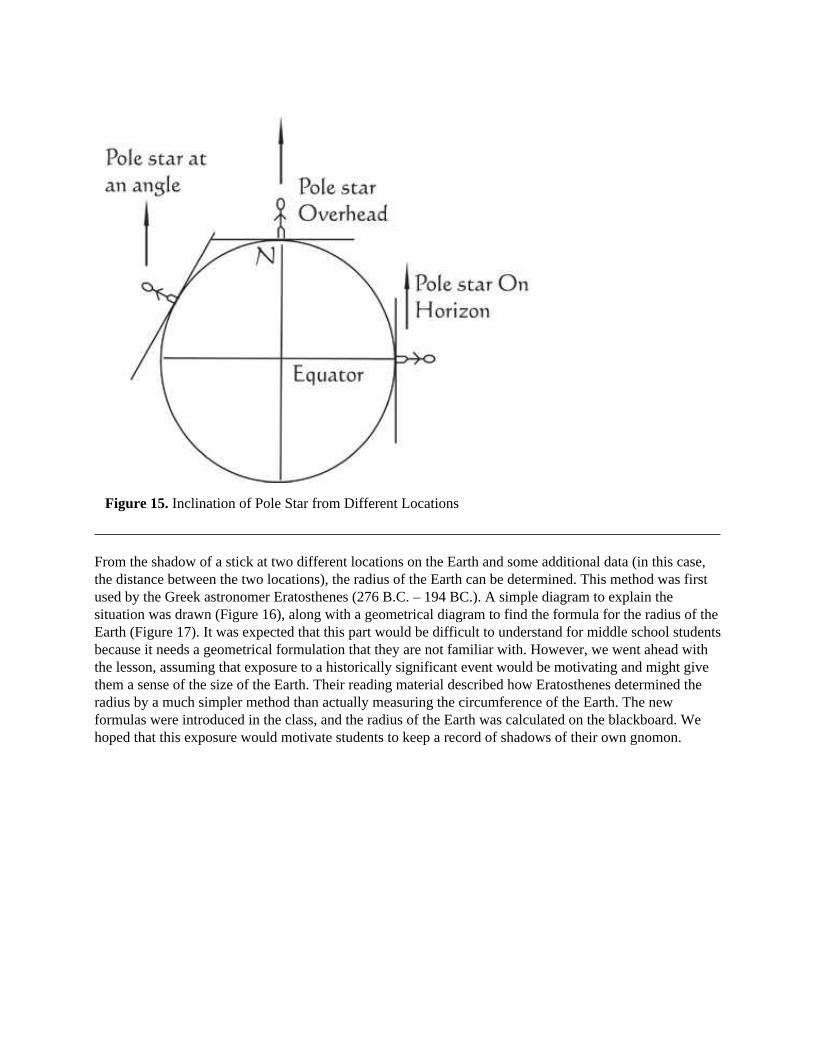
Figure 15. Inclination of Pole Star from Different Locations
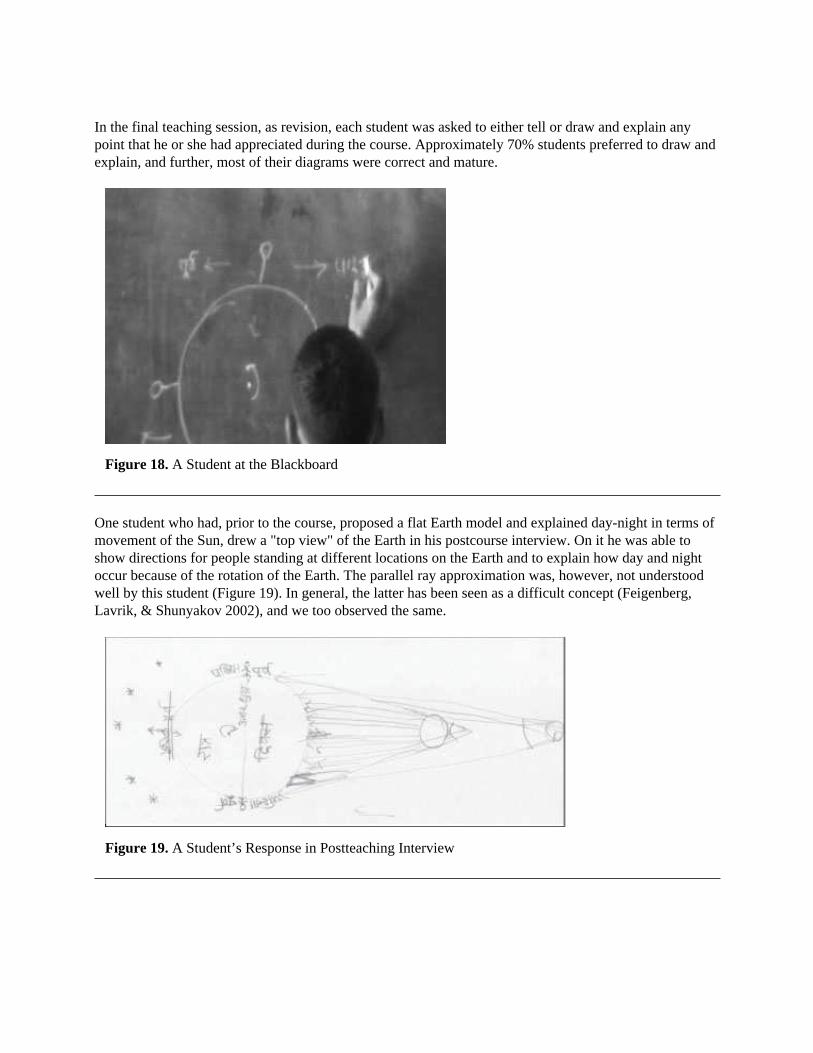
From the shadow of a stick at two different locations on the Earth and some additional data (in this case,the distance between the two locations), the radius of the Earth can be determined. This method was firstused by the Greek astronomer Eratosthenes (276 B.C. – 194 BC.). A simple diagram to explain thesituation was drawn (Figure 16), along with a geometrical diagram to find the formula for the radius of theEarth (Figure 17). It was expected that this part would be difficult to understand for middle school studentsbecause it needs a geometrical formulation that they are not familiar with. However, we went ahead withthe lesson, assuming that exposure to a historically significant event would be motivating and might givethem a sense of the size of the Earth. Their reading material described how Eratosthenes determined theradius by a much simpler method than actually measuring the circumference of the Earth. The newformulas were introduced in the class, and the radius of the Earth was calculated on the blackboard. Wehoped that this exposure would motivate students to keep a record of shadows of their own gnomon.
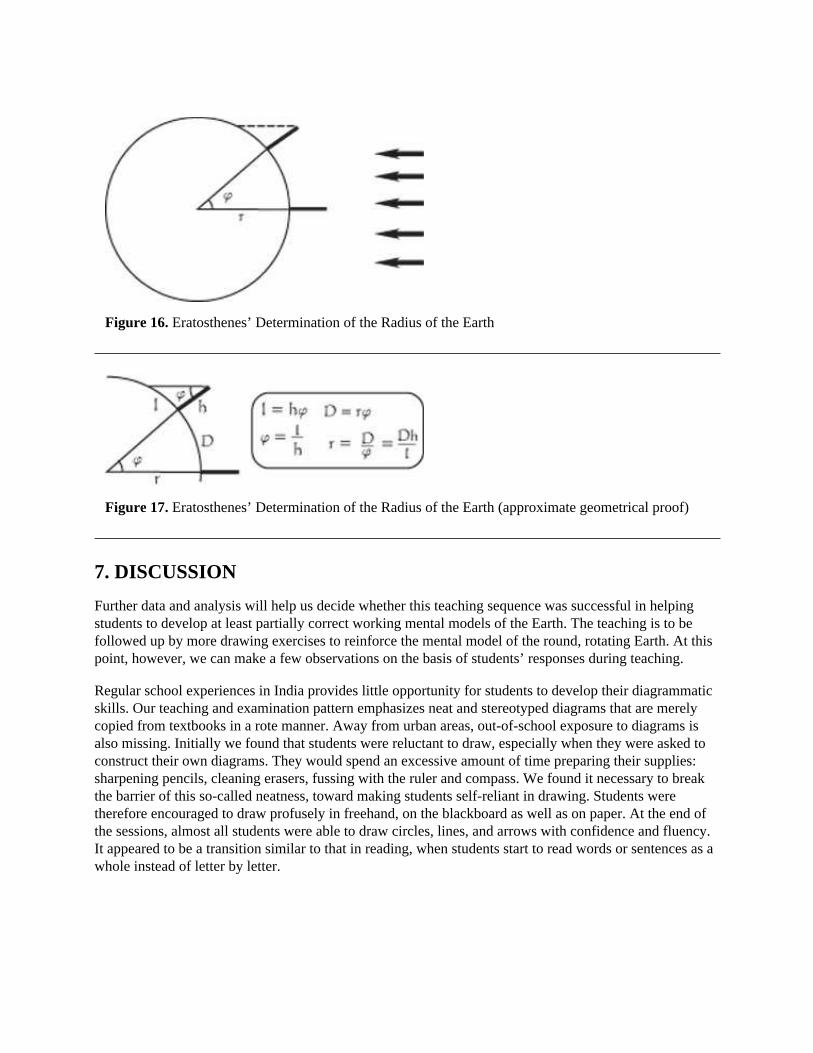
Figure 16. Eratosthenes’ Determination of the Radius of the Earth
Figure 17. Eratosthenes’ Determination of the Radius of the Earth (approximate geometrical proof)
7. DISCUSSION
Further data and analysis will help us decide whether this teaching sequence was successful in helpingstudents to develop at least partially correct working mental models of the Earth. The teaching is to befollowed up by more drawing exercises to reinforce the mental model of the round, rotating Earth. At thispoint, however, we can make a few observations on the basis of students’ responses during teaching.
Regular school experiences in India provides little opportunity for students to develop their diagrammaticskills. Our teaching and examination pattern emphasizes neat and stereotyped diagrams that are merelycopied from textbooks in a rote manner. Away from urban areas, out-of-school exposure to diagrams isalso missing. Initially we found that students were reluctant to draw, especially when they were asked toconstruct their own diagrams. They would spend an excessive amount of time preparing their supplies:sharpening pencils, cleaning erasers, fussing with the ruler and compass. We found it necessary to breakthe barrier of this so-called neatness, toward making students self-reliant in drawing. Students weretherefore encouraged to draw profusely in freehand, on the blackboard as well as on paper. At the end ofthe sessions, almost all students were able to draw circles, lines, and arrows with confidence and fluency.It appeared to be a transition similar to that in reading, when students start to read words or sentences as awhole instead of letter by letter.
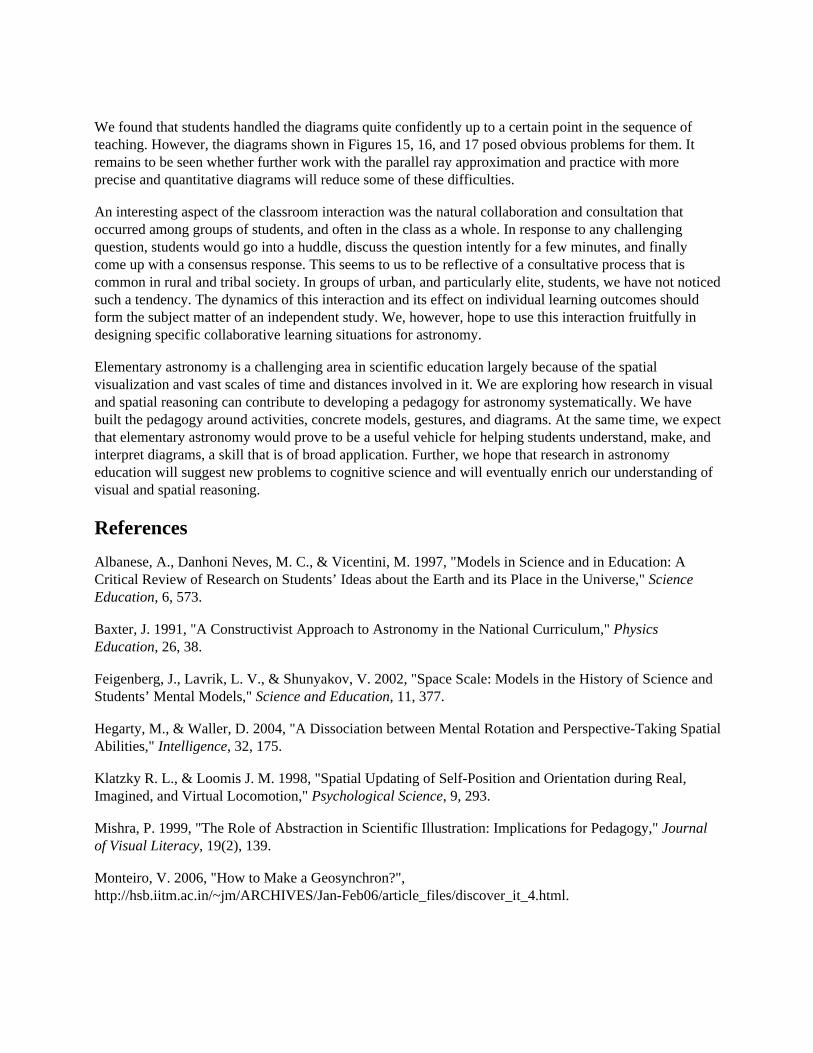
In the final teaching session, as revision, each student was asked to either tell or draw and explain anypoint that he or she had appreciated during the course. Approximately 70% students preferred to draw andexplain, and further, most of their diagrams were correct and mature.
Figure 18. A Student at the Blackboard
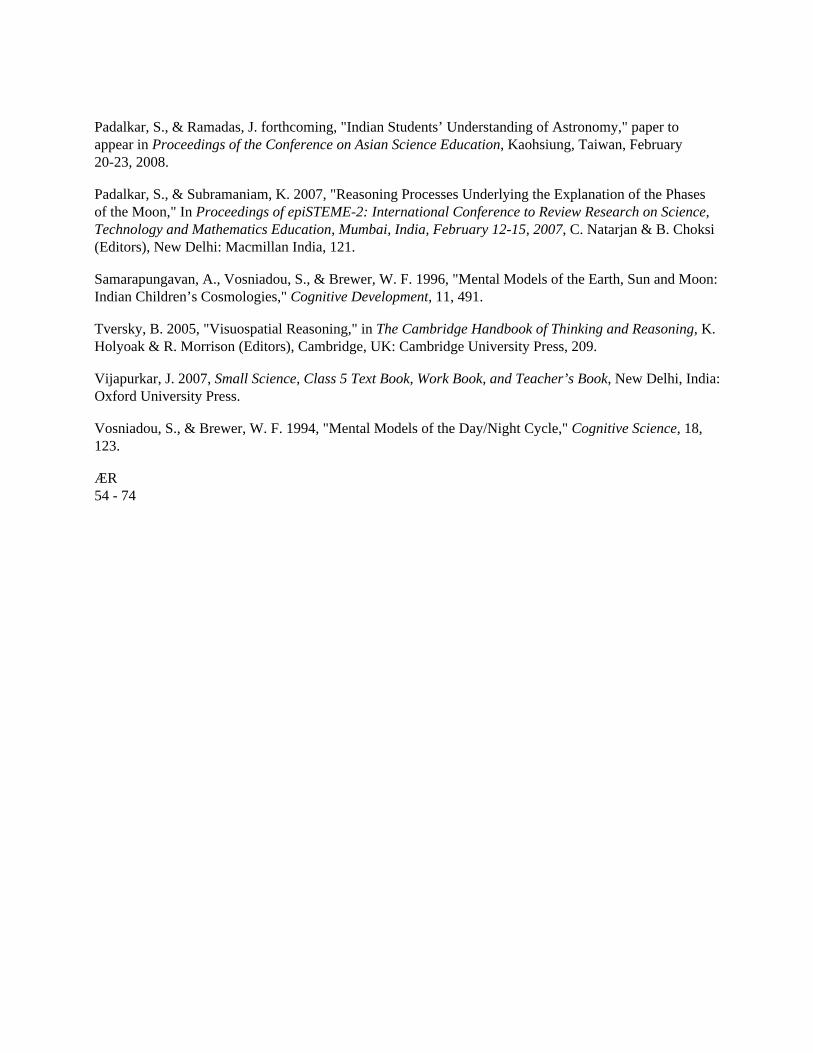
One student who had, prior to the course, proposed a flat Earth model and explained day-night in terms ofmovement of the Sun, drew a "top view" of the Earth in his postcourse interview. On it he was able toshow directions for people standing at different locations on the Earth and to explain how day and nightoccur because of the rotation of the Earth. The parallel ray approximation was, however, not understoodwell by this student (Figure 19). In general, the latter has been seen as a difficult concept (Feigenberg,Lavrik, & Shunyakov 2002), and we too observed the same.
Figure 19. A Student’s Response in Postteaching Interview
We found that students handled the diagrams quite confidently up to a certain point in the sequence ofteaching. However, the diagrams shown in Figures 15, 16, and 17 posed obvious problems for them. Itremains to be seen whether further work with the parallel ray approximation and practice with moreprecise and quantitative diagrams will reduce some of these difficulties.
An interesting aspect of the classroom interaction was the natural collaboration and consultation thatoccurred among groups of students, and often in the class as a whole. In response to any challengingquestion, students would go into a huddle, discuss the question intently for a few minutes, and finallycome up with a consensus response. This seems to us to be reflective of a consultative process that iscommon in rural and tribal society. In groups of urban, and particularly elite, students, we have not noticedsuch a tendency. The dynamics of this interaction and its effect on individual learning outcomes shouldform the subject matter of an independent study. We, however, hope to use this interaction fruitfully indesigning specific collaborative learning situations for astronomy.
Elementary astronomy is a challenging area in scientific education largely because of the spatialvisualization and vast scales of time and distances involved in it. We are exploring how research in visualand spatial reasoning can contribute to developing a pedagogy for astronomy systematically. We havebuilt the pedagogy around activities, concrete models, gestures, and diagrams. At the same time, we expectthat elementary astronomy would prove to be a useful vehicle for helping students understand, make, andinterpret diagrams, a skill that is of broad application. Further, we hope that research in astronomyeducation will suggest new problems to cognitive science and will eventually enrich our understanding ofvisual and spatial reasoning.
References
Albanese, A., Danhoni Neves, M. C., & Vicentini, M. 1997, "Models in Science and in Education: ACritical Review of Research on Students’ Ideas about the Earth and its Place in the Universe," Science Education, 6, 573.
Baxter, J. 1991, "A Constructivist Approach to Astronomy in the National Curriculum," Physics Education, 26, 38.
Feigenberg, J., Lavrik, L. V., & Shunyakov, V. 2002, "Space Scale: Models in the History of Science andStudents’ Mental Models," Science and Education, 11, 377.
Hegarty, M., & Waller, D. 2004, "A Dissociation between Mental Rotation and Perspective-Taking SpatialAbilities," Intelligence, 32, 175.
Klatzky R. L., & Loomis J. M. 1998, "Spatial Updating of Self-Position and Orientation during Real,Imagined, and Virtual Locomotion," Psychological Science, 9, 293.
Mishra, P. 1999, "The Role of Abstraction in Scientific Illustration: Implications for Pedagogy," Journalof Visual Literacy, 19(2), 139.
Monteiro, V. 2006, "How to Make a Geosynchron?",http://hsb.iitm.ac.in/~jm/ARCHIVES/Jan-Feb06/article_files/discover_it_4.html.
Padalkar, S., & Ramadas, J. forthcoming, "Indian Students’ Understanding of Astronomy," paper toappear in Proceedings of the Conference on Asian Science Education, Kaohsiung, Taiwan, February20-23, 2008.
Padalkar, S., & Subramaniam, K. 2007, "Reasoning Processes Underlying the Explanation of the Phasesof the Moon," In Proceedings of epiSTEME-2: International Conference to Review Research on Science,Technology and Mathematics Education, Mumbai, India, February 12-15, 2007, C. Natarjan & B. Choksi(Editors), New Delhi: Macmillan India, 121.
Samarapungavan, A., Vosniadou, S., & Brewer, W. F. 1996, "Mental Models of the Earth, Sun and Moon:Indian Children’s Cosmologies," Cognitive Development, 11, 491.
Tversky, B. 2005, "Visuospatial Reasoning," in The Cambridge Handbook of Thinking and Reasoning, K.Holyoak & R. Morrison (Editors), Cambridge, UK: Cambridge University Press, 209.
Vijapurkar, J. 2007, Small Science, Class 5 Text Book, Work Book, and Teacher’s Book, New Delhi, India:Oxford University Press.
Vosniadou, S., & Brewer, W. F. 1994, "Mental Models of the Day/Night Cycle," Cognitive Science, 18,123.
ÆR54 - 74