Embed Size (px)
Citation preview
Modeling the Physical Processes that Impact the Fate and Fallout of Radioactive Materials
J.V. Ramsdell, Jr. Radiological Science and Engineering Group
Pacific Northwest National Laboratory Richland, Washington
February 23, 2012
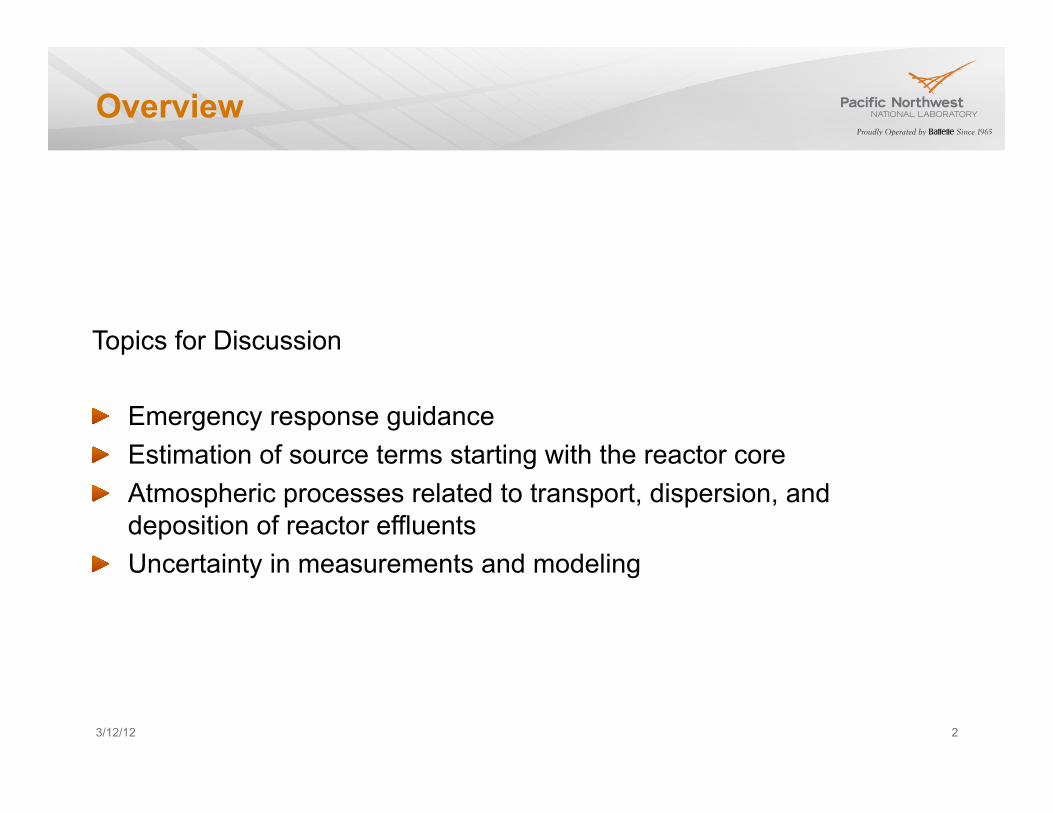
Overview
Topics for Discussion ! Emergency response guidance ! Estimation of source terms starting with the reactor core ! Atmospheric processes related to transport, dispersion, and
deposition of reactor effluents ! Uncertainty in measurements and modeling
3/12/12 2
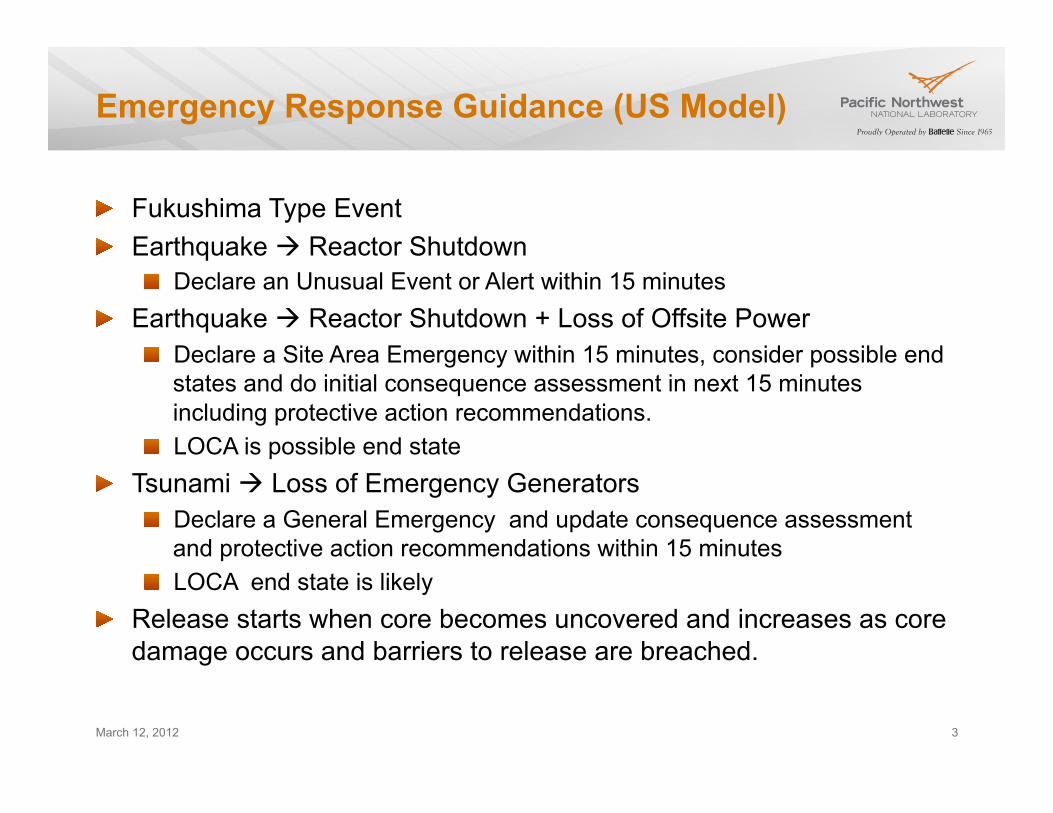
Emergency Response Guidance (US Model)
March 12, 2012 3
! Fukushima Type Event ! Earthquake à Reactor Shutdown
! Declare an Unusual Event or Alert within 15 minutes ! Earthquake à Reactor Shutdown + Loss of Offsite Power
! Declare a Site Area Emergency within 15 minutes, consider possible end states and do initial consequence assessment in next 15 minutes including protective action recommendations.
! LOCA is possible end state ! Tsunami à Loss of Emergency Generators
! Declare a General Emergency and update consequence assessment and protective action recommendations within 15 minutes
! LOCA end state is likely ! Release starts when core becomes uncovered and increases as core
damage occurs and barriers to release are breached.

When Do We Need a Source Term Estimate?
! A source term is needed before the first consequence assessment is required!
! And, the source term needs to be reasonable
March 12, 2012 4
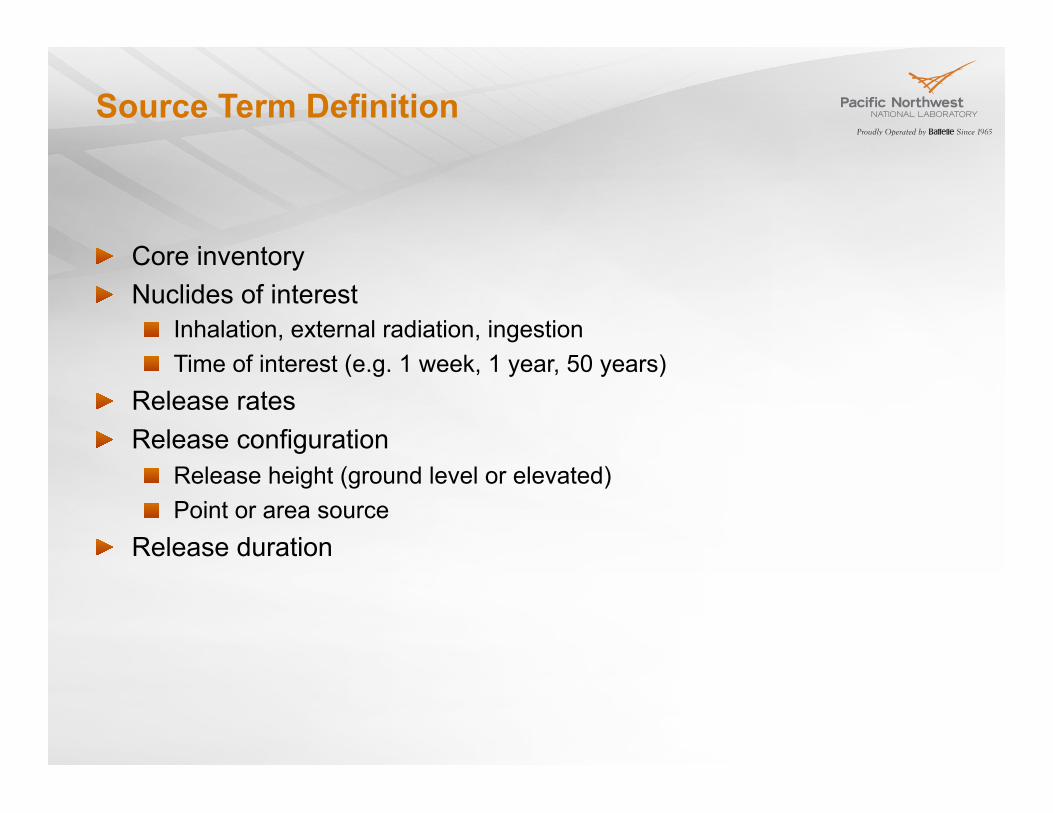
Source Term Definition
! Core inventory ! Nuclides of interest
! Inhalation, external radiation, ingestion ! Time of interest (e.g. 1 week, 1 year, 50 years)
! Release rates ! Release configuration
! Release height (ground level or elevated) ! Point or area source
! Release duration
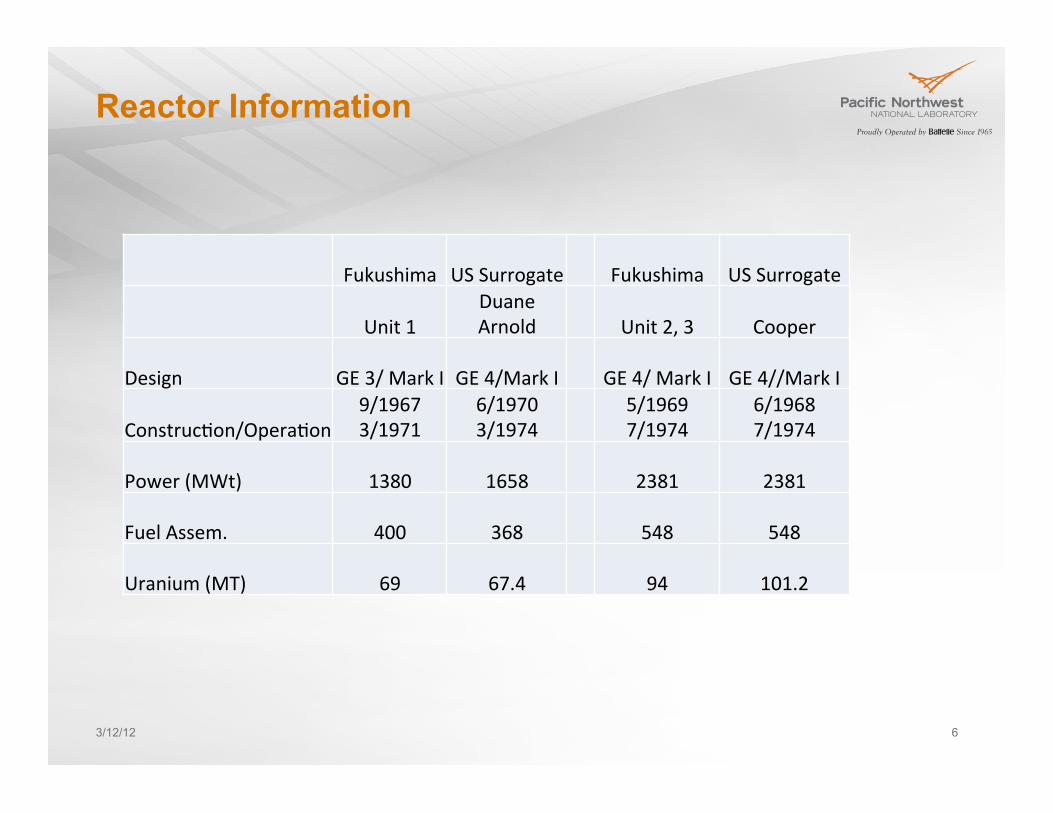
Reactor Information
Fukushima US Surrogate Fukushima US Surrogate
Unit 1 Duane Arnold Unit 2, 3 Cooper
Design GE 3/ Mark I GE 4/Mark I GE 4/ Mark I GE 4//Mark I
ConstrucCon/OperaCon 9/1967 3/1971
6/1970 3/1974
5/1969 7/1974
6/1968 7/1974
Power (MWt) 1380 1658 2381 2381
Fuel Assem. 400 368 548 548
Uranium (MT) 69 67.4 94 101.2
3/12/12 6
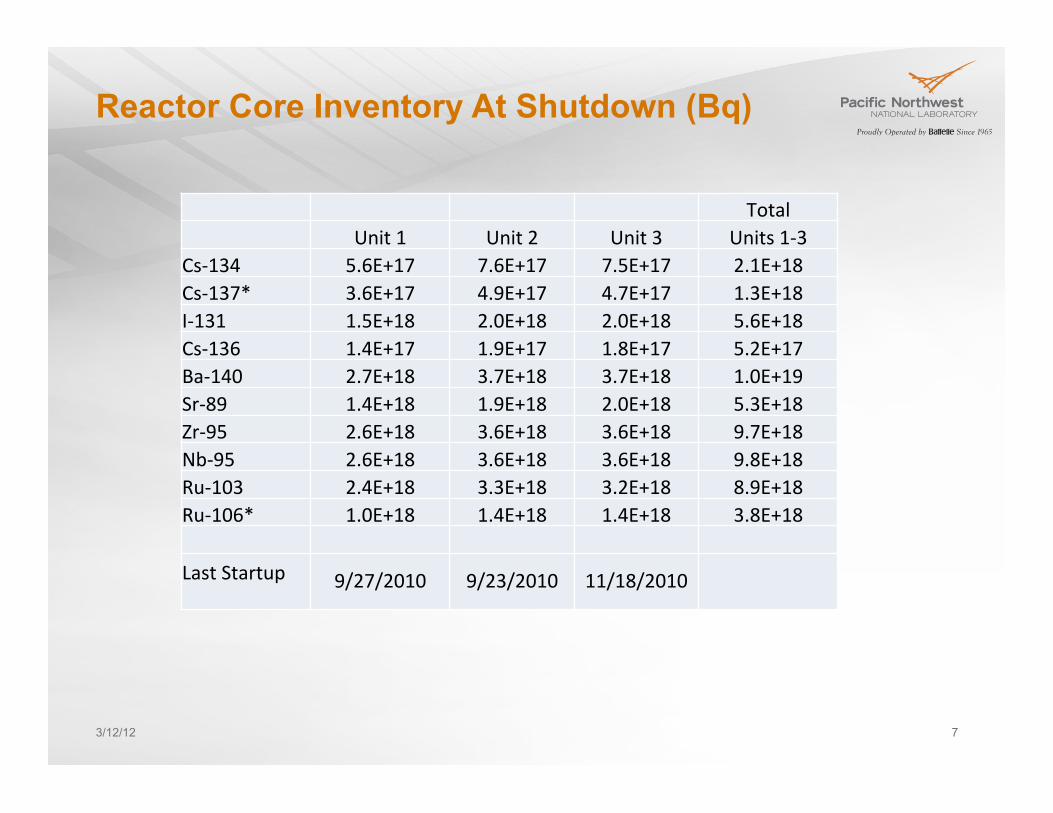
Reactor Core Inventory At Shutdown (Bq)
Total Unit 1 Unit 2 Unit 3 Units 1-‐3
Cs-‐134 5.6E+17 7.6E+17 7.5E+17 2.1E+18 Cs-‐137* 3.6E+17 4.9E+17 4.7E+17 1.3E+18 I-‐131 1.5E+18 2.0E+18 2.0E+18 5.6E+18 Cs-‐136 1.4E+17 1.9E+17 1.8E+17 5.2E+17 Ba-‐140 2.7E+18 3.7E+18 3.7E+18 1.0E+19 Sr-‐89 1.4E+18 1.9E+18 2.0E+18 5.3E+18 Zr-‐95 2.6E+18 3.6E+18 3.6E+18 9.7E+18 Nb-‐95 2.6E+18 3.6E+18 3.6E+18 9.8E+18 Ru-‐103 2.4E+18 3.3E+18 3.2E+18 8.9E+18 Ru-‐106* 1.0E+18 1.4E+18 1.4E+18 3.8E+18
Last Startup
9/27/2010 9/23/2010 11/18/2010
3/12/12 7
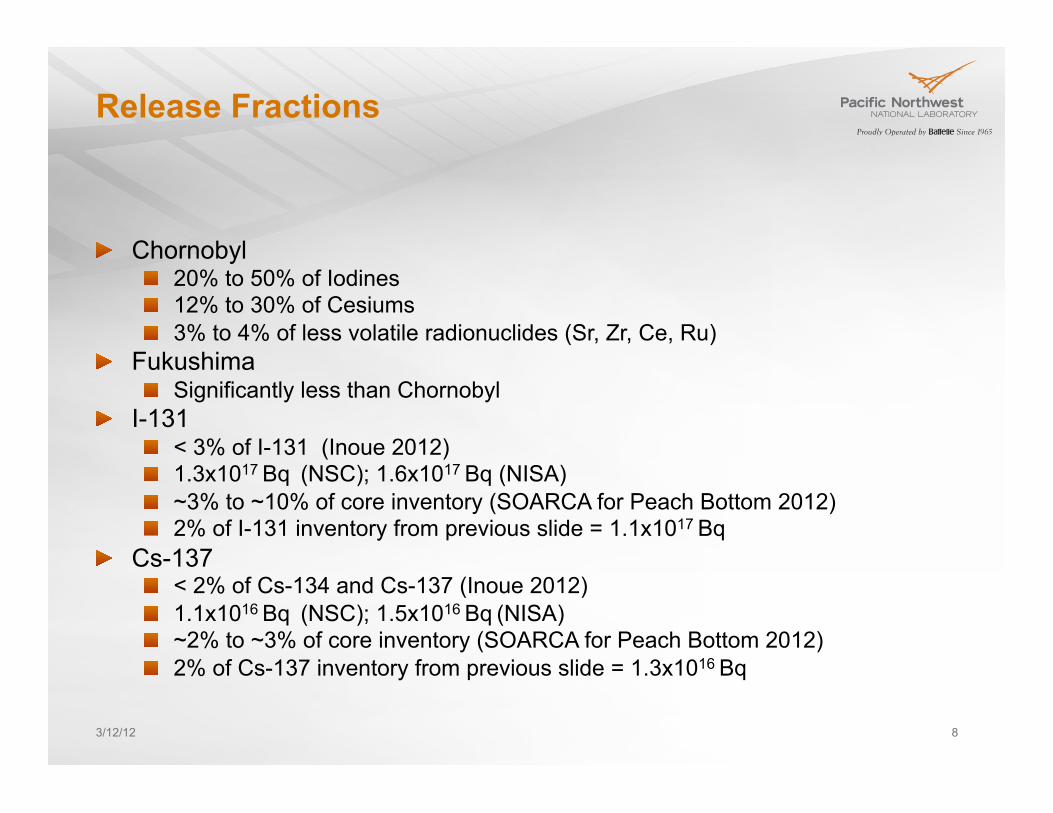
Release Fractions
! Chornobyl ! 20% to 50% of Iodines ! 12% to 30% of Cesiums ! 3% to 4% of less volatile radionuclides (Sr, Zr, Ce, Ru)
! Fukushima ! Significantly less than Chornobyl
! I-131 ! < 3% of I-131 (Inoue 2012) ! 1.3x10¹⁷ Bq (NSC); 1.6x10¹⁷ Bq (NISA) ! ~3% to ~10% of core inventory (SOARCA for Peach Bottom 2012) ! 2% of I-131 inventory from previous slide = 1.1x10¹⁷ Bq
! Cs-137
! < 2% of Cs-134 and Cs-137 (Inoue 2012) ! 1.1x10¹⁶ Bq (NSC); 1.5x10¹⁶ Bq (NISA) ! ~2% to ~3% of core inventory (SOARCA for Peach Bottom 2012) ! 2% of Cs-137 inventory from previous slide = 1.3x10¹⁶ Bq
3/12/12 8
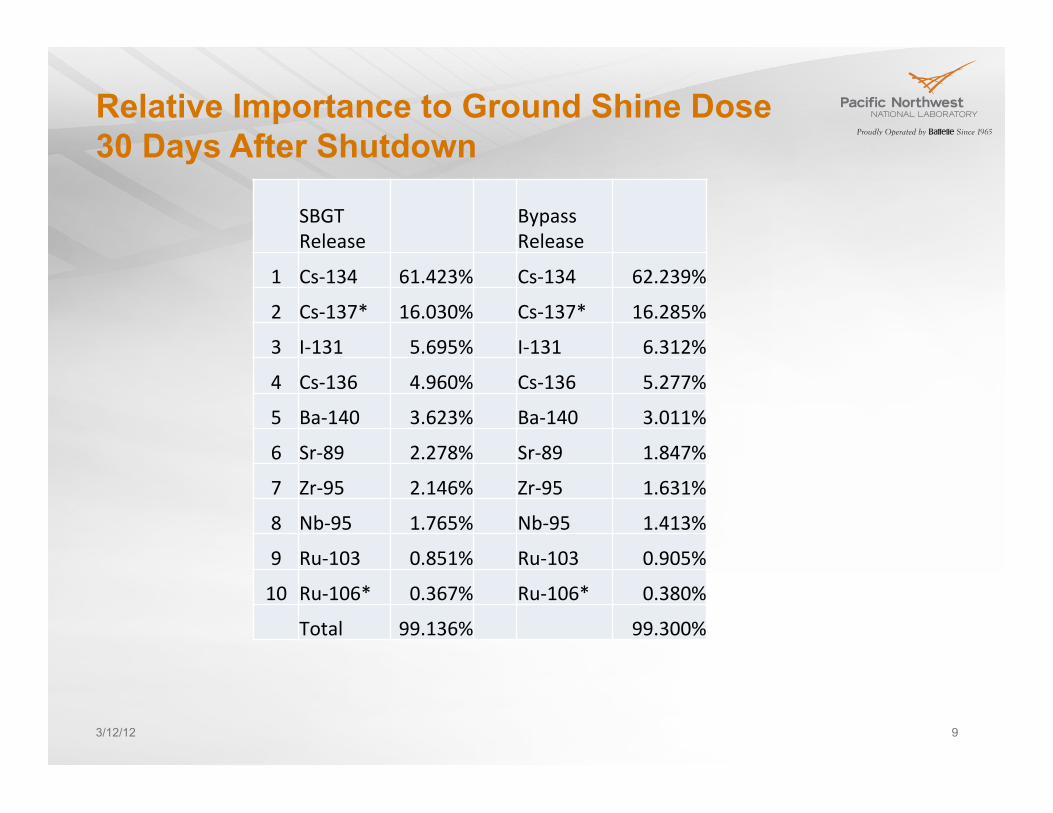
Relative Importance to Ground Shine Dose 30 Days After Shutdown
SBGT Release
Bypass Release
1 Cs-‐134 61.423% Cs-‐134 62.239%
2 Cs-‐137* 16.030% Cs-‐137* 16.285%
3 I-‐131 5.695% I-‐131 6.312%
4 Cs-‐136 4.960% Cs-‐136 5.277%
5 Ba-‐140 3.623% Ba-‐140 3.011%
6 Sr-‐89 2.278% Sr-‐89 1.847%
7 Zr-‐95 2.146% Zr-‐95 1.631%
8 Nb-‐95 1.765% Nb-‐95 1.413%
9 Ru-‐103 0.851% Ru-‐103 0.905%
10 Ru-‐106* 0.367% Ru-‐106* 0.380%
Total 99.136% 99.300%
3/12/12 9
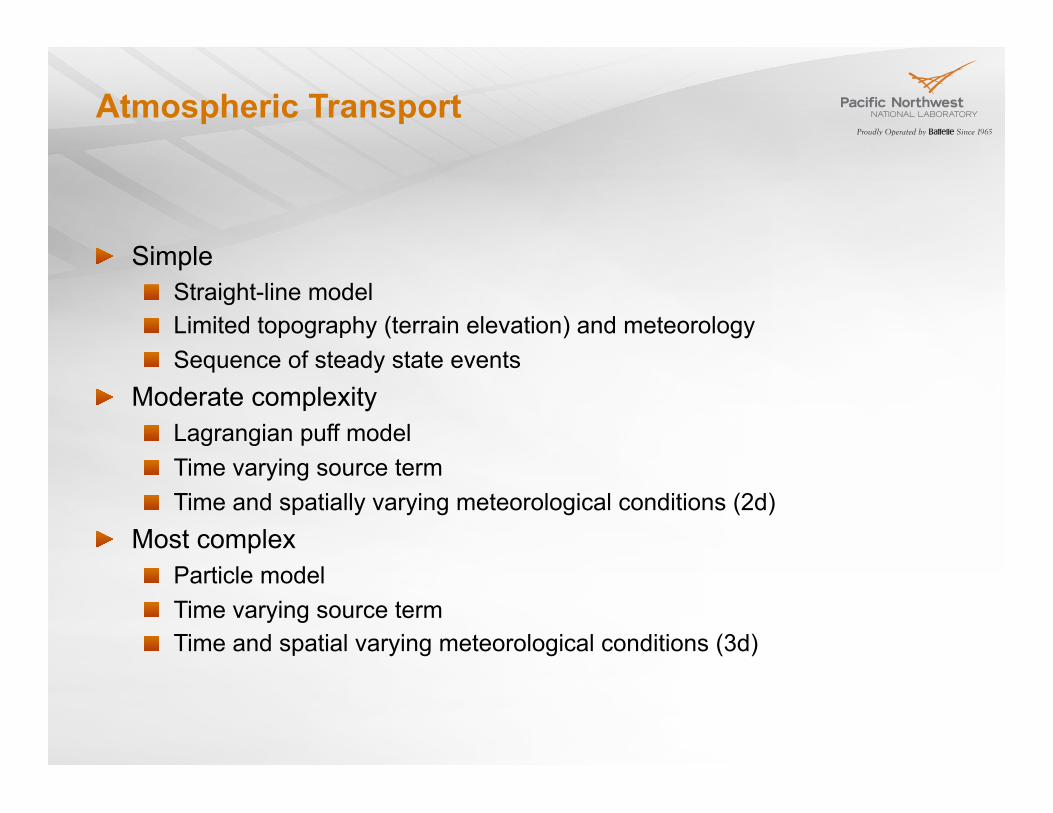
Atmospheric Transport
! Simple ! Straight-line model ! Limited topography (terrain elevation) and meteorology ! Sequence of steady state events
! Moderate complexity ! Lagrangian puff model ! Time varying source term ! Time and spatially varying meteorological conditions (2d)
! Most complex ! Particle model ! Time varying source term ! Time and spatial varying meteorological conditions (3d)

Dispersion
! Near field ! Series of steady-state conditions ! Local turbulence (wind speed, stability, surface roughness) ! Downwind variable (distance or time)
! Far field ! Wind shear ! Changing meteorological conditions ! Downwind variable (time)
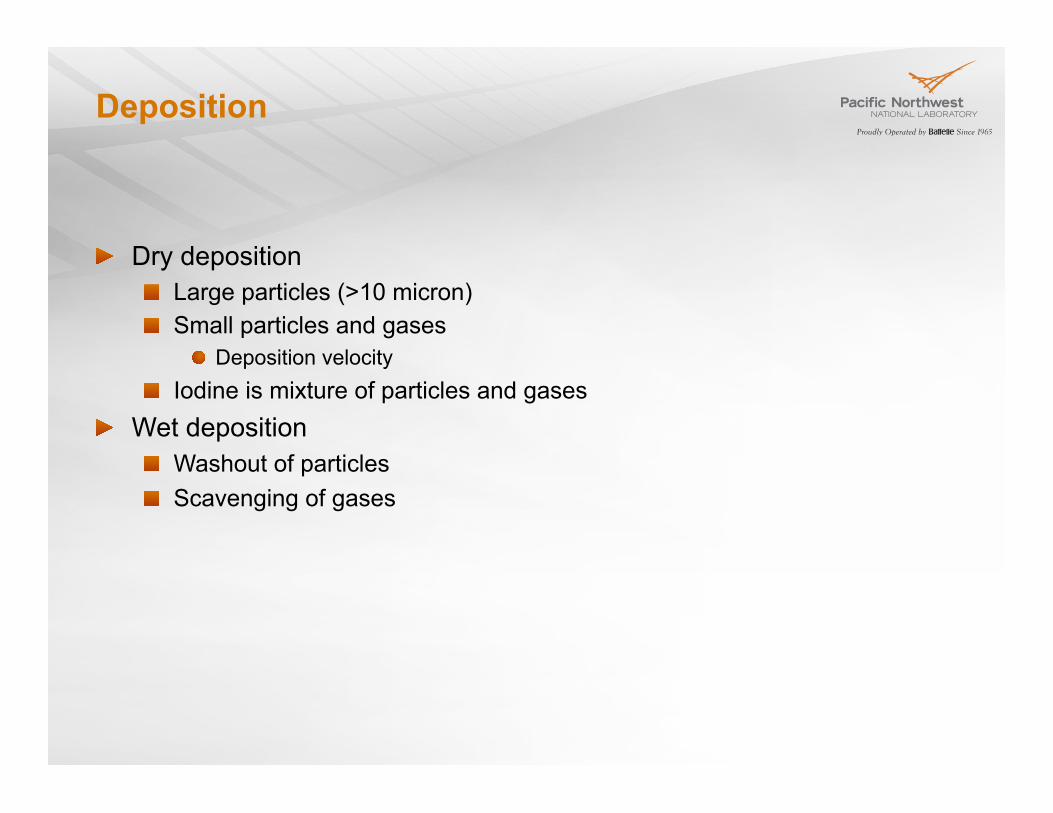
Deposition
! Dry deposition ! Large particles (>10 micron) ! Small particles and gases
! Deposition velocity ! Iodine is mixture of particles and gases
! Wet deposition ! Washout of particles ! Scavenging of gases
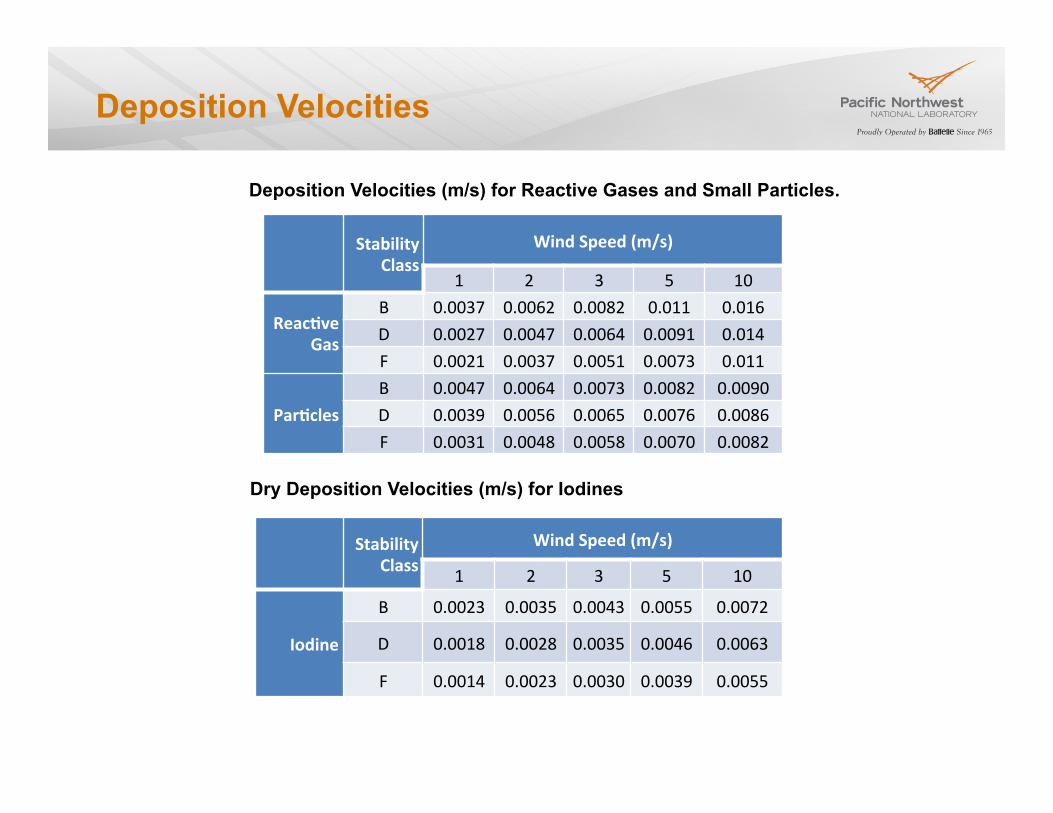
Deposition Velocities
Stability Class
Wind Speed (m/s)
1 2 3 5 10
Reac6ve Gas
B 0.0037 0.0062 0.0082 0.011 0.016 D 0.0027 0.0047 0.0064 0.0091 0.014 F 0.0021 0.0037 0.0051 0.0073 0.011
Par6cles B 0.0047 0.0064 0.0073 0.0082 0.0090 D 0.0039 0.0056 0.0065 0.0076 0.0086 F 0.0031 0.0048 0.0058 0.0070 0.0082
Stability Class
Wind Speed (m/s)
1 2 3 5 10
Iodine
B 0.0023 0.0035 0.0043 0.0055 0.0072
D 0.0018 0.0028 0.0035 0.0046 0.0063
F 0.0014 0.0023 0.0030 0.0039 0.0055
Deposition Velocities (m/s) for Reactive Gases and Small Particles.
Dry Deposition Velocities (m/s) for Iodines
Depletion
! Source-term depletion ! Simple models ! Deposited activity removed from whole plume
! Surface-depletion ! Complex models ! Activity deposited by dry deposition and wet deposition of gases removed
from surface layer ! Activity deposited by washout of particles removed from whole plume
Surface Processes Affecting Doses from Deposited Activity
! Weathering (groundshine doses) ! Anspaugh et al. 2002
! Resuspension (inhalation and submersion doses) ! Maxwell and Anspaugh 2011
! Occupancy ! Sheltering (See Till and Meyer 1983)
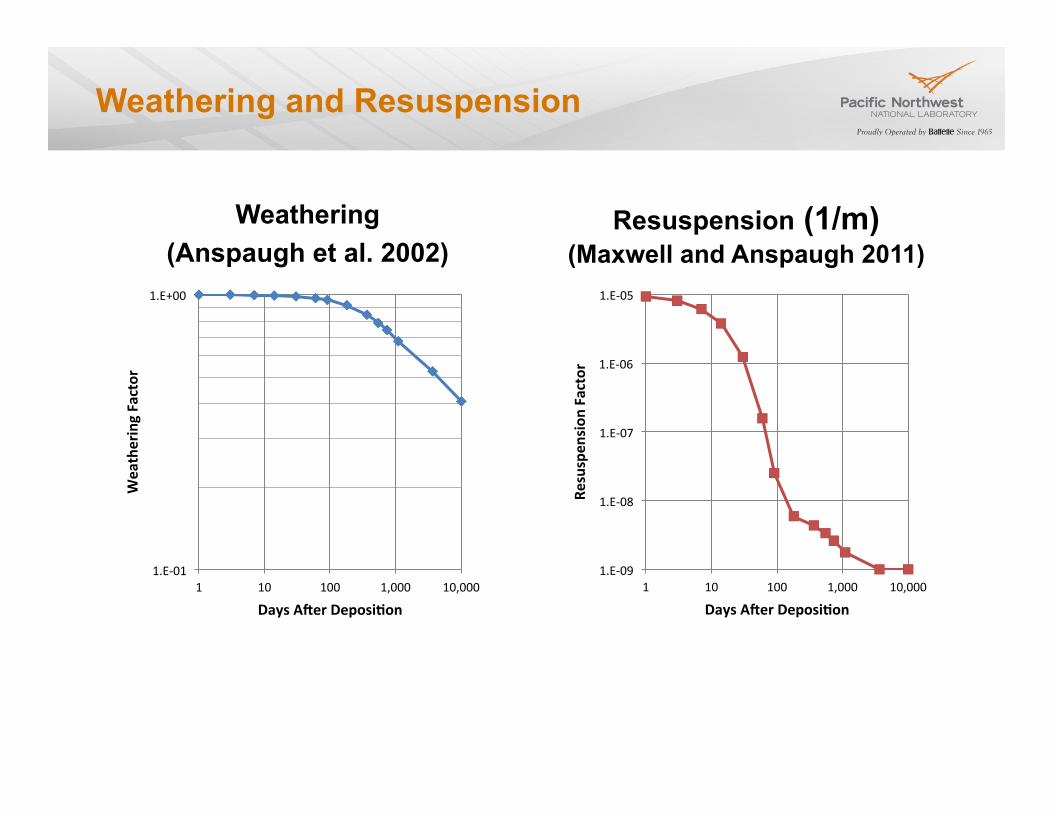
Weathering and Resuspension
Weathering (Anspaugh et al. 2002)
1.E-‐01
1.E+00
1 10 100 1,000 10,000
Weathering Factor
Days ABer Deposi6on
Resuspension (1/m) (Maxwell and Anspaugh 2011)
1.E-‐09
1.E-‐08
1.E-‐07
1.E-‐06
1.E-‐05
1 10 100 1,000 10,000 Re
suspen
sion
Factor
Days ABer Deposi6on
Decay and Daughter Ingrowth
! Bateman equations ! Important nuclides (after 30 days)
! Simple decay (most nuclides) ! Equilibrium (Cs-137, Ru-106, Ce-144)
Uncertainty
! Measurements ! Point measurements ! Integrated measurements
! Example – Hanford Kr-85 monitoring data ! Model parameters
! Basic data ! Correlations
! Example – September 1963 Iodine-131 Release
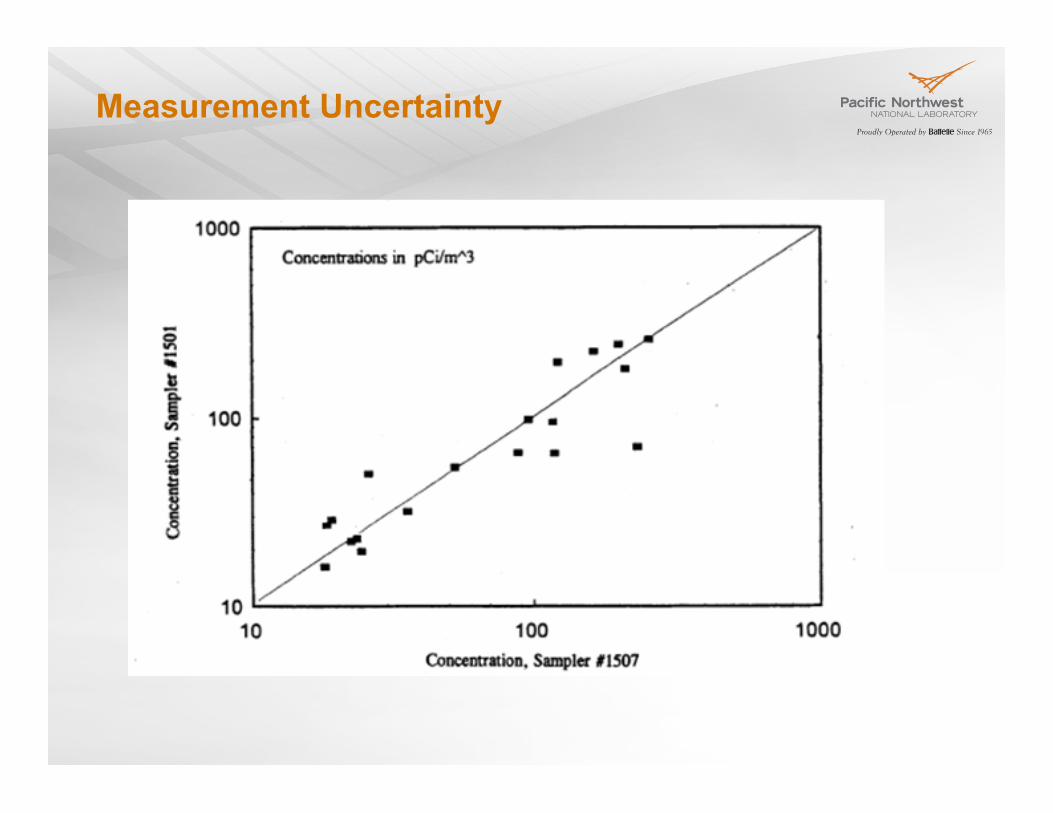
Measurement Uncertainty
Hanford Iodine-131 Release, September 1963 ! Unplanned, but monitored, release of about 72 Ci of I-131 through 60
m stack ! Release over several days (high for 2 days followed by low levels for
several weeks) ! Hourly meteorological data, no significant rain ! Environmental measurements of I-131 in grass for about a month
about 20 miles from the release point.
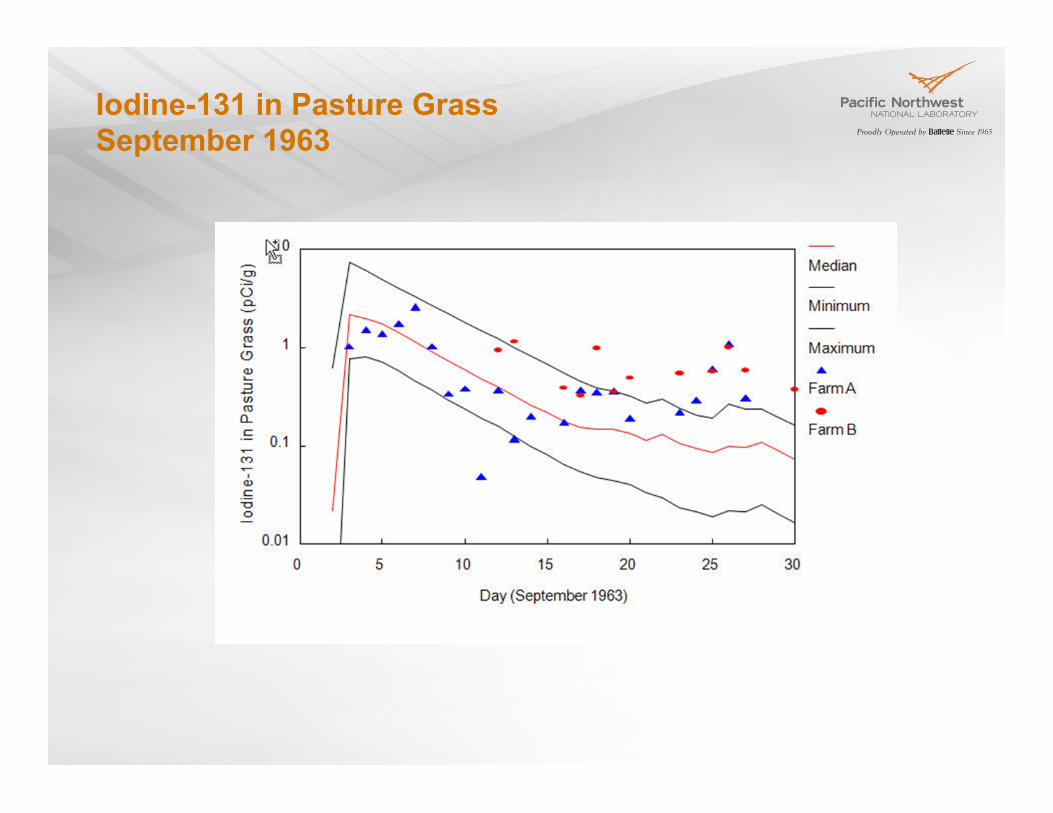
Iodine-131 in Pasture Grass September 1963
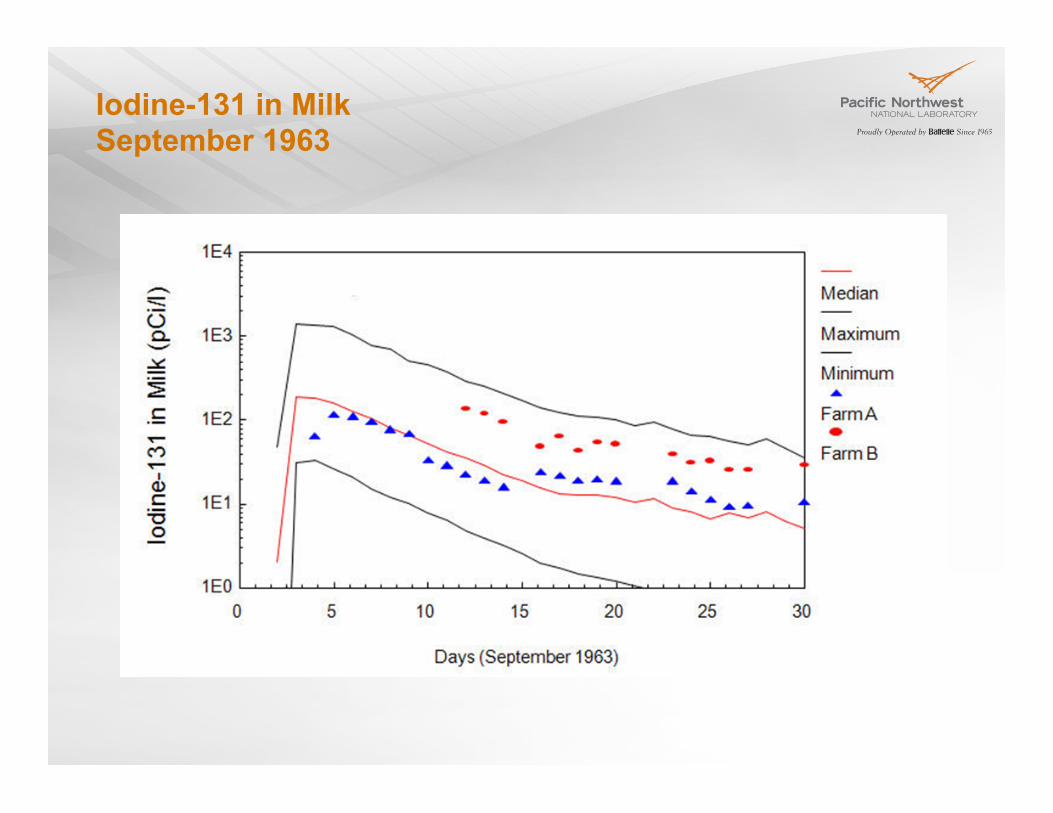
Iodine-131 in Milk September 1963
Conclusions
! Modeling should be based on best available estimate of release configuration and release rates.
! Modeling should include appropriate representations of atmospheric processes.
! Modeling should include appropriate consideration of model form and parameter uncertainty.
! Intermediate and final model results should be compared with known information when possible.
! Comparisons between model predictions and measured values should include consideration of model uncertainty and variability of measured values.
Information Sources
! Anspaugh et al. 2002. “Movement of Radionuclides in Terrestrial Ecosystems by Physical Processes.” Health Physics 82(5)
! Chang et al. 2012. State-of-the-Art Reactor Consequence Analysis (SOARCA) Report. (Figures 1 and 2). NUREG-1935 Draft for Comment.
! Inoue. 2012. “Overview of Environmental Contamination by Radioactivity Discharged from Fukushima Daiichi NPP. Presented at Japan/US DOE Workshop on Remediation, Feb. 13-15, 2012.
! Institute of Nuclear Power Operations. 2011. Special Report on the Nuclear Accident at the Fukushima Daiichi Nuclear Power Station (Table 7.3). INPO-11-005.
! Klug, et al. 1992. Evaluation of Long Range Atmospheric Transport Models Using Environmental Radioactivity Data from the Chernobyl Accident. Elsevier.
! Maxwell and Anspaugh. 2011. ‘An Improved Model for Prediction of Resuspension.” Health Physics 101(6).
! Napier, et al. 1994. Validation of HEDR Models. PNWD-2223 HEDR ! Ramsdell et al. 1994. Regional Atmospheric Transport Code for Hanford Emission Tracking (RATCHET).
PNWD-2224 HEDR ! Ramsdell et al. 2001. Environmental Effects of Extending Fuel Burnup Above 60 GWd/MTU. NUREG/
CR-6703 ! Ramsdell et al. 2012. RASCAL 4: Descriptions of Models and Methods. NUREG-1940 (in preparation) ! Till and Meyer. 1983. Radiological Assessment A Textbook on Environmental Dose Analysis. NUREG/
CR-3332 ! Vargo. 2000. The Chornobyl Accident: Comprehensive Risk Assessment. Battelle Press.