Embed Size (px)
Citation preview

Modeling the Internet: stat. observables, dynamical approaches, parameter proliferation………………..
A.Vespignani

Romualdo Pastor-SatorrasIgnacio Alvarez-HamelinLuca Dall’AstaAlain BarratVic ColizzaMark MeissFilippo MenczerMariangels Serrano Alexei Vazquez
Collaborators

Once upon a time there was the physical Internet….

The beginning…..
Faloutsos et al. 1999
Degree distribution of the Internet graph(AS and Router level)
Measurement infrastructuresPassive/active measurements(CAIDA; NLANR; Lumeta…)

Internet graphs…..Skewed Heterogeneity and high variability Very large fluctuations(variance>>average)Various fits : power-law+cut-off; Weibull etc.


Higher order statistical characterization….
Model validation……
Model construction…..

Multi-point correlationsP(k,k’)
•0-dimensional projection (pearson coefficient)M. Newman (2002)
•One-dimensional projection (average nearest neighbor degree)Pastor-Satorras & A.V. (2001)
•Three dimensional analysisMaslov&Sneppen (2002)

Average nearest neighbors degree
knn(i) = Σj kj1ki
Correlation spectrum:Average over degree classes < knn(k)>
Multi-point correlationsP(k,k’)

Degreecorrelationfunction
< knn(k)> = Σk’ k’ p(k’|k)
k (k)
k
nn
Assortative
Disassortative
k
Assortative behaviour: growing knn(k)Example: social networksLarge sites are connected with large sites
Disassortative behaviour: decreasing knn(k)Example: internetLarge sites connected with small sites

Degree correlationfunction< knn(k)> = Σk’ k’ p(k’|k)
Highly degree ASsconnect to low degreeASs
Low degree ASs connectto high degree ASs
No hierarchy for the router mapPastor Satorras, Vazquez &Vespignani, PRL 87, 258701 (2001)


Clustering coefficient = connected peers willlikely know each other
C =# of links between 1,2,…k neighbors
k(k-1)/2
1
2
3
n
Higher probability to be connected

Clustering spectrum
Clustering spectrum
This is a kind of three-points correlation function…..

ClusteringClustering SpectrumSpectrum in the Internetin the InternetClustering coefficient as a function of the vertex degree
Highly degree ASs bridge not connected regions of the Internet Low degree ASs have links with highly interconnected regions of the Internet
Vazquez et al.Physical Review E 65, 066130 (2002).


Rich-Club coefficientFraction of edges shared by nodes of degree >k with respect to the Maximum allowed number.
Increasing interconnectivity for increasing k
Rich-club phenomenon??


Normalized rich-club coefficient
It is possible to show that for a completely uncorrelatednetwork
Coefficient of the maximally randomized equivalent graph
NO rich club phenomenon
V.Colizza et al.

K-core decomposition
K-shell
K-shell
K-shell

K-core structure…

http://xavier.informatics.indiana.edu/lanet-vi

Betweenness centrality = # of shortest paths traversing a vertex or edge (flow of information ) if each individuals send a message to all other individuals
Non-local measure of centrality
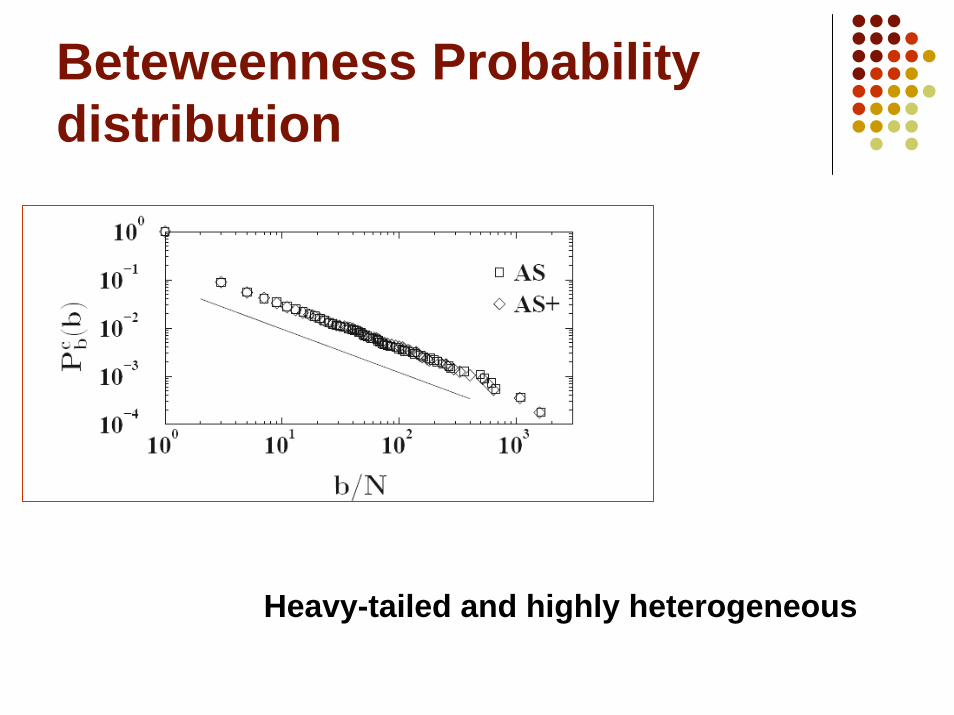
Beteweenness Probability distribution
Heavy-tailed and highly heterogeneous

Scale-free topology generators
INET (Jin, Chen, Jamin)
BRITE (Medina & Matta)
Classical topology generators
•Waxman generator
•Structural generatorsTransit-stubTiers
ExponentiallyBoundedDegree distributions
Modeling of the Network structure with ad-hoc algorithmstailored on the properties we consider more relevant

What about the degree distribution ?
Heavy tails ?
Static construction
Molloy-reedPosition modelHidden variables Etc.
Generalized random graphs with pre-assigned degree distribution

Shift of focus:
Static construction Dynamical evolution
Direct problem
Evolution rules Emerging topology
Inverse problem
Given topology Evolution rules
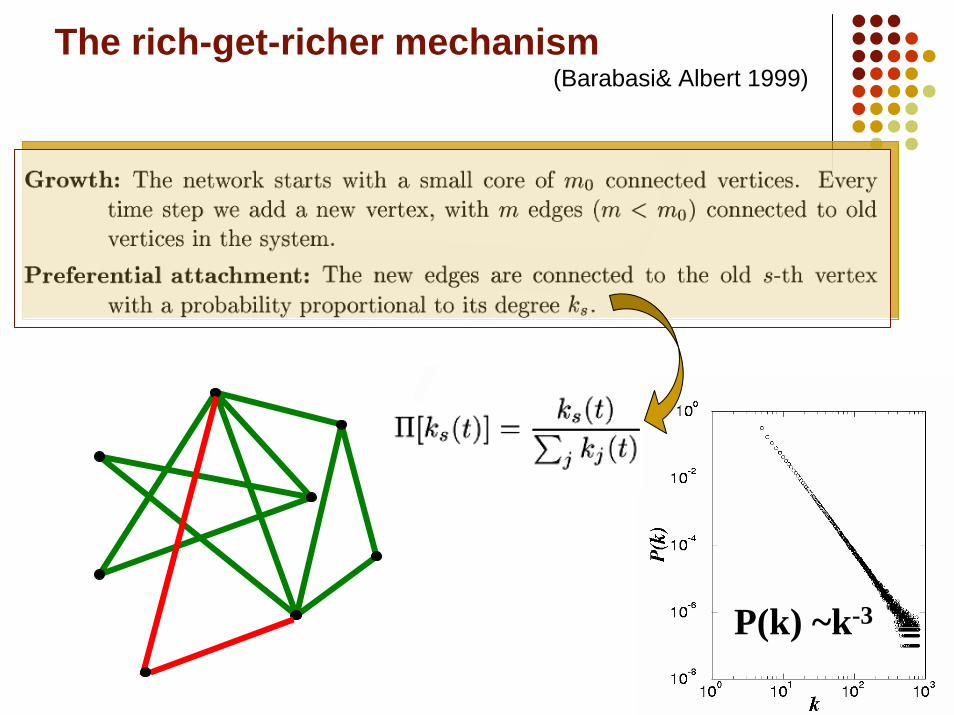
P(k) ~k-3
The rich-get-richer mechanism(Barabasi& Albert 1999)

Continuous approximations
Average degree value that the node born at time s has a time t
Evolution equation
{ }
Degree distribution

BA is a conceptual model….It has not been thought to specifically model the InternetMore details/realism/ingredients needed

COPY MODEL
Dynamical evolution Preferential attachment component
Degree distribution

More models
•Generalized BA model
(Redner et al. 2000)
(Mendes & Dorogovstev 2000)
(Albert et al.2000)
∑≅Π
j jj
iii k
kkη
η)(
Non-linear preferential attachment : Π(k) ~ kα
Initial attractiveness : Π(k) ~ A+kα
Rewiring
•Highly clustered(Eguiluz & Klemm 2002)
•Fitness Model(Bianconi et al. 2001)
•Multiplicative noise(Huberman & Adamic 1999)

Heuristically Optimized Trade-offs (HOT)Papadimitriou et al. (2002)
New vertex i connects to vertex j by minimizing the functionY(i,j) = α d(i,j) + V(j)
d= euclidean distanceV(j)= measure of centrality
Optimization of conflicting objectives

Model validation……Correlations
Clustering
Hierarchies (k-cores, modularity etc.)
………..

Clustering spectrumCorrelation spectrum

Clustering spectrum
Correlation spectrum

Rich-club coefficient

K-core structure

http://xavier.informatics.indiana.edu/lanet-vi

EE--R modelR model

B-A Model

Wide spectrum of complications and complex features to include…
IP 1
IP 2
IP 3
Simple RealisticAbility to explain (caveats) trends at a population level
Model realism looses in transparency. Validation is harder.
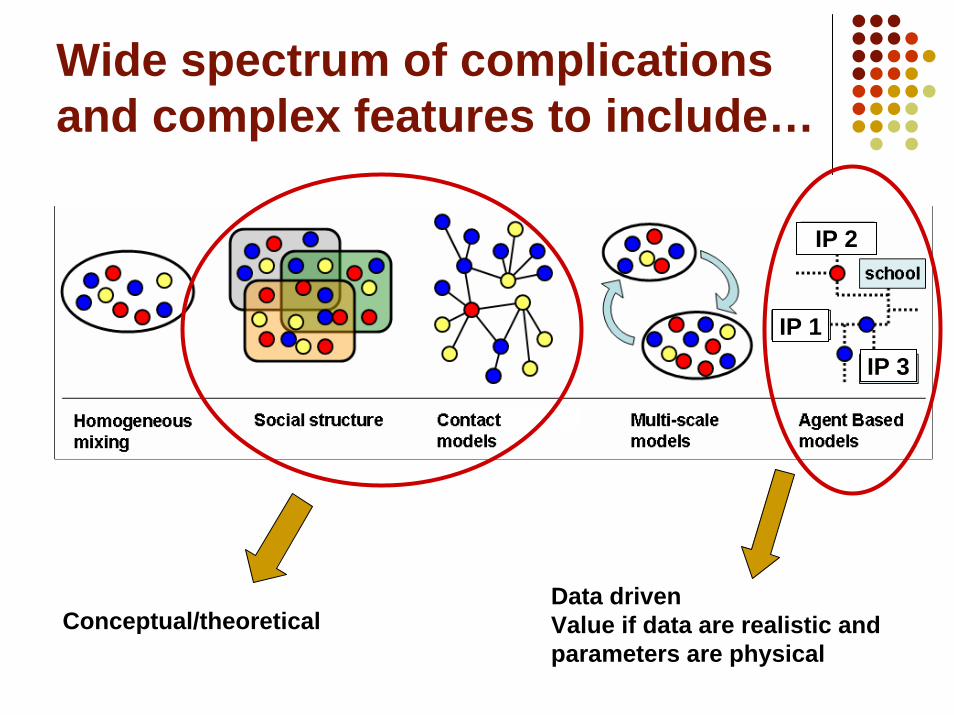
Wide spectrum of complications and complex features to include…
Conceptual/theoreticalData drivenValue if data are realistic and parameters are physical
IP 1
IP 2
IP 3

Agent Based Modeling
The good…Data driven:Demographic, societal, census data from real
experimentsSensibility analysis / scenario evaluation
The bad…Non-physical parameters
(non-measurable/fitness/unmotivated parameters etc.)…
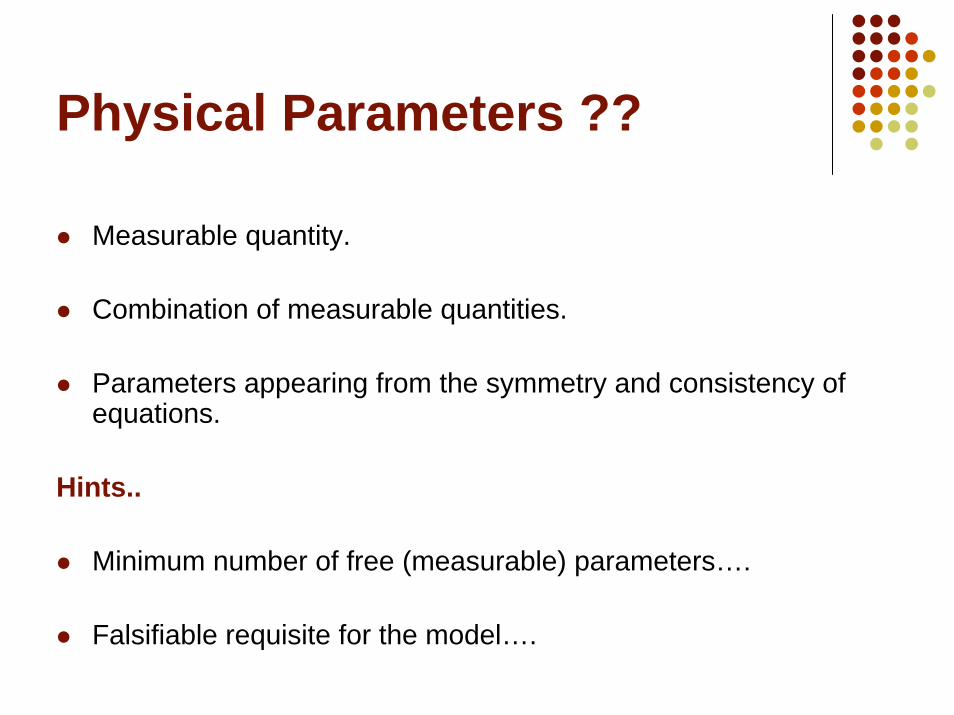
Physical Parameters ??
Measurable quantity.
Combination of measurable quantities.
Parameters appearing from the symmetry and consistency of equations.
Hints..
Minimum number of free (measurable) parameters….
Falsifiable requisite for the model….

A few examples….
BA model
Rewiring/copy model
Fitness model
HOT
∑≅Π
j jj
iii k
kkη
η)(
Y(i,j) = a d(i,j) + V(j)
Census/societal data
Geographical data
Traffic data
In the lack of that ……..topology generators!!
(Using measurement data)

Effect of complex network topologies on physical processes
Epidemic models
Resilience & robustness
Avalanche and failure cascades
Search and diffusion…..