Embed Size (px)
Citation preview
Modeling the Impact of a Falling Rock Cluster onRigid Structures
Ge Gao1 and Mohamed A. Meguid, P.Eng., M.ASCE2
Abstract: Rockfall is a common geological hazard in mountainous areas and can pose great danger to people and properties.Understanding the impact forces induced by a single rock or a rock cluster on retaining structures is considered key in the analysis anddesign of protection barriers. This study presents the results of small-scale laboratory experiments conducted to measure the impact forcesinduced by a group of rocks moving down a rough slope on a barrier wall. The effect of slope inclination angle and wall location on theimpact pressure acting on the wall was examined. A three-dimensional discrete element model was then proposed and used to study thebehavior of the rock cluster under different geometric conditions. Rocks were modeled using polydisperse clumps in which each clumpconsisted of several overlapping spherical particles to account for the shape effect of the falling rocks. First, the model was validated bycomparing the measured and calculated forces, and then, it was used to investigate the role of different material and geometric parameterson the impact behavior. Conclusions were made regarding the role of modeling the irregular rock shapes and the roughness of the slopesurface on the behavior impacted by the travel mode for different slope angles. DOI: 10.1061/(ASCE)GM.1943-5622.0001045. © 2017American Society of Civil Engineers.
Author keywords: Rockfall analysis; Discrete element; Impact force measurement; Protective barriers.
Introduction
Gravity-driven rockfall is generally characterized by extreme rapid-ity and long traveled distance. Rockfall usually involves a suddenmovement of either a single rock or a group of rocks that detachfrom the rock face and can lead to property damage, personal injury,and even loss of life when people, vehicles, or railways are in therock-movement path. Mitigation measures are, therefore, critical atvulnerable locations and may include the installation of engineeredprotection structures, such as flexible rock fences, catchmentditches, or rigid barriers. Catchment areas are often used alongtransportation corridors to retain a large volume of rock. However,a significantly large catchment area may be needed for high slopes,but is sometimes limited by the right-of-way acquisition. Wall-typestructures require a small footprint and can be constructed usingstiff material (concrete or timber) or flexible material (rock fences).Because they are prone to damage by high-energy events, rigidwalls are used for relatively low-energy impacts (Turner andSchuster 2013).
Understanding the mechanics of rockfall and the possible impactforce on rigid barriers under various conditions is important to thedesign of protection systems.
Previous studies [e.g., Basson (2012); Wei et al. (2014)] andfield observations [e.g., Giani et al. (2004); Alejano et al.
(2007); Spadari et al. (2012)] showed that falling rocks experi-ence different types of motion along the path, including free fall-ing, rolling, bouncing, and sliding. Ritchie (1963) investigatedthe movement pattern of rockfall and produced design criteria todetermine the geometry of the catchment area according to slopeheight and inclination angle. Rockfall analysis was generallyperformed to assess the rockfall velocity and impact energyusing either empirical approaches or numerical simulations(Turner and Schuster 2013).
Different computational modeling approaches are available tosimulate rockfall, including lumped mass, rigid-body dynamics,and discrete-element analysis. The lumped-mass approach assumesthat a falling rock can be represented by a single material point thathas a concentrated mass, ignoring the effect of the rock shape, size,and rotation (Guzzetti et al. 2002; Agliardi and Crosta 2003). Therigid-body model, developed by Descouedres and Zimmermann(1987), is a three-dimensional (3D) kinetic-impact model used tosimulate rolling, impact, and rebound motions (Frattini et al. 2008;Agliardi et al. 2009). The method uses kinematics and equations ofmotion to analyze a collision by assuming instantaneous contact onsmall contact areas between colliding bodies. The discrete-elementmethod (DEM), introduced by Cundall and Strack (1979), hasattracted great attention over the last few decades to model rockfallhazard [e.g., Magnier and Donz�e (1998); Nicot et al. (2001);Plassiard and Donz�e (2009); Wang and Tonon (2011); Chen et al.(2013); Bonilla-Sierra et al. (2015)]. Various discrete-elementapproaches are available to reproduce the irregular shape and geom-etry of moving rock. The impact forces between two entities aregenerally obtained using different contact models and explicit time-stepping algorithms. Compared with other methods of rockfall anal-ysis (lumped mass and rigid-body dynamics), the DEM is consid-ered to be more rigorous and can accurately replicate trajectoriesand rolling and sliding behaviors. It also models crack propagationand breakage of the falling body.
A considerable number of experimental and numerical studieshave been reported in the literature that evaluated rockfall impact
1Graduate Student, Dept. of Civil Engineering and Applied Mechanics,McGill Univ., 817 Sherbrooke St. W., Montreal, QC, Canada H3A 0C3.E-mail: [email protected]
2Associate Professor, Dept. of Civil Engineering and AppliedMechanics, McGill Univ., 817 Sherbrooke St. W., Montreal, QC, CanadaH2A 0C3 (corresponding author). ORCID: https://orcid.org/0000-0002-5559-194X. E-mail: [email protected]
Note. This manuscript was submitted on September 12, 2016;approved on July 31, 2017; published online on November 28, 2017.Discussion period open until April 28, 2018; separate discussions must besubmitted for individual papers. This paper is part of the InternationalJournal of Geomechanics, © ASCE, ISSN 1532-3641.
© ASCE 04017141-1 Int. J. Geomech.
Int. J. Geomech., 2018, 18(2): 04017141
Dow
nloa
ded
from
asc
elib
rary
.org
by
McG
ill U
nive
rsity
on
11/2
8/17
. Cop
yrig
ht A
SCE
. For
per
sona
l use
onl
y; a
ll ri
ghts
res
erve
d.
on various protection systems, including drapery [e.g., Thoeni et al.(2014)], embankments [e.g., Plassiard and Donz�e (2009)], and rigidwalls [e.g., Kishi et al. (2000)]. Although these studies providesome comprehension of the impact mechanics of rockfall on barriersystems, quantification through measurements of impact forcesinduced by a rock cluster on vertical walls is needed.
Scope andObjective
The objective of this study was to investigate the impact forcesexerted by a group of rocks moving down a rough slope using 3Ddiscrete-element analysis. Using tactile sensing technology, labora-tory experiments were first conducted to measure the impact forcesinduced by two different rock clusters on an instrumented wall. Theexperimental results were used to validate the discrete elementmodel that had been developed and used throughout this study.Emphasis was placed on modeling the irregular-shaped geometryof the rocks and the slope roughness and inclination angles. Theresults presented in this paper provide new insights into understand-ing the impact mechanics of a falling rock cluster on rigidstructures.
Experimental Study
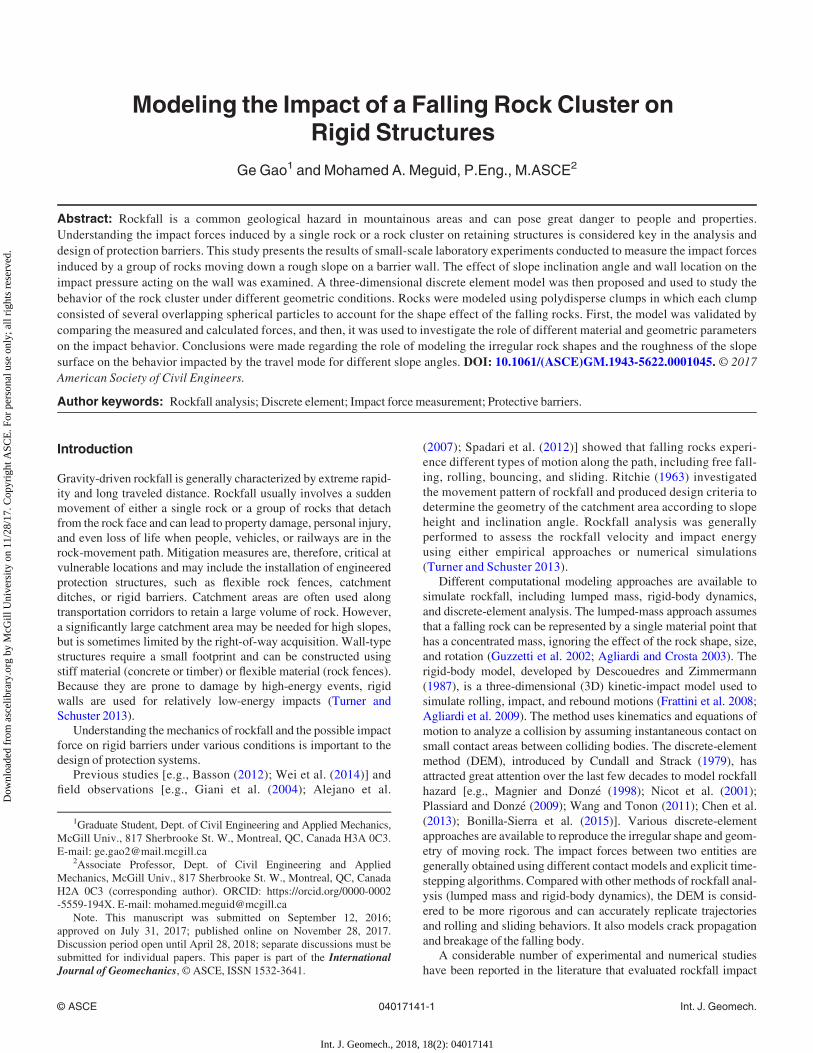
A flume measuring 1.82 m in length, 0.6 m in width, and 0.3 m indepth was constructed and used in this study to simulate rockfall ona rough surface. The flume was supported by a steel structure thatallows the slope angle to be adjusted. Three inclination angles (a)were examined in this study: 30, 45, and 60° (Fig. 1). The sidewallsand the release box were made of transparent plexiglass materialsuch that the rock movement was monitored using a video camera.An instrumented wall was placed at different locations from the toeof the slope and used to measure the impact pressure induced bytwo different rock clusters.
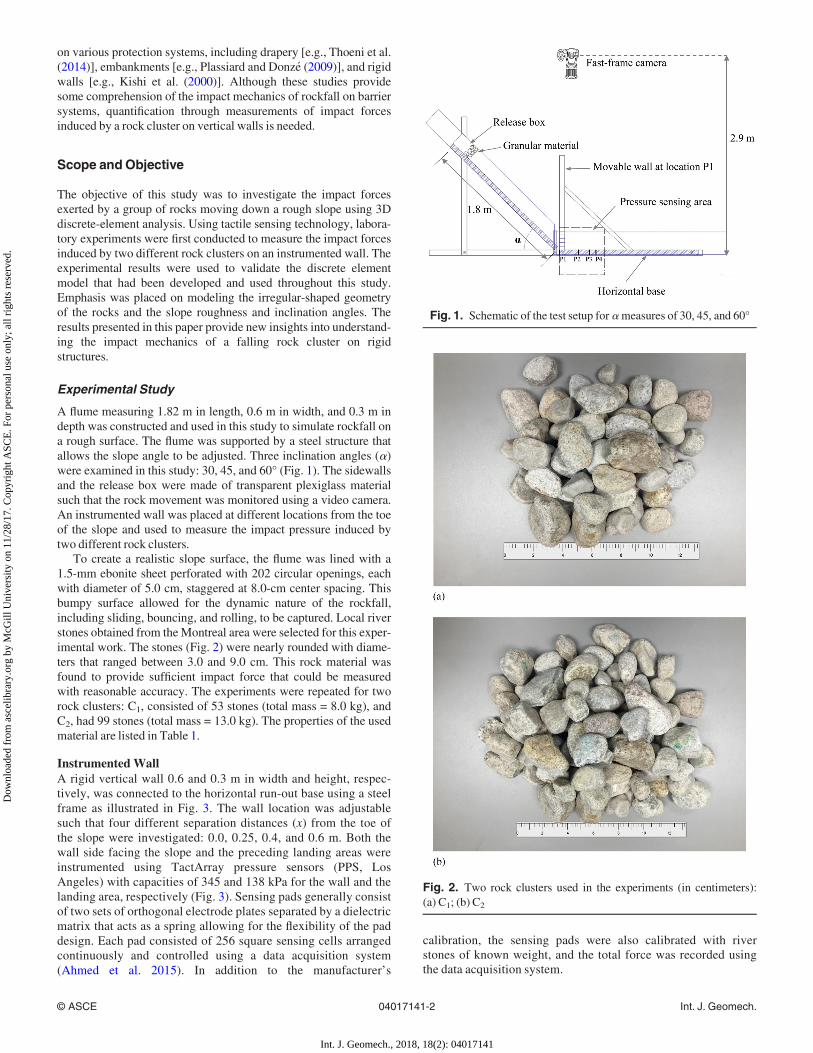
To create a realistic slope surface, the flume was lined with a1.5-mm ebonite sheet perforated with 202 circular openings, eachwith diameter of 5.0 cm, staggered at 8.0-cm center spacing. Thisbumpy surface allowed for the dynamic nature of the rockfall,including sliding, bouncing, and rolling, to be captured. Local riverstones obtained from theMontreal area were selected for this exper-imental work. The stones (Fig. 2) were nearly rounded with diame-ters that ranged between 3.0 and 9.0 cm. This rock material wasfound to provide sufficient impact force that could be measuredwith reasonable accuracy. The experiments were repeated for tworock clusters: C1, consisted of 53 stones (total mass = 8.0 kg), andC2, had 99 stones (total mass = 13.0 kg). The properties of the usedmaterial are listed in Table 1.
InstrumentedWallA rigid vertical wall 0.6 and 0.3 m in width and height, respec-tively, was connected to the horizontal run-out base using a steelframe as illustrated in Fig. 3. The wall location was adjustablesuch that four different separation distances (x) from the toe ofthe slope were investigated: 0.0, 0.25, 0.4, and 0.6 m. Both thewall side facing the slope and the preceding landing areas wereinstrumented using TactArray pressure sensors (PPS, LosAngeles) with capacities of 345 and 138 kPa for the wall and thelanding area, respectively (Fig. 3). Sensing pads generally consistof two sets of orthogonal electrode plates separated by a dielectricmatrix that acts as a spring allowing for the flexibility of the paddesign. Each pad consisted of 256 square sensing cells arrangedcontinuously and controlled using a data acquisition system(Ahmed et al. 2015). In addition to the manufacturer’s
calibration, the sensing pads were also calibrated with riverstones of known weight, and the total force was recorded usingthe data acquisition system.
Fig. 1. Schematic of the test setup for ameasures of 30, 45, and 60°
Fig. 2. Two rock clusters used in the experiments (in centimeters):(a) C1; (b) C2
© ASCE 04017141-2 Int. J. Geomech.
Int. J. Geomech., 2018, 18(2): 04017141
Dow
nloa
ded
from
asc
elib
rary
.org
by
McG
ill U
nive
rsity
on
11/2
8/17
. Cop
yrig
ht A
SCE
. For
per
sona
l use
onl
y; a
ll ri
ghts
res
erve
d.
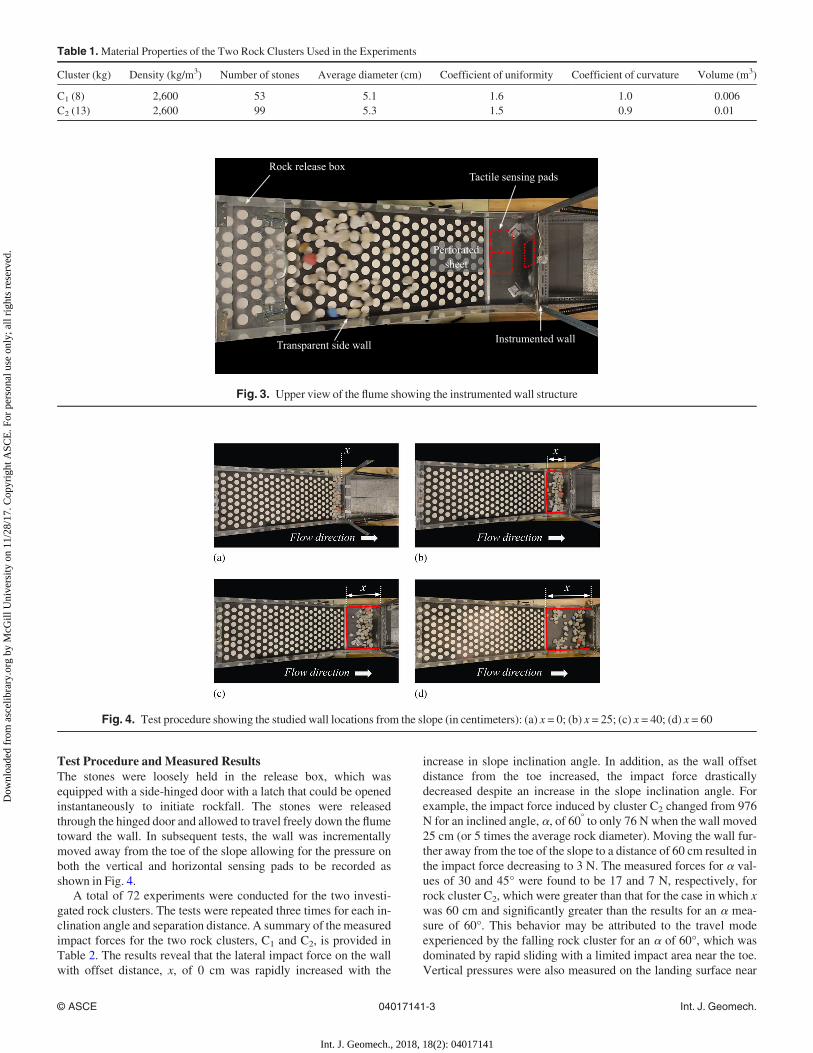
Test Procedure andMeasured ResultsThe stones were loosely held in the release box, which wasequipped with a side-hinged door with a latch that could be openedinstantaneously to initiate rockfall. The stones were releasedthrough the hinged door and allowed to travel freely down the flumetoward the wall. In subsequent tests, the wall was incrementallymoved away from the toe of the slope allowing for the pressure onboth the vertical and horizontal sensing pads to be recorded asshown in Fig. 4.
A total of 72 experiments were conducted for the two investi-gated rock clusters. The tests were repeated three times for each in-clination angle and separation distance. A summary of themeasuredimpact forces for the two rock clusters, C1 and C2, is provided inTable 2. The results reveal that the lateral impact force on the wallwith offset distance, x, of 0 cm was rapidly increased with the
increase in slope inclination angle. In addition, as the wall offsetdistance from the toe increased, the impact force drasticallydecreased despite an increase in the slope inclination angle. Forexample, the impact force induced by cluster C2 changed from 976N for an inclined angle, a, of 60° to only 76 N when the wall moved25 cm (or 5 times the average rock diameter). Moving the wall fur-ther away from the toe of the slope to a distance of 60 cm resulted inthe impact force decreasing to 3 N. The measured forces for a val-ues of 30 and 45° were found to be 17 and 7 N, respectively, forrock cluster C2, which were greater than that for the case in which xwas 60 cm and significantly greater than the results for an a mea-sure of 60°. This behavior may be attributed to the travel modeexperienced by the falling rock cluster for an a of 60°, which wasdominated by rapid sliding with a limited impact area near the toe.Vertical pressures were also measured on the landing surface near
Table 1.Material Properties of the Two Rock Clusters Used in the Experiments
Cluster (kg) Density (kg/m3) Number of stones Average diameter (cm) Coefficient of uniformity Coefficient of curvature Volume (m3)
C1 (8) 2,600 53 5.1 1.6 1.0 0.006C2 (13) 2,600 99 5.3 1.5 0.9 0.01
Rock release box Tactile sensing pads
Instrumented wall Transparent side wall
Perforated sheet
Fig. 3. Upper view of the flume showing the instrumented wall structure
Fig. 4. Test procedure showing the studied wall locations from the slope (in centimeters): (a) x = 0; (b) x = 25; (c) x = 40; (d) x = 60
© ASCE 04017141-3 Int. J. Geomech.
Int. J. Geomech., 2018, 18(2): 04017141
Dow
nloa
ded
from
asc
elib
rary
.org
by
McG
ill U
nive
rsity
on
11/2
8/17
. Cop
yrig
ht A
SCE
. For
per
sona
l use
onl
y; a
ll ri
ghts
res
erve
d.
the wall for various offset distances and are presented in Table 3.These pressure values were found to be much smaller at this loca-tion than the lateral pressure values on the wall.
Numerical Analysis
A 3D discrete-element model was built with the commercial soft-ware package PFC3D using a soft-contact approach for whichdeformations occur at the contacts between the rigid bodies (e.g.,balls, clumps, and walls). The contact mechanics among thesebodies are briefly described in this section.
The overlap DUn of Particle A in contact with Particle B and awall is defined as
DUn ¼ RA þ RB � d; Ball�ballRA–d; Ball�wall
�(1)
where R = particle radius; and d = distance between the centers ofthe two particles or the shortest distance between the center of theparticle and the wall.
The contact force vector, FC, which represents the interaction ofParticles A and B for all-ball contact or the action of the ball on the
Table 2.Measured Impact Force on the Wall for Different Offset Distances and Slope Inclination Angles
Distance [x (cm)] Test
Impact force (N)
Cluster C1 (8 kg) Cluster C2 (13 kg)
Inclination angle (degrees) Inclination angle (degrees)
30 45 60 30 45 60
0 1 80.1 190.4 1,000.5 280.2 650.3 950.22 91.7 259.9 852.9 250.9 609.4 996.53 84.5 283.0 872.7 243.7 690.1 981.6
Average 85.4 244.4 908.7 258.3 649.9 976.1Standard deviation 5.8 48.2 80.1 19.4 40.4 23.7
25 1 30.7 42.2 15.2 49.9 65.2 85.32 20.4 29.6 2.7 33.7 50.3 70.13 16.2 28.7 9.0 35.3 52.8 72.4
Average 22.4 33.5 9.0 39.6 56.1 76.0Standard deviation 7.5 7.5 6.3 8.9 8.0 8.2
40 1 22.6 18.4 4.3 43.6 40.2 28.12 16.8 11.0 1.2 27.6 38.7 20.13 14.0 19.4 2.4 25.7 28.2 29.1
Average 17.8 16.3 2.6 32.3 35.7 25.8Standard deviation 4.4 4.6 1.5 9.8 6.5 4.9
60 1 5.2 6.2 0.6 14.2 10.2 5.62 1.7 9.0 1.4 27.6 8.4 2.13 4.1 3.0 2.8 7.7 2.8 2.6
Average 3.7 6.1 1.6 16.5 7.1 3.4Standard deviation 1.8 3.0 1.1 10.1 3.9 1.9
Table 3.Measured Impact Force on the Landing Surface for Different Offset Distances and Slope Inclination Angles
Distance [x (cm)] Test
Impact force (N)
Cluster C1 (8 kg) Cluster C2 (13 kg)
Inclination angle (degrees) Inclination angle (degrees)
30 45 60 30 45 60
25 1 46.0 83.1 82.0 60.9 165.5 128.52 40.3 64.8 81.1 57.7 129.3 138.23 39.4 74.0 75.1 48.2 172.4 119.6
Average 41.9 74.0 79.4 55.6 155.8 128.8Standard deviation 3.6 9.1 3.8 6.6 23.1 9.3
40 1 28.6 22.4 61.7 30.6 65.2 105.12 26.8 19.3 49.2 28.6 58.3 97.33 34.2 24.2 55.0 27.4 60.5 90.3
Average 29.9 21.9 55.3 28.9 61.3 97.6Standard deviation 3.9 2.5 6.3 1.6 3.5 7.4
60 1 15.8 15.3 37.5 21.4 29.2 68.42 25.2 11.3 39.7 20.7 32.6 75.23 20.3 13.4 33.5 25.8 31.0 59.3
Average 20.4 13.4 36.9 22.6 30.9 67.7Standard deviation 4.7 2.0 3.1 2.7 1.7 8.0
© ASCE 04017141-4 Int. J. Geomech.
Int. J. Geomech., 2018, 18(2): 04017141
Dow
nloa
ded
from
asc
elib
rary
.org
by
McG
ill U
nive
rsity
on
11/2
8/17
. Cop
yrig
ht A
SCE
. For
per
sona
l use
onl
y; a
ll ri
ghts
res
erve
d.
wall for ball–wall contact, can be resolved into normal and shearforces.
FC ¼ FNC þ FS
C (2)
where FNC and FS
C = normal and shear component of the contactforce, respectively.
The normal and shear components of the contact force are calcu-lated by
FNC ¼ KnDUn (3)
DFSC ¼ �kSDUS (4)
where DFSC = incremental elastic shear force; DUn = overlapping of
the two particles; Kn = normal stiffness; and kS = shear stiffness asdetermined using a tangent modulus. The normal and shear stiff-nesses are given by
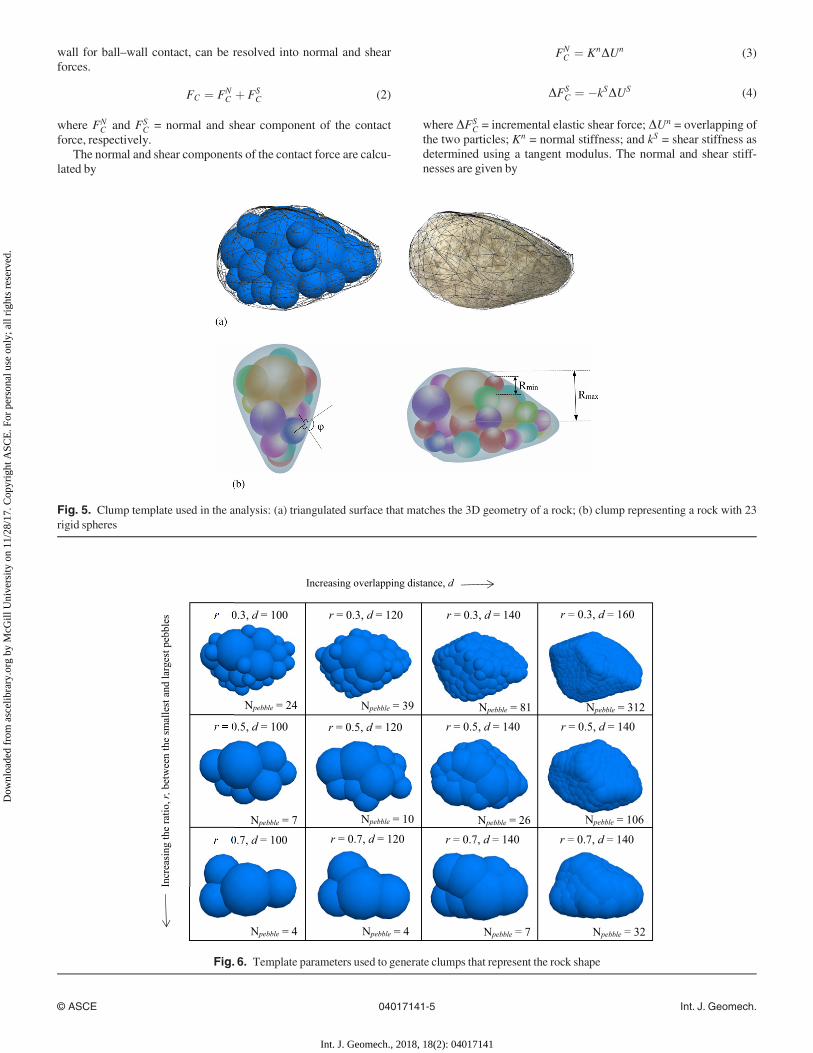
Fig. 5. Clump template used in the analysis: (a) triangulated surface that matches the 3D geometry of a rock; (b) clump representing a rock with 23rigid spheres
r = 0.3, d = 100 r = 0.3, d = 120 r = 0.3, d = 140 r = 0.3, d = 160
r = 0.5, d = 100 r = 0.5, d = 120 r = 0.5, d = 140 r = 0.5, d = 140
r = 0.7, d = 100
Increasing overlapping distance, d
Incr
easi
ng th
e ra
tio, r
, bet
wee
n th
e sm
alle
st a
nd la
rges
t peb
bles
r = 0.7, d = 120 r = 0.7, d = 140 r = 0.7, d = 140
Npebble = 24 Npebble = 39 Npebble = 81 Npebble = 312
Npebble = 7 Npebble = 10 Npebble = 26 Npebble = 106
Npebble = 4 Npebble = 4 Npebble = 7 Npebble = 32
Fig. 6. Template parameters used to generate clumps that represent the rock shape
© ASCE 04017141-5 Int. J. Geomech.
Int. J. Geomech., 2018, 18(2): 04017141
Dow
nloa
ded
from
asc
elib
rary
.org
by
McG
ill U
nive
rsity
on
11/2
8/17
. Cop
yrig
ht A
SCE
. For
per
sona
l use
onl
y; a
ll ri
ghts
res
erve
d.
Kn ¼ kAn kBn
kAn þ kBn(5)
ks ¼ kAs kBs
kAs þ kBs(6)
A resultant force that represents all contacts on a single solidbody was obtained using contact mechanics, and Newton’s secondlaw was then applied to compute accelerations. The displacementof each element was then obtained using a central differenceexplicit time integration described with the two followingequations:
Fi ¼ m €xi � gið Þ (7)
where Fi = sum of all externally applied forces acting on the parti-cle; m = total mass of the body; €xi = particle acceleration; and gi =body force acceleration vector.
Mi ¼ _Hi (8)
whereMi =moment acting on the particle; and _Hi = particle angularmomentum.
Modeling Irregularly Shaped Rock Using Clump TemplatesRock shape is known to play a significant role in rockfall modeling,particularly when discrete-element analysis is used (Taghavi 2011).Using spherical entities to simulate irregularly shaped rock hasbeen found to provide excessive rolling (Oda and Iwashita 1999).Researchers [e.g., Lu and McDowell (2010); Stahl and Konietzky(2011); Li et al. (2012); Indraratna et al. (2014)] applied clump logicin modeling complex-shaped particles in the DEM. A clump is asingle rigid body of overlapping spherical pebbles of different sizesthat acts as a single particle of a chosen or arbitrary shape (Cho et al.2007). In this study, clump templates were developed to reproducethe irregularly shaped stones used in the experiments as practicallyas possible. The template may provide a surface description that canbe used for the calculation of inertial parameters and visualizationof results.
Four distinct stones of those used in the experiments, withsizes ranging between 3.0 and 8.0 cm, were selected from C1 andC2 to be created using clump templates as shown in Figs.5(a and b), respectively. To reproduce realistic stone shapes andsizes, images of individual rocks were taken from various anglesusing a high-resolution camera. The images were then importedinto the commercial 3D computer-aided design (CAD) program,Rhino 5.0, to generate the triangular meshes needed for the gener-ation of the clump templates.
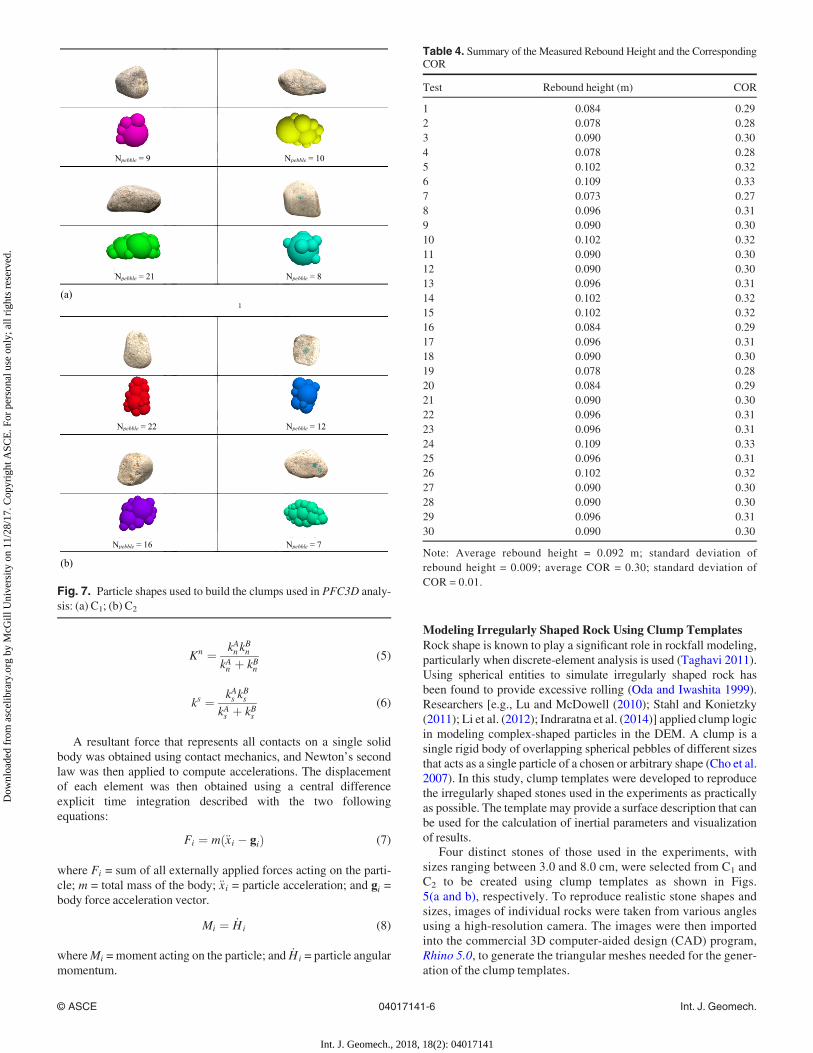
Table 4. Summary of the Measured Rebound Height and the CorrespondingCOR
Test Rebound height (m) COR
1 0.084 0.292 0.078 0.283 0.090 0.304 0.078 0.285 0.102 0.326 0.109 0.337 0.073 0.278 0.096 0.319 0.090 0.3010 0.102 0.3211 0.090 0.3012 0.090 0.3013 0.096 0.3114 0.102 0.3215 0.102 0.3216 0.084 0.2917 0.096 0.3118 0.090 0.3019 0.078 0.2820 0.084 0.2921 0.090 0.3022 0.096 0.3123 0.096 0.3124 0.109 0.3325 0.096 0.3126 0.102 0.3227 0.090 0.3028 0.090 0.3029 0.096 0.3130 0.090 0.30
Note: Average rebound height = 0.092 m; standard deviation ofrebound height = 0.009; average COR = 0.30; standard deviation ofCOR = 0.01.
1
Npebble = 22 Npebble = 12
Npebble = 8 Npebble = 21
Npebble = 9 Npebble = 10
Npebble = 7 Npebble = 16
(a)
(b)
Fig. 7. Particle shapes used to build the clumps used in PFC3D analy-sis: (a) C1; (b) C2
© ASCE 04017141-6 Int. J. Geomech.
Int. J. Geomech., 2018, 18(2): 04017141
Dow
nloa
ded
from
asc
elib
rary
.org
by
McG
ill U
nive
rsity
on
11/2
8/17
. Cop
yrig
ht A
SCE
. For
per
sona
l use
onl
y; a
ll ri
ghts
res
erve
d.
The bubble pack algorithm built into PFC3D code was usedto generate a triangulated clump surface. The template parame-ters may be adjusted to balance the number of particles in eachclump and the smoothness of the surface representation. Theeffect of these parameters was examined and is presented inFig. 6. It can be seen that as the overlapping distance, d, betweenspheres increased, more pebbles were needed to form the shapeof the clump resulting in a smoother surface (PFC3D). To main-tain a balance between the number of pebbles in a clump and thecomputational cost associated with simulating the entire rock
cluster, the ratio between the largest and smallest particle waskept at 0.3 and the overlap distance was set to 100 as depicted inFig. 7.
Damping Ratio and Coefficient of RestitutionThe impact damping ratio is an important parameter in rockfall col-lision analysis and is usually used to account for energy dissipationduring impact. Of equal importance is the coefficient of restitution(COR), which represents the ratio between the relative velocitypostcollision and the relative velocity precollision. The COR is
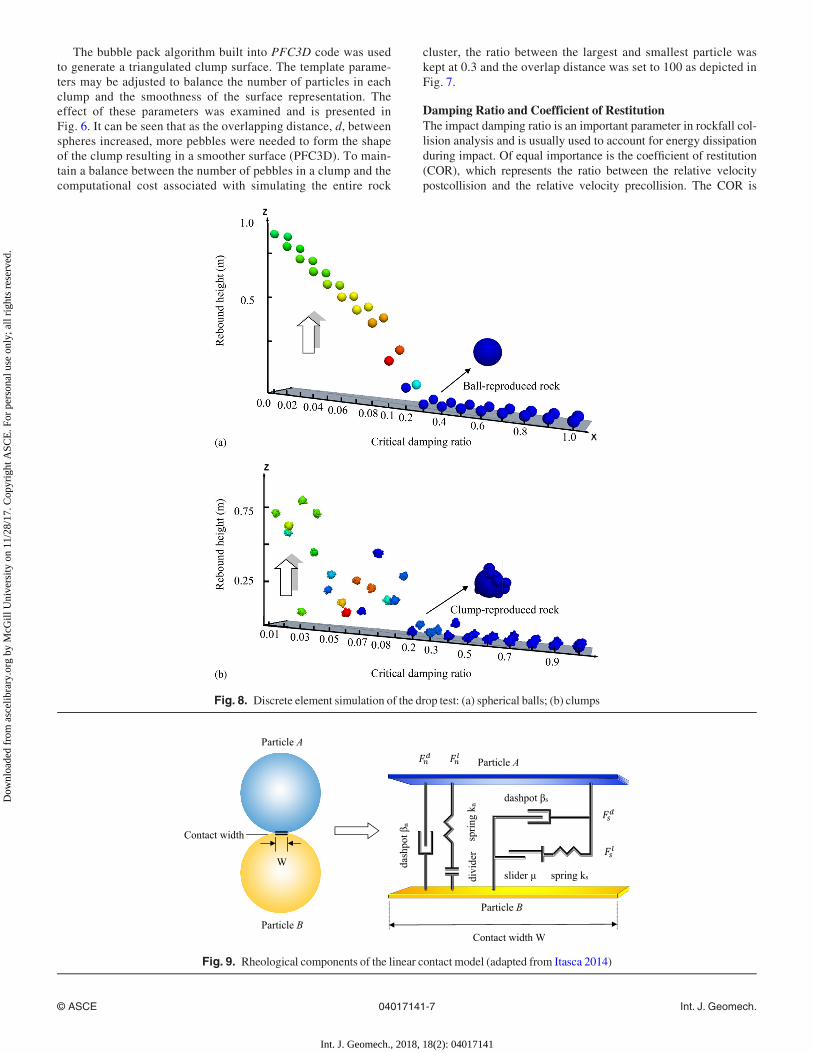
Fig. 8. Discrete element simulation of the drop test: (a) spherical balls; (b) clumps
slider μ
dashpot βs
divi
der
dash
pot β
n
sprin
g k n
Particle A
Particle B
Particle A
Particle BContact width W
Contact width
spring ks
W
Fig. 9. Rheological components of the linear contact model (adapted from Itasca 2014)
© ASCE 04017141-7 Int. J. Geomech.
Int. J. Geomech., 2018, 18(2): 04017141
Dow
nloa
ded
from
asc
elib
rary
.org
by
McG
ill U
nive
rsity
on
11/2
8/17
. Cop
yrig
ht A
SCE
. For
per
sona
l use
onl
y; a
ll ri
ghts
res
erve
d.
generally regarded as a crucial input parameter that controls the ac-curacy of rockfall hazard simulation (Chau et al. 2002; Lo et al.2010; McDowell and Lowndes 2011; Lin and Lin 2015). Therefore,selecting an appropriate COR is important to reproduce a realisticresponse. In this study, normal and shear dashpots were introducedat each contact to create a viscous damping system as expressed bythe following equations:
md2xdt2
þ cdxdt
þ kx ¼ 0 (9)
wherem =mass; c = damping constant; and k = stiffness.By definingv ¼ ffiffiffiffiffiffiffiffiffi
k=mp
and d ¼ c=2m, Eq. (9) can be written inthe following form:
d2xdt2
þ 2ddxdt
þ v 2x ¼ 0 (10)
Substituting a solution of the form x tð Þ ¼ Ceλt into Eq. (10), thefollowing is written:
λ2 þ 2dλþ v 2 ¼ 0 (11)
The roots of Eq. (11) can be written as
λ ¼ �d6 h (12)
where h ¼ffiffiffiffiffiffiffiffiffiffiffiffiffiffiffiffid2 � v 2
pThe solution of Eq. (10) is given by
x tð Þ ¼ C1e� d�hð Þt þ C2e
� dþhð Þt (13)
Substituting for d and h of Eq. (13) and rewriting it gives thefollowing:
x tð Þ ¼ C1e� b�
ffiffiffiffiffiffiffiffiffib 2�1
p� �v t þ C2e
� bþffiffiffiffiffiffiffiffiffib 2�1
p� �v t (14)
where b ¼ c=2ffiffiffiffiffiffikm
p, defined as the critical damping ratio.
For underdamped cases, which causes rebounding of twoimpacting objects, the solution of Eq. (10) is written in the form
x tð Þ ¼ e�dt D1 sinv dt þ D2 cosv dtð Þ (15)
wherev d ¼ffiffiffiffiffiffiffiffiffiffiffiffiffiffiffiffiv 2 � d2
pConsidering the initial conditions of x ¼ x0; _x t ¼ 0ð Þ ¼ _x0, and
x0 ¼ 0, the following solutions are obtained:
x tð Þ ¼ e�bv t _x0v d
sinv dt
� �(16)
_x tð Þ ¼ �bve�bv t _x0v d
sinv dt
� �þ e�bv t _x0 cosv dt (17)
for which the period and natural frequency of the damped systemare T ¼ 2p=v d and f ¼ 1=T ¼ v d=2p , respectively.
At time T (period of oscillation), the system recovers the positionat x = 0. The velocity of the system is given by
_x tð Þ ¼ �e�bv p=vdð Þ _x0 (18)
The COR can then be expressed in the form
a ¼_x t ¼ p
vd
� �_x0
¼ e�bp=ffiffiffiffiffiffiffiffiffi1�b 2
p(19)
The COR can be measured in the laboratory using a series ofdrop tests, and three ratios (Stronge 2000; Ashayer 2007), the kine-matic, kinetic, and energy, can be obtained.
The kinematic COR is
0
0.1
0.2
0.3
0.4
0.5
0.6
0.7
0.8
0.9
1
0 0.2 0.4 0.6 0.8 1
Coe
ffici
ent o
f res
titut
ion
Critical damping ratio
Spheres-Mode 0Clumps-Mode 0Spheres-Mode 3Clumps-Mode 3
Measured = 0.3
Cor
resp
ondi
ng
dam
ping
ratio
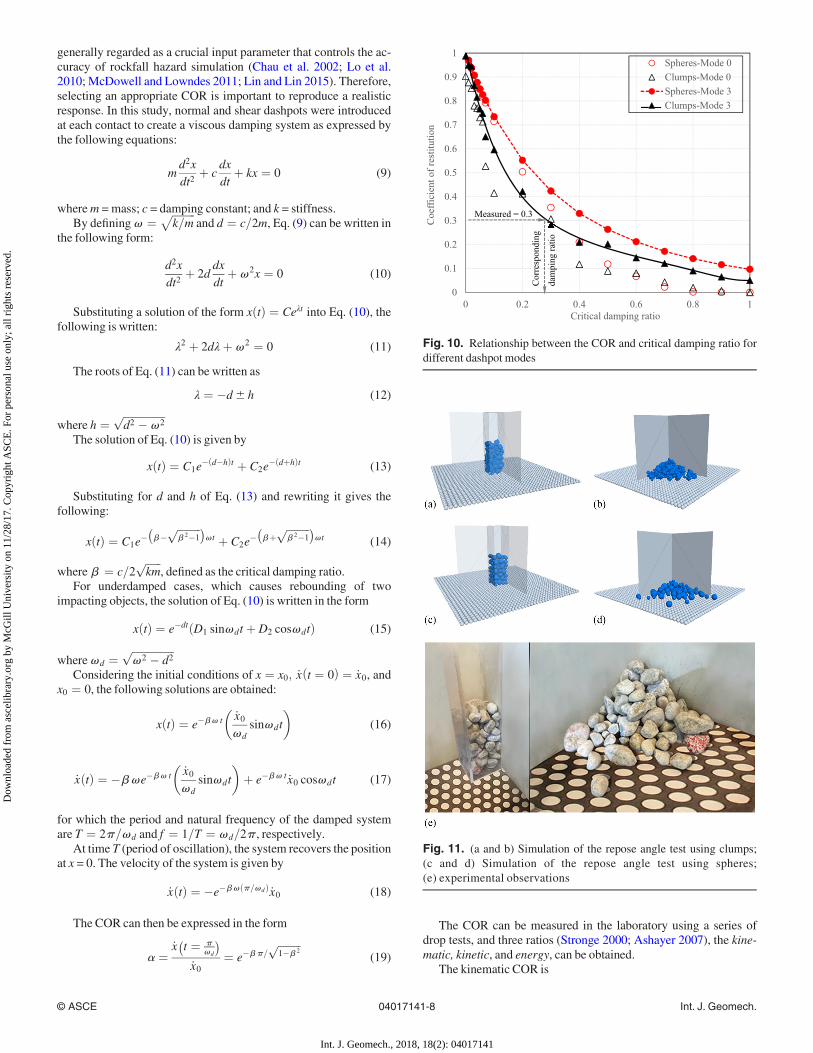
Fig. 10. Relationship between the COR and critical damping ratio fordifferent dashpot modes
Fig. 11. (a and b) Simulation of the repose angle test using clumps;(c and d) Simulation of the repose angle test using spheres;(e) experimental observations
© ASCE 04017141-8 Int. J. Geomech.
Int. J. Geomech., 2018, 18(2): 04017141
Dow
nloa
ded
from
asc
elib
rary
.org
by
McG
ill U
nive
rsity
on
11/2
8/17
. Cop
yrig
ht A
SCE
. For
per
sona
l use
onl
y; a
ll ri
ghts
res
erve
d.
a ¼ffiffiffiffiffiffiHr
Hi
ror a ¼ Vr
Vi(20)
whereHr = rebound height; Hi = drop height; and Vr and Vi = mag-nitude of the postcollision and precollision velocities, respectively.
The kinetic COR is
a ¼ Pt
Pn(21)
where Pt and Pn = tangential and normal impulse, respectively.The energy COR is
a ¼ Er
Ei¼
12mVr
2
12mVi
2¼ Vr
2
Vi2
(22)
where Ei and Er = translational energies before and after impact;andm = particle mass.
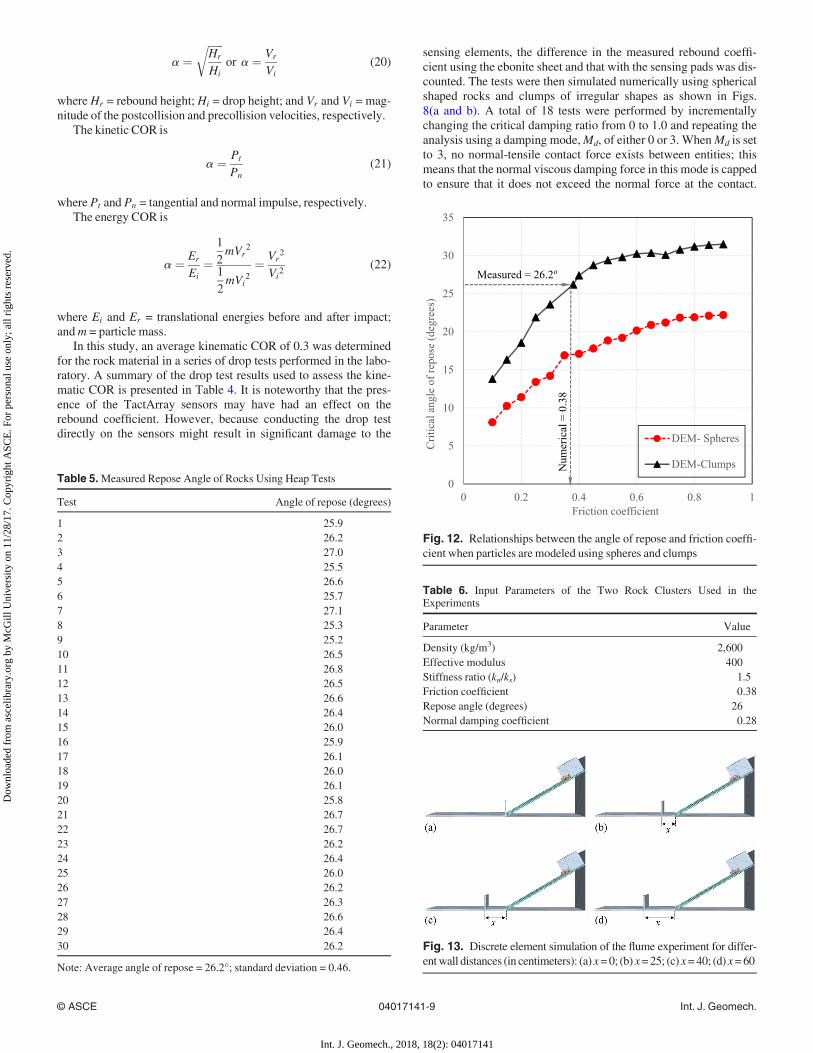
In this study, an average kinematic COR of 0.3 was determinedfor the rock material in a series of drop tests performed in the labo-ratory. A summary of the drop test results used to assess the kine-matic COR is presented in Table 4. It is noteworthy that the pres-ence of the TactArray sensors may have had an effect on therebound coefficient. However, because conducting the drop testdirectly on the sensors might result in significant damage to the
sensing elements, the difference in the measured rebound coeffi-cient using the ebonite sheet and that with the sensing pads was dis-counted. The tests were then simulated numerically using sphericalshaped rocks and clumps of irregular shapes as shown in Figs.8(a and b). A total of 18 tests were performed by incrementallychanging the critical damping ratio from 0 to 1.0 and repeating theanalysis using a damping mode,Md, of either 0 or 3. WhenMd is setto 3, no normal-tensile contact force exists between entities; thismeans that the normal viscous damping force in this mode is cappedto ensure that it does not exceed the normal force at the contact.
0
5
10
15
20
25
30
35
0 0.2 0.4 0.6 0.8 1
Crit
ical
ang
le o
f rep
ose
(deg
rees
)
Friction coefficient
DEM- Spheres
DEM-Clumps
Measured = 26.2o
Num
eric
al =
0.3
8
Fig. 12. Relationships between the angle of repose and friction coeffi-cient when particles are modeled using spheres and clumps
Table 5.Measured Repose Angle of Rocks Using Heap Tests
Test Angle of repose (degrees)
1 25.92 26.23 27.04 25.55 26.66 25.77 27.18 25.39 25.210 26.511 26.812 26.513 26.614 26.415 26.016 25.917 26.118 26.019 26.120 25.821 26.722 26.723 26.224 26.425 26.026 26.227 26.328 26.629 26.430 26.2
Note: Average angle of repose = 26.2°; standard deviation = 0.46.
Table 6. Input Parameters of the Two Rock Clusters Used in theExperiments
Parameter Value
Density (kg/m3) 2,600Effective modulus 400Stiffness ratio (kn/ks) 1.5Friction coefficient 0.38Repose angle (degrees) 26Normal damping coefficient 0.28
Fig. 13. Discrete element simulation of the flume experiment for differ-entwall distances (in centimeters): (a) x=0; (b) x=25; (c) x=40; (d) x=60
© ASCE 04017141-9 Int. J. Geomech.
Int. J. Geomech., 2018, 18(2): 04017141
Dow
nloa
ded
from
asc
elib
rary
.org
by
McG
ill U
nive
rsity
on
11/2
8/17
. Cop
yrig
ht A
SCE
. For
per
sona
l use
onl
y; a
ll ri
ghts
res
erve
d.
This phenomenon can be mathematically expressed as _us = relativeshear translational velocity
Fdn ¼ 2b n
ffiffiffiffiffiffiffiffiffiffimckn
p� �_un
min 2b n
ffiffiffiffiffiffiffiffiffiffimckn
p� �_un � Fl
n
� Dashpot normal force
8<:
(23)
Fds ¼ 2b s
ffiffiffiffiffiffiffiffiffimcks
p� �_us
0Dashpot shear force
((24)
where
mc ¼mAmB
mA þ mB; ball�ball
mA; ball�facet;
8>><>>:
and _us = relative shear translational velocity.
As shown in Fig. 9, the motion of the balls was controlled bya linear spring and dashpot in the normal direction, in which thedamping force that opposes the motion was attractive (tension),while the linear-spring force was repulsive (no tension).Depending on the magnitude of the normal velocity, the magni-tude of the dashpot force can be larger than that of the spring,and the total normal force, Fl
n þ Fdn , is attractive (tension). The
no-tension mode prevents this situation from happening by forc-ing the linear elastic force to be equal to the dashpot force in thenormal direction. Furthermore, the shear contact force is in themode of a slip cut, instead of the full shear, when Md is 0, wherethe viscous damping is enforced up to the slip limit, which iscontrolled by the slider in the shear direction (Fig. 9). Asexpressed by Eq. (24), if the linear spring is set to slide, then theshear-damping force is zero.
The relationships between the restitution coefficients and damp-ing ratios of both spheres and clumps are presented in Fig. 10. Theexperimentally measured kinematic COR value was used to deter-mine the corresponding damping ratio according to the model
0
20
40
60
80
100
120
140
0 10 20 30 40 50 60
Max
imum
impa
ct fo
rce
(N)
Wall distance from the toe (cm)
Test 1Test 2Test 3DEM- SpheresDEM-Clumps
0
50
100
150
200
250
300
350
0 10 20 30 40 50 60
Max
imum
impa
ct fo
rce
(N)
Wall distance from the toe (cm)
Test 1Test 2Test 3DEM- SpheresDEM-Clumps
0
200
400
600
800
1000
1200
0 10 20 30 40 50 60
Max
imum
impa
ct fo
rce
(N)
Wall distance from the toe (cm)
Test 1Test 2Test 3DEM- SpheresDEM-Clumps
α = 30o
α
α
α = 45o
x
x
α
α = 60ox
(a)
(b)
(c)
Fig. 14. Calculated andmeasured impact forces on the wall using rock cluster C1 for each inclination angle: (a) 30°; (b) 45°; (c) 60°
© ASCE 04017141-10 Int. J. Geomech.
Int. J. Geomech., 2018, 18(2): 04017141
Dow
nloa
ded
from
asc
elib
rary
.org
by
McG
ill U
nive
rsity
on
11/2
8/17
. Cop
yrig
ht A
SCE
. For
per
sona
l use
onl
y; a
ll ri
ghts
res
erve
d.
results for a dashpot mode,Md, of 3. The critical damping ratio wasfound to be approximately 0.28.
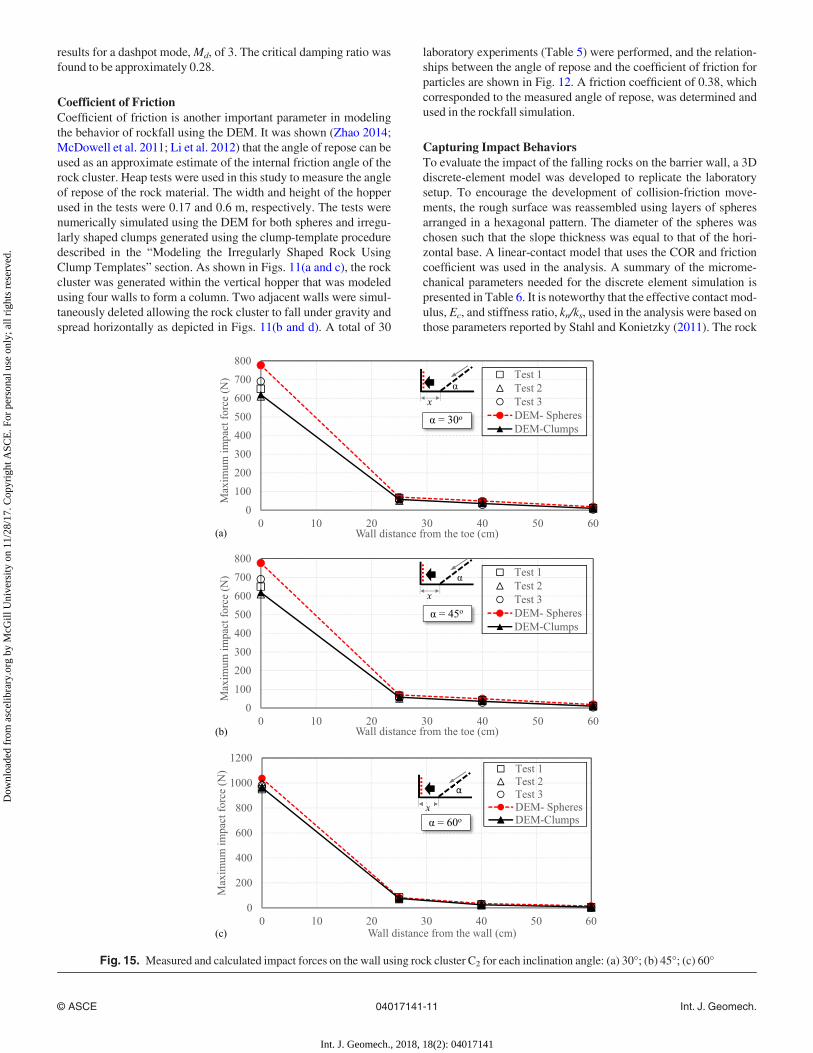
Coefficient of FrictionCoefficient of friction is another important parameter in modelingthe behavior of rockfall using the DEM. It was shown (Zhao 2014;McDowell et al. 2011; Li et al. 2012) that the angle of repose can beused as an approximate estimate of the internal friction angle of therock cluster. Heap tests were used in this study to measure the angleof repose of the rock material. The width and height of the hopperused in the tests were 0.17 and 0.6 m, respectively. The tests werenumerically simulated using the DEM for both spheres and irregu-larly shaped clumps generated using the clump-template proceduredescribed in the “Modeling the Irregularly Shaped Rock UsingClump Templates” section. As shown in Figs. 11(a and c), the rockcluster was generated within the vertical hopper that was modeledusing four walls to form a column. Two adjacent walls were simul-taneously deleted allowing the rock cluster to fall under gravity andspread horizontally as depicted in Figs. 11(b and d). A total of 30
laboratory experiments (Table 5) were performed, and the relation-ships between the angle of repose and the coefficient of friction forparticles are shown in Fig. 12. A friction coefficient of 0.38, whichcorresponded to the measured angle of repose, was determined andused in the rockfall simulation.
Capturing Impact BehaviorsTo evaluate the impact of the falling rocks on the barrier wall, a 3Ddiscrete-element model was developed to replicate the laboratorysetup. To encourage the development of collision-friction move-ments, the rough surface was reassembled using layers of spheresarranged in a hexagonal pattern. The diameter of the spheres waschosen such that the slope thickness was equal to that of the hori-zontal base. A linear-contact model that uses the COR and frictioncoefficient was used in the analysis. A summary of the microme-chanical parameters needed for the discrete element simulation ispresented in Table 6. It is noteworthy that the effective contact mod-ulus, Ec, and stiffness ratio, kn/ks, used in the analysis were based onthose parameters reported by Stahl and Konietzky (2011). The rock
0
100
200
300
400
500
600
700
800
0 10 20 30 40 50 60
Max
imum
impa
ct fo
rce
(N)
Wall distance from the toe (cm)
Test 1Test 2Test 3DEM- SpheresDEM-Clumps
α = 30o
αx
0
100
200
300
400
500
600
700
800
0 10 20 30 40 50 60
Max
imum
impa
ct fo
rce
(N)
Wall distance from the toe (cm)
Test 1Test 2Test 3DEM- SpheresDEM-Clumps
0
200
400
600
800
1000
1200
0 10 20 30 40 50 60
Max
imum
impa
ct fo
rce
(N)
Wall distance from the wall (cm)
Test 1Test 2Test 3DEM- SpheresDEM-Clumps
α
α = 45o
x
α
α = 60ox
(a)
(b)
(c)
Fig. 15. Measured and calculated impact forces on the wall using rock cluster C2 for each inclination angle: (a) 30°; (b) 45°; (c) 60°
© ASCE 04017141-11 Int. J. Geomech.
Int. J. Geomech., 2018, 18(2): 04017141
Dow
nloa
ded
from
asc
elib
rary
.org
by
McG
ill U
nive
rsity
on
11/2
8/17
. Cop
yrig
ht A
SCE
. For
per
sona
l use
onl
y; a
ll ri
ghts
res
erve
d.
cluster was randomly generated and allowed to freely move withinthe release box toward the wall facing the slope. The rock-releasingprocess was numerically initiated by removing the front wall, whichallowed the rocks to move down the slope.
Subroutines were developed in PFC3D using the FISh program-ming language such that the impact information of the two investi-gated rock clusters was fully recorded (e.g., particle identities,impact times, and impact forces in different directions). Impactforces were chosen to be tracked over impact pressures to facilitatecomparison with experimental data. A total of four rockfall simula-tions were performed for each inclination angle (a of 30, 45, and60°) considering four different wall distances (x of 0, 25, 40, and60 cm) from the toe of the slope, as shown in Fig. 13.
Results and Discussions
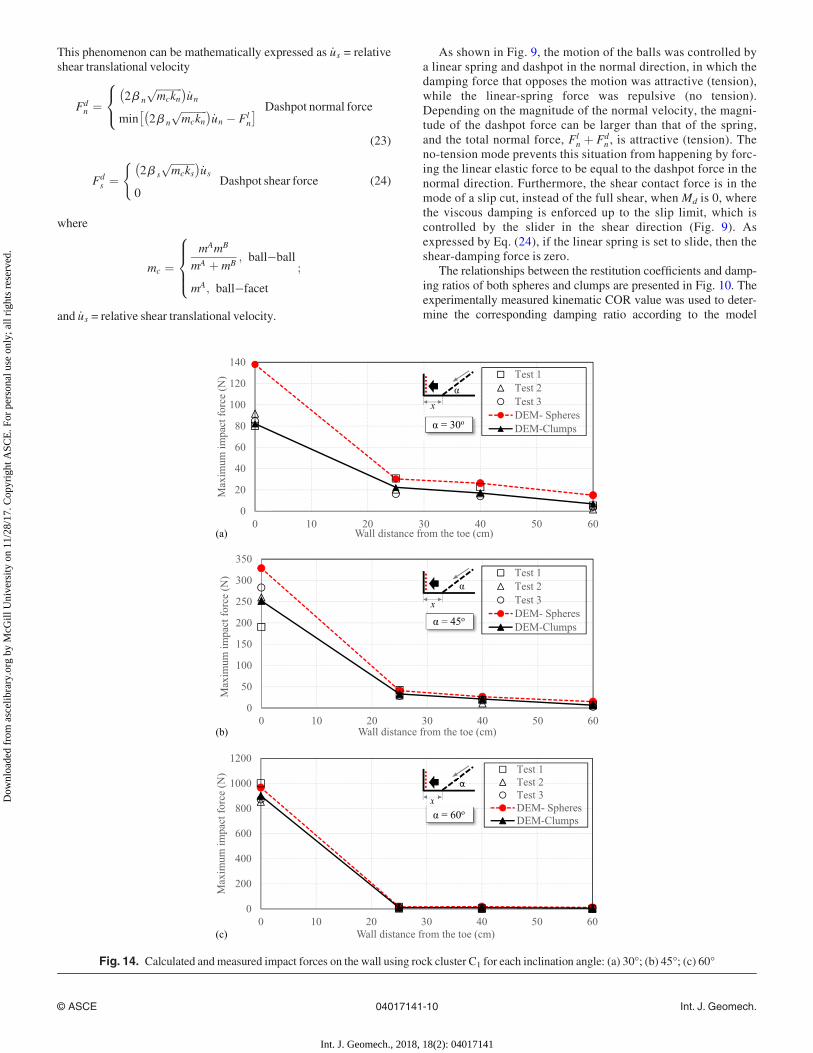
The impact forces exerted by the two rock clusters on the wall aredescribed in this section. The results obtained from modeling the
stones using spherical particles and the irregularly shaped clumpsare then discussed to illustrate the role of rock shape on the impactforces calculated using the discrete-element model. Experimentalresults (Tests 1, 2, and 3) are used to validate the numerical simula-tions and a comparison is made between the measured and calcu-lated impact forces. In addition, for cases where the wall was placedat some distance from the toe of the slope, the forces induced by therock cluster on the horizontal base near the toe of the slope and nearthe wall were also investigated.
Impact Forces Acting on the Vertical Wall
The changes in impact forces on the vertical wall for different walllocations are presented in Figs. 14 and 15 for rock clusters C1 andC2, respectively. For cluster C1, the impact force calculated usingirregular rock shapes was found to be approximately 84 N for aslope angle of 30°, which is consistent with the average measuredvalue for x of 0 cm [Fig. 14(a)]. The force rapidly decreased to 25 N(�70%) when the wall offset distance was increased to 25 cm.
0
20
40
60
80
100
120
140
20 30 40 50 60
Max
imum
impa
ct fo
rce
(N)
Wall distance from the toe (cm)
TestsSpheresClumpsNear the toe of the slope
Near the wall
1
2
α
x
2 1
0
50
100
150
200
250
300
350
20 25 30 35 40 45 50 55 60
Max
imum
impa
ct fo
rce
(N)
Wall distance from the toe (cm)
TestsSpheresClumpsNear the toe of the slope1
2 Near the wall
α
x
2 1
α = 45o
0
200
400
600
800
1000
1200
20 25 30 35 40 45 50 55 60
Max
imum
impa
ct fo
rce
(N)
Wall distance from the toe (cm)
TestsSpheresClumps
Near the wall2
α
x
2 1
α = 60o
Near the toe of the slope1
α = 30o
(a)
(b)
(c)
Fig. 16. Measured and calculated impact forces on the base using rock cluster C1 for each inclination angle: (a) 30°; (b) 45°; (c) 60°
© ASCE 04017141-12 Int. J. Geomech.
Int. J. Geomech., 2018, 18(2): 04017141
Dow
nloa
ded
from
asc
elib
rary
.org
by
McG
ill U
nive
rsity
on
11/2
8/17
. Cop
yrig
ht A
SCE
. For
per
sona
l use
onl
y; a
ll ri
ghts
res
erve
d.
Moving the wall farther from the toe of the slope to distances of 40and 60 cm resulted in further decreases in forces, to approximately14 and 4 N, respectively. This finding is attributed to the energy lossdue to the rock collision with the horizontal base and along the sepa-ration distance before reaching the wall. The impact forces gener-ally increased as the slope angle increased. For an a of 45°, theimpact force was found to be approximately 260 N for an x of 0 cmand further increased to 870 N when the slope angle reached 60°.As the wall offset distance increased, the impact forces rapidlydecreased to 28 N (89% reduction) and 9 N (99% reduction) for avalues of 45 and 60°, respectively. This finding confirms that thesteeper the slope, the more energy is lost because of the rockimpacting at the base.
Using spherical balls to represent the rock cluster was found tooverestimate the impact forces when compared to the measured val-ues, especially for the slope angle of 30°. As shown in Fig. 14(a), anincrease in the impact force from 84 to 138 N (�40%) was calcu-lated for x of 0 cm. For slope inclination angles of 45 and 60°, theimpact pressures increased at x of 0 cm from 259 and 873 N to 328
and 1,000 N (20 and 13% increases), respectively. For x values of25, 40, and 60 cm, the difference between the measured and calcu-lated forces for these two slopes was found to be insignificant.
Similar results were found for cluster C2, which contained 99rocks and had a total weight of 13 kg. The impact forces for x of0 cm were found to be 258, 650, and 976 N for a values of 30, 45,and 60°, respectively, as shown in Fig. 15. These values droppedrapidly when the wall was located at some distance from the toe ofthe slope.
These results suggest that, for the investigated range of parame-ters, using the clump logic to model falling rocks allows the impactforces to be accurately calculated particularly for slope angles of 30and 45°. However, approximating the rock shapes using spheresmay provide a reasonable estimate of the impact force for a slopeangle of 60°; this may be attributed to the observed sliding modethat dominated the movement of the falling rock cluster over steepslopes. For slope angles of 45° or less, both rolling and bouncingmodes governed the particle movement, leading to more a pro-nounced effect of rock shape on the final impact forces.
0
50
100
150
200
250
20 30 40 50 60
Max
imum
impa
ct fo
rce
(N)
Wall distance from the toe (cm)
TestsSpheresClumps
Near the toe of the slope
Near the wall
1
2 α = 30o
0100200300400500600700800
20 25 30 35 40 45 50 55 60
Max
imum
impa
ct fo
rce
(N)
Wall distance from the toe (cm)
TestsSpheresClumps
2 Near the wall
1
α
x
2 1
α = 45o
0
200
400
600
800
1000
1200
20 25 30 35 40 45 50 55 60
Max
imum
impa
ct fo
rce
(N)
Wall distance from the toe (cm)
TestsSpheresClumps
Near the wall2
Near the toe of the slope
α
x
2 1
α = 60o
Near the toe of the slope
α
x
2 1
(a)
(b)
(c)
Fig. 17. Calculated andmeasured impact forces on the flat base using rock cluster C2 for each inclination angle: (a) 30°; (b) 45°; (c) 60°
© ASCE 04017141-13 Int. J. Geomech.
Int. J. Geomech., 2018, 18(2): 04017141
Dow
nloa
ded
from
asc
elib
rary
.org
by
McG
ill U
nive
rsity
on
11/2
8/17
. Cop
yrig
ht A
SCE
. For
per
sona
l use
onl
y; a
ll ri
ghts
res
erve
d.
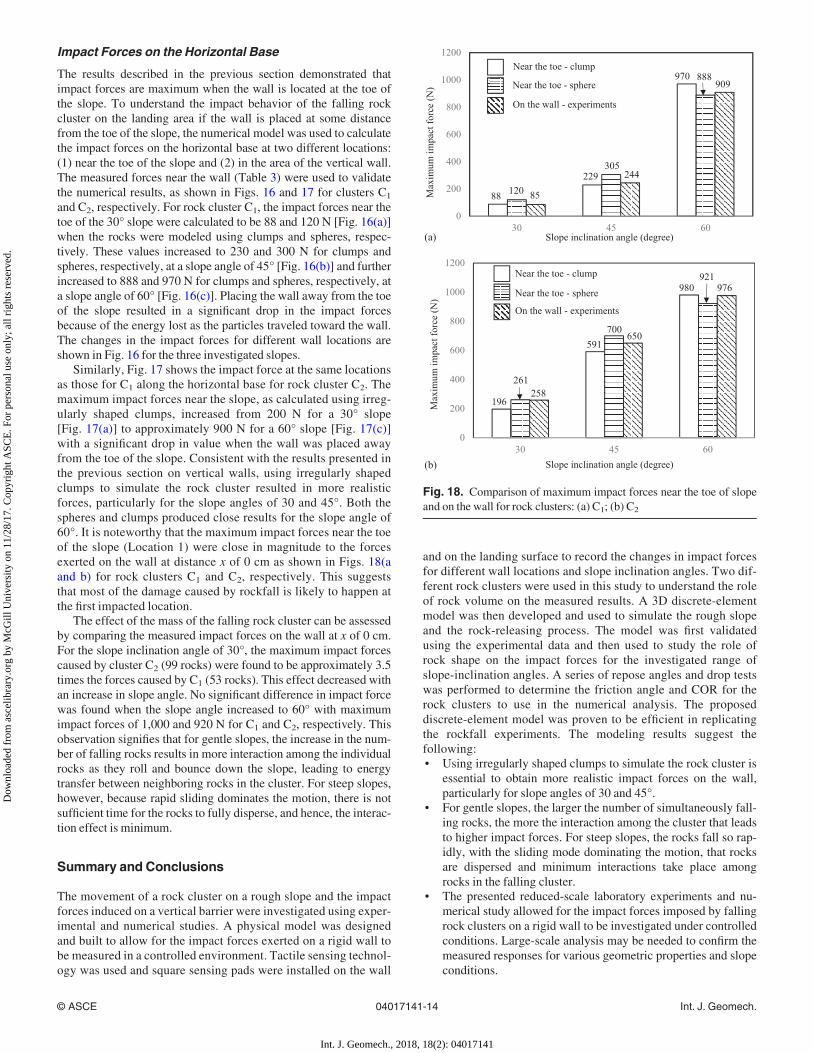
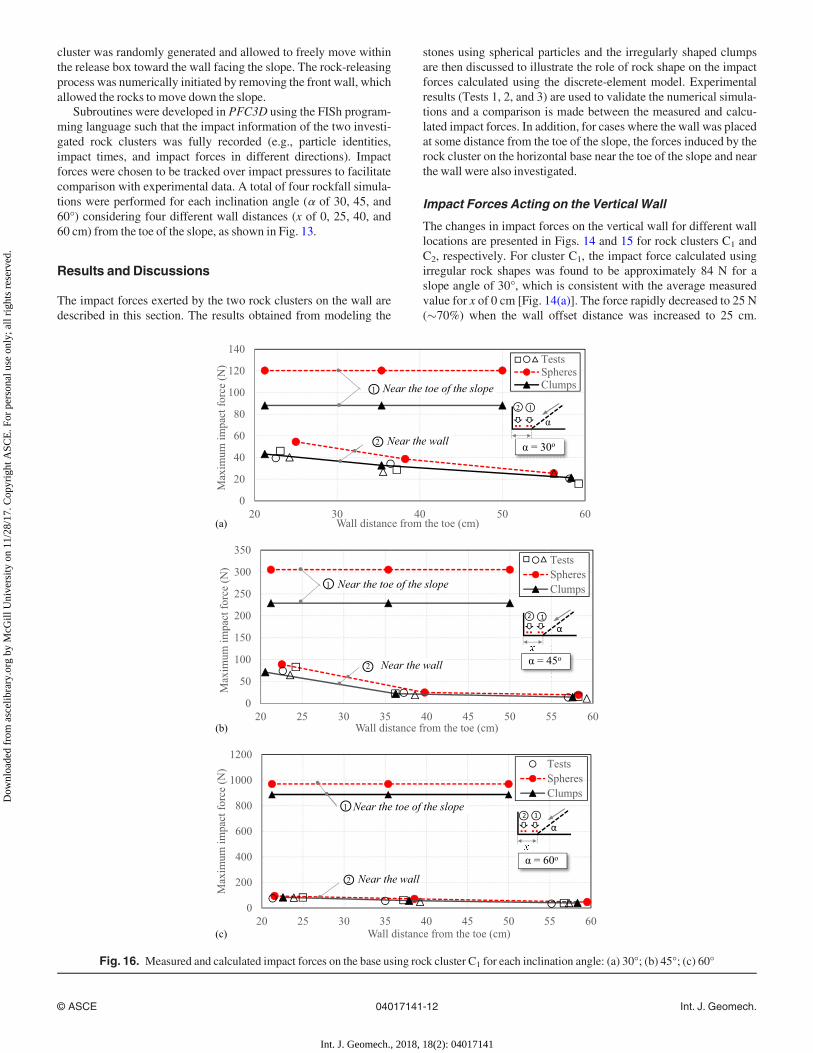
Impact Forces on the Horizontal Base
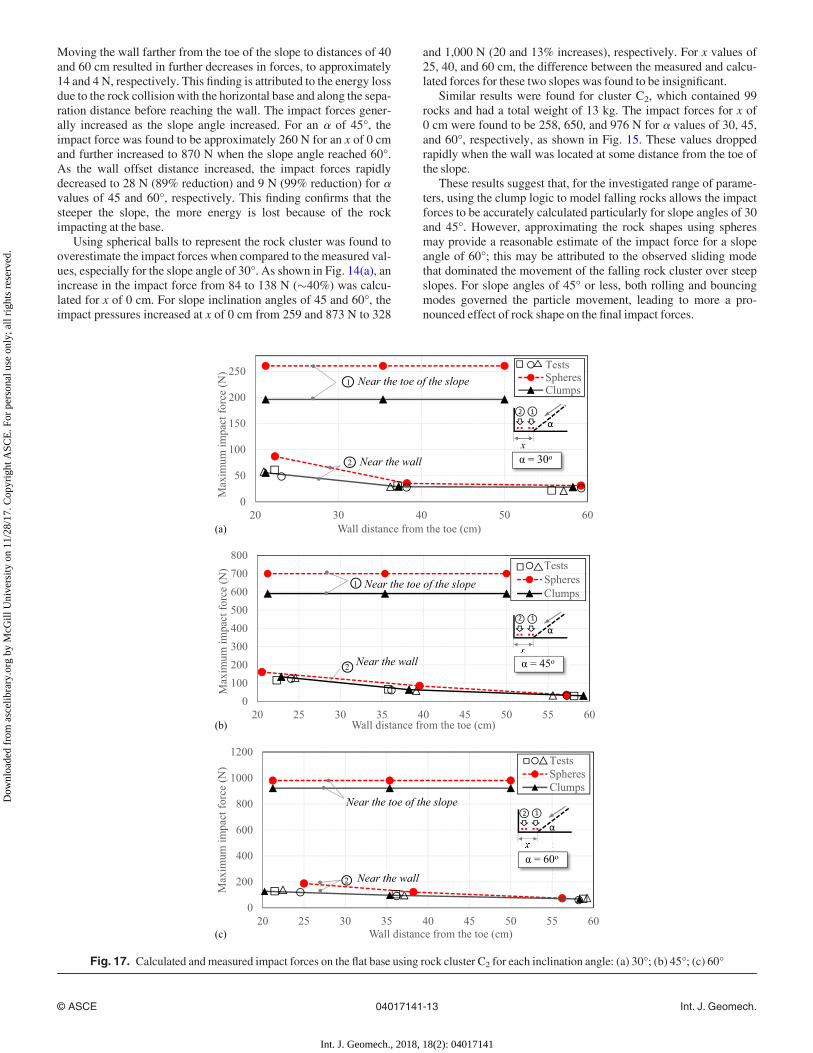
The results described in the previous section demonstrated thatimpact forces are maximum when the wall is located at the toe ofthe slope. To understand the impact behavior of the falling rockcluster on the landing area if the wall is placed at some distancefrom the toe of the slope, the numerical model was used to calculatethe impact forces on the horizontal base at two different locations:(1) near the toe of the slope and (2) in the area of the vertical wall.The measured forces near the wall (Table 3) were used to validatethe numerical results, as shown in Figs. 16 and 17 for clusters C1
and C2, respectively. For rock cluster C1, the impact forces near thetoe of the 30° slope were calculated to be 88 and 120 N [Fig. 16(a)]when the rocks were modeled using clumps and spheres, respec-tively. These values increased to 230 and 300 N for clumps andspheres, respectively, at a slope angle of 45° [Fig. 16(b)] and furtherincreased to 888 and 970 N for clumps and spheres, respectively, ata slope angle of 60° [Fig. 16(c)]. Placing the wall away from the toeof the slope resulted in a significant drop in the impact forcesbecause of the energy lost as the particles traveled toward the wall.The changes in the impact forces for different wall locations areshown in Fig. 16 for the three investigated slopes.
Similarly, Fig. 17 shows the impact force at the same locationsas those for C1 along the horizontal base for rock cluster C2. Themaximum impact forces near the slope, as calculated using irreg-ularly shaped clumps, increased from 200 N for a 30° slope[Fig. 17(a)] to approximately 900 N for a 60° slope [Fig. 17(c)]with a significant drop in value when the wall was placed awayfrom the toe of the slope. Consistent with the results presented inthe previous section on vertical walls, using irregularly shapedclumps to simulate the rock cluster resulted in more realisticforces, particularly for the slope angles of 30 and 45°. Both thespheres and clumps produced close results for the slope angle of60°. It is noteworthy that the maximum impact forces near the toeof the slope (Location 1) were close in magnitude to the forcesexerted on the wall at distance x of 0 cm as shown in Figs. 18(aand b) for rock clusters C1 and C2, respectively. This suggeststhat most of the damage caused by rockfall is likely to happen atthe first impacted location.
The effect of the mass of the falling rock cluster can be assessedby comparing the measured impact forces on the wall at x of 0 cm.For the slope inclination angle of 30°, the maximum impact forcescaused by cluster C2 (99 rocks) were found to be approximately 3.5times the forces caused by C1 (53 rocks). This effect decreased withan increase in slope angle. No significant difference in impact forcewas found when the slope angle increased to 60° with maximumimpact forces of 1,000 and 920 N for C1 and C2, respectively. Thisobservation signifies that for gentle slopes, the increase in the num-ber of falling rocks results in more interaction among the individualrocks as they roll and bounce down the slope, leading to energytransfer between neighboring rocks in the cluster. For steep slopes,however, because rapid sliding dominates the motion, there is notsufficient time for the rocks to fully disperse, and hence, the interac-tion effect is minimum.
Summary and Conclusions
The movement of a rock cluster on a rough slope and the impactforces induced on a vertical barrier were investigated using exper-imental and numerical studies. A physical model was designedand built to allow for the impact forces exerted on a rigid wall tobe measured in a controlled environment. Tactile sensing technol-ogy was used and square sensing pads were installed on the wall
and on the landing surface to record the changes in impact forcesfor different wall locations and slope inclination angles. Two dif-ferent rock clusters were used in this study to understand the roleof rock volume on the measured results. A 3D discrete-elementmodel was then developed and used to simulate the rough slopeand the rock-releasing process. The model was first validatedusing the experimental data and then used to study the role ofrock shape on the impact forces for the investigated range ofslope-inclination angles. A series of repose angles and drop testswas performed to determine the friction angle and COR for therock clusters to use in the numerical analysis. The proposeddiscrete-element model was proven to be efficient in replicatingthe rockfall experiments. The modeling results suggest thefollowing:• Using irregularly shaped clumps to simulate the rock cluster is
essential to obtain more realistic impact forces on the wall,particularly for slope angles of 30 and 45°.
• For gentle slopes, the larger the number of simultaneously fall-ing rocks, the more the interaction among the cluster that leadsto higher impact forces. For steep slopes, the rocks fall so rap-idly, with the sliding mode dominating the motion, that rocksare dispersed and minimum interactions take place amongrocks in the falling cluster.
• The presented reduced-scale laboratory experiments and nu-merical study allowed for the impact forces imposed by fallingrock clusters on a rigid wall to be investigated under controlledconditions. Large-scale analysis may be needed to confirm themeasured responses for various geometric properties and slopeconditions.
0
200
400
600
800
1000
1200
30 45 60
Near the toe - sphere
On the wall - experiments
88 120 85
229305
244
970 888909
0
200
400
600
800
1000
1200
30 45 60
Near the toe - clump
Near the toe - clump
Near the toe - sphere
On the wall - experiments
196
261258
591700
650
980921
976
Max
imum
impa
ct fo
rce
(N)
Max
imum
impa
ct fo
rce
(N)
Slope inclination angle (degree)
Slope inclination angle (degree)(a)
(b)
Fig. 18. Comparison of maximum impact forces near the toe of slopeand on the wall for rock clusters: (a) C1; (b) C2
© ASCE 04017141-14 Int. J. Geomech.
Int. J. Geomech., 2018, 18(2): 04017141
Dow
nloa
ded
from
asc
elib
rary
.org
by
McG
ill U
nive
rsity
on
11/2
8/17
. Cop
yrig
ht A
SCE
. For
per
sona
l use
onl
y; a
ll ri
ghts
res
erve
d.

Acknowledgments
This research was supported by the Natural Sciences andEngineering Research Council of Canada (NSERC). The financialsupport provided by the Faculty of Engineering at McGillUniversity to the first author is greatly appreciated.
References
Agliardi, F., and Crosta, G. B. (2003). “High resolution three-dimensionalnumerical modelling of rockfalls.” Int. J. Rock Mech. Min. Sci., 40(4),455–471.
Agliardi, F., Crosta, G. B., and Frattini, P. (2009). “Integrating rockfall riskassessment and countermeasure design by 3D modelling techniques.”Nat. Hazards Earth Syst. Sci., 9, 1059–1073.
Ahmed, M. R., Tran, V. D. H. and Meguid, M. A. (2015). “On the role ofgeogrid reinforcement in reducing earth pressure on buried pipes:Experimental and numerical investigations.” Soils Found., 55(3),588–599.
Alejano, L., Pons, B., Bastante, F., Alonso, E., and Stockhausen, H. (2007).“Slope geometry design as a means for controlling rockfalls in quarries.”Int. J. Rock Mech. Min. Sci., 44(6), 903–921.
Ashayer, P. (2007). “Application of rigid body impact mechanics and dis-crete element modeling to rockfall simulation.” Ph.D. thesis, Univ. ofToronto, Toronto.
Basson, F. R. P. (2012). “Rigid body dynamics for rock fall trajectory simu-lation.” 46th U.S. Rock Mechanics/Geomechanics Symp., AmericanRockMechanics Association, Richardson, TX.
Bonilla-Sierra, V., Scholtès, L., Donz�e, F. V., and Elmouttie, M. (2015).“Rock slope stability analysis using photogrammetric data and DFN–DEMmodelling.” Acta Geotech., 10(4), 497–511.
Chau, K. T.,Wong, R. H. C., andWu, J. J. (2002). “Coefficient of restitutionand rotational motions of rockfall impacts.” Int. J. Rock Mech. Min. Sci.,39(1), 69–77.
Chen, G., Zheng, L., Zhang, Y., and Wu, J. (2013). “Numerical simulationin rockfall analysis: A close comparison of 2-D and 3-D DDA.” RockMech. Rock Eng., 46(3), 527–541.
Cho, N., Martin, C. D., and Sego, D. C. (2007). “A clumped particle modelfor rock.” Int. J. Rock Mech. Min. Sci., 44(7), 997–1010.
Cundall, P. A., and Strack, O. D. L. (1979). “A discrete numerical model forgranular assemblies.”G�eotechnique, 29(1), 47–65.
Descouedres, F., and Zimmermann, T. (1987). “Three-dimensional dynamiccalculation of rockfalls.” Proc., 6th Int. Congress on Rock Mechanics,G. Herget and S. Vongpaisal, eds., CRC, Boca Raton, FL, 337–342.
Frattini, P., Crosta, G., Carrara, A., and Agliardi, F. (2008). “Assessment ofrockfall susceptibility by integrating statistical and physically-basedapproaches.”Geomorphology, 94, 419–437.
Giani, G. P., Giacomini, A., Migliazza, M., and Segalini, A. (2004).“Experimental and theoretical studies to improve rock fall analysis andprotection work design.” Rock Mech. Rock Eng., 37(5), 369–389.
Guzzetti, F., Crosta, G., Detti, R., and Agliardi, F. (2002). “STONE: A com-puter program for the three-dimensional simulation of rock-falls.”Comput. Geosci., 28(9), 1079–1093.
Indraratna, B., Ngo, N. T., Rujikiatkamjorn, C., and Vinod, J. S. (2014).“Behavior of fresh and fouled railway ballast subjected to direct sheartesting: Discrete element simulation.” Int. J. Geomech., 10.1061/(ASCE)GM.1943-5622.0000264, 34–44.
Itasca Consulting Group. (2014). Particle flow code in three dimensions(PFC3D), Minneapolis.
Kishi, N., Ikeda, K., Konno, H., and Kawase, R. (2000). “Prototype impacttest on rockfall retaining walls and its numerical simulation.” 6th Int.Conf., Structures under Shock and Impact VI, C. A. Brebbia and N.Jones, eds.,WIT, Southampton, U.K., 351–360.
Li, W. C., Li, H. J., Dai, F. C., and Lee, L. M. (2012). “Discrete elementmodeling of a rainfall-induced flowslide.” Eng. Geol., 149, 22–34.
Lin, C. H., and Lin, M. L. (2015). “Evolution of the large landslide inducedby Typhoon Morakot: A case study in the Butangbunasi River, southernTaiwan using the discrete element method.” Eng. Geol., 197, 172–187.
Lo, C. Y., Bolton,M. D., and Cheng, Y. P. (2010). “Velocity fields of granu-lar flows down a rough incline: A DEM investigation.” GranularMatter, 12(5), 477–482.
Lu, M., and McDowell, G. R. (2010). “Discrete element modelling of rail-way ballast under monotonic and cyclic triaxial loading.” G�eotechnique,60(6), 459–467.
Magnier, S. A., and Donz�e, F. (1998). “Numerical simulations of impactsusing a discrete element method.” Mech. Cohesion-Frictional. Mater.,3(3), 257–276.
McDowell, G., Li, H., and Lowndes, I. (2011). “The importance of particleshape in discrete-element modelling particle flow in a chute.”G�eotechnique Lett., 1(3), 59–64.
Nicot, F., Cambou, B., and Mazzoleni, G. (2001). “Design of rockfallrestraining nets from a discrete element modelling.” Rock Mech. RockEng., 34(2), 99–118.
Oda, M., and Iwashita, K. (1999). Mechanics of granular materials: Anintroduction, CRC, Boca Raton, FL.
PFC3D [Computer software]. Itasca Consulting Group, Minneapolis.Plassiard, J.-P., and Donz�e, F.-V. (2009). “Rockfall impact parameters on
embankments: A discrete element method analysis.” Struct. Eng. Int.,19(3), 333–341.
Rhino 5.0 [Computer software]. Robert McNeel&Associates, Seattle.Ritchie, A. M. (1963). “The evaluation of rockfall and its control.”Highway
Record No. 17, Committee on Landslide Investigations, WashingtonState Highway Commission, Olympia,WA, 13–28.
Spadari, M., Giacomini, A., Buzzi, O., Fityus, S., and Giani, G. P. (2012).“In situ rockfall testing in New South Wales, Australia.” Int. J. RockMech. Min. Sci., 49, 84–93.
Stahl, M., and Konietzky, H. (2011). “Discrete element simulation of ballastand gravel under special consideration of grain-shape, grain-size and rel-ative density.”Granular Matter, 13(4), 417–428.
Stronge, W. J. (2000). Impact mechanics, Cambridge University Press,Cambridge, U.K.
Taghavi, R. (2011). “Automatic clump generation based on mid-surface.”2nd International FLAC/DEM Symposium, Continuum and DistinctElement Numerical Modeling in Geomechanics, Vol. 1, ItascaConsulting Group, Minneapolis, 791–797.
Thoeni, K., Giacomini, A., Lambert, C., Sloan, S. W., and Carter, J. P.(2014). “A 3D discrete element modelling approach for rockfall analysiswith drapery systems.” Int. J. RockMech. Min. Sci., 68(Jun), 107–119.
Turner, A. K., and Schuster, R. L. (2013). Rockfall characterization andcontrol, Transportation Research Board, National Academy ofSciences,Washington, DC.
Wang, Y., and Tonon, F. (2011). “Discrete element modeling of rock frag-mentation upon impact in rock fall analysis.” Rock Mech. Rock Eng.,44(1), 23–35.
Wei, L.-W., et al. (2014). “Themechanism of rockfall disaster: A case studyfrom Badouzih, Keelung, in northern Taiwan.” Eng. Geol., 183,116–126.
Zhao, T. (2014). “Investigation of landslide-induced debris flows by theDEM and CFD.” Ph.D. thesis, Univ. of Oxford, Oxford, U.K.
© ASCE 04017141-15 Int. J. Geomech.
Int. J. Geomech., 2018, 18(2): 04017141
Dow
nloa
ded
from
asc
elib
rary
.org
by
McG
ill U
nive
rsity
on
11/2
8/17
. Cop
yrig
ht A
SCE
. For
per
sona
l use
onl
y; a
ll ri
ghts
res
erve
d.


![Geo-Temporal Visual Analysis of Customer Feedback Data ... · PDF filecluding long, multivatiate, unevenly spaced or categorical time series [17]. ... system for cluster-based analysis](https://img.pdfslide.us/doc/110x75/5a7886227f8b9a8c428cbb3a/geo-temporal-visual-analysis-of-customer-feedback-data-long-multivatiate-unevenly.jpg)