Embed Size (px)
Citation preview

Modeling the Effects of Argument Length and Validity on Inductiveand Deductive Reasoning
Caren M. RotelloUniversity of Massachusetts
Evan HeitUniversity of California, Merced
In an effort to assess models of inductive reasoning and deductive reasoning, the authors, in 3experiments, examined the effects of argument length and logical validity on evaluation of arguments. InExperiments 1a and 1b, participants were given either induction or deduction instructions for a commonset of stimuli. Two distinct effects were observed: Induction judgments were more affected by argumentlength, and deduction judgments were more affected by validity. In Experiment 2, fluency was manip-ulated by displaying the materials in a low-contrast font, leading to increased sensitivity to logicalvalidity. Several variants of 1-process and 2-process models of reasoning were assessed against theresults. A 1-process model that assumed the same scale of argument strength underlies induction anddeduction was not successful. A 2-process model that assumed separate, continuous informationaldimensions of apparent deductive validity and associative strength gave the more successful account.
Keywords: reasoning, mathematical modeling
How are inductive reasoning and deductive reasoning related?According to the problem view, induction and deduction refer todifferent types of reasoning problems or different types of argu-ments. An aim of the problem view is to distinguish deductivelyvalid arguments from invalid arguments. The problem view doesnot make claims about cognitive processes, only about the argu-ments themselves. In contrast, according to the process view, thequestion of interest is what cognitive processes characterize induc-tion and deduction and what the similarities and differences be-tween inductive reasoning and deductive reasoning are in process-ing (see Heit, 2007, for a review). A particularly promisingapproach is to address the process view as an empirical question,asking people to make either induction judgments or deductionjudgments for a common set of arguments (Rips, 2001; see alsoOsherson et al., 1998). In general, this technique could highlighteither similarities or differences between induction and deductionthat are not confounded by the use of different problems.
Explicitly or implicitly, researchers concerned with the processview have taken different positions on whether there are differentkinds of reasoning. Some researchers have asserted that inductionand deduction depend on the same cognitive mechanisms. This isreferred to as the one-process view. For example, Harman (1999)
argued that people do not reason deductively but instead use thesame reasoning abilities for both deductive and inductive prob-lems. Several influential research programs embody the one-process view, by applying a common modeling framework to bothinductive and deductive problems, assuming a single scale ofevidence for argument strength. For example, Oaksford and Chater(2007) showed that a Bayesian reasoning model, probabilistic innature, can be successfully applied to problems of deduction. Notethat Oaksford and Chater (2002) themselves have not denied thatpeople can explicitly perform deductive tasks under limited cir-cumstances, and even probabilistic inferences can sometimes bejustified on logical grounds (e.g., Pfeifer & Kleiter, 2009). The keypoint is that this line of work offers a unifying framework forproblems of deduction and induction, based on a single scale ofprobability. Likewise, Johnson-Laird (1994) explained how mentalmodel theory, typically applied to problems of deduction, can beapplied to problems of induction, for example, stating, “The sameexplanatory framework accommodates deduction and induction”(p. 189). Osherson, Smith, Wilkie, Lopez, and Shafir (1990) andSloman (1993) presented models of inductive reasoning that, with-out additional assumptions, account for some deductive reasoningphenomena (e.g., that arguments based on identity matches be-tween a premise and a conclusion are perfectly strong).
According to two-process accounts (Evans & Over, 1996; Slo-man, 1996; Stanovich, 1999), both heuristic and analytic processescontribute to reasoning, with each process potentially assessing anargument as strong or weak. In effect, there is more than one scaleof evidentiary strength. Both induction and deduction could beinfluenced by these two processes but in different proportions.Induction judgments would be particularly influenced by quickheuristic processes that tap into associative information aboutcontext and similarity that do not necessarily make an argumentlogically valid. In contrast, deduction judgments would be moreheavily influenced by slower analytic processes that encompassmore deliberative, and typically more accurate, reasoning. Two-
Caren M. Rotello, Department of Psychology, University of Massachu-setts; Evan Heit, School of Social Sciences, Humanities, and Arts, Uni-versity of California, Merced.
This work was supported by collaborative National Science FoundationGrant BCS-0616979. A preliminary report of Experiment 1a appeared inHeit and Rotello (2008). We thank Charles Brainerd, Jonathan Evans, andDavid Over for comments and Lissette Alvarez, Brooklynn Edwards,Efferman Ezell, Chanita Intawan, Nic Raboy, Anamika Sethi, and HarukaSwendsen for assistance with this research.
Correspondence concerning this article should be addressed to Caren M.Rotello, Department of Psychology, University of Massachusetts, Box37710, Amherst, MA 01003. E-mail: [email protected]
Journal of Experimental Psychology: © 2009 American Psychological AssociationLearning, Memory, and Cognition2009, Vol. 35, No. 5, 1317–1330
0278-7393/09/$12.00 DOI: 10.1037/a0016648
1317

process accounts have provided an explanatory framework formany results (e.g., content effects, individual differences, effectsof time pressure). Although the distinction between one-processand two-process accounts is conventional in reasoning research,the boundary might seem to be in need of further sharpening. Tobe as explicit as possible, the one-process accounts of reasoningcited above do not have separate processes for induction versusdeduction, do not identify separate mechanisms for heuristic andanalytic processing, do not rely on separate sources of associativeand logical information, and more generally do not have two scalesof evidentiary strength.
The one-process view and the two-process view are each em-bodied by several highly productive and successful research pro-grams. However, relatively little research has directly pitted theone-process view and the two-process view against each other.One important exception is a study by Rips (2001) that comparedtwo types of arguments in two experimental conditions: Partici-pants were instructed to make either deduction judgments orinduction judgments. Rips noted that if induction and deductionuse the same information along a common scale of argumentstrength, then the relative ordering of two arguments should be thesame whether people are making deduction or induction judg-ments. One type of argument was deductively correct but causallyinconsistent, such as “Jill rolls in the mud and Jill gets clean,therefore Jill rolls in the mud,” and the other type was deductivelyincorrect but causally consistent, such as “Jill rolls in the mud,therefore Jill rolls in the mud and Jill gets dirty.” Participants in thededuction condition gave more positive judgments to the correctbut inconsistent arguments, whereas participants in the inductioncondition gave more positive judgments to the incorrect but con-sistent arguments. Although he did not endorse a particular two-process account, Rips concluded that the results were evidenceagainst the one-process account, which predicts the same orderingof arguments in both conditions, with only a potential change inresponse bias to distinguish them (see also Oaksford & Hahn,2007, for an analysis).
Heit and Rotello (2005, 2008) pointed out that distinguishingbetween one-process and two-process views is also an importantenterprise in memory research. In particular, there is a debateabout whether recognition memory can be accounted for by asingle familiarity process or whether there are two processes, a fastfamiliarity process that is influenced by similarity and a slower,recollective process that is more accurate. This issue is oftenexamined in the remember–know paradigm (Tulving, 1985), inwhich participants make a recognition judgment, then statewhether they just know that they have seen the item before oractually remember it. Although these two judgments may notcorrespond directly to familiarity and recollection, under the two-process view know judgments depend more on familiarity,whereas remember judgments depend more on recollection. Underthe one-process view, remember judgments reflect a stricter re-sponse criterion than know (Donaldson, 1996; Dougal & Rotello,2007).
Memory researchers have developed several standards for ex-amining whether a set of results points to one or two processes.One such standard is monotonicity, namely that across a commonset of stimuli, the response rates for two types of memory judg-ments should be highly correlated (Dunn & Kirsner, 1988). To theextent that monotonicity holds, the one-process view is supported,
and to the extent that monotonicity is violated, there is evidence forthe two-process view.
Essentially, Rips (2001) applied the monotonicity standard toreasoning. The different ordering of argument strengths underinduction and deduction instructions was a violation of monoto-nicity and thus evidence for two processes. Heit and Rotello (2005)focused on another standard. In memory research, it has beenargued that if remember judgments measure recollection, theseresponses should show greater sensitivity than “old” responses thatreflect a mixture of recollection and familiarity. That is, the dif-ference between the hit rate and the false alarm rate, measured ind� units, should be greater for “remember” responses than for “old”judgments. In contrast, if remembers require only a differentresponse criterion than knows, then d� for remembers should equald� for old decisions (see Macmillan, Rotello, & Verde, 2005). Intwo experiments, Heit and Rotello found that sensitivity was abouttwice as high for deduction judgments (d� � 1.69 on average) thanfor induction judgments (d� � 0.86). They took that difference asevidence for two processes of reasoning, with the more accurate,deliberative process contributing more to deduction.
Heit and Rotello (2005) also plotted receiver operating charac-teristic (ROC) curves for their data. ROC curves are frequentlyused in memory research but, to our knowledge, had never beenused in reasoning research. The ROC curves plotted the probabilityof a positive response to valid arguments (called hits) on the y-axisand to invalid arguments (called false alarms) on the x-axis; thepoints indicated varying response biases, obtained from confidenceratings (see Macmillan & Creelman, 2005). ROC curves go wellbeyond d� measures; they are useful for checking that the assump-tions of signal detection theory (SDT) are met and fostering furtherinferences about the underlying processes. ROC curves that fallhigher in space (toward the upper left corner of the graph) reflectgreater sensitivity because the hit rate is greater for a given falsealarm rate (see Figure 1). In addition, points that fall to the upperright along a given ROC reflect more liberal response biasesbecause both hit and false alarm rates are higher. In Heit andRotello (2005), the ROC curves did not fall at the same height fordeduction and induction, supporting the conclusion that a two-process account was needed.
Although Heit and Rotello (2005) made some progress inamassing evidence for two processes in reasoning, there weresome limitations to their work. First, although they showed thatargument validity affects deduction more than induction, they didnot manipulate any variable that targeted induction. Second, theinferences based on d� (and ROCs) themselves had some limita-tions. The d� differences were consistent with two-process ac-counts, but it might be possible to fashion a one-process account toexplain the results, for example, one in which response criteria arevariable, and differentially so for induction and deduction (see,e.g., Wixted & Stretch, 2004). Third, and most important, Heit andRotello did not actually implement one- or two-process accountsof reasoning.
Hence, the present work had several aims. First, in all threeexperiments, we varied the number of premises in an argument.Although increasing the number of premises does not in itselfmake an argument valid, research on inductive reasoning hasshown that providing more evidence can make a conclusion seemmore plausible (cf. Heit, 2000; Osherson et al., 1990). In particu-lar, we predicted that for invalid arguments, increasing the number
1318 ROTELLO AND HEIT
of premises would affect induction more than deduction, whichwould be more sensitive to actual validity. There is a parallel insocial cognition research, that longer communications lead togreater attitude change than shorter communications, under con-ditions expected to promote automatic or heuristic processing (e.g.,Petty & Cacioppo, 1984).
Second, we included a fluency manipulation that was expectedto enhance the role of analytic processing for inductive reasoning.In Experiment 2, participants made induction judgments withmaterials presented in either a good, fluent or harder to read,disfluent font. Alter, Oppenheimer, Epley, and Eyre (2007) used asimilar manipulation for deduction judgments on syllogisms, find-ing greater accuracy with a bad font. Here our aim was to use thefluency manipulation in a way similar to the comparison betweeninduction and deduction instructions; we kept the arguments thesame between the good and bad fonts but expected a differentmixture of analytic versus heuristic processing for the two fontconditions.
Third, we generated predictions from actual implementations ofone-dimensional and two-dimensional SDT models. Because fit-ting these models to data could require results from many exper-iments, here the models are presented as illustrations and existenceproofs rather than as optimally fitted accounts. Moreover, weassessed alternative versions of one-process and two-process mod-els. For example, the modeling included an evaluation of the
possibility that there is only one process but with variable responsecriteria (Wixted & Stretch, 2004). A way to think about this is thatif either induction or deduction judgments are poorly understoodby the participants, this could be reflected in trial-to-trial orperson-to-person variability in how the rating scales are applied.With regard to two-process models, we evaluated both the con-ventional notion that information about logical validity is an all-or-none variable and the possibility that it is on a continuous scale.
Experiment 1
Experiment 1 was run in two variants. In both variants, the maincomparison was an instructional manipulation: Participants wereasked to make either induction judgments or deduction judgments.Participants saw both valid and invalid arguments, with varyingargument lengths (one, three, or five premises). In Experiment 1a,all the valid arguments were identity matches; for example, astatement such as “Horses have Property X” appeared as one of thepremises as well as the conclusion. Experiment 1b included awider variety of valid arguments. In addition to identity matches,there were arguments based on superordinate category inclusion;for example, “Mammals have Property X” appeared as a premise,and “Horses have Property X” appeared as the conclusion. Tech-nically, such an argument is an enthymeme, as it relies on a hiddenpremise that all horses are mammals (Calvillo & Revlin, 2005).Sloman (1998) found that inclusion arguments were judged to beweaker than identity arguments, although that study did not com-pare deduction and induction instructions.
We hypothesized that the participants would be more sensitiveto argument length in the induction condition and more sensitive tovalidity in the deduction condition. We expected that this patternof results would prove difficult for a one-process account ofreasoning, but could be fit by a two-process account.
Method
Participants. In Experiment 1a, 60 University of California,Merced, students were paid to participate. Participants were ran-domly assigned to one of two conditions: induction (n � 31) ordeduction (n � 29). In Experiment 1b, there were 63 participants:32 in the induction condition and 31 in the deduction condition.
Stimuli. In Experiment 1a, there were 120 questions compris-ing arguments about the following kinds of mammals: bears, cats,cows, dogs, goats, horses, lions, mice, rabbits, and sheep. Anexample invalid argument is
Horses have Property X.
Mice have Property X.
Sheep have Property X.____________________
Cows have Property X.
Note that we literally used “Property X.” Participants wereinstructed to treat this as a novel biological property. One third ofthe arguments had a single premise, that is, a single category abovethe line. One third had three premises (as in the previous example),and one third had five premises. Half the arguments were notdeductively valid. The remaining arguments were deductively
Figure 1. Induction and deduction receiver operating characteristics from(A) Experiment 1a and (B) Experiment 1b.
1319MODELING INDUCTION AND DEDUCTION

valid: The conclusion category was identical to one of the premisecategories. An example valid argument is
Horses have Property X.
Mice have Property X.
Sheep have Property X.
Rabbits have Property X.
Cats have Property X._____________________
Rabbits have Property X.
The materials in Experiment 1b were similar. The only changewas that of the 60 valid arguments, 45 involved an identity relation(as in Experiment 1a) and 15 involved an inclusion relation. The3:1 ratio of identity versus inclusion relations was maintained forvalid arguments having one, three, or five premises. Following isan example of a valid argument with an inclusion relation:
Mammals have Property X._______________________
Horses have Property X.
Procedure. Each experiment was run with a program on acomputer; each participant participated individually. At the begin-ning of the experiment, participants were given instructions on thedefinition of strong or valid arguments. Specifically, as in Rips(2001), participants in the induction condition were told that strongarguments were those for which “assuming the information abovethe line is true, this makes the sentence below the line plausible.”Likewise, the deduction instructions gave a brief definition of avalid argument: “assuming the information above the line is true,this necessarily makes the sentence below the line true.”
The 120 arguments were presented one at a time, in a differentrandom order for each participant. In the induction condition,
participants were again told to assume that the information abovethe line is true and to assess whether the sentence below the linewas plausible. They pressed one of two keys to indicate “strong”or “not strong.” In the deduction condition, participants were againtold to assume that the information above the line is true and toassess whether the sentence below the line was necessarily true.They indicated “valid” or “not valid” with a key press. Each binarydecision was followed with a confidence rating on a 1–5 scale;higher numbers indicated greater confidence. The confidence rat-ings were used to generate empirical ROCs; although inclusion ofa rating task tends to increase the binary decision time (Baranski &Petrusic, 2001), it does not affect the accuracy of those judgments(Baranski & Petrusic, 2001; Egan, Schulman, & Greenberg, 1964).
Results
In Experiment 1a, 3 participants from the induction conditionwere excluded from the analyses because they either gave the sameresponse for virtually every question or showed little difference inresponses to valid versus invalid arguments (d� comparing re-sponse rates with the two item types was less than 0.5). In Exper-iment 1b, 4 participants from the induction condition and 3 par-ticipants from the deduction condition were excluded, according tothe same criteria.
To provide an overview of the data, we first assessed theproportion of positive (“strong” or “valid”) responses to valid andinvalid arguments (see Table 1). For the deduction condition, theaverage proportions were .96 and .06, respectively, in Experiment1a and .87 and .07 in Experiment 1b. For the induction condition,the average proportions were .95 and .18, respectively, in Exper-iment 1a and .89 and .19 in Experiment 1b. As in previousexperiments (Heit & Rotello, 2005, 2009), d� was greater fordeduction (3.31 in Experiment 1a and 2.60 in Experiment 1b) thaninduction (2.56 in Experiment 1a and 2.10 in Experiment 1b),
Table 1Proportions of Positive Responses From Experiments 1a, 1b, and 2
Number ofpremises
Experiment 1a Experiment 1b Experiment 2
Induction Deduction Induction Deduction Induction good font Induction bad font
Not valid1 .11 .05 .11 .06 .17 .123 .17 .06 .19 .06 .19 .185 .26 .07 .28 .09 .23 .32Average .18 .06 .19 .07 .20 .21
Valid identity1 .98 .98 1.00 1.00 .98 .993 .94 .95 .93 .97 .94 .985 .94 .96 .92 .96 .95 .95Average .95 .96 .95 .97 .95 .97
Valid inclusion1 .86 .73 .72 .903 .62 .44 .48 .705 .66 .46 .41 .63Average .71 .55 .54 .74
Valid all1 .98 .98 .96 .93 .91 .973 .94 .95 .85 .84 .83 .915 .94 .96 .86 .84 .82 .87Average .95 .96 .89 .87 .85 .92
1320 ROTELLO AND HEIT
indicating greater sensitivity to argument validity for deductionthan for induction.
Because d� depends on participants’ willingness to say “valid”or “strong” (i.e., their response bias) unless the underlying evi-dence distributions are equal-variance and Gaussian in form (Mac-millan & Creelman, 2005; Rotello, Masson, & Verde, 2008), wealso evaluated the area under the ROC curve in each condition.ROCs plot participants’ hits (“valid” or “strong” responses to validproblems) against their false alarms (“valid” or “strong” responsesto invalid problems) as a function of their confidence or responsebias. The observed induction and deduction ROCs from Experi-ment 1 are shown in Figure 1. The left-most point on the deductionROC indicates the hit and false alarm rate for problems thatparticipants said were “sure valid”; the next point on the ROCincludes the hits and false alarms at a slightly lower level ofconfidence, and so on. Points that fall on a common ROC curvereflect the same level of performance but different response biases.Accuracy, or the ability to discriminate valid problems from in-valid ones, is higher when the hit rate is higher for a given falsealarm rate, so ROC curves that fall higher in the space reflect betterperformance. The area under the ROC, Az, which ranges from 0.5(chance performance) to 1.0 (perfect discrimination), is a goodsummary of overall accuracy (Swets, 1986); specialized software(ROCKIT; Metz, 1998) can be used to compare Az betweenindependent conditions. In Experiment 1a, Az was significantlyhigher in the deduction condition than in the induction condition(z-score-based test statistic � 9.45, p � .001). Likewise, in Ex-periment 1b, for identity problems, Az was significantly higher inthe deduction condition than in the induction condition (z � 4.80,p � .001). For the inclusion problems introduced in Experiment1b, the area under the curve was somewhat greater for inductionthan deduction, but this difference did not reach the level ofstatistical significance (z � 1.58, p � .10). We return to this pointin the Discussion.
The design of Experiment 1b allows comparison of two types ofvalid arguments: those based on identity relations and those basedon inclusion relations. The results in the deduction conditionreplicate Sloman (1998) in showing a higher proportion of positiveresponses to identity relations (97% of the time) than to inclusionrelations (55%). The induction condition showed the same pattern,with more positive responses to identity relations (95%) thaninclusion relations (71%).
Our second main prediction was that argument length, or num-ber of premises, would have a greater influence on inductionjudgments than deduction responses. The results in Table 1 supportthis prediction. For invalid arguments, there appears to be greatersensitivity to number of premises for induction compared withdeduction in both experiments. For example, in the inductioncondition of Experiment 1a, the response rate to invalid argumentsincreased from .11 for one-premise arguments to .26 for five-premise arguments, whereas for deduction the corresponding re-sponse rate increased only from .05 to .07. An analysis of variance(ANOVA) on the false alarm rates in Experiment 1a as a functionof condition (induction or deduction) and number of premises(one, three, or five) supports this observation: The false alarm rateswere higher in the induction condition than the deduction condi-tion, F(1, 55) � 7.644, MSE � .083, p � .01, �2 � .122, and theyincreased with number of premises, F(2, 110) � 8.406, MSE �.011, p � .001, �2 � .133. However, condition and number of
premises interacted, F(2, 110) � 5.347, MSE � .011, p � .01,�2 � .089; the effect of number of premises on false alarm ratewas reliable only in the induction condition, F(2, 54) � 8.690,MSE � .017, p � .01, �2 � .243, not in the deduction condition,F(2, 56) � 1, �2 � .016. Similarly, in Experiment 1b, the ANOVArevealed that the false alarm rates were significantly higher in theinduction condition, F(1, 54) � 6.463, MSE � .057, p � .02, �2 �.107, and that they increased with number of premises, F(2,108) � 13.087, MSE � .013, p � .001, �2 � .195. These variablesinteracted, F(2, 108) � 5.810, MSE � .013, p � .01, �2 � .097:The effect of number of premises on false alarm rate was greaterin the induction condition, F(2, 54) � 10.065, MSE � .024, p �.01, �2 � .271, than in the deduction condition, F(2, 54) � 3.792,MSE � .003, p � .05, �2 � .125.
Our main prediction was for the effect of argument length oninvalid arguments. Although we did not have strong predictions forthe effect of argument length on valid arguments, the data in Table1 suggest that longer arguments are somewhat weaker. This trendruns through all the valid argument data in both experiments but ismost noticeable for valid inclusion relations in Experiment 1b.Indeed, an ANOVA on the hit rates in Experiment 1b revealed amain effect of argument length, F(2, 108) � 22.962, MSE � .034,p � .001, �2 � 0.32, and a main effect of inclusion–identity status,F(1, 54) � 93.309, MSE � .100, p � .001, �2 � 0.63, that wasqualified by an interaction between these two effects: F(2, 108) �15.455, MSE � .023, p � .001, �2 � 0.22. The decrease in hit ratefor longer arguments was larger for the inclusion problems but wasalso significant for the identity problems considered alone, F(2,108) � 8.679, MSE � .006, p � .01, �2 � .14. In Experiment 1a,longer valid arguments also elicited fewer positive responses thanshorter arguments: F(2, 110) � 4.790, MSE � .006, p � .05, �2 �0.08. The interaction of argument length with condition was notreliable in either experiment (both Fs � 1).
Discussion
In general, the results pointed to two distinct effects: Validityhad a greater effect on deduction judgments, and argument lengthhad a greater effect on induction judgments. As expected, therewas a higher proportion of positive responses to identity argumentsthan to inclusion arguments. One interesting but unanticipatedfinding was that there was a clear difference between the inductionand deduction conditions for identity arguments but not for inclu-sion arguments (e.g., the difference in area under the ROC curveonly reached the level of statistical significance for identity argu-ments). There are several possible reasons for this finding (whichalso appeared in another experiment, in Heit & Rotello, 2009). Onereason is simply that were fewer inclusion questions than identityquestions, so it may be a matter of low power. Relatedly, becausethe response proportions to inclusion questions were closer to thechance level of 50%, there could be more variability in these data.However, there could also be theoretical rather than methodolog-ical reasons for the apparent difference between identity andinclusion arguments. Because the inclusion arguments are en-thymemes, it could be said that they are not deductively validarguments taken in isolation (without assuming hidden premises).Whatever cognitive processes led participants in the deductioncondition to a high level of sensitivity to the distinction between
1321MODELING INDUCTION AND DEDUCTION
identity arguments and invalid arguments may simply be lesseffective for inclusion arguments.
Another interesting but unanticipated finding was the differingeffect of argument length on invalid versus valid arguments.Whereas invalid arguments became stronger as they got longer,valid arguments became weaker as they got longer. Note thatunlike the logical validity manipulation, argument length does nothave an objective effect on the strength of an argument. Just as aninvalid argument may seem stronger because more plausible evi-dence is brought to bear, valid arguments may seem more com-pelling, elegant, or parsimonious, and hence stronger, when theyare simpler or briefer (cf. Lombrozo, 2007). The finding of weakerinferences on valid arguments with more premises also resemblesa result from Stevenson and Over (1995), who found that peoplewere less willing to make a modus ponens inference when anargument had a premise added. However, in that study, the extrapremise was designed to cast doubt on another premise. It isunclear whether adding premises in our own experiments led tosome doubting of premises (e.g., whether informing participantsthat horses have X would make them doubt another premise suchas that mice have X). And it is notable that adding premisesstrengthened, rather than weakened, invalid arguments.
For present purposes, all the results in Experiments 1a and 1bprovide a useful test bed for assessing models of reasoning.
Modeling
Our general approach was to implement one-process and two-process models and apply them to the results from Experiments 1aand 1b. We operationalized the one- versus two-process distinctionin terms of dimensions in SDT. One-dimensional SDT makesstandard assumptions that there is a single dimension of stimulusstrength, in this case distinguishing weak arguments from strongarguments. Whatever differences arise between deduction andinduction must take the single dimension of strength as a startingpoint. To anticipate, we did not find a successful one-dimensionalmodel for the whole pattern of results. We then turned to atwo-dimensional SDT model, allowing that arguments can differ intwo dimensions of strength. We first fit such a model to the resultsof Experiment 1b, which had more conditions and hence more datapoints, then observed the match between those fitted predictionsand the results of Experiment 1a.
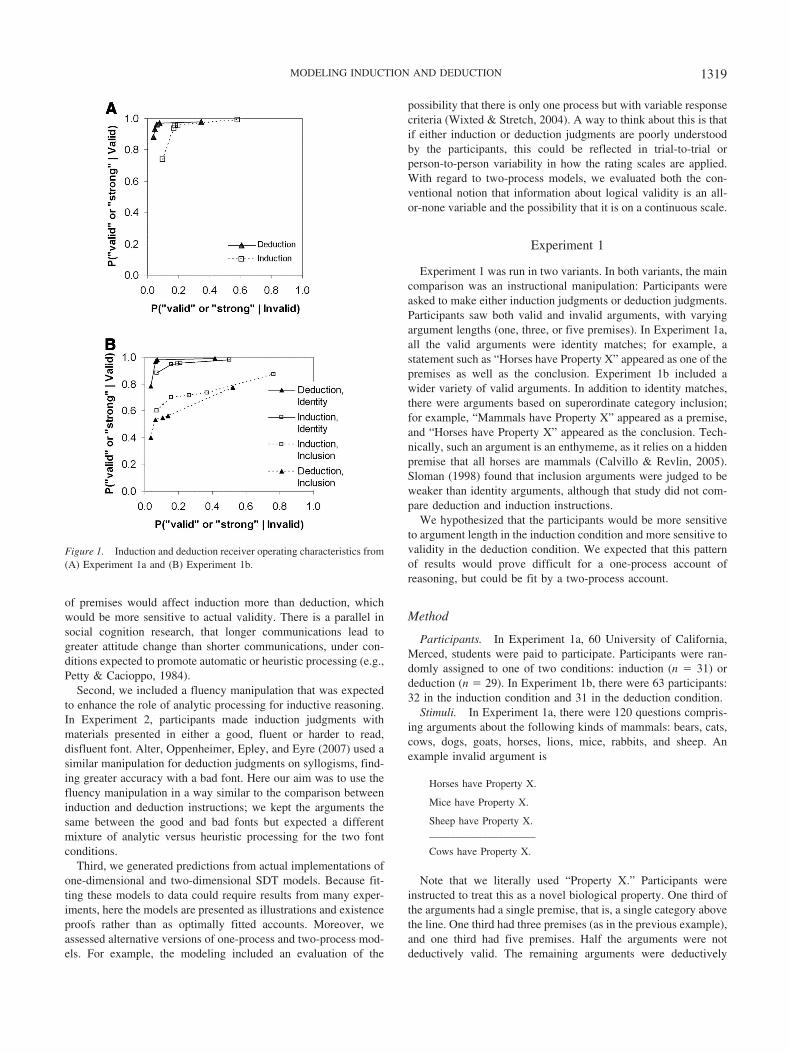
One-dimensional model. One possible, and simple, version ofa one-dimensional model is shown in Figure 2: Valid problems
have greater average strength than invalid problems, as do invalidproblems with greater argument length. In this model, the onlydifference between deduction and induction responses is the re-sponse criterion: Deduction responses are assumed to require ahigher level of evidence at each level of confidence, as indicatedby the rightward shift of the deduction criteria compared with theinduction criteria. This model fails to account for the results ofExperiments 1a and 1b. These data showed greater sensitivity tovalidity for deduction than induction, but the model predicts thesame sensitivity for both. Because this model assumes that onlyresponse bias differs between induction and deduction, it predictsthat the resulting data will fall on a common ROC curve on whichthe deduction points are each shifted to the left of the correspond-ing induction points, reflecting a more conservative response biasat each confidence level but having the same sensitivity in terms ofAz. The data also showed greater sensitivity to argument length forinduction than deduction, but the model predicts the same level ofsensitivity to both. This model assumes that the invalid distributionhas a mean that varies with argument length for both deduction andinduction. In combination with the assumption that deductiondecision criteria are more conservative at each confidence level,this implies that the resulting pattern of false alarms as a functionof argument length must be the same for deduction and induction.In other words, this model can predict either that argument lengthincreases the false alarm rate (as seen in the induction condition)or, if the invalid distributions are assumed to be the same regard-less of argument length, that argument length does not affect thefalse alarm rate (as seen in the deduction condition). It cannotpredict both patterns simultaneously. For these reasons, we caneliminate this simplest one-dimensional model from consideration.
The one-dimensional model could be modified by assumingthat, for some reason, the locations of participants’ confidencecriteria were more variable across trials in the induction condition;criterion variability decreases the apparent accuracy in a condition(e.g., Mueller & Weidemann, 2008; Wickelgren, 1968) and couldtherefore account for the lower sensitivity in the induction task.(Anecdotally, our participants expressed less familiarity with va-lidity judgments than with plausibility judgments, so just theopposite effect might be expected, namely more criterion variabil-ity in the deduction condition).
We used Monte Carlo simulations to predict the performance ofa one-dimensional model like this over a wide range of parametervalues and with the possibility of different valid evidence distri-butions for each argument length (i.e., like Figure 2 but with threevalid distributions). The modeling was intended to be illustrative.For each simulation, we defined the invalid one-premise distribu-tion to be a Gaussian distribution with a mean of 0 and a standarddeviation of 0.6. Then we allowed the means of the invalid three-and five-premise problems to be shifted upward by differentamounts ranging from 0 (identical to the one-premise invaliddistribution) to 0.6 (a 1 standard deviation increment). The meanof the valid one-premise problem distribution was allowed to varyfrom 0.8 to 1.6, with a fixed standard deviation of 1, and the meansof the three- and five-premise valid distributions were allowed toshift from 0 to 0.6 units below the valid one-premise problems. Wealso simulated the mean locations of five decision criteria, reflect-ing differing levels of response confidence, for the inductioncondition and another five for the deduction condition; these latterwere shifted upward by 0.1 units relative to the induction condi-
Figure 2. Schematic one-dimensional model for inductive and deductivedecisions.
1322 ROTELLO AND HEIT
tion. Finally, we allowed the locations of these decision criteria tovary from trial to trial: The standard deviation of the criterionlocation over trials was varied from 0 (no variability) to 0.6.
For each combination of parameter values, we sampled 1,000strengths from each distribution, reflecting simulated problems,and compared those strengths with the decision criteria to deter-mine the response. For example, sampled strengths that fell abovethe highest confidence induction criterion were assumed to yield“highest confidence strong” responses but would lead only to“highest confidence valid” responses if they also exceeded themost stringent deduction criterion. From these simulated trials, wegenerated predicted response rates for each set of parameter val-ues; the best fitting parameters were selected from those evaluatedby minimizing the mean square error of prediction. We did notseek to find the best possible fits overall, but we are confident thatthese simulations capture the essential predictions of the model,because we sampled a large number of parameter combinationsand because the consequences of, say, shifting decision criteria orincreasing their variability in a one-dimensional model are wellunderstood within SDT (see Macmillan & Creelman, 2005).
For the data in Experiment 1a, the best fitting parameter valuesindicated that there were effectively two distributions for invalidproblems (one for one- and three-premise problems and anotherfor five-premise problems) and two distributions for valid prob-lems (one for one-premise problems and another for three- andfive-premise problems). In the best fitting parameterization of themodel, there was no criterion variability, meaning that this modelpredicts, in contrast with the results, the same level of accuracy forboth deduction and induction judgments (d� � 2.4, 2.3, and 1.8 forone-, three-, and five-premise problems). Because the invaliddistributions vary with argument length, the false alarm rate is alsopredicted to vary with argument length, for both deduction (rang-ing from .11 to .21), in contrast with the results, and induction(ranging from .14 to .27).
We also fit the data from Experiment 1b, allowing separatedistributions to represent the valid identity and inclusion problems.Specifically, we assumed that the number of premises and theinclusion–identity characteristic of the valid problems had inde-pendent effects on the mean value of a valid distribution. Here themodel fit implied that all the invalid distributions had the samemean, so that the predicted false alarm rate did not vary withargument length, in contrast with the results in the inductioncondition. Four valid distributions were inferred, one each forone-premise inclusion and identity problems, one for three- andfive-premise inclusion problems, and one for three- and five-premise identity problems; in each case, the inclusion distributionhad a lower mean strength than the identity distribution. In the bestfitting parameterization of the model, criterion variability wasagain zero, so that the same level of accuracy was predicted forboth deduction and induction, in contrast with the empirical data.
In summary, a one-dimensional model that assumed that thesame distributions, but potentially different response criteria, areused for both deduction and induction failed to capture the basicpatterns in the data. One reason for this failure is clear in Table 1:The false alarm rates are higher in the induction condition than inthe deduction condition in both Experiments 1a and 1b, yet the hitrates are quite similar across tasks. Given the assumption that theevidence distributions are the same for both conditions, the ob-served hit rates for induction and deduction imply that the same
criterion is used for both conditions. However, that implication isin conflict with the observed differences in the false alarm ratesacross conditions: If the same criterion is used, thus generatingsimilar hit rates, then the false alarm rates should also be similar.Allowing for variability in criterion locations cannot resolve thisfundamental inconsistency. In one-dimensional models like thisone, the presence of criterion variability will increase the estimatedfalse alarm rate and simultaneously decrease the estimated hit rate.Our data are not consistent with that predicted outcome, and thusour modeling efforts led to the conclusion that there was noevidence for criterion variability.
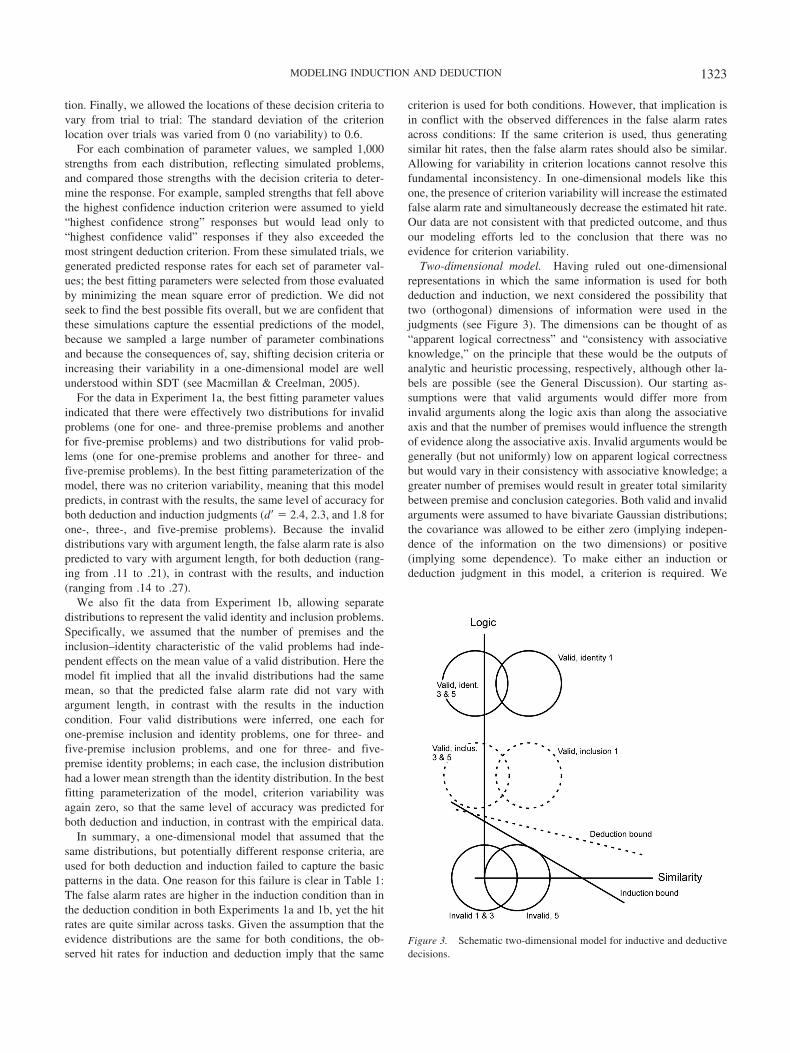
Two-dimensional model. Having ruled out one-dimensionalrepresentations in which the same information is used for bothdeduction and induction, we next considered the possibility thattwo (orthogonal) dimensions of information were used in thejudgments (see Figure 3). The dimensions can be thought of as“apparent logical correctness” and “consistency with associativeknowledge,” on the principle that these would be the outputs ofanalytic and heuristic processing, respectively, although other la-bels are possible (see the General Discussion). Our starting as-sumptions were that valid arguments would differ more frominvalid arguments along the logic axis than along the associativeaxis and that the number of premises would influence the strengthof evidence along the associative axis. Invalid arguments would begenerally (but not uniformly) low on apparent logical correctnessbut would vary in their consistency with associative knowledge; agreater number of premises would result in greater total similaritybetween premise and conclusion categories. Both valid and invalidarguments were assumed to have bivariate Gaussian distributions;the covariance was allowed to be either zero (implying indepen-dence of the information on the two dimensions) or positive(implying some dependence). To make either an induction ordeduction judgment in this model, a criterion is required. We
Figure 3. Schematic two-dimensional model for inductive and deductivedecisions.
1323MODELING INDUCTION AND DEDUCTION
assumed that both types of judgments involve weighted combina-tions of evidence on the two dimensions, which yields decisioncriteria that do not parallel either strength axis. The relative weightgiven to the two dimensions is reflected in the angle of the decisionbound that divides positive from negative decisions in each task:Deduction places a relatively greater emphasis on logic, and there-fore the slope of that decision bound is shallower, as is shownschematically in Figure 3. Because the slope of the decision boundis assumed to differ for induction and deduction, and because themean value of a distribution may be greater on one dimension thanthe other, this model naturally allows that accuracy for inductiveand deductive decisions will differ (without the need to considercriterion variability). Differences in the pattern of false alarms withargument length are also possible, depending on the angle of thedecision bounds.
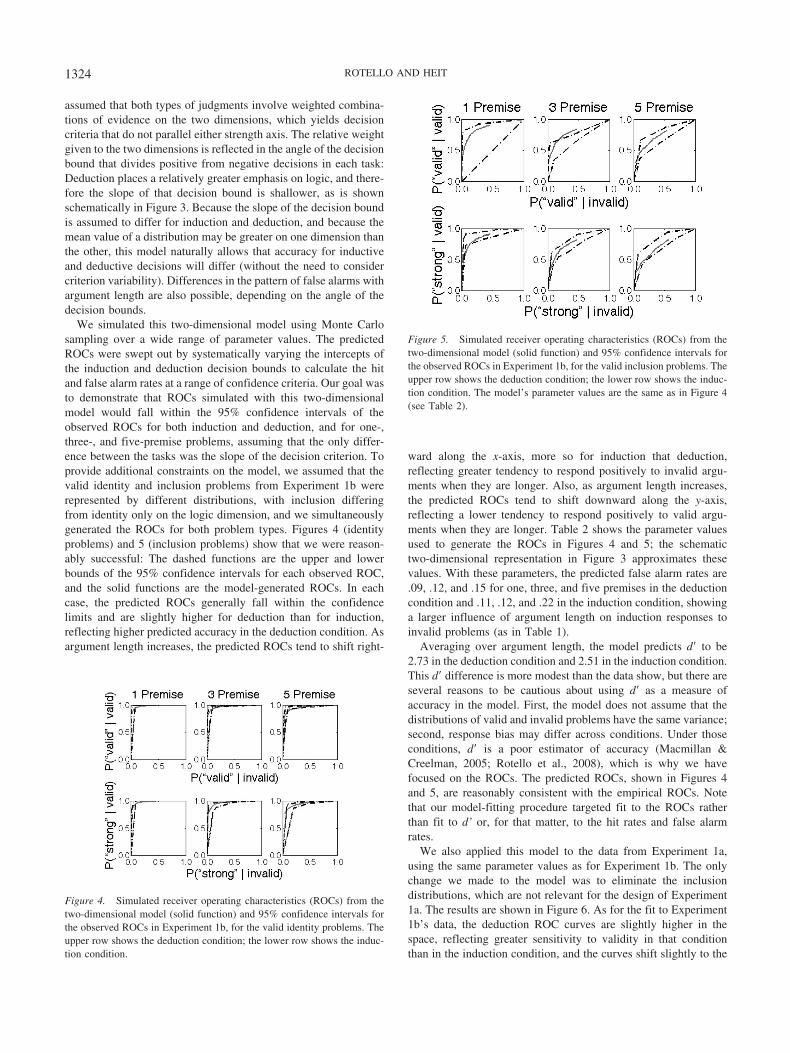
We simulated this two-dimensional model using Monte Carlosampling over a wide range of parameter values. The predictedROCs were swept out by systematically varying the intercepts ofthe induction and deduction decision bounds to calculate the hitand false alarm rates at a range of confidence criteria. Our goal wasto demonstrate that ROCs simulated with this two-dimensionalmodel would fall within the 95% confidence intervals of theobserved ROCs for both induction and deduction, and for one-,three-, and five-premise problems, assuming that the only differ-ence between the tasks was the slope of the decision criterion. Toprovide additional constraints on the model, we assumed that thevalid identity and inclusion problems from Experiment 1b wererepresented by different distributions, with inclusion differingfrom identity only on the logic dimension, and we simultaneouslygenerated the ROCs for both problem types. Figures 4 (identityproblems) and 5 (inclusion problems) show that we were reason-ably successful: The dashed functions are the upper and lowerbounds of the 95% confidence intervals for each observed ROC,and the solid functions are the model-generated ROCs. In eachcase, the predicted ROCs generally fall within the confidencelimits and are slightly higher for deduction than for induction,reflecting higher predicted accuracy in the deduction condition. Asargument length increases, the predicted ROCs tend to shift right-
ward along the x-axis, more so for induction that deduction,reflecting greater tendency to respond positively to invalid argu-ments when they are longer. Also, as argument length increases,the predicted ROCs tend to shift downward along the y-axis,reflecting a lower tendency to respond positively to valid argu-ments when they are longer. Table 2 shows the parameter valuesused to generate the ROCs in Figures 4 and 5; the schematictwo-dimensional representation in Figure 3 approximates thesevalues. With these parameters, the predicted false alarm rates are.09, .12, and .15 for one, three, and five premises in the deductioncondition and .11, .12, and .22 in the induction condition, showinga larger influence of argument length on induction responses toinvalid problems (as in Table 1).
Averaging over argument length, the model predicts d� to be2.73 in the deduction condition and 2.51 in the induction condition.This d� difference is more modest than the data show, but there areseveral reasons to be cautious about using d� as a measure ofaccuracy in the model. First, the model does not assume that thedistributions of valid and invalid problems have the same variance;second, response bias may differ across conditions. Under thoseconditions, d� is a poor estimator of accuracy (Macmillan &Creelman, 2005; Rotello et al., 2008), which is why we havefocused on the ROCs. The predicted ROCs, shown in Figures 4and 5, are reasonably consistent with the empirical ROCs. Notethat our model-fitting procedure targeted fit to the ROCs ratherthan fit to d’ or, for that matter, to the hit rates and false alarmrates.
We also applied this model to the data from Experiment 1a,using the same parameter values as for Experiment 1b. The onlychange we made to the model was to eliminate the inclusiondistributions, which are not relevant for the design of Experiment1a. The results are shown in Figure 6. As for the fit to Experiment1b’s data, the deduction ROC curves are slightly higher in thespace, reflecting greater sensitivity to validity in that conditionthan in the induction condition, and the curves shift slightly to the
Figure 4. Simulated receiver operating characteristics (ROCs) from thetwo-dimensional model (solid function) and 95% confidence intervals forthe observed ROCs in Experiment 1b, for the valid identity problems. Theupper row shows the deduction condition; the lower row shows the induc-tion condition.
Figure 5. Simulated receiver operating characteristics (ROCs) from thetwo-dimensional model (solid function) and 95% confidence intervals forthe observed ROCs in Experiment 1b, for the valid inclusion problems. Theupper row shows the deduction condition; the lower row shows the induc-tion condition. The model’s parameter values are the same as in Figure 4(see Table 2).
1324 ROTELLO AND HEIT
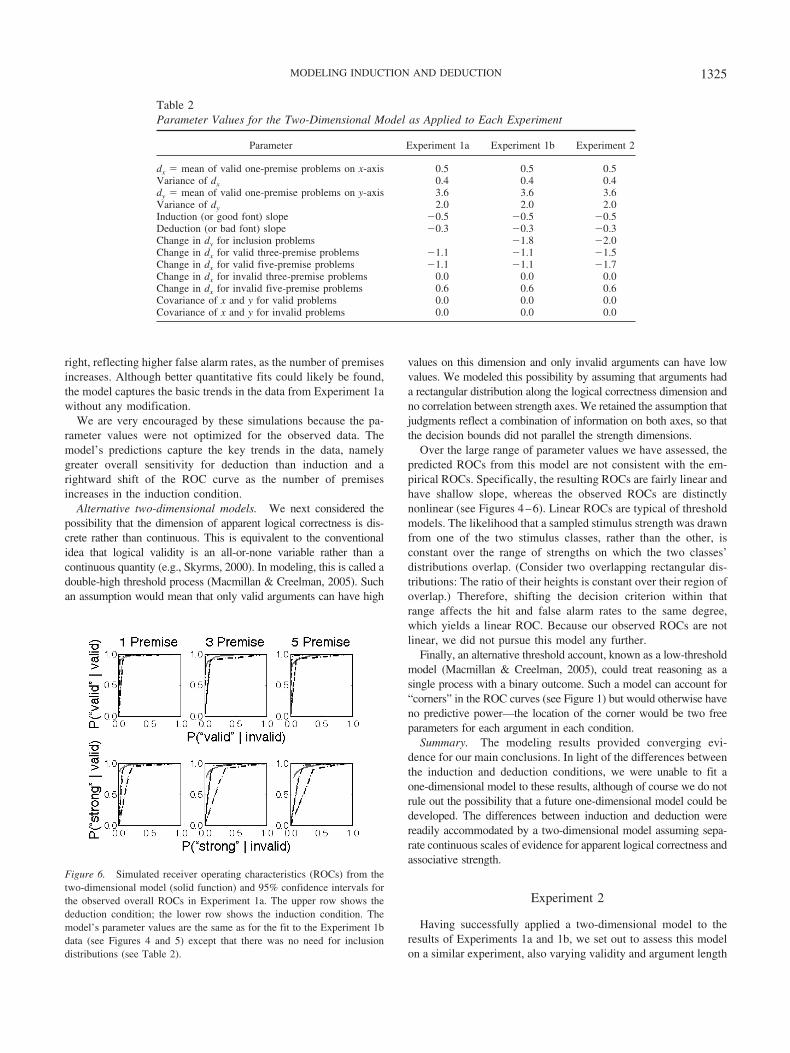
right, reflecting higher false alarm rates, as the number of premisesincreases. Although better quantitative fits could likely be found,the model captures the basic trends in the data from Experiment 1awithout any modification.
We are very encouraged by these simulations because the pa-rameter values were not optimized for the observed data. Themodel’s predictions capture the key trends in the data, namelygreater overall sensitivity for deduction than induction and arightward shift of the ROC curve as the number of premisesincreases in the induction condition.
Alternative two-dimensional models. We next considered thepossibility that the dimension of apparent logical correctness is dis-crete rather than continuous. This is equivalent to the conventionalidea that logical validity is an all-or-none variable rather than acontinuous quantity (e.g., Skyrms, 2000). In modeling, this is called adouble-high threshold process (Macmillan & Creelman, 2005). Suchan assumption would mean that only valid arguments can have high
values on this dimension and only invalid arguments can have lowvalues. We modeled this possibility by assuming that arguments hada rectangular distribution along the logical correctness dimension andno correlation between strength axes. We retained the assumption thatjudgments reflect a combination of information on both axes, so thatthe decision bounds did not parallel the strength dimensions.
Over the large range of parameter values we have assessed, thepredicted ROCs from this model are not consistent with the em-pirical ROCs. Specifically, the resulting ROCs are fairly linear andhave shallow slope, whereas the observed ROCs are distinctlynonlinear (see Figures 4–6). Linear ROCs are typical of thresholdmodels. The likelihood that a sampled stimulus strength was drawnfrom one of the two stimulus classes, rather than the other, isconstant over the range of strengths on which the two classes’distributions overlap. (Consider two overlapping rectangular dis-tributions: The ratio of their heights is constant over their region ofoverlap.) Therefore, shifting the decision criterion within thatrange affects the hit and false alarm rates to the same degree,which yields a linear ROC. Because our observed ROCs are notlinear, we did not pursue this model any further.
Finally, an alternative threshold account, known as a low-thresholdmodel (Macmillan & Creelman, 2005), could treat reasoning as asingle process with a binary outcome. Such a model can account for“corners” in the ROC curves (see Figure 1) but would otherwise haveno predictive power—the location of the corner would be two freeparameters for each argument in each condition.
Summary. The modeling results provided converging evi-dence for our main conclusions. In light of the differences betweenthe induction and deduction conditions, we were unable to fit aone-dimensional model to these results, although of course we do notrule out the possibility that a future one-dimensional model could bedeveloped. The differences between induction and deduction werereadily accommodated by a two-dimensional model assuming sepa-rate continuous scales of evidence for apparent logical correctness andassociative strength.
Experiment 2
Having successfully applied a two-dimensional model to theresults of Experiments 1a and 1b, we set out to assess this modelon a similar experiment, also varying validity and argument length
Table 2Parameter Values for the Two-Dimensional Model as Applied to Each Experiment
Parameter Experiment 1a Experiment 1b Experiment 2
dx � mean of valid one-premise problems on x-axis 0.5 0.5 0.5Variance of dx 0.4 0.4 0.4dy � mean of valid one-premise problems on y-axis 3.6 3.6 3.6Variance of dy 2.0 2.0 2.0Induction (or good font) slope �0.5 �0.5 �0.5Deduction (or bad font) slope �0.3 �0.3 �0.3Change in dy for inclusion problems �1.8 �2.0Change in dx for valid three-premise problems �1.1 �1.1 �1.5Change in dx for valid five-premise problems �1.1 �1.1 �1.7Change in dx for invalid three-premise problems 0.0 0.0 0.0Change in dx for invalid five-premise problems 0.6 0.6 0.6Covariance of x and y for valid problems 0.0 0.0 0.0Covariance of x and y for invalid problems 0.0 0.0 0.0
Figure 6. Simulated receiver operating characteristics (ROCs) from thetwo-dimensional model (solid function) and 95% confidence intervals forthe observed overall ROCs in Experiment 1a. The upper row shows thededuction condition; the lower row shows the induction condition. Themodel’s parameter values are the same as for the fit to the Experiment 1bdata (see Figures 4 and 5) except that there was no need for inclusiondistributions (see Table 2).
1325MODELING INDUCTION AND DEDUCTION
but with an additional manipulation. In Experiment 2, we manip-ulated fluency by displaying the materials in either a good, read-able font or a bad, less readable font. It was expected that using adisfluent font would encourage the use of analytic processes,increasing sensitivity to validity of an argument (Alter et al.,2007). According to our two-dimensional model, an increasedreliance on analytic processes would be reflected in a shallowerdecision slope. Only induction instructions were used becauseparticipants had shown such a high level of sensitivity to argumentvalidity for deduction instructions in Experiments 1a and 1b that itseemed unlikely that sensitivity could be increased further. Ourmodel-based prediction is that the primary difference betweenconditions would be in the slope of the decision bound: shallowerfor the bad font condition and steeper for the good font condition.It is also possible, of course, that the font itself would influence thestrength of encoding. The bad font condition might force partici-pants to pay more attention to the problems, thus yielding greaterstrength of evidence on the logic and associative informationdimensions. That greater strength would be reflected in largervalues for the parameters that locate the means of the distributionsalong the axes.
Method
The method of Experiment 2 was the same as in Experiment 1bexcept for the following: Sixty-nine University of California, Mer-ced, students participated, 34 in the good font condition and 35 inthe bad font condition. All participants received induction instruc-tions.
The good font was Courier New, which was the same font as inExperiments 1a and 1b. The bad font was also Courier New butwas italicized and had lower contrast: The letters were a silver(gray) color rather than black.
Results
Four participants from the good font condition and 6 partici-pants from the bad font condition were excluded, according to thesame criteria as in Experiments 1a and 1b.
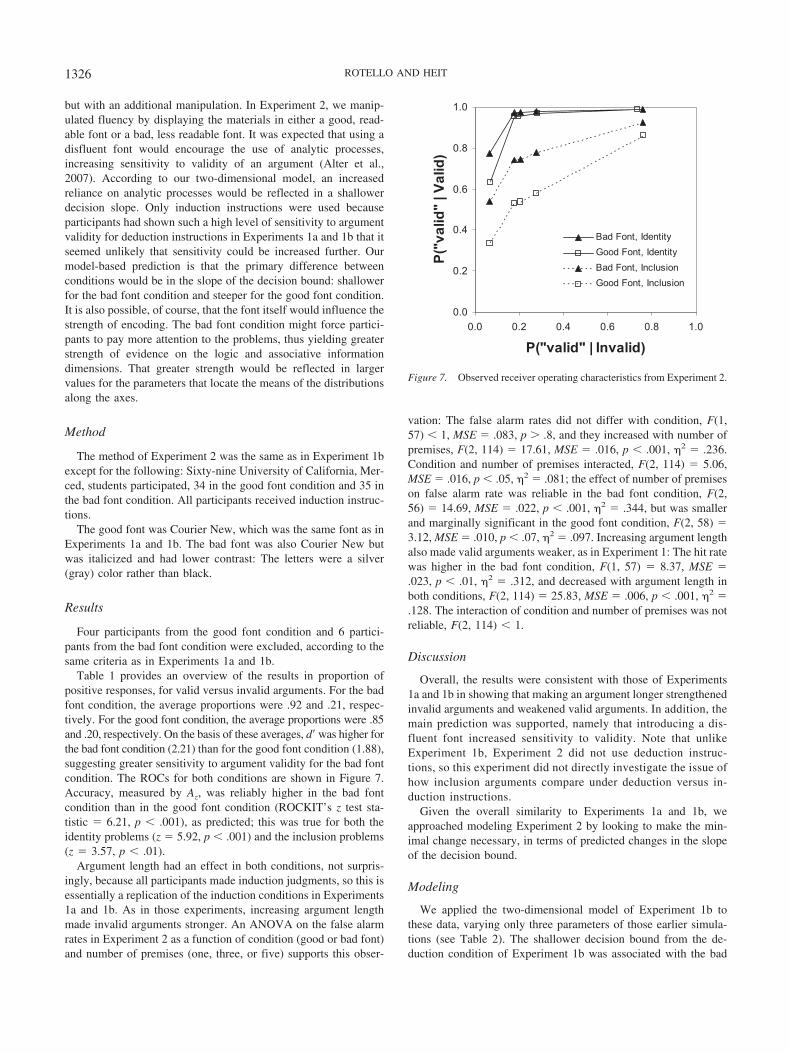
Table 1 provides an overview of the results in proportion ofpositive responses, for valid versus invalid arguments. For the badfont condition, the average proportions were .92 and .21, respec-tively. For the good font condition, the average proportions were .85and .20, respectively. On the basis of these averages, d� was higher forthe bad font condition (2.21) than for the good font condition (1.88),suggesting greater sensitivity to argument validity for the bad fontcondition. The ROCs for both conditions are shown in Figure 7.Accuracy, measured by Az, was reliably higher in the bad fontcondition than in the good font condition (ROCKIT’s z test sta-tistic � 6.21, p � .001), as predicted; this was true for both theidentity problems (z � 5.92, p � .001) and the inclusion problems(z � 3.57, p � .01).
Argument length had an effect in both conditions, not surpris-ingly, because all participants made induction judgments, so this isessentially a replication of the induction conditions in Experiments1a and 1b. As in those experiments, increasing argument lengthmade invalid arguments stronger. An ANOVA on the false alarmrates in Experiment 2 as a function of condition (good or bad font)and number of premises (one, three, or five) supports this obser-
vation: The false alarm rates did not differ with condition, F(1,57) � 1, MSE � .083, p � .8, and they increased with number ofpremises, F(2, 114) � 17.61, MSE � .016, p � .001, �2 � .236.Condition and number of premises interacted, F(2, 114) � 5.06,MSE � .016, p � .05, �2 � .081; the effect of number of premiseson false alarm rate was reliable in the bad font condition, F(2,56) � 14.69, MSE � .022, p � .001, �2 � .344, but was smallerand marginally significant in the good font condition, F(2, 58) �3.12, MSE � .010, p � .07, �2 � .097. Increasing argument lengthalso made valid arguments weaker, as in Experiment 1: The hit ratewas higher in the bad font condition, F(1, 57) � 8.37, MSE �.023, p � .01, �2 � .312, and decreased with argument length inboth conditions, F(2, 114) � 25.83, MSE � .006, p � .001, �2 �.128. The interaction of condition and number of premises was notreliable, F(2, 114) � 1.
Discussion
Overall, the results were consistent with those of Experiments1a and 1b in showing that making an argument longer strengthenedinvalid arguments and weakened valid arguments. In addition, themain prediction was supported, namely that introducing a dis-fluent font increased sensitivity to validity. Note that unlikeExperiment 1b, Experiment 2 did not use deduction instruc-tions, so this experiment did not directly investigate the issue ofhow inclusion arguments compare under deduction versus in-duction instructions.
Given the overall similarity to Experiments 1a and 1b, weapproached modeling Experiment 2 by looking to make the min-imal change necessary, in terms of predicted changes in the slopeof the decision bound.
Modeling
We applied the two-dimensional model of Experiment 1b tothese data, varying only three parameters of those earlier simula-tions (see Table 2). The shallower decision bound from the de-duction condition of Experiment 1b was associated with the bad
0.0
0.2
0.4
0.6
0.8
1.0
0.0 0.2 0.4 0.6 0.8 1.0
P("valid" | Invalid)
P("v
alid
" | V
alid
)
Bad Font, IdentityGood Font, IdentityBad Font, InclusionGood Font, Inclusion
Figure 7. Observed receiver operating characteristics from Experiment 2.
1326 ROTELLO AND HEIT

font condition in Experiment 2. The results are shown in Figure 8for the identity problems and in Figure 9 for the inclusion prob-lems. Although better fits might be found with a thorough consid-eration of parameter space, the basic patterns in the data arereflected in this simulation (lower sensitivity to validity for the badfont condition, similar effects of argument length as in Experiment1b), which is sufficient for current purposes.
General Discussion
The experimental results imply that induction judgments anddeduction judgments draw on different cognitive resources, evenwhen people are judging the same arguments. Put another way,there is not just a single scale of evidence for evaluating the strengthof arguments. Experiments 1a and 1b highlighted differences betweeninduction and deduction. People are more influenced by argumentlength for induction, and they are more influenced by validity fordeduction. Implementations of one-process models of reasoningwere not able to accommodate these results, but an implementedtwo-process model gave a successful account, by assuming thatapparent logical validity and associative strength contribute to bothkinds of judgments but in different proportions. This model wastested further in Experiment 2, which included a fluency manipu-lation, with a bad font intended to increase the influence of analyticprocesses on induction judgments. Participants showed a greaterinfluence of validity in the bad font condition, and the results ofExperiment 2 were successfully accommodated by the same two-process model, by assuming that the bad font led to a change in theslope of the decision boundary, representing greater sensitivity toapparent logical validity.
In a related study, Heit and Rotello (2009) found two analogouseffects. One of their experiments varied premise–conclusion sim-ilarity (i.e., similarity between the premise and conclusion catego-ries in one-premise arguments) as well as logical validity. Giventhe same set of arguments, induction judgments were affectedmore by similarity, and deduction judgments were affected more
by actual validity. These results, too, pointed to two-process ac-counts and were not readily explained by one-process accounts. Ina follow-up experiment, we compared speeded deduction judg-ments and unspeeded deduction judgments. The speeded deductionjudgments were more like induction judgments in showing a lesserimpact of validity and a greater impact of validity. This result, too,is readily explained by a two-process account on the assumptionthat underlying processing needed to assess logical validity has aslower time course. Hence, speeding deduction judgments willlead to a relatively lower influence of validity on responses.
In the remainder of the General Discussion, we consider impli-cations of these results for reasoning research and highlight somemore general issues in model selection.
Implications for Reasoning Research
As noted in the introduction, one-process and two-process ac-counts of reasoning are each represented by several very success-ful research programs. Although one-process and two-processaccounts stand in opposition, they are seldom pitted against eachother directly. In one-process accounts, it is more typical to com-pare different accounts of deductive reasoning against one another(e.g., mental model theory vs. mental logical theory or probabilis-tic models) and different accounts of inductive reasoning againstone another. Although two-process accounts have been used toexplain many results, that work has not impeded research onone-process models. Hence, we see great value in implementingboth one- and two-process models and comparing them in fit tocommon data sets. Our own work has implications for research onboth one-process and two-process models.
For current one-process models in the literature (e.g., Johnson-Laird, 1994; Oaksford and Chater, 2007; Osherson et al., 1990;Sloman, 1993), we make the following points. These models donot make explicit predictions about reasoning under differentinstructional conditions, such as deduction versus induction in-structions. To the extent that there are differences, and indeed there
Figure 8. Simulated receiver operating characteristics (ROCs) from thetwo-dimensional model (solid function) and 95% confidence intervals forthe observed ROCs to identity problems in Experiment 2. The upper rowshows the bad font condition; the lower row shows the good font condition.The model’s parameter values are nearly all the same as for the fit to theExperiment 1b data (see Table 2).
Figure 9. Simulated receiver operating characteristics (ROCs) from thetwo-dimensional model (solid function) and 95% confidence intervals forthe observed ROCs to inclusion problems in Experiment 2. The upper rowshows the bad font condition; the lower row shows the good font condition.The model’s parameter values are nearly all the same as for the fit to theExperiment 1b data (see Table 2).
1327MODELING INDUCTION AND DEDUCTION

are, these would need to be accommodated by additional assump-tions for these models. One possibility, suggested by Rips (2001),is that deduction judgments have a stricter response criterion, butsuch an account was not successful for either Rips’s data or ourown. We examined another possibility, that deduction and induc-tion judgments could differ in variability of criteria, but thataccount was not successful for our data either. A third possibility,that two completely separate one-process accounts are used, onefor deduction and another for induction, would abandon any as-sumption that the two types of judgments should be systematicallyrelated.
Still, by no means do we rule out one-process models based onour results, and we hope that our results will spur the developmentof future one-process models. However, we suspect that a success-ful one-process model would have to become more like a two-process model. It is noteworthy that none of the one-processmodels of reasoning that we have examined maintain separatesources of information about validity and argument length (orsimilarity). For example, Bayesian models of reasoning (Oaksford& Chater, 2007; see also Heit, 1998; Tenenbaum & Griffiths,2001) measure the strength of an argument in the probability of itsconclusion; within these models there are no component probabil-ities for validity and argument length that could be recombined toperform induction or deduction. Perhaps some existing one-process model could be modified so that it can tap into informationsources that we are calling apparent logical validity and associativestrength and use this information differentially for induction anddeduction, but, again, such a model would be getting very close totwo-process models in having two ways of evaluating an argumentand two scales of argument strength.
With regard to two-process models, one contribution we havemade is implementing specific models and providing a frameworkfor describing various models (e.g., by showing that differencesbetween induction and deduction can be explained in the slope ofa decision boundary and by comparing continuous vs. discretedimensional representation). Although our models represent ex-plicit hypotheses about how two sources of evidence are brought tobear on making judgments, we do not claim to have developed aprocess model of reasoning. Two-process theories of reasoningcome in different varieties (see Evans, 2008, for an overview). Forexample, analytic processes might follow heuristic processes se-quentially, or these processes might run in parallel. The multidi-mensional models we have developed could constrain processmodels, but they are not process models themselves and thus makeno claims about the sequence of the underlying processes. Indeed,our two-dimensional model does not make strong claims about theprecise nature of the underlying dimensions; our choice of labels(x � similarity; y � logic) is arbitrary. A preference for alternativelabels for the dimensions (such as gist and verbatim representa-tions as in fuzzy-trace theory; Reyna & Brainerd, 2008) would notdetract from our main point that deductive and inductive judg-ments are based on different weighted combinations of at least twounderlying sources of information (for a similar point on modelingrecognition memory judgments, see Macmillan & Rotello, 2006).One interesting possibility is that the outputs of existing processmodels could serve as inputs to our own multidimensional models.For example, a current model of deductive reasoning could provideinformation for the y-axis, serving as a proxy for apparent logical
correctness, and a current model of inductive reasoning couldprovide information for the x-axis, serving as associative strength.
We hope that our results and analyses will encourage futuremodeling efforts, encompassing both traditional deduction prob-lems and traditional induction problems, made under either deduc-tion or induction instructions.
Issues in Model Selection
We selected a particular two-dimensional model to describe ourdata, after consideration of several alternative models. One generalconcern that arises in any model selection situation is the relativeflexibility of the models under consideration: Models with greaterflexibility are better able to mimic the data produced by othermodels (Pitt, Myung, & Zhang, 2002). Model flexibility generallyincreases with the number of free parameters but also varies withits functional form. For example, a two-parameter linear model(y � a � bx) has less flexibility than a two-parameter sinusoidalmodel (y � a sin bx) because the parameters of the latter can beadjusted to fit either linear or curved functions.
One way of putting nonnested models with different numbers ofparameters on a more equal playing field is to adjust theirgoodness-of-fit statistics for the number of parameters. Measureslike Akaike’s Information Criterion (Akaike, 1973) and the Bayes-ian Information Criterion (Schwarz, 1978) are commonly used forthis purpose. Simply adjusting for the number of parameters failsto account for differences in the functional forms of competingmodels, as our linear–sinusoidal example demonstrates; morecomplicated techniques are available (e.g., Pitt et al., 2002;Wagenmakers, Ratcliff, Gomez, & Iverson, 2004) that have some-times been applied successfully to memory models (Cohen,Rotello, & Macmillan, 2008).
An altogether different strategy is to consider the type of dataoutcome that cannot be predicted by a particular model and then toevaluate whether such data have ever been observed empirically. Ifsuch data have been reported, support for that model is reduced; ifthose data do not exist (despite appropriate conditions having beenrun), support for that model is somewhat increased. This approachwas recently adopted by Dunn (2008) to evaluate models of theremember–know task in memory research, and it has been arguedto be the most powerful strategy for model selection (Myung, Pitt,& Navarro, 2007). It is exactly this strategy that allowed us to ruleout the one-process model of reasoning sketched in Figure 2: Itcannot simultaneously predict no change in false alarm rate withnumber premises (to fit the deduction data) and some change (to fitthe induction data). Similarly, that one-process model cannot pre-dict different values of sensitivity for deduction and inductionwithout assuming that there is criterion variability, and the pres-ence of criterion variability would increase the false alarm ratewhile simultaneously decreasing the hit rate. This predicted patternof data is simply not consistent with our results, and thus supportfor the one-dimensional model is reduced.
The two-process models that we considered have more param-eters and greater flexibility than the one-process model; they canfit a larger variety of data patterns. However, our conclusionsabout which model best captured the data were based on qualita-tive evaluations of what the models can and cannot predict ratherthan on quantitative comparisons of the goodness-of-fit measures.For example, we rejected a two-process model that assumed the
1328 ROTELLO AND HEIT
dimension of apparent logical correctness is discrete rather thancontinuous because the predicted ROCs were always more linearthan the empirical ROCs. Moreover, we developed the successfultwo-process model in a principled fashion (e.g., assuming that inclu-sion and identity problems differ only on the y-axis); the model is notcompletely flexible. Additional data sets that include confidenceratings and allow the construction of ROCs will be important forfurther progress; these will provide a more extensive test bed formodel comparison and selection. The existing data (see also Heit& Rotello, 2009) are consistent in pointing to two continuousdimensions of argument strength that are differentially weighteddepending on the reasoning task.
References
Akaike, H. (1973). Information theory as an extension of the maximumlikelihood principle. In B. N. Petrov & F. Csaki (Eds.), Second Inter-national Symposium on Information Theory (pp. 267–281). Budapest,Hungary: Akademiai Kiado.
Alter, A. L., Oppenheimer, D. M., Epley, N., & Eyre, R. N. (2007).Overcoming intuition: Metacognitive difficulty activates analytic rea-soning. Journal of Experimental Psychology: General, 136, 569–576.
Baranski, J. V., & Petrusic, W. M. (2001). Testing architectures of thedecision–confidence relation. Canadian Journal of Experimental Psy-chology, 55, 195–206.
Calvillo, D. P., & Revlin, R. (2005). The role of similarity in deductivecategorical inference. Psychonomic Bulletin & Review, 12, 938–944.
Cohen, A. L., Rotello, C. M., & Macmillan, N. A. (2008). Evaluatingmodels of remember–know judgments: Complexity, mimicry, and dis-criminability. Psychonomic Bulletin & Review, 15, 906–926.
Donaldson, W. (1996). The role of decision processes in remembering andknowing. Memory & Cognition, 24, 523–533.
Dougal, S., & Rotello, C. M. (2007). “Remembering” emotional words isbased on response bias, not recollection. Psychonomic Bulletin & Re-view, 14, 423–429.
Dunn, J. C. (2008). The dimensionality of the remember–know task: Astate-trace analysis. Psychological Review, 115, 426–446.
Dunn, J. C., & Kirsner, K. (1988). Discovering functionally independentmental processes: The principle of reversed association. PsychologicalReview, 95, 91–101.
Egan, J. P., Schulman, A. I., & Greenberg, G. Z. (1964). Operatingcharacteristics determined by binary decisions and by ratings. In J. A.Swets (Ed.), Signal detection and recognition by human observers:Contemporary readings (pp. 172–186). New York: Wiley.
Evans, J. St. B. T. (2008). Dual-processing accounts of reasoning, judg-ment, and social cognition. Annual Review of Psychology, 59, 255–278.
Evans, J. St. B. T., & Over, D. E. (1996). Rationality and reasoning. Hove,England: Psychology Press.
Harman, G. (1999). Reasoning, meaning, and mind. Oxford, England:Oxford University Press.
Heit, E. (1998). A Bayesian analysis of some forms of inductive reasoning.In M. Oaksford & N. Chater (Eds.), Rational models of cognition (pp.248–274). Oxford, England: Oxford University Press.
Heit, E. (2000). Properties of inductive reasoning. Psychonomic Bulletin &Review, 7, 569–592.
Heit, E. (2007). What is induction and why study it? In A. Feeney & E.Heit (Eds.), Inductive reasoning: Cognitive, mathematical, and neuro-scientific approaches (pp. 1–24). Cambridge, England: Cambridge Uni-versity Press.
Heit, E., & Rotello, C. M. (2005). Are there two kinds of reasoning? InB. G. Bara, L. Barsalou, & M. Bucciarelli (Eds.), Proceedings of theTwenty-Seventh Annual Meeting of the Cognitive Science Society (pp.923–928). Mahwah, NJ: Erlbaum.
Heit, E., & Rotello, C. M. (2008). Modeling two kinds of reasoning. InB. C. Love, K. McRae, & V. M. Sloutsky (Eds.), Proceedings of theThirtieth Annual Meeting of the Cognitive Science Society (pp. 1831–1836). Austin, TX: Cognitive Science Society.
Heit, E., & Rotello, C. M. (2009). Relations between inductive reasoningand deductive reasoning. Manuscript submitted for publication.
Johnson-Laird, P. N. (1994). Mental models and probabilistic thinking.Cognition, 50, 189–209.
Lombrozo, T. (2007). Simplicity and probability in causal explanation.Cognitive Psychology, 55, 232–257.
Macmillan, N. A., & Creelman, C. D. (2005). Detection theory: A user’sguide (2nd ed.). Mahwah, NJ: Erlbaum.
Macmillan, N. A., & Rotello, C. M. (2006). Deciding about decisionmodels of remember and know judgments: A reply to Murdock. Psy-chological Review, 113, 657–665.
Macmillan, N. A., Rotello, C. M., & Verde, M. F. (2005). On the impor-tance of models in interpreting remember–know experiments: Com-ments on Gardiner et al.’s (2002) meta-analysis. Memory, 13, 607–621.
Metz, C. E. (1998). ROCKIT [Computer software]. Retrieved January 4,2006, from at http://xray.bsd.uchicago.edu/cgi-bin/roc_software.cgi
Mueller, S. T., & Weidemann, C. T. (2008). Decision noise: An explana-tion for observed violations of signal detection theory. PsychonomicBulletin & Review, 15, 465–494.
Myung, I. J., Pitt, M. A., & Navarro, D. J. (2007). Does response scalingcause the generalized context model to mimic a prototype model?Psychonomic Bulletin & Review, 14, 1043–1050.
Oaksford, M., & Chater, N. (2002). Commonsense reasoning, logic, andhuman rationality. In R. Elio (Ed.), Common sense, reasoning, andrationality (pp. 174–214). Oxford, England: Oxford University Press.
Oaksford, M., & Chater, N. (2007). Bayesian rationality: The probabilisticapproach to human reasoning. Oxford, England: Oxford UniversityPress.
Oaksford, M., & Hahn, U. (2007). Induction, deduction and argumentstrength in human reasoning and argumentation. In A. Feeney & E. Heit(Eds.), Inductive reasoning: Cognitive, mathematical, and neuroscien-tific approaches (pp. 269–301). Cambridge, England: Cambridge Uni-versity Press.
Osherson, D., Perani, D., Cappa, S., Schnur, T., Grassi, F., & Fazio, F.(1998). Distinct brain loci in deductive versus probabilistic reasoning.Neuropsychologia, 36, 369–376.
Osherson, D. N., Smith, E. E., Wilkie, O., Lopez, A., & Shafir, E. (1990).Category-based induction. Psychological Review, 97, 185–200.
Petty, R. E., & Cacioppo, J. T. (1984). The effects of involvement onresponses to argument quantity and quality: Central and peripheralroutes to persuasion. Journal of Personality and Social Psychology, 46,69–81.
Pfeifer, N., & Kleiter, G. D. (2009). Mental probability logic [Commentaryon Oaksford & Chater: Bayesian rationality: The probabilistic approachto human reasoning]. Behavioral and Brain Sciences, 32, 98–99.
Pitt, M. A., Myung, I. J., & Zhang, S. (2002). Toward a method of selectingamong computational models of cognition. Psychological Review, 109,472–491.
Reyna, V. F., & Brainerd, C. J. (2008). Numeracy, ratio bias, and denom-inator neglect in judgments of risk and probability. Learning and Indi-vidual Differences, 18, 89–107.
Rips, L. J. (2001). Two kinds of reasoning. Psychological Science, 12,129–134.
Rotello, C. M., Masson, M. E. J., & Verde, M. F. (2008). Type I error ratesand power analyses for single-point sensitivity measures. Perception &Psychophysics, 70, 389–401.
Schwarz, G. (1978). Estimating the dimension of a model. Annals ofStatistics, 6, 461–464.
Skyrms, B. (2000). Choice and chance: An introduction to inductive logic(4th ed.). Belmont, CA: Wadsworth/Thomson.
1329MODELING INDUCTION AND DEDUCTION
Sloman, S. A. (1993). Feature-based induction. Cognitive Psychology, 25,231–280.
Sloman, S. A. (1996). The empirical case for two systems of reasoning.Psychological Bulletin, 119, 3–22.
Sloman, S. A. (1998). Categorical inference is not a tree: The myth ofinheritance hierarchies. Cognitive Psychology, 35, 1–33.
Stanovich, K. E. (1999). Who is rational? Studies of individual differencesin reasoning. Mahwah, NJ: Erlbaum.
Stevenson, R. J., & Over, D. E. (1995). Deduction from uncertain premises.Quarterly Journal of Experimental Psychology: Human ExperimentalPsychology, 48A, 613–643.
Swets, J. A. (1986). Indices of discrimination or diagnostic accuracy: TheirROCs and implied models. Psychological Bulletin, 99, 100–117.
Tenenbaum, J. B., & Griffiths, T. L. (2001). Generalization, similarity, andBayesian inference. Behavioral and Brain Sciences, 24, 629–641.
Tulving, E. (1985). Memory and consciousness. Canadian Psychology, 26,1–12.
Wagenmakers, E.-J., Ratcliff, R., Gomez, P., & Iverson, G. J. (2004).Assessing model mimicry using the parametric bootstrap. Journal ofMathematical Psychology, 48, 28–50.
Wickelgren, W. A. (1968). Unidimensional strength theory and componentanalysis of noise in absolute and comparative judgments. Journal ofMathematical Psychology, 5, 102–122.
Wixted, J. T., & Stretch, V. (2004). In defense of the signal-detectioninterpretation of remember/know judgments. Psychonomic Bulletin &Review, 11, 616–641.
Received February 21, 2009Revision received May 15, 2009
Accepted May 19, 2009 �
1330 ROTELLO AND HEIT