Embed Size (px)
Citation preview
MF
Aa
b
a
ARRAA
KMRBCBM
1
ttynmt
dsi
eT
J(C
0d
Journal of Membrane Science 365 (2010) 1–15
Contents lists available at ScienceDirect
Journal of Membrane Science
journa l homepage: www.e lsev ier .com/ locate /memsci
odeling the effect of biofilm formation on reverse osmosis performance:lux, feed channel pressure drop and solute passage
.I. Radua,b,∗, J.S. Vrouwenveldera,b, M.C.M. van Loosdrechta, C. Picioreanua
Department of Biotechnology, Faculty of Applied Sciences, Delft University of Technology, Julianalaan 67, 2628 BC Delft, The NetherlandsWetsus, Centre of Excellence for Sustainable Water Technology, Agora 1, P.O. Box 1113, 8900 CC Leeuwarden, The Netherlands
r t i c l e i n f o
rticle history:eceived 21 May 2010eceived in revised form 16 July 2010ccepted 22 July 2010vailable online 30 July 2010
eywords:athematical model
everse osmosisiofilmoncentration polarization
a b s t r a c t
A two-dimensional (2-d) mathematical model describing the effect of biofilm development on the perfor-mance of a spiral-wound reverse osmosis (RO) membrane device was developed. The micro-scale modelcombines hydrodynamics and mass transport of solutes (salt and substrate) with biomass attachment,biofilm growth and detachment due to mechanical stress induced by liquid flow in the feed channel. Themodel explains several experimental observations when operating at constant pressure: loss of perme-ate flux with increased salt passage in time and achievement of a quasi-steady state flux and biomassamount. The model also shows how the local balance between biofilm growth and detachment leads toirregular biofilm distribution in the feed channel and suggests places where most biomass accumulationis expected. Numerical simulations were performed in configurations without spacer or with differentspacer geometries (submerged, cavity and zigzag). Three mechanisms were identified by which biofilms
iofoulingembrane performance
on RO membranes contribute to performance loss: (i) biofilm-enhanced concentration polarization; (ii)increased hydraulic resistance to trans-membrane flow; and (iii) increased feed channel pressure drop.For seawater and brackish water desalination, biofilm-enhanced concentration polarization appears toaffect most the local flux. This modeling approach, combining computational fluid dynamics (CFD) withbiofilm models allows a systematic study of biofouling in membrane systems. Moreover the approach isuseful for improving feed spacer design and to evaluate operational conditions for minimum biofouling
nofil
of reverse osmosis and na. Introduction
The scarce availability of clean water in certain areas has ledo an increased interest for fresh water production via desalina-ion of brackish and seawater or, e.g., treated wastewater. In recentears, reverse osmosis (RO) has become the leading global tech-ology to desalinate water because of the significant progress inembrane technology and the advantages RO offers compared to
hermal desalination techniques [1,2].
From brackish water, with salinity between fresh and seawater,rinking water can be produced at lower energy costs than fromeawater. For this reason, most of the desalination plants use brack-sh water as feed [3]. Main limitations for RO use in desalination
∗ Corresponding author at: Department of Biotechnology, Faculty of Applied Sci-nces, Delft University of Technology, Julianalaan 67, 2628 BC Delft, The Netherlands.el.: +31 15 2781482; fax: +31 15 2782355.
E-mail addresses: [email protected] (A.I. Radu),[email protected], [email protected]. Vrouwenvelder), [email protected] (M.C.M. van Loosdrecht),[email protected] (C. Picioreanu).
376-7388/$ – see front matter © 2010 Elsevier B.V. All rights reserved.oi:10.1016/j.memsci.2010.07.036
tration (NF) membrane devices.© 2010 Elsevier B.V. All rights reserved.
are high-energy consumption and strong tendency to membranefouling [4]. Several forms of fouling were recognized: (i) mineralscaling (salt precipitation from supersaturated solutions), (ii) col-loidal fouling (cake formation by suspended particles), (iii) organicfouling (due to the presence of natural organic matter) and (iv)biofouling (accumulation of biomass over a tolerable amount dueto growth of microbial films – called biofilms). Most often theseforms of fouling influence each other and do not occur indepen-dently. While scaling and colloidal fouling can be prevented withadequate water pretreatment, biofouling remains a major concernin RO membrane plant operation [5,6]. Biofouling affects not onlythe quantity (declined permeate flux) and quality (increased saltpassage) of produced water, but also the associated operationalcosts by increased pressure drop over the feed channel [7].
The way biofouling deteriorates the membrane process perfor-mance has been studied mainly experimentally. Multiple causeswere identified: additional hydraulic resistance for the trans-
membrane flow [8], biofilm-enhanced concentration polarization[9,10] and increased feed channel pressure drop [11].As the membrane is permeable for water but it rejects most ofthe solute, a thin layer of concentrated solutes termed concentra-tion polarization (CP) layer forms near the membrane surface. The

2 embra
CimiDsspfiicu
cbarbouspiosbrd
flo[nmwfpoRa
ctoadgtphcdabc
2
cmwttfl
A.I. Radu et al. / Journal of M
P layer substantially decreases the permeation driving force byncreasing the osmotic pressure at the membrane surface. Direct
easurements of solute gradients near the membrane are limited,n spite of several techniques available for in situ monitoring [12].ue to difficulties in measuring the CP layers for reverse osmo-
is membranes, this issue has been mainly addressed by modelingtudies [13,14]. With the exception of Chong et al. [10], none of theroposed models explicitly included biofilm presence. The classicallm theory can provide a quick estimate for concentration polar-
zation in open channels (no spacers, no biofilms), but for moreomplex geometries (i.e., containing spacers or geometrically irreg-lar biofilms) a numerical approach is needed [15].
Herzberg and Elimelech [9] suggested that the biofilm couldontribute to an enhanced concentration polarization by hinderingack diffusion of salts to the bulk liquid. Kim et al. [16] presentedn analytical model for solute transport within the biofilm. Theiresults indicated that the EPS may be important in hindering theack diffusion of solutes from the membrane surface. The workf Chong et al. [10] gave a measurement of the average CP value,sing a tracer technique. In addition, they attempted to create aimple model to predict the membrane system performance in theresence of homogeneous and constant thickness biofilms cover-
ng the membrane. This situation may only occur in the absencef a feed channel spacer, whereas in field applications where thepacer is needed to separate the membrane leaves, a more “patchy”iofilm forms [11,17]. Therefore, the development of a more elabo-ate model in two or three spatial dimensions is needed for a betterescription of experimental observations.
The recent development of sophisticated CFD (computationaluid dynamics) packages enabled three-dimensional (3-d) studiesf the influence of spacer geometry on the flow and mass transfer18–22]. However, the effect of biofilm growth on the hydrody-amics has only recently been incorporated in a three-dimensionalodel of biofouling in RO systems [23] and qualitatively comparedith experimental data [24,25]. In these studies, the membrane
ouling simulator was operated without permeation, so the CPhenomenon could not be addressed. Moreover, the influencef biofilm growth on flux decline and solute rejection in anO system has not been systematically evaluated by numericalpproaches.
The objective of this work was to develop, based on first prin-iples, a spatially two-dimensional (2-d) numerical model to studyhe dynamics of global and local impact of biofouling in a reversesmosis membrane device. The model describes: (i) the flux lossnd (ii) pressure drop increase in time, and (iii) the salt rejectionecline, as a result of a growing biofilm with different feed spacereometries, for brackish water desalination. We also investigatedhe local consequences of biofilm development on the membraneerformance. In particular, the relative contributions of biofilmydraulic resistance to trans-membrane flow, biofilm-enhancedoncentration polarization and increased feed channel pressurerop were evaluated. The numerical approach can be useful, as itllows uncoupling of several phenomena and contributes thus to aetter understanding of the mechanisms through which the biofilman affect membrane system performance.
. Model development
In this study we build up a numerical model and investigate byomputer simulations the role of biofilms in the decrease of perfor-
ance of spiral-wound reverse osmosis membrane devices. Herebye focus on application to brackish water desalination. However,he model is also relevant for other reverse osmosis and nanofil-ration applications. The model includes two-dimensional liquidow through the feed channel and permeable membranes, cou-
ne Science 365 (2010) 1–15
pled with the mass transport of solutes, together with the biofilmdevelopment.
2.1. Model geometry
Previous studies have shown that a fully three-dimensional (3-d) description of flow and mass transport is needed to have a correctquantitative representation of the process [23,24]. However, 3-dmodels including concentration polarization in complex geometryand biofilm growth in time would currently be computationallyvery demanding. Because steep concentration gradients near themembrane surface must be calculated on a very fine mesh, largenumber of variables, large memory and relatively long comput-ing times are needed. We believe therefore that a two-dimensional(2-d) model is a good initial compromise between the calculationtime and model realism. It is usually accepted that 2-d calculationscan be a screening device for future evaluations of more complexgeometries and, at the same time, allow the effect of numericalparameters and modeling assumptions to be studied [26].
Although not completely realistic, the two-dimensional geome-try can still provide useful approximations in some particular cases.For instance, slices cut through a woven spacer in ladder config-uration (Fig. 1A) lead to 2-d geometry known as “zigzag spacer”(Fig. 1B) [26,27]. Another studied configuration [26] is the “cavityspacer” (Fig. 1B) resulted from a cut through the non-woven lad-der spacer (Fig. 1C). A slice cut through a spacer having the axialfilaments thicker than the transverse filaments (Fig. 1E) can lead tothe 2-d geometry known as “submerged spacer” (Fig. 1F). These arejust a few examples, as other spacers used in practice or reportedin the literature could also be approximated by one of these sim-plified 2-d geometries. The validity of the 2-d approximation forsome cases was discussed in [28]. In addition to these configura-tions with spacer, the empty channel (i.e., channel without spacer)was also evaluated in simulations presented in this paper.
An example of model geometry is shown in Fig. 2, for the sub-merged spacer case. The geometrical characteristics chosen forthis study are representative in practice in the case of spiral-wound reverse osmosis processes [11,24,26]. The channel heightis LY = 1 mm. The length of the modeled channel (LX = 15 mm) issmall compared to the membrane module used in practice. Theeffect of the curvature of the module is neglected, as some studieshave emphasized that fluid dynamics is not significantly differentin flat and curved channels [18,29], while others suggest possi-ble influences [30]. The spacer filament diameter ds is chosen sothat ds/LY = 0.5; the distance between two consecutive filaments Ls
equals 4 times the channel height. In the computational domain, nospacers were placed near the liquid inlet or outlet to ensure a fullydeveloped flow upstream the spacer array and to avoid the out-let interference with the flow recirculation regions after the lastspacer filament. We consider for computational convenience thewhole domain � divided into two sub-domains: biofilm �B andbulk liquid �L.
2.2. Model equations
2.2.1. Fluid flowDue to the geometrical complexity when including spacers
in the channel and especially when irregularly shaped biofilmsdevelop, the flow pattern in the liquid sub-domain �L must be cal-culated directly from the incompressible Navier–Stokes equations,for laminar regime:
�(u · ∇)u + ∇p = ∇ · (�∇u)∇ · u = 0
(1)
where u is the vector of local liquid velocity (with u and v thevelocity components tangential and normal on the membrane,

A.I. Radu et al. / Journal of Membrane Science 365 (2010) 1–15 3
Fcc
rli(i
ia
Fig. 2. Computational domain and finite element mesh. (A) Illustration of the com-putational domain of size LX × LY. For numerical reasons, liquid (�L) and biofilm
ig. 1. Schematic view of spacer configurations. (A) 3-d woven-like spacer; (B) 2-dross-section: zigzag spacer; (C) 3-d spaghetti-like spacer; (D) 2-d cross-section:avity spacer; (E) 3-d middle-layer spacer; (F) 2-d cross-section: submerged spacer.
espectively), p is the pressure, � is the liquid density and � is theiquid dynamic viscosity. The assumption of a steady-state lam-nar flow is justified at the Re numbers used in the simulations
Re ≈ 160). At higher Re, unsteady flows would develop, as shownn [31].For the flow calculations, the biofilm sub-domain �B was assim-lated with a porous medium, having a permeability � = 10−16 m2
nd a porosity ε = 0.8. Brinkman flow was assumed through the
(�B) sub-domains are explicitly defined. (B) Detail of the finite element mesh usedto solve the hydrodynamics and mass transport equations. The mesh size of 5 �m onthe boundaries was increased towards the bulk liquid up to a maximum of 30 �m.Geometry dimensions are in Table 1.
biofilm [32]:
�
�u + ∇p = 1
ε
[� · ∇2u −
(2�
3− �
)(∇ · u)
]∇ · u = 0
(2)
The dependence of different physical parameters (i.e., liquid vis-cosity and density) of solute concentrations needs to be consideredin both sub-domains (see Table 1), as the salt concentration nearthe membrane can reach values up to 2–5 times higher than in thebulk liquid. This necessity was underlined by the work of Lyster andCohen [14]. Consequently, the flow velocity is also influenced by thelocal concentration of salt, which in turn is altered by the hydrody-namics (because the flow determines the convective transport ofsalt).
At the inlet (x = 0) a fully developed laminar velocity profile(parabolic) is specified with an average velocity, uin = 0.1 m s−1,value kept constant in time. The liquid velocity through the mem-brane is the velocity component v (normal to the membrane), whichtakes variable values at different positions x along the membranelength. At the membrane surface, the tangential velocity u is set tozero. This results in the following boundary conditions on the lowermembrane:
u(x, 0) = 0v(x, 0) = −LP(�p − ��)
(3)
and on the upper membrane:
u(x, LY) = 0v(x, LY) = LP(�p − ��)
(4)
The local permeate flux, v, is proportional with the trans-membrane pressure �p (or TMP), counteracted by the osmoticpressure �� created by the concentration polarization. The propor-tionality coefficient is the membrane permeability LP. The local TMPis defined as the difference between the local pressure on the feedside on the membrane and an assumed constant permeate pres-sure pP = 1 bar (100 kPa), so that �p = p(x, 0) − pP or p(x, LY) − pP.
The osmotic pressure difference is proportional (osmotic coeffi-cient B) to the salt concentration difference on the two sides of themembrane: �� = B (C(x, 0) − CP) or B (C(x, LY) − CP). For numericalstability reasons, transition zones were created near inlet (x = [0,0.02·LX]) and outlet (x = [0.98·LX, LX]), where the membrane per-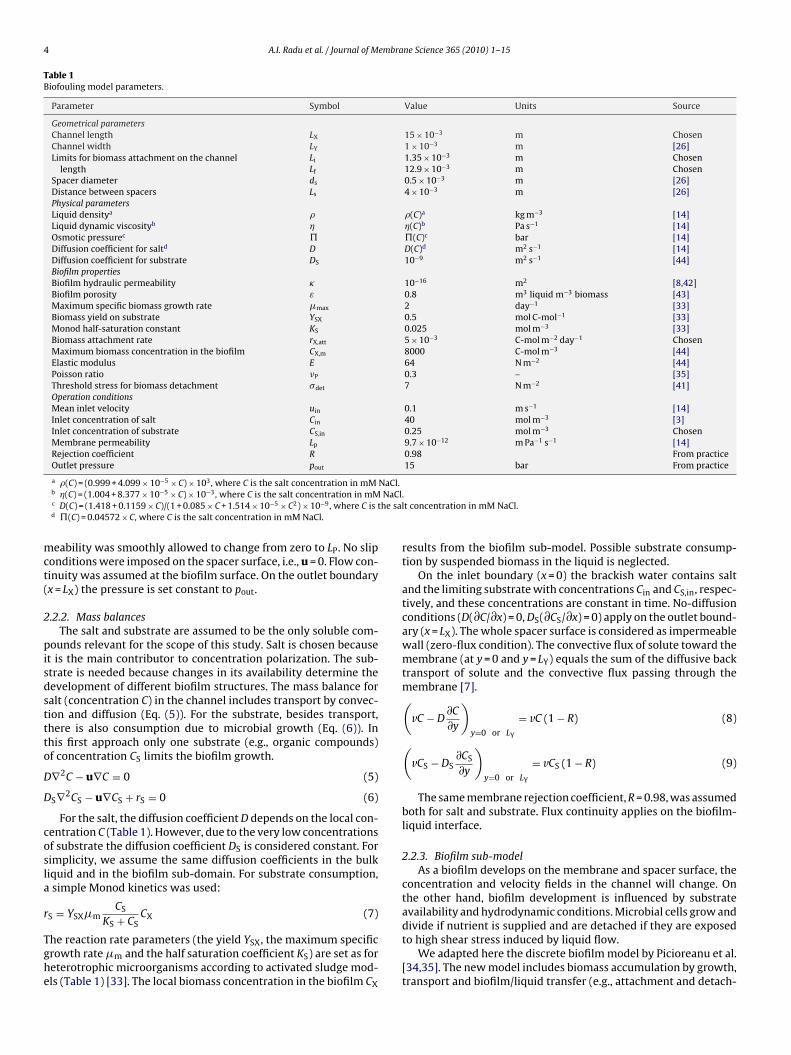
4 A.I. Radu et al. / Journal of Membrane Science 365 (2010) 1–15
Table 1Biofouling model parameters.
Parameter Symbol Value Units Source
Geometrical parametersChannel length LX 15 × 10−3 m ChosenChannel width LY 1 × 10⁻³ m [26]Limits for biomass attachment on the channel
lengthLi 1.35 × 10⁻³ m ChosenLf 12.9 × 10⁻³ m Chosen
Spacer diameter ds 0.5 × 10⁻³ m [26]Distance between spacers Ls 4 × 10⁻³ m [26]Physical parametersLiquid densitya � �(C)a kg m−3 [14]Liquid dynamic viscosityb � �(C)b Pa s−1 [14]Osmotic pressurec (C)c bar [14]Diffusion coefficient for saltd D D(C)d m2 s−1 [14]Diffusion coefficient for substrate DS 10−9 m2 s−1 [44]Biofilm propertiesBiofilm hydraulic permeability � 10−16 m2 [8,42]Biofilm porosity ε 0.8 m3 liquid m−3 biomass [43]Maximum specific biomass growth rate max 2 day−1 [33]Biomass yield on substrate YSX 0.5 mol C-mol−1 [33]Monod half-saturation constant KS 0.025 mol m−3 [33]Biomass attachment rate rX,att 5 × 10⁻³ C-mol m−2 day−1 ChosenMaximum biomass concentration in the biofilm CX,m 8000 C-mol m−3 [44]Elastic modulus E 64 N m−2 [44]Poisson ratio �P 0.3 – [35]Threshold stress for biomass detachment �det 7 N m−2 [41]Operation conditionsMean inlet velocity uin 0.1 m s−1 [14]Inlet concentration of salt Cin 40 mol m−3 [3]Inlet concentration of substrate CS,in 0.25 mol m−3 ChosenMembrane permeability Lp 9.7 × 10⁻¹² m Pa−1 s−1 [14]Rejection coefficient R 0.98 From practiceOutlet pressure pout 15 bar From practice
NaCl.NaClhe sal
mct(
2
pisdsttto
D
D
cosla
r
Tghe
a �(C) = (0.999 + 4.099 × 10⁻⁵ × C) × 103, where C is the salt concentration in mMb �(C) = (1.004 + 8.377 × 10⁻⁵ × C) × 10−3, where C is the salt concentration in mMc D(C) = (1.418 + 0.1159 × C)/(1 + 0.085 × C + 1.514 × 10⁻⁵ × C2) × 10−9, where C is td (C) = 0.04572 × C, where C is the salt concentration in mM NaCl.
eability was smoothly allowed to change from zero to LP. No sliponditions were imposed on the spacer surface, i.e., u = 0. Flow con-inuity was assumed at the biofilm surface. On the outlet boundaryx = LX) the pressure is set constant to pout.
.2.2. Mass balancesThe salt and substrate are assumed to be the only soluble com-
ounds relevant for the scope of this study. Salt is chosen becauset is the main contributor to concentration polarization. The sub-trate is needed because changes in its availability determine theevelopment of different biofilm structures. The mass balance foralt (concentration C) in the channel includes transport by convec-ion and diffusion (Eq. (5)). For the substrate, besides transport,here is also consumption due to microbial growth (Eq. (6)). Inhis first approach only one substrate (e.g., organic compounds)f concentration CS limits the biofilm growth.
∇2C − u∇C = 0 (5)
S∇2CS − u∇CS + rS = 0 (6)
For the salt, the diffusion coefficient D depends on the local con-entration C (Table 1). However, due to the very low concentrationsf substrate the diffusion coefficient DS is considered constant. Forimplicity, we assume the same diffusion coefficients in the bulkiquid and in the biofilm sub-domain. For substrate consumption,simple Monod kinetics was used:
S = YSXmCS CX (7)
KS + CS
he reaction rate parameters (the yield YSX, the maximum specificrowth rate m and the half saturation coefficient KS) are set as foreterotrophic microorganisms according to activated sludge mod-ls (Table 1) [33]. The local biomass concentration in the biofilm CX
.t concentration in mM NaCl.
results from the biofilm sub-model. Possible substrate consump-tion by suspended biomass in the liquid is neglected.
On the inlet boundary (x = 0) the brackish water contains saltand the limiting substrate with concentrations Cin and CS,in, respec-tively, and these concentrations are constant in time. No-diffusionconditions (D(∂C/∂x) = 0, DS(∂CS/∂x) = 0) apply on the outlet bound-ary (x = LX). The whole spacer surface is considered as impermeablewall (zero-flux condition). The convective flux of solute toward themembrane (at y = 0 and y = LY) equals the sum of the diffusive backtransport of solute and the convective flux passing through themembrane [7].(
vC − D∂C
∂y
)y=0 or LY
= vC (1 − R) (8)
(vCS − DS
∂CS
∂y
)y=0 or LY
= vCS (1 − R) (9)
The same membrane rejection coefficient, R = 0.98, was assumedboth for salt and substrate. Flux continuity applies on the biofilm-liquid interface.
2.2.3. Biofilm sub-modelAs a biofilm develops on the membrane and spacer surface, the
concentration and velocity fields in the channel will change. Onthe other hand, biofilm development is influenced by substrateavailability and hydrodynamic conditions. Microbial cells grow and
divide if nutrient is supplied and are detached if they are exposedto high shear stress induced by liquid flow.We adapted here the discrete biofilm model by Picioreanu et al.[34,35]. The new model includes biomass accumulation by growth,transport and biofilm/liquid transfer (e.g., attachment and detach-
embra
motCmc
rmbsb
br
cttbi1
tsi
i[bs(Tmi
Vtb(batsbot
2
b4apmretfsat
A.I. Radu et al. / Journal of M
ent). In this approach, the whole computational space is dividedn a grid of square elements. In the biofilm domain the squares con-ain biomass with a concentration CX, whereas in the liquid spaceX = 0. The interface between the bulk liquid and the biofilm is aoving boundary, resulting from biomass growth and transport,
oupled with attachment and detachment processes.Biomass attachment is included here with a constant rate of
X,att = 5 × 10⁻³ (C-mol biomass) (m−2 module) day−1. For theodel solution this is equivalent to 5 grid elements containing
iomass newly added each hour. The attachment place is cho-en randomly: on the membranes, on the spacers and on existingiofilm colonies.
Biomass growth occurs in each square element containingiofilm with the rate rX correlated to the substrate consumptionate (Eq. (7)):
dCX
dt= rX = m
CS
KS + CSCX (10)
It was assumed that the osmotic stress (caused by high salt con-entrations) does not inhibit biomass growth. If natural selectionakes place, only microbial strains resistant to high salt concen-ration will grow in the channel. In addition, it has been provedy Chong et al. [10] that the viability of certain bacterial strains
s not affected by high concentrations of sodium chloride (up to0,000 ppm).
Biomass transport takes place when the local biomass concentra-ion exceeds a critical value CX,m. The redistribution of biomass inpace is performed using the cellular automata algorithm describedn [34].
Biomass detachment is based on internal stress created by mov-ng liquid past the biofilm. The model was described in detail in35], thus only the main assumptions will be presented here. Theiofilm is considered a solid elastic material in a state of planetress (because of the 2-d geometry). After solving the liquid flowEqs. (1) and (2)), the load forces on the biofilm surface are known.he biofilm-membrane and biofilm-spacer interfaces are fixed (noovement). The plane stress equations are solved for the mechan-
cal stress � (see [36]).Biofilm breakage was considered to occur when the calculated
on Mises stress � [36] in a certain biomass element is higher than ahreshold stress �det corresponding to the cohesive strength of theiofilm. In this stage, detachment means that all biomass elementssquares) where � > �det are removed from the biofilm, their placeeing taken by liquid. We assume that detached biofilm patchesre quickly taken away by the flow and washed out from the sys-em (i.e., no filtration effect taken into account). This detachmenttage resembles biofilm erosion. In a second stage, all suspendediomass (i.e., no longer connected to a solid surface – either biofilmr membrane or spacer) is also removed in a process resemblinghe biofilm sloughing.
.3. Model parameters
For the case study reported in this work conditions applicable torackish water desalination were chosen: inlet salt concentration0 mM NaCl [3], operating pressure set to 15 bar in the outlet [3],verage inlet flow velocity of 0.1 m s−1 [10,11,14], and a membraneermeability of 9.7 × 10⁻¹² m Pa−1 s−1 [14]. The salt and substrateembrane rejection coefficients were set to 0.98, which is in the
ange of values reported in the literature for RO processes [3]. Theffect of different rejection coefficients, different salt concentra-
ions and operation pressures on biofouling will be investigated inuture studies. A relatively high value for the concentration of sub-trate in the inlet was deliberately chosen (0.25 mM), in order tochieve substantial biomass accumulation over a short period ofime (strategy used also in several experimental studies on mem-ne Science 365 (2010) 1–15 5
brane biofouling [9,37,38]). Physical properties (�, �, and D) werea function of salt concentration, according to the expressions pro-posed in [14]. A constant value for the substrate diffusivity DS wasassumed, similar to the diffusion coefficient for acetate [44].
While operational conditions and the liquid and solute phys-ical parameters are rather well characterized, the biofilm-relatedparameters are in general less known and reliable. Typical bioki-netic parameters (max, KS, YSX) and biofilm biomass density(CX,m) were selected as for heterotrophic microorganisms (cf. acti-vated sludge models, [33,44]). Biofilm permeability is an importantparameter, not very well characterized experimentally yet. Val-ues in the order of 10−15 m2 are currently accepted for bacterialcell cakes, while the extracellular polymeric substances (EPS-likegels) are less permeable, e.g., 10−16 to 10−17 m2 [8,39]. The valueassumed here (10−16) corresponds to a biofilm matrix containingbacterial cells and EPS [8]. Biofilm mechanical properties (E and�P) cannot be easily measured so we chose values according toPicioreanu et al. [35]. Biofilm detachment is still a subject of ongo-ing research [40]. The value selected for the threshold stress fordetachment is in the range of values reported in [41]. Finally, aconstant biomass attachment rate was chosen for inoculation, suf-ficiently high to ensure that the biomass is not completely removedin the initial biofilm formation stage. However, in our simulations,in later biofilm phases the chosen attachment rate has no significantinfluence on the overall biomass accumulation in the system.
2.4. Model solution
The model was solved by combining MATLAB (MATLAB 2008b,Mathworks, Natick, MA, www.mathworks.com) code with thefinite element method implemented in COMSOL Multiphysics(COMSOL 3.5a, Comsol Inc, Burlington, MA, www.comsol.com).Own Java code was used for the cellular automata biofilm model.The main steps of the algorithm are presented in Fig. 3.
The first section of the MATLAB framework defines the modelinput parameters and the feed channel geometry with or withoutspacers. In the second section, the model equations with corre-sponding boundary conditions are defined and solved at differenttimes, corresponding to different biofilm structures. The biofilmstructure develops in a time loop, determined by the local sub-strate availability and hydrodynamic conditions (the chosen timestep was �t = 2 h). A sequential approach was used (Fig. 3) basedon the assumption that a time scale separation of hydrodynam-ics, mass transport and biomass growth can be considered whencharacterizing biofilm development [46].
At any time t the following sequence of calculations was used:
(a) The liquid and biofilm sub-domains are defined, together withthe model equations and the boundary conditions for the cur-rent geometry. For this, the following COMSOL applicationmodes were constructed: (i) incompressible Navier–Stokes formomentum transport, (ii) convection and diffusion for masstransport of salt and substrate and (iii) plane stress for detach-ment.
(b) The finite element mesh is created according to the specifica-tions for maximum element size in the sub-domain and on themembrane boundaries. As stated in previous studies [14,47], anon-uniform mesh is needed to obtain accurate solutions formass transfer due to high concentration gradients near themembrane. Preliminary simulations established that a mini-mum mesh size of 5 �m on the membrane surface is sufficient
for mesh convergence. The mesh size is increased towards thebulk liquid up to a maximum of 30 �m. An example of finiteelement mesh used for calculations is illustrated in Fig. 2B.Because the mesh is re-created at each iteration (as thebiofilm geometry changes), the number of finite elements
6 A.I. Radu et al. / Journal of Membra
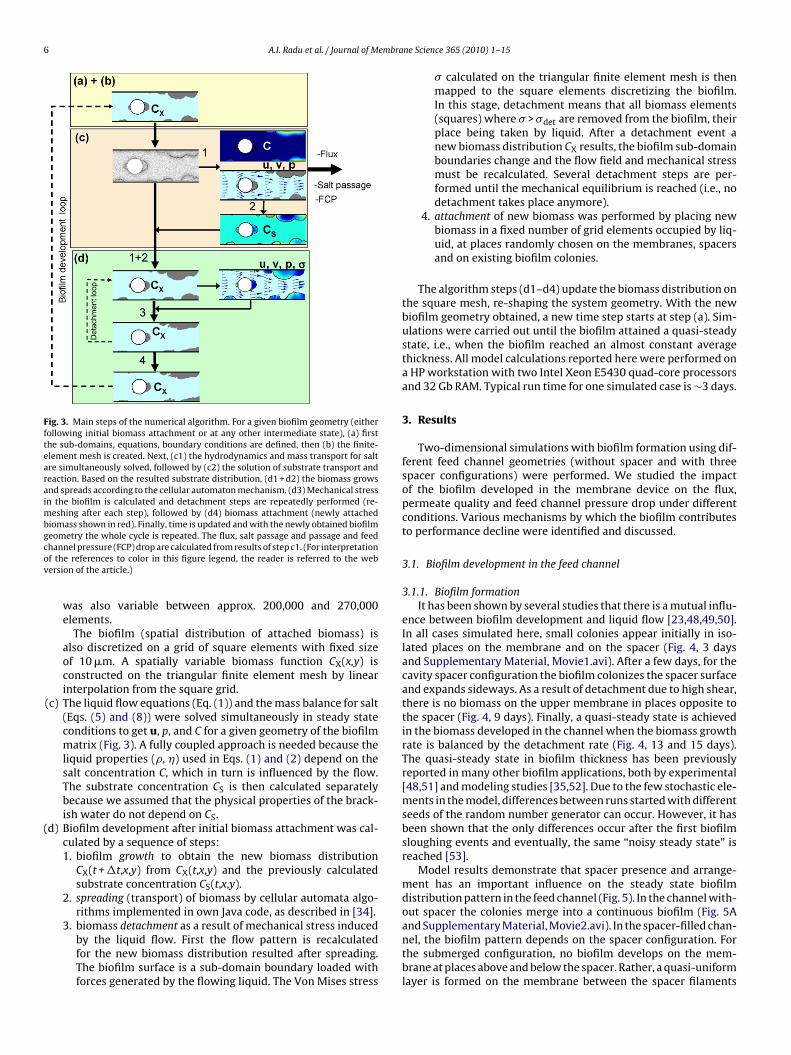
Fig. 3. Main steps of the numerical algorithm. For a given biofilm geometry (eitherfollowing initial biomass attachment or at any other intermediate state), (a) firstthe sub-domains, equations, boundary conditions are defined, then (b) the finite-element mesh is created. Next, (c1) the hydrodynamics and mass transport for saltare simultaneously solved, followed by (c2) the solution of substrate transport andreaction. Based on the resulted substrate distribution, (d1 + d2) the biomass growsand spreads according to the cellular automaton mechanism. (d3) Mechanical stressin the biofilm is calculated and detachment steps are repeatedly performed (re-meshing after each step), followed by (d4) biomass attachment (newly attachedbiomass shown in red). Finally, time is updated and with the newly obtained biofilmgcov
(
and Supplementary Material, Movie2.avi). In the spacer-filled chan-
eometry the whole cycle is repeated. The flux, salt passage and passage and feedhannel pressure (FCP) drop are calculated from results of step c1. (For interpretationf the references to color in this figure legend, the reader is referred to the webersion of the article.)
was also variable between approx. 200,000 and 270,000elements.
The biofilm (spatial distribution of attached biomass) isalso discretized on a grid of square elements with fixed sizeof 10 �m. A spatially variable biomass function CX(x,y) isconstructed on the triangular finite element mesh by linearinterpolation from the square grid.
(c) The liquid flow equations (Eq. (1)) and the mass balance for salt(Eqs. (5) and (8)) were solved simultaneously in steady stateconditions to get u, p, and C for a given geometry of the biofilmmatrix (Fig. 3). A fully coupled approach is needed because theliquid properties (�, �) used in Eqs. (1) and (2) depend on thesalt concentration C, which in turn is influenced by the flow.The substrate concentration CS is then calculated separatelybecause we assumed that the physical properties of the brack-ish water do not depend on CS.
d) Biofilm development after initial biomass attachment was cal-culated by a sequence of steps:1. biofilm growth to obtain the new biomass distribution
CX(t + �t,x,y) from CX(t,x,y) and the previously calculatedsubstrate concentration CS(t,x,y).
2. spreading (transport) of biomass by cellular automata algo-rithms implemented in own Java code, as described in [34].
3. biomass detachment as a result of mechanical stress induced
by the liquid flow. First the flow pattern is recalculatedfor the new biomass distribution resulted after spreading.The biofilm surface is a sub-domain boundary loaded withforces generated by the flowing liquid. The Von Mises stressne Science 365 (2010) 1–15
� calculated on the triangular finite element mesh is thenmapped to the square elements discretizing the biofilm.In this stage, detachment means that all biomass elements(squares) where � > �det are removed from the biofilm, theirplace being taken by liquid. After a detachment event anew biomass distribution CX results, the biofilm sub-domainboundaries change and the flow field and mechanical stressmust be recalculated. Several detachment steps are per-formed until the mechanical equilibrium is reached (i.e., nodetachment takes place anymore).
4. attachment of new biomass was performed by placing newbiomass in a fixed number of grid elements occupied by liq-uid, at places randomly chosen on the membranes, spacersand on existing biofilm colonies.
The algorithm steps (d1–d4) update the biomass distribution onthe square mesh, re-shaping the system geometry. With the newbiofilm geometry obtained, a new time step starts at step (a). Sim-ulations were carried out until the biofilm attained a quasi-steadystate, i.e., when the biofilm reached an almost constant averagethickness. All model calculations reported here were performed ona HP workstation with two Intel Xeon E5430 quad-core processorsand 32 Gb RAM. Typical run time for one simulated case is ∼3 days.
3. Results
Two-dimensional simulations with biofilm formation using dif-ferent feed channel geometries (without spacer and with threespacer configurations) were performed. We studied the impactof the biofilm developed in the membrane device on the flux,permeate quality and feed channel pressure drop under differentconditions. Various mechanisms by which the biofilm contributesto performance decline were identified and discussed.
3.1. Biofilm development in the feed channel
3.1.1. Biofilm formationIt has been shown by several studies that there is a mutual influ-
ence between biofilm development and liquid flow [23,48,49,50].In all cases simulated here, small colonies appear initially in iso-lated places on the membrane and on the spacer (Fig. 4, 3 daysand Supplementary Material, Movie1.avi). After a few days, for thecavity spacer configuration the biofilm colonizes the spacer surfaceand expands sideways. As a result of detachment due to high shear,there is no biomass on the upper membrane in places opposite tothe spacer (Fig. 4, 9 days). Finally, a quasi-steady state is achievedin the biomass developed in the channel when the biomass growthrate is balanced by the detachment rate (Fig. 4, 13 and 15 days).The quasi-steady state in biofilm thickness has been previouslyreported in many other biofilm applications, both by experimental[48,51] and modeling studies [35,52]. Due to the few stochastic ele-ments in the model, differences between runs started with differentseeds of the random number generator can occur. However, it hasbeen shown that the only differences occur after the first biofilmsloughing events and eventually, the same “noisy steady state” isreached [53].
Model results demonstrate that spacer presence and arrange-ment has an important influence on the steady state biofilmdistribution pattern in the feed channel (Fig. 5). In the channel with-out spacer the colonies merge into a continuous biofilm (Fig. 5A
nel, the biofilm pattern depends on the spacer configuration. Forthe submerged configuration, no biofilm develops on the mem-brane at places above and below the spacer. Rather, a quasi-uniformlayer is formed on the membrane between the spacer filaments

A.I. Radu et al. / Journal of Membrane Science 365 (2010) 1–15 7
F with cs locitym Materr
(ttHbra[csMms
3
sdtcsbiblssmtF
Fstfi
ig. 4. Simulated biofilm development in time and streamlines in the feed channelupported by spacers (white circles). Streamlines colors change with the liquid vem. For the full biofilm development in time, see Movie1.avi from Supplementary
eferred to the web version of the article.)
Fig. 5B and Supplementary Material, Movie3.avi). Interestingly, inhis configuration, streamer-like biofilms start developing behindhe filaments, resembling structures observed experimentally [24].owever, in the simulations these streamers easily break off,ecause in the model the biofilm is considered a brittle material. Ineality, the biofilm behaves closely to a viscoelastic material [54]llowing vibrations without breaking ([45] experimental work;55] theoretical model). The biofilm formation in zigzag and cavityonfigurations shows similar tendencies (Fig. 5C and D): the biofilmeems to be held together by the spacer filaments (Supplementaryaterial, Movie4.avi). This shielding effect leads to significantlyore biomass in zigzag and cavity configurations compared to the
ubmerged spacer.
.1.2. Substrate distributionBiofilm development is mainly determined by two factors:
ubstrate availability which influences biomass growth and hydro-ynamic conditions which affect biomass detachment (in additiono substrate transport). Fig. 6A shows the substrate distributionorresponding to a biofilm structure at t = 8 days. In this stage,ubstrate depletion occurs in all the colonies situated on the mem-rane or on the spacer. On the contrary, the substrate concentration
s higher on the membrane than in the bulk liquid in places withoutiofilm (Fig. 6B – zoom – see concentration profile I next to the
ower membrane, y = 0). This clearly demonstrates that the rejected
ubstrate accumulates at the membrane surface (i.e., forming aubstrate polarization layer). It should be noticed that the smallericrobial colonies benefit from a high substrate concentration inheir vicinity: compare upper and lower colonies along line I inig. 6B and the substrate profiles along line I in Fig. 6C. As biofilm
ig. 5. Compared biofilm distributions and velocity vector plots for different feed channelpacers; (C) channel with zigzag spacer; (D) channel with cavity spacers. The yellow areashe biofilm development in time in Movie1.avi, Movie2.avi, Movie3.avi and Movie4.avi fgure legend, the reader is referred to the web version of the article.)
avity spacers. The biofilm (yellow areas) develops mainly on the lower membrane,from dark blue (minimum, close to 0) to red (maximum, 0.28 m/s). Axes labels inial. (For interpretation of the references to color in this figure legend, the reader is
thickness increases, the overall substrate consumption rate willdominate over the substrate accumulation due to polarization, sothat the substrate levels next to the biofilm-liquid interface willbe lower than in the bulk. Most of the biofilm is substrate-limited,so that growth occurs only in a thin outer layer (the “activelayer”).
3.1.3. Biomass detachmentThe biofilm detachment is based on shear stress calculations.
Fig. 7 illustrates the evolution of stress in a colony and the sub-sequent biofilm structure modifications because of detachment.The colony side frontally exposed to flow suffers from the higheststress and consequently will be removed first. High stress levelsappear also near the biofilm surface leading to gradual biofilmerosion. Eventually, the biofilm reaches a streamlined shape, withoverall lower levels of internal stress. This situation lasts onlya limited period of time because re-growth in the detachmentareas will again increase the biofilm thickness. Thicker biofilmslead to larger fluid velocity and consequently to increased shearforces, which will trigger new detachment events. Due to thissequence of events, when approaching the steady state, fluctu-ations in the total biomass amount can be noticed. These aremainly the result of massive detachment events, called sloughing.These trends were also described by other biofilm studies, bothexperimental [48,51] and theoretical [35]. As measurements of
biofilm mechanical properties (i.e., Poisson ratio, elastic modulus,critical strength for detachment) are difficult, scarce and contro-versial in literature, this semi-empirical detachment model can beregarded here only as an adequate method for balancing biofilmgrowth.geometries after 15 days. (A) Channel without spacers; (B) channel with submergedrepresent the biofilm and the white circles the spacer. Axes labels in mm. See also
rom Supplementary Material. (For interpretation of the references to color in this

8 A.I. Radu et al. / Journal of Membrane Science 365 (2010) 1–15
Fig. 6. Concentration polarization and consumption of substrate. (A) 2-d substrate concentration distribution in the channel at t = 8 days. Flow direction is from left to right.( as uso ny onm nt heix he rea
3
t
Fssssgalr
B) Detail of the substrate distribution in the channel. The same color scale as in (A) wn the y-direction showing: I (red line) – substrate consumption in a biofilm coloembrane; II (black line) – substrate consumption in two biofilm colonies of differe
= 11 mm (red). (For interpretation of the references to color in this figure legend, t
.2. Effect of biofouling on global membrane performance
Two main indicators for a membrane process performance arehe permeate flux and salt passage in permeate. We calculated the
ig. 7. Illustration of the mechanical stress (Von Misses) in a biofilm colony and theubsequent successive detachment events at times between 242 and 260 h. Mosttress is concentrated near the biofilm surface, leading to erosion: detachment ofmall biofilm surface pieces. Areas facing frontally the flow experience also hightress, leading to sloughing: fast detachment of larger biofilm chunks. Biofilm re-rowth after detachment is also visible. In this example, the biofilm at 260 h reachedhydrodynamic shape that is rather stable mechanically. Note: The color scale is
ogarithmic. (For interpretation of the references to color in this figure legend, theeader is referred to the web version of the article.)
ed, from dark blue (minimum) to red (maximum concentration). (C) Cross-sectionsthe upper membrane and substrate concentration polarization next to the lowerghts. The cross-sections are indicated by dashed lines in (B), at x = 9 mm (black) andder is referred to the web version of the article.)
average flux J (L m−2 h−1) by integrating the local permeate veloc-ity (v) over the length of which microbial attachment was allowed(between 9% and 86% of LX, i.e., Li and Lf, respectively) for both lowerand upper membranes:
J = 12(Lf − Li)
∫ Lf
Li
[−v(x, 0) + v(x, LY)] dx (11)
The salt passage is expressed by the average salt concentra-tion (mol m−3), calculated also by integration of salt flux across themembranes, divided by the total permeate flux:
C̄p =∫ Lf
Li[−v(x, 0)C(x, 0) + v(x, LY)C(x, LY)] (1 − R)dx∫ Lf
Li[−v(x, 0) + v(x, LY)] dx
(12)
3.2.1. Permeate fluxFor spacer-filled channels without biomass (e.g., at the initial
operation stage), the highest flux was obtained in the submergedspacer configuration (Fig. 8A). This observation is also supported byother modeling studies [30]. In reality, the axial filaments neglecteddue to the 2-d approximation will also affect the global permeateflux. In addition, the highest flux performance may also depend onthe distance between two consecutive spacer filaments [26]. In thecavity and zigzag configurations, the spacer is in contact with part ofthe membrane and recirculation areas with low velocity will form(Fig. 4). The permeate flux will therefore be reduced by a higherconcentration polarization [27]. The detailed effect of polarizationis explained in Section 3.3.
The average permeate flux values obtained from our simula-tions fall in the range of the values for full-scale brackish waterdesalination plants [3]. In the presence of a developing biofilm, thepermeate flux decline follows the same trend for empty and spacer-filled channels. In average, in all studied cases, a minor flux declineis observed in the first period (up to ∼3 days in the simulated con-ditions; Fig. 8A), when only small amounts of biomass are present
corresponding to an initial colonization phase (Fig. 8B). A secondphase follows with a sharp decrease of permeate flux, correlatedwith an increase of the biomass amount in the channel. Finally, aquasi-steady state is reached for the flux value, as well as for theaccumulated biomass. When approaching the steady state, fluctu-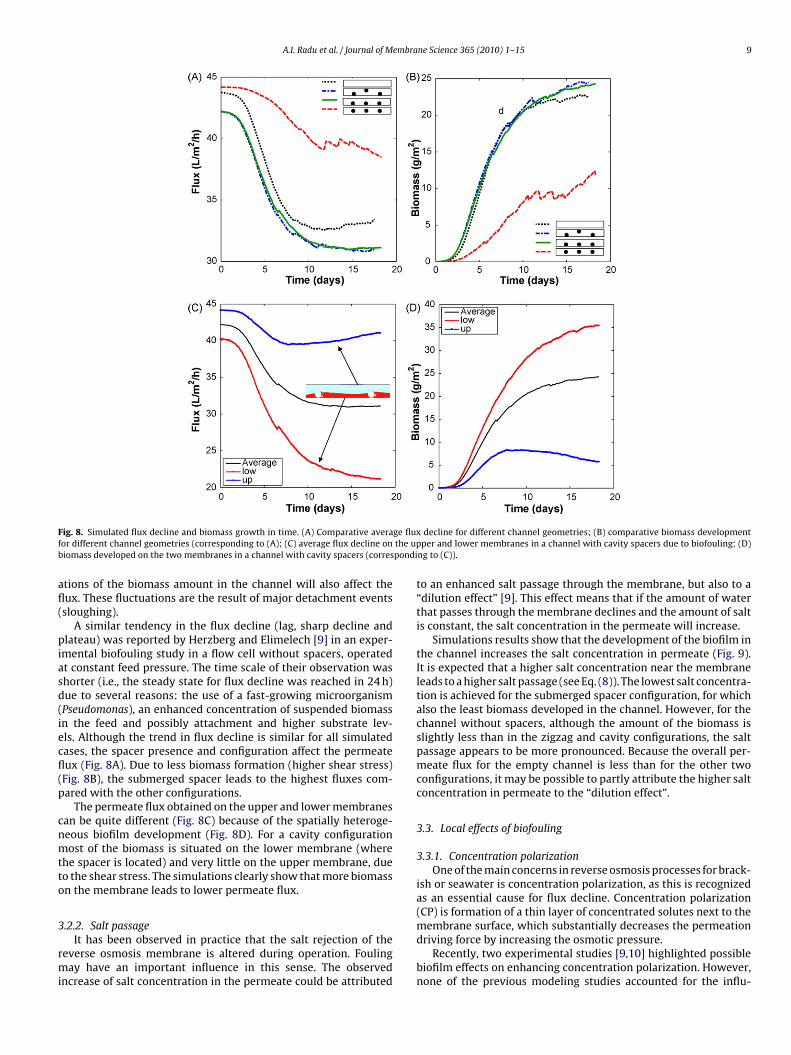
A.I. Radu et al. / Journal of Membrane Science 365 (2010) 1–15 9
F ge fluxf the upb pondi
afl(
piasd(iecfl(p
cnmtto
3
rmi
ig. 8. Simulated flux decline and biomass growth in time. (A) Comparative averaor different channel geometries (corresponding to (A); (C) average flux decline oniomass developed on the two membranes in a channel with cavity spacers (corres
tions of the biomass amount in the channel will also affect theux. These fluctuations are the result of major detachment eventssloughing).
A similar tendency in the flux decline (lag, sharp decline andlateau) was reported by Herzberg and Elimelech [9] in an exper-
mental biofouling study in a flow cell without spacers, operatedt constant feed pressure. The time scale of their observation washorter (i.e., the steady state for flux decline was reached in 24 h)ue to several reasons: the use of a fast-growing microorganismPseudomonas), an enhanced concentration of suspended biomassn the feed and possibly attachment and higher substrate lev-ls. Although the trend in flux decline is similar for all simulatedases, the spacer presence and configuration affect the permeateux (Fig. 8A). Due to less biomass formation (higher shear stress)Fig. 8B), the submerged spacer leads to the highest fluxes com-ared with the other configurations.
The permeate flux obtained on the upper and lower membranesan be quite different (Fig. 8C) because of the spatially heteroge-eous biofilm development (Fig. 8D). For a cavity configurationost of the biomass is situated on the lower membrane (where
he spacer is located) and very little on the upper membrane, dueo the shear stress. The simulations clearly show that more biomassn the membrane leads to lower permeate flux.
.2.2. Salt passageIt has been observed in practice that the salt rejection of the
everse osmosis membrane is altered during operation. Foulingay have an important influence in this sense. The observed
ncrease of salt concentration in the permeate could be attributed
decline for different channel geometries; (B) comparative biomass developmentper and lower membranes in a channel with cavity spacers due to biofouling; (D)
ng to (C)).
to an enhanced salt passage through the membrane, but also to a“dilution effect” [9]. This effect means that if the amount of waterthat passes through the membrane declines and the amount of saltis constant, the salt concentration in the permeate will increase.
Simulations results show that the development of the biofilm inthe channel increases the salt concentration in permeate (Fig. 9).It is expected that a higher salt concentration near the membraneleads to a higher salt passage (see Eq. (8)). The lowest salt concentra-tion is achieved for the submerged spacer configuration, for whichalso the least biomass developed in the channel. However, for thechannel without spacers, although the amount of the biomass isslightly less than in the zigzag and cavity configurations, the saltpassage appears to be more pronounced. Because the overall per-meate flux for the empty channel is less than for the other twoconfigurations, it may be possible to partly attribute the higher saltconcentration in permeate to the “dilution effect”.
3.3. Local effects of biofouling
3.3.1. Concentration polarizationOne of the main concerns in reverse osmosis processes for brack-
ish or seawater is concentration polarization, as this is recognizedas an essential cause for flux decline. Concentration polarization(CP) is formation of a thin layer of concentrated solutes next to the
membrane surface, which substantially decreases the permeationdriving force by increasing the osmotic pressure.Recently, two experimental studies [9,10] highlighted possiblebiofilm effects on enhancing concentration polarization. However,none of the previous modeling studies accounted for the influ-
10 A.I. Radu et al. / Journal of Membrane Science 365 (2010) 1–15
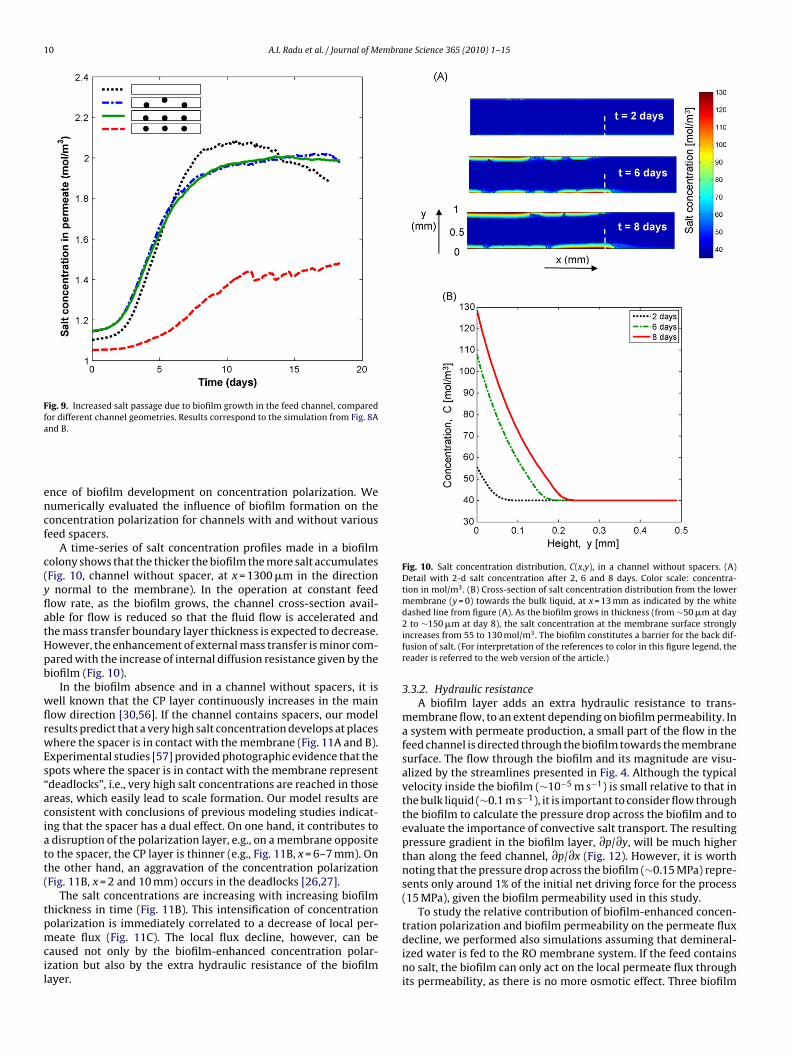
Fig. 9. Increased salt passage due to biofilm growth in the feed channel, comparedfor different channel geometries. Results correspond to the simulation from Fig. 8Aa
encf
c(yflatHpb
wflrwEs“aciatt(
tpmcil
Fig. 10. Salt concentration distribution, C(x,y), in a channel without spacers. (A)Detail with 2-d salt concentration after 2, 6 and 8 days. Color scale: concentra-tion in mol/m3. (B) Cross-section of salt concentration distribution from the lowermembrane (y = 0) towards the bulk liquid, at x = 13 mm as indicated by the whitedashed line from figure (A). As the biofilm grows in thickness (from ∼50 �m at day
tration polarization and biofilm permeability on the permeate fluxdecline, we performed also simulations assuming that demineral-ized water is fed to the RO membrane system. If the feed contains
nd B.
nce of biofilm development on concentration polarization. Weumerically evaluated the influence of biofilm formation on theoncentration polarization for channels with and without variouseed spacers.
A time-series of salt concentration profiles made in a biofilmolony shows that the thicker the biofilm the more salt accumulatesFig. 10, channel without spacer, at x = 1300 �m in the direction
normal to the membrane). In the operation at constant feedow rate, as the biofilm grows, the channel cross-section avail-ble for flow is reduced so that the fluid flow is accelerated andhe mass transfer boundary layer thickness is expected to decrease.owever, the enhancement of external mass transfer is minor com-ared with the increase of internal diffusion resistance given by theiofilm (Fig. 10).
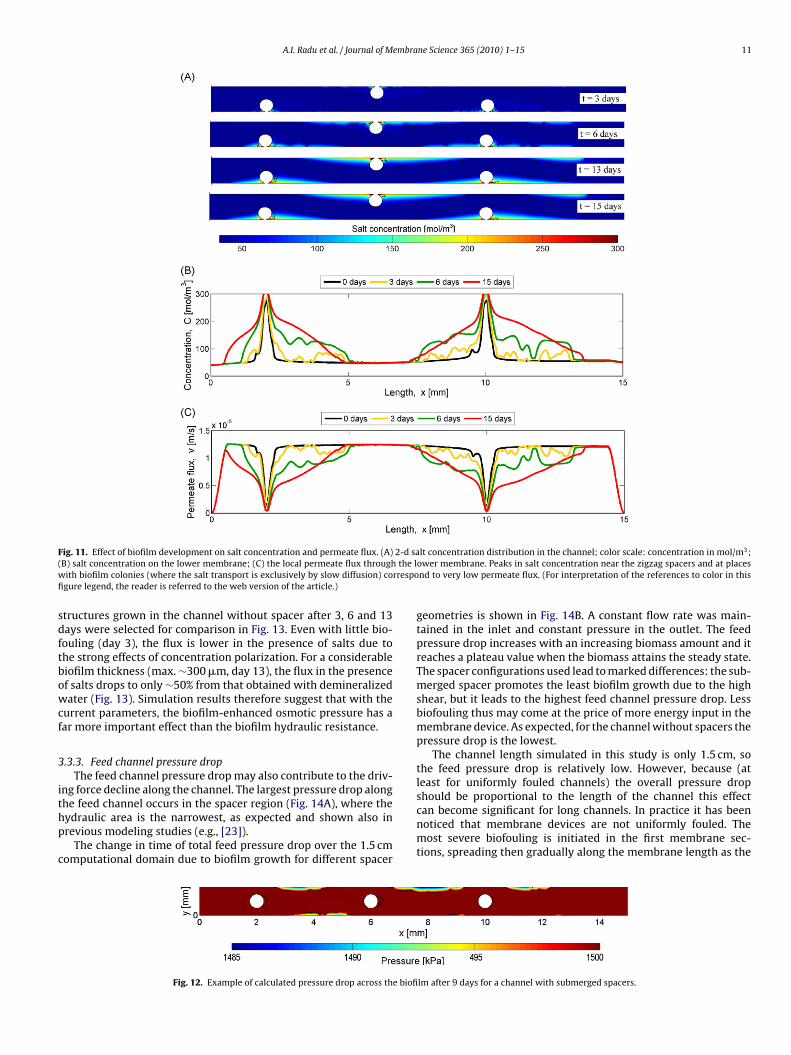
In the biofilm absence and in a channel without spacers, it isell known that the CP layer continuously increases in the mainow direction [30,56]. If the channel contains spacers, our modelesults predict that a very high salt concentration develops at placeshere the spacer is in contact with the membrane (Fig. 11A and B).
xperimental studies [57] provided photographic evidence that thepots where the spacer is in contact with the membrane representdeadlocks”, i.e., very high salt concentrations are reached in thosereas, which easily lead to scale formation. Our model results areonsistent with conclusions of previous modeling studies indicat-ng that the spacer has a dual effect. On one hand, it contributes todisruption of the polarization layer, e.g., on a membrane opposite
o the spacer, the CP layer is thinner (e.g., Fig. 11B, x = 6–7 mm). Onhe other hand, an aggravation of the concentration polarizationFig. 11B, x = 2 and 10 mm) occurs in the deadlocks [26,27].
The salt concentrations are increasing with increasing biofilmhickness in time (Fig. 11B). This intensification of concentrationolarization is immediately correlated to a decrease of local per-eate flux (Fig. 11C). The local flux decline, however, can be
aused not only by the biofilm-enhanced concentration polar-
zation but also by the extra hydraulic resistance of the biofilmayer.2 to ∼150 �m at day 8), the salt concentration at the membrane surface stronglyincreases from 55 to 130 mol/m3. The biofilm constitutes a barrier for the back dif-fusion of salt. (For interpretation of the references to color in this figure legend, thereader is referred to the web version of the article.)
3.3.2. Hydraulic resistanceA biofilm layer adds an extra hydraulic resistance to trans-
membrane flow, to an extent depending on biofilm permeability. Ina system with permeate production, a small part of the flow in thefeed channel is directed through the biofilm towards the membranesurface. The flow through the biofilm and its magnitude are visu-alized by the streamlines presented in Fig. 4. Although the typicalvelocity inside the biofilm (∼10−5 m s−1) is small relative to that inthe bulk liquid (∼0.1 m s−1), it is important to consider flow throughthe biofilm to calculate the pressure drop across the biofilm and toevaluate the importance of convective salt transport. The resultingpressure gradient in the biofilm layer, ∂p/∂y, will be much higherthan along the feed channel, ∂p/∂x (Fig. 12). However, it is worthnoting that the pressure drop across the biofilm (∼0.15 MPa) repre-sents only around 1% of the initial net driving force for the process(15 MPa), given the biofilm permeability used in this study.
To study the relative contribution of biofilm-enhanced concen-
no salt, the biofilm can only act on the local permeate flux throughits permeability, as there is no more osmotic effect. Three biofilm
A.I. Radu et al. / Journal of Membrane Science 365 (2010) 1–15 11
F 2-d sa( the lw rrespofi
sdftbowcf
3
ithp
c
ig. 11. Effect of biofilm development on salt concentration and permeate flux. (A)B) salt concentration on the lower membrane; (C) the local permeate flux throughith biofilm colonies (where the salt transport is exclusively by slow diffusion) cogure legend, the reader is referred to the web version of the article.)
tructures grown in the channel without spacer after 3, 6 and 13ays were selected for comparison in Fig. 13. Even with little bio-ouling (day 3), the flux is lower in the presence of salts due tohe strong effects of concentration polarization. For a considerableiofilm thickness (max. ∼300 �m, day 13), the flux in the presencef salts drops to only ∼50% from that obtained with demineralizedater (Fig. 13). Simulation results therefore suggest that with the
urrent parameters, the biofilm-enhanced osmotic pressure has aar more important effect than the biofilm hydraulic resistance.
.3.3. Feed channel pressure dropThe feed channel pressure drop may also contribute to the driv-
ng force decline along the channel. The largest pressure drop along
he feed channel occurs in the spacer region (Fig. 14A), where theydraulic area is the narrowest, as expected and shown also inrevious modeling studies (e.g., [23]).The change in time of total feed pressure drop over the 1.5 cmomputational domain due to biofilm growth for different spacer
Fig. 12. Example of calculated pressure drop across the biofi
lt concentration distribution in the channel; color scale: concentration in mol/m3;ower membrane. Peaks in salt concentration near the zigzag spacers and at placesnd to very low permeate flux. (For interpretation of the references to color in this
geometries is shown in Fig. 14B. A constant flow rate was main-tained in the inlet and constant pressure in the outlet. The feedpressure drop increases with an increasing biomass amount and itreaches a plateau value when the biomass attains the steady state.The spacer configurations used lead to marked differences: the sub-merged spacer promotes the least biofilm growth due to the highshear, but it leads to the highest feed channel pressure drop. Lessbiofouling thus may come at the price of more energy input in themembrane device. As expected, for the channel without spacers thepressure drop is the lowest.
The channel length simulated in this study is only 1.5 cm, sothe feed pressure drop is relatively low. However, because (atleast for uniformly fouled channels) the overall pressure dropshould be proportional to the length of the channel this effect
can become significant for long channels. In practice it has beennoticed that membrane devices are not uniformly fouled. Themost severe biofouling is initiated in the first membrane sec-tions, spreading then gradually along the membrane length as thelm after 9 days for a channel with submerged spacers.

12 A.I. Radu et al. / Journal of Membrane Science 365 (2010) 1–15
Fig. 13. Relative contributions of biofilm-enhanced concentration polarization and biofilm hydraulic resistance on local permeate velocity. (A) Demineralized water in thef th littc g osmo iofilmb
bAsuap
Fdgf
eed (solid lines); (B) salty water (40 mM NaCl) in the feed (dashed lines). Even wioncentration polarization on the effective driving force for the process by increasinf salts is only ∼50% from that obtained from demineralized water. The effects of biofilm hydraulic resistance in the desalination of brackish water.
iofilm detaches and colonizes further downstream sections [4].pplying therefore this model on several connected membrane
egments situated at different positions along the membrane mod-le could provide useful insight on the spatial biofilm distributionlong the module, and on overall effects of biofouling on moduleerformance.ig. 14. Feed channel pressure drop in different channel geometries. (A) 2-d distributionrop per length along the channel is much smaller than that in the biofilm across the channrowth in channels without spacer and with zigzag, cavity or submerged spacers. The preor zigzag and cavity spacers develops almost identically.
le biofouling (day 3), the flux is lower in the presence of salts due to the effects ofotic pressure. For a considerable biofilm thickness (day 13), the flux in the presence-enhanced concentration polarization appear to be more significant than those of
4. Discussion
The model presented in this article is the first to describe numer-ically the micro-scale effects of biofilm growth in a reverse osmosisdesalination module on: trans-membrane (permeate) flux, salt pas-sage and feed channel pressure drop. The maximum driving force
of pressure in a channel with submerged spacers at 12 days. Note that the pressureel (Fig. 12). (B) Comparison of feed channel pressure drop evolution due to biomass
ssure drop is calculated over the whole domain length of 15 mm. The pressure drop

embra
ffhbFrttbm
4
dpl
aEsnmdcisthno
apit(bbsbrtcer
abcrtnaoibabbs
4
ce
A.I. Radu et al. / Journal of M
or obtaining permeate flux is the pressure difference between theeed and permeate channels, which has to overcome the membraneydraulic resistance. For salty water the driving force is diminishedy the osmotic pressure created by concentration polarization.urthermore, the biofilm may cause a triple detrimental effect:educing the driving force by (i) decreasing the feed pressure alonghe channel and (ii) enhancing the osmotic pressure by concentra-ion polarization, and increasing the overall hydraulic resistancey (iii) introducing an additional hydraulic resistance to that of theembrane.
.1. Concentration polarization and biofilm permeability
The model results suggested that, for brackish or seawateresalination, the contribution of biofilm-enhanced concentrationolarization on the permeate flux decline may be significantly
arger than the contribution of biofilm-reduced permeability.In principle, diffusion of salt and substrate is not very much
ffected by the biofilm, compared with the diffusion in pure water.xperimental studies have shown that the diffusion coefficients formall molecules (e.g., O2, NaCl, acetate) in the biofilm are usuallyot smaller than 70% of those in water [44,58–60]. Therefore, theain role of the biofilm is to increase the thickness of the diffusion-
ominated layer near the membrane. By hindering the liquidonvection in the direction parallel to the membrane and increas-ng the diffusion length towards the membrane, the biofilm veryignificantly increases the concentration polarization layer. A ques-ion remains whether the biofilm growth actually benefits from theigher substrate concentration resulting from the polarization phe-omenon. The effect of substrate accumulation near the membranen biofilm growth will be presented in a forthcoming study.
Although for the concentration polarization the physicalssumptions are quite well established, the biofilm hydraulicermeability remains a controversial issue in spite of a few exper-
mental reports. The biofilm hydraulic permeability depends onhe relative content of bacterial cells and gel-like polymeric matrixEPS) embedding the bacterial cells [8]. Our model simulations usediofilm permeability values currently available in the literature foriofilms containing both cells and EPS [8,39,42]. Therefore, we con-ider that, qualitatively, the modeling results from this study (forrackish water) are valid as they were obtained within a reasonableange of hydraulic permeability values. For a fresh surface waterreatment plant, the feed does not contain so much salt. In thatase, less biofilm-enhanced concentration polarization effects arexpected and the biofilm hydraulic resistance will have a higherelative importance for the flux decline.
It is not clear yet what is more harmful in terms of flux decline:more impermeable or a permeable biofilm? A more permeable
iofilm could also lead to less flux because of an increased con-entration polarization. Whether this flux decrease is significantelative to the decrease due to concentration polarization needso be evaluated from a future parametric study. Nevertheless, theecessity for reliable measurements of biofilm/cells/EPS perme-bility remains. Even though the effect of biofilm compositionn permeability is not completely elucidated, it is clear that anncreased biofilm thickness affects the flux decline. Because theiofilm thickness is determined by the balance between growthnd detachment rates, the model also underlines the necessity ofetter measurements of other important parameters, such as theiofilm mechanical properties (e.g., cohesion strength or thresholdtress for detachment, viscoelasticity and elasticity modulus).
.2. Spacer importance
Often, experimental studies on biofouling are performed in flowells without spacers [9,10,61], emphasizing the role of biofilm-nhanced concentration polarization, but neglecting the potential
ne Science 365 (2010) 1–15 13
role of spacers in biofilm formation and reverse osmosis processes.Similarly, many numerical studies modeled concentration polar-ization effects and other aspects in reverse osmosis feed channelin the absence of a spacer [14,62]. Recent experimental studiespointed however to the importance of spacers for biofilm develop-ment [11,17,23]. Several numerical studies included the presenceof spacers [18–20,22,27,31] with an emphasis on studying the flowpattern and mass transfer in the feed channel. Although these stud-ies provide a good basis for a mathematical model of the reverseosmosis process, there was a need to develop a numerical modelthat could describe biofilm growth and its effects in a spacer-filledchannel. Our results indicate that the spacer presence and config-uration have an important influence on the RO performance whena biofilm develops in the feed channel. Because the spacer effect issignificant, a proper scale-down of the RO system needs to includespacers in order to correctly estimate the effects of biofilm devel-opment on the membrane module performance (permeate fluxes,salt passage and feed channel pressure drop).
Interestingly, we found that among the feed channel geometriesused in this study, the submerged spacers were the most favor-able in terms of both permeate flux and salt concentration in thepermeate. As a trade-off, compared with other configurations, sub-merged spacers lead to larger feed channel pressure drop and thusto more energy consumption. The spacer fibers placed half waybetween the two membranes leaves clearly reduce biofilm devel-opment by promoting high shear and, consequently, more biomassdetachment. However, by using 2-d geometry the potential impactof the spacer filaments parallel to the flow (“axial filaments”) wasnot considered. For certain geometries, it has been shown by [28]that axial filaments do not significantly influence the flow patternin a parallel 2-d plane if that plane is situated “far enough” fromthe filaments. Obviously, the flow cannot be well approximated byusing 2-d geometry in the region near the axial filaments or whenthe flow attack angle is at 45◦ (e.g., diamond spacer configuration).
The strong effect of the spacer on the system behavior urgesto use realistic spacer geometries for numerical studies (see also[23]). With the modeling approach developed in this study differentspacer and feed channel geometries could be evaluated in respectto their potential biofilm formation. The model could be used as atool to optimize the spacer design and membrane device construc-tion and operation with reduced impact of biofilm accumulationon plant performance.
4.3. Further model development and use
The model presented here can be easily adapted for other feedquality and operational parameters, allowing thus an estimationof biofilm effects on process performance under different condi-tions. In addition, the effectiveness of biofilm backwash could alsobe studied using the model.
Even though the simulations performed in this work were in twospatial dimensions, they could contribute to the qualitative under-standing of interactions between different processes occurringduring biofouling of a reverse osmosis channel. When consider-ing 2-d geometry, the changes in flow velocity, pressure, soluteconcentrations and biomass in the z-direction are fully neglected.This simplification may affect not only local permeation rates butalso global performance parameters. In addition, the 2-d geometrydoes not allow the description of preferential flow channels andits consequences [23,25]. Numerical results from this 2-d studyshould therefore be translated with care to real 3-d applications.
It is obvious that an increase of geometric complexity (e.g., 3-dsimulations) is needed to obtain a better quantitative comparisonwith experimental measurements. Although simple in principle,the model extension to three dimensions will require significantadaptations of the numerical approach, so that a good compromise
1 embra
cc
5
temmp
asobtma
oos
Rsctdpcp
to
S
on
A
lDtc
A
t
R
[
[
[
[
[
[[
[
[
[
[
[
[
[
[
[
[
[
[
[
[
[
[
[
[
4 A.I. Radu et al. / Journal of M
an be reached between accuracy of the results and the massiveomputing requirements.
. Conclusions
A two-dimensional numerical model based on fundamentalransport equations was created to study the local and macroscopicffects of biofouling in a reverse osmosis membrane device. Theechanistic model explains several experimental observations,ost importantly the loss of permeate flux and the increase of salt
assage in time due to biofilm formation.Due to balanced biofilm growth and detachment a maximum
ttached biomass amount can be reached, leading to a quasi-teady state for the flux, as observed experimentally. The interplayf biomass growth with detachment also shows why the spatialiofilm distribution in the feed channel is irregular and suggestshe places where most biomass accumulation is expected and the
echanisms by which the biofilm is streamlined by the erosivection of the flow.
It was found that the spacer configuration plays a significant rolen the amount of biomass formed in the channel and, consequently,n the average permeate flux and salt passage. The submergedpacer gave the best performance among the studied geometries.
Three mechanisms by which the development of a biofilm in aO membrane device contributes to the flux decline and increasedalt passage into permeate were identified: (i) biofilm-enhancedoncentration polarization; (ii) increased hydraulic resistance torans-membrane flow; and (iii) increased feed channel pressurerop. Among these, for brackish water and within the range ofarameter values reported in the literature, the biofilm-enhancedoncentration polarization seems to have the most influence on theermeate flux decline.
The developed model could be used as a tool to further inves-igate the effect of process conditions on biofilm formation and toptimize the membrane device construction and operation.
upplementary material
Additional data and animations of simulated biofilm devel-pment can be obtained from: http://www.biofilms.bt.tudelft.l/Biofouling2/index.html.
cknowledgements
This work was financially supported by Wetsus, Centre of Excel-ence for Sustainable Water Technology. Wetsus is founded by theutch Ministry of Economic Affairs. The authors also like to thank
he participants of theme “Biofouling” for valuable discussions con-erning the biofilms in RO and NF systems.
ppendix A. Supplementary data
Supplementary data associated with this article can be found, inhe online version, at doi:10.1016/j.memsci.2010.07.036.
eferences
[1] T. Pankratz, Dissecting desalination, Water Environ. Int. 9 (2000) 8–9.[2] T. Kaghazchi, M. Mehri, M.T. Ravanchi, A. Kargari, A mathematical modeling of
two industrial seawater desalination plants in the Persian Gulf region, Desali-nation 252 (2010) 135–142.
[3] L.F. Greenlee, D.F. Lawler, B.D. Freeman, B. Marrot, P. Moulin, Review: reverseosmosis desalination: water sources, technology, and today’s challenges, WaterRes. 43 (2009) 2317–2348.
[4] T Tran, B. Bolto, S. Gray, M. Hoang, E. Ostarcevic, An autopsy study of fouledreverse osmosis membrane element used in a brackish water treatment plant,Water Res. 41 (2007) 3812–3822.
[
[
ne Science 365 (2010) 1–15
[5] J.S. Baker, L.Y. Dudley, Biofouling in membrane systems-a review, Desalination118 (1998) 81–90.
[6] P. Lens, A.P. Moran, T. Mahony, P. Stoodley, V. O’Flaherty:, Biofilms in medicine,industry and environmental biotechnology: characteristics, analysis and con-trol, in: J.W. Patching, G.T.A. Fleming (Eds.), Industrial Biofilms: Formation,Problems and Control, IWA Publishing, London, UK, 2003.
[7] J. Mallevialle, P.E. Odendaal, M.R. Wiesner (Eds.), Water Treatment-MembraneProcesses, McGraw-Hill, 1996.
[8] R. McDonogh, G. Schaule, H.C. Flemming, The permeability of biofouling layerson membranes, J. Membr. Sci. 87 (1994) 199–217.
[9] M. Herzberg, M. Elimelech, Biofouling of reverse osmosis membranes: role ofbiofilm-enhanced osmotic pressure, J. Membr. Sci. 295 (2007) 11–20.
10] T.H. Chong, F.S. Wong, A.G. Fane, The effect of imposed flux on biofoulingin reverse osmosis: role of concentration polarization and biofilm enhancedosmotic pressure phenomena, J. Membr. Sci. 325 (2008) 840–850.
11] J.S. Vrouwenvelder, D.A. von der Schulenburg, J.C. Kruithof, M.L. Johns, M.C.M.van Loosdrecht, Biofouling of spiral wound nanofiltration and reverse osmosismembranes: a feed spacer problem, Water Res. 43 (2009) 583–594.
12] R. Ghidossi, D. Veyret, P. Moulin, Computational fluid dynamics applied tomembranes: state of the art and opportunities, Chem. Eng. Proc. 45 (2006)437–454.
13] A. Subramani, S. Kim, E.M.V. Hoek, Pressure, flow and concentration profiles inopen and spacer filled membrane channels, J. Membr. Sci. 277 (2006) 7–17.
14] E. Lyster, Y. Cohen, Numerical study of concentration polarization in a rect-angular reverse osmosis membrane channel: permeate flux variation andhydrodynamic end effects, J. Membr. Sci. 303 (2007) 140–153.
15] V. Geraldes, V. Semigo, M.N. de Pinho, Eng. Comput. 17 (2000) 192–217.16] A.S. Kim, H. Chen, R. Yuan, EPS biofouling in membrane filtration: an analytic
modeling study, J. Colloids Interface Sci. 303 (2006) 243–249.17] J.S. Vrouwenvelder, J. Buiter, M. Riviere, W.G.J. van der Meer, M.C.M. van Loos-
drecht, J.C. Kruithof, Impact of flow regime on pressure drop increase andbiomass accumulation and morphology in membrane systems, Water Res. 44(2010) 689–702.
18] V.V. Ranade, A. Kumar, Fluid dynamics of spacer filled rectangular and curvi-linear channels, J. Membr. Sci. 271 (2006) 1–15.
19] G.A. Fimbres-Weihs, D.E. Wiley, Numerical study of mass transfer in three-dimensional spacer-filled narrow channels with steady flow, J. Membr. Sci. 306(2007) 228–243.
20] C.P. Koutsou, S.G. Yiantsios, A.J. Karabelas, A numerical and experimental studyof mass transfer in spacer-filled channels: effects of spacer geometrical char-acteristics and Schmidt number, J. Membr. Sci. 326 (2009) 234–251.
21] K.K. Lau, M.Z. Abu Bakar, A.L. Ahmad, T. Murugesan, Feed channel mesh angle:3D modeling, simulation and optimization based on unsteady hydrodynamicin spiral wound membrane channel, J. Membr. Sci. 343 (2009) 16–33.
22] F. Li, W. Meindersma, A.B. de Haan, T. Reith, Novel spacers for mass transferenhancement in membrane separations, J. Membr. Sci. 253 (2005) 1–12.
23] C. Picioreanu, J.S. Vrouwenvelder, M.C.M. van Loosdrecht, Three-dimensionalmodeling of biofouling and fluid dynamics in feed spacer channels of mem-brane devices, J. Membr. Sci. 345 (2009) 340–354.
24] J.S. Vrouwenvelder, C. Picioreanu, J.C. Kruithof, M.C.M. van Loosdrecht, Bio-fouling in spiral wound membrane systems: three-dimensional model basedevaluation of experimental data, J. Membr. Sci. 346 (2010) 71–85.
25] T.R.R. Pintelon, S.A. Creber, D.A. Graf von der Schulemburg, M.L. Johns, Valida-tion of 3D simulations of reverse osmosis membrane biofouling, Biotechnol.Bioeng. 106 (2010) 677–689.
26] J. Schwinge, D.E. Wiley, D.F. Fletcher, Simulation of the flow around spacer Fila-ments between channel walls: 2. Mass-transfer enhancement, Ind. Eng. Chem.Res. 41 (2002) 4879–4888.
27] L. Song, S. Ma, Numerical studies of the impact of spacer geometry on concen-tration polarization in spiral wound membrane modules, Ind. Eng. Chem. Res.44 (2005) 7638–7645.
28] M. Shakaib, S.M.F. Hasani, M. Mahmood, Study on the effects of spacer geom-etry in membrane feed channels using three-dimensional computational flowmodeling, J. Membr. Sci. 297 (2007) 74–89.
29] G. Schock, A. Miquel, Mass transfer and pressure loss in spiral wound modules,Desalination 64 (1987) 339–352.
30] S. Wardeh, H.P. Morvan, Detailed numerical simulations of flow mechanics andmembrane performance in spacer-filled channels, flat and curved, DesalinationWater Treat. 1 (2009) 277–288.
31] J. Schwinge, D.E. Wiley, D.F. Fletcher, Simulation of unsteady flow and vor-tex shedding for narrow spacer-filled channels, Ind. Eng. Chem. Res. 42 (2003)4962–4977.
32] H.C. Brinkman, A calculation of the viscous force exerted by a flowing fluid ona dense swarm of particles, Appl. Sci. Res. A1 (1947) 27–34.
33] M. Henze, W. Gujer, T. Mino, M.C.M. Van Loosdrecht, Activated sludge mod-els ASM1, ASM2, ASM2d and ASM3, in: M. Henze, W. Gujer, T. Mino, M.C.M.van Loosdrecht (Eds.), IWA Task Group on Mathematical Modelling for Designand Operation of Biological Wastewater Treatment, IWA Scientific & TechnicalReport, IWA Publishing, London, UK, 2000.
34] C. Picioreanu, M.C.M. Van Loosdrecht, J. Heijnen, Mathematical modeling
of biofilm structure with a hybrid differential-discrete cellular automatonapproach, Biotechnol. Bioeng. 58 (1998) 101–116.35] C. Picioreanu, M.C.M. Van Loosdrecht, J. Heijnen, Two-dimensional model ofbiofilm detachment caused by internal stress from liquid flow, Biotechnol.Bioeng. 72 (2001) 205–218.
36] R.C. Hibbeler, Mechanics of Materials, Macmillan, NY, USA, 1991.
embra
[
[
[
[
[
[
[
[
[
[
[
[
[
[
[
[
[
[
[
[
[
[
[
[
A.I. Radu et al. / Journal of M
37] J.S. Vrouwenvelder, C. Hinrichs, W.G.J. van der Meer, M.C.M. van Loosdrecht,J.C. Kruithof, Pressure drop increase by biofilm accumulation in spiral woundRO and NF membrane systems: role of substrate, flow velocity, substrate loadand flow direction, Biofouling 25 (2009) 543–555.
38] J.S Vrouwenvelder, S.M. Bakker, M. Cauchard, R. Le Grand, M. Apacandie, M.Idrissi, S. Lagrave, L.P. Wessels, J.A.M. Van Paassen, J.C. Kruithof, M.C.M. vanLoosdrecht, The membrane fouling simulator: a suitable tool for prediction andcharacterization of membrane fouling, Water Sci. Technol. 55 (2007) 197–205.
39] E.M. Johnson, W.M. Deen, The permeability of agarose gels, AICHE J. 42 (1996)1220–1224.
40] G.E. Kapellos, T.S. Alexiou, A.C. Payatakes, Hierarchical simulator of biofilmgrowth and dynamics in granular porous materials, Adv. Water Res. 30 (2007)1648–1667.
41] R.B. Moehle, T. Langemann, M. Haesner, W. Augustin, S. Scholl, T.R. Neu,D.C. Hempel, H. Horn, Structure and shear strength of microbial biofilms asdetermined with confocal laser scanning microscopy and fluid dynamic gaug-ing using a novel rotating disc biofilm reactor, Biotechnol. Bioeng. 98 (2007)205–218.
42] J.D. Fowler, C.R. Robertson, Hydraulic permeability of immobilized bacterialcell aggregates, Appl. Environ. Microbiol. 57 (1991) 102–113.
43] T.C. Zhang, P.L. Bishop, Density, porosity, and pore structure of biofilms, WaterRes. (1994) 2267–2277.
44] O Wanner, W. Gujer, A multispecies biofilm model, Biotechnol. Bioeng. 28(1986) 314–328.
45] P. Stoodley, Z. Lewandowski, J.D. Boyle, H.M. Lappin-Scott, Oscillation charac-teristics of biofilm streamers in turbulent flowing water as related to drag andpressure drop, Biotechnol. Bioeng. 57 (1998) 536–544.
46] C. Picioreanu, M.C.M. Van Loosdrecht, J.J. Heijnen, Effect of diffusive and convec-
tive substrate transport on biofilm structure formation: a 2-D modeling study,Biotechnol. Bioeng. 69 (2000) 504–515.47] D.E. Wiley, D.F. Fletcher, Techniques for computational fluid dynamics model-ing of flow in membrane channels, J. Membr. Sci. 211 (2003) 127–137.
48] A.L. Ohl, H. Horn, D.C. Hempel, Behaviour of biofilm systems under varyinghydrodynamic conditions, Water Sci. Technol. 49 (2004) 345–351.
[
[
ne Science 365 (2010) 1–15 15
49] P. Stoodley, J.D. Boyle, D. DeBeer, H.M. Lappin-Scott, Evolving perspectives ofbiofilm structure, Biofouling 14 (1999) 75–90.
50] M.C.M. Van Loosdrecht, D. Eikelboom, A. Gjaltema, A. Mulder, L. Tijhuis, J.J.Heijnen, Biofilm structures, Water Sci. Technol. 32 (1995) 35–43.
51] H.C. Flemming, Biofouling in water systems – cases, causes and countermea-sures, Appl. Microbiol. Biotechnol. 59 (2002) 629–640.
52] J.B. Xavier, C. Picioreanu, M.C.M. van Loosdrecht, Detachment for multidimen-sional biofilm modeling, Biotechnol. Bioeng. 91 (2005) 651–669.
53] J.B. Xavier, C. Picioreanu, M.C.M. van Loosdrecht, A modeling study of the activ-ity and structure of biofilms in biological reactors, Biofilms 1 (2004) 377–391.
54] I. Klapper, C.J. Rupp, R. Cargo, B. Purvedorj, P. Stoodley, Viscoelastic fluiddescription of bacterial biofilm material properties, Biotechnol. Bioeng. 80(2002) 289–296.
55] D. Taherzadeh, C. Picioreanu, U. Kuttler, A. Simone, W.A. Wall, H. Horn, Com-putational study of the drag and oscillatory movement of biofilm streamers infast flows, Biotechnol. Bioeng. 105 (2010) 600–610.
56] D.F. Fletcher, D.E. Wiley, A computational fluids dynamics study of buoyancyeffects in reverse osmosis, J. Membr. Sci. 245 (2004) 175–181.
57] A.G. Pervov, Scale prognosis and cleaning procedure schedules in reverse osmo-sis systems operation, Desalination 83 (1991) 78–118.
58] B.E. Christensen, W.G. Characklis, Physical and chemical properties of biofilms,in: W.G. Characklis, K.C. Marshall (Eds.), Biofilms, John Wiley & Sons, New York,1990, pp. 93–130.
59] P.S. Stewart, A review of experimental measurements of effective diffusive per-meabilities and effective diffusion coefficients in biofilms, Biotechnol. Bioeng.59 (1999) 261–272.
60] H. Horn, E. Morgenroth, Transport of oxygen, sodium chloride and sodium
nitrate in biofilms, Chem. Eng. Sci. 61 (2006) 1347–1356.61] M. Herzberg, S. Kang, M. Elimelech, Role of extracellular polymeric substances(EPS) in biofouling of reverse osmosis membranes, Environ. Sci. Technol. 43(2009) 4393–4398.
62] S. Kim, E.M.V. Hoek, Modeling concentration polarization in reverse osmosisprocesses, Desalination 186 (2005) 111–128.