Embed Size (px)
Citation preview
From the DMedicine, SBehavioral SHealth DecisHealth, Bosttion Health,Carter); theMailman ScWHO CollaMelbourne,
AddressPediatrics, UPO Box 5seattlechildr
0749-379http://dx
& 2015 Am
Modeling the Cost Effectiveness of ChildCare Policy Changes in the U.S.
Davene R. Wright, PhD, Erica L. Kenney, ScD, Catherine M. Giles, MPH, Michael W. Long, ScD,Zachary J. Ward, MPH, Stephen C. Resch, PhD, Marj L. Moodie, DrPH, Robert C. Carter, PhD,Y. Claire Wang, MD, ScD, Gary Sacks, PhD, Boyd A. Swinburn, PhD, Steven L. Gortmaker, PhD,
Angie L. Cradock, ScD
epeacieioonDD
hoboVicon37en7/.do
e
Introduction: Child care facilities influence diet and physical activity, making them ideal obesityprevention settings. The purpose of this study is to quantify the health and economic impacts of amulti-component regulatory obesity policy intervention in licensed U.S. child care facilities.
Methods: Two-year costs and BMI changes resulting from changes in beverage, physical activity,and screen time regulations affecting a cohort of up to 6.5 million preschool-aged children attendingchild care facilities were estimated in 2014 using published data. A Markov cohort model simulatedthe intervention’s impact on changes in the U.S. population from 2015 to 2025, including short-termBMI effects and 10-year healthcare expenditures. Future outcomes were discounted at 3% annually.Probabilistic sensitivity analyses simulated 95% uncertainty intervals (UIs) around outcomes.
Results: Regulatory changes would lead children to watch less TV, get more minutes of moderate andvigorous physical activity, and consume fewer sugar-sweetened beverages. Within the 6.5 millioneligible population, national implementation could reach 3.69 million children, cost $4.82 million inthe first year, and result in 0.0186 fewer BMI units (95%UI¼0.00592 kg/m2, 0.0434 kg/m2) per eligiblechild at a cost of $57.80 per BMI unit avoided. Over 10 years, these effects would result in nethealthcare cost savings of $51.6 (95% UI¼$14.2, $134) million. The intervention is 94.7% likely to becost saving by 2025.
Conclusions: Changing child care regulations could have a small but meaningful impact on short-term BMI at low cost. If effects are maintained for 10 years, obesity-related healthcare cost savingsare likely.(Am J Prev Med 2015;49(1):135–147) & 2015 American Journal of Preventive Medicine
Introduction
More than 20% of preschool-aged children inthe U.S. are overweight or obese.1 Earlyobesity is a risk factor for hypertension,
artment of Pediatrics, University of Washington School ofttle, Washington (Wright); the Department of Social andnces (Kenney, Giles, Long, Gortmaker, Cradock), Center forn Science (Ward, Resch), Harvard T.H. Chan School of Public, Massachusetts; Deakin Health Economics, Deakin Popula-eakin University, Melbourne, Victoria, Australia (Moodie,epartment of Health Policy and Management, Columbiaol of Public Health, New York, New York (Wang); and therating Centre for Obesity Prevention, Deakin University,ctoria, Australia (Sacks, Swinburn)rrespondence to: Davene R. Wright, PhD, Department ofiversity of Washington School of Medicine, M/S: CW-8-6,1, Seattle WA 98145-5005. E-mail: [email protected].$36.00i.org/10.1016/j.amepre.2015.03.016
rican Journal of Preventive Medicine � Published by Else
Type 2 diabetes, cancers, and psychosocial issuesthroughout the life course.2,3 Risk factors for obesity,including dietary habits, physical activity, and screentime behaviors, track from early into later childhood,4–6
and then persist from childhood into adulthood.7 Therisk of early obesogenic behaviors persisting over the lifecourse and the difficulty of changing long-term habits inadulthood highlight the importance of early interventionfor obesity prevention.Approximately 69% of American preschool-aged chil-
dren used an out-of-home child care provider in 2005.8
Full-day programs are responsible for up to two thirds ofchildren’s food intake per day in care.9,10 Child careproviders also often provide daily opportunities forchildren to participate in physical activity.11,12 Giventhe importance of addressing obesity early,13 the lengthof time children spend in the child care environment,and the influence child care facilities have on healthy
vier Inc. Am J Prev Med 2015;49(1):135–147 135
Wright et al / Am J Prev Med 2015;49(1):135–147136
behaviors, the child care setting is an ideal interventiontarget.11
Child care policies can be influenced by many actors—state licensing agencies, federal nutrition programs suchas Head Start or the Child and Adult Care Food Program(CACFP), and other accreditation organizations. Manyof these programs encourage serving reduced-fat milkand limiting servings of sugar-sweetened beverages(SSBs) and 100% juice. However, not all child careproviders are under the jurisdiction of national nutritionprograms or accrediting bodies, and instead may besubject to state or local policies that vary widely.14
Physical activity and screen time policies are sometimesregulated by state licensing agencies, but regulationsoften do not strictly limit sedentary behaviors.14,15
Some studies have examined the efficacy of single- andmulti-component obesity prevention initiatives in thechild care setting.16 However, no studies have examinedthe cost of conducting an obesity prevention policyinitiative in the child care setting. This study estimatesthe health and economic impact of obesity preventionpolicy changes in child care environments in the U.S. tobridge this gap in the literature.
MethodsIntervention
A hypothetical state-level regulatory policy intervention wasdeveloped for this analysis. The intervention was based on currentrecommendations regarding healthy behavior practices in childcare programs14,17–21 and current state and local child careinitiatives.22–24 The intervention consisted of three components.The beverage component stipulated that water be made freelyavailable throughout the program day, that SSBs be replaced withwater, 100% juice be limited to 6 ounces per child per day, andwhole milk be replaced with reduced-fat milk. The physical activitycomponent required programs to provide opportunities for at least90 minutes of moderate to vigorous physical activity (MVPA) overthe course of the program day for children in full-time care. Thescreen time component specified that TV and computer time beeducational in nature and limited to 30 minutes per week.
Current Practice
Existing practices in child care centers (CCCs) and family-basedchild care homes (FBCHs) (hereafter collectively referred to as“facilities”) do not meet recommendations for diet, physicalactivity, and screen time.16 Children in child care facilities aresedentary for most of the program day and the foods and beverageschildren consume do not meet dietary recommendations.25–27
Moreover, children’s screen time exceeds national recommenda-tions,28 especially in FBCHs.29 Although state regulations canimprove adherence to diet and physical activity recommendationsin child care facilities, many states do not regulate such behaviorsor regulations fall short of recommended best practices.14,17
Modeling Framework
The analysis is based on a modeling framework developed by acollaboration of researchers from the Harvard T.H. Chan Schoolof Public Health, Columbia Mailman School of Public Health,and Deakin University and University of Queensland in Aus-tralia. The Assessing Cost-Effectiveness (ACE) framework30,31
was adapted and modified by the research team to develop amodel for the Childhood Obesity Intervention Cost-EffectivenessStudy (CHOICES), including using U.S.-based cost and param-eter inputs, among other changes described elsewhere.32 Thismodel was used to conduct an economic analysis of the proposedhypothetical intervention in U.S. child care facilities. TheCHOICES model is a Markov-based cohort simulation modelwith components that model intervention implementation andshort- and longer-term outcomes. Short-term changes in BMIresulting from the intervention over a 2-year period weremodeled in the @RISK software program, version 6.0, based onparameter estimates from peer-reviewed randomized trials,meta-analyses, and cross-sectional studies. Next, the short-termestimated BMI changes were used to project future obesity,obesity-related comorbidities, and related healthcare expendi-tures over a 10-year horizon for a cohort of the 2015 U.S.population based on one million iterations of the modeldeveloped in a compiled programming language.32,33 The Mar-kov cohort model used a 1-year cycle length. The modelcalculates differences in healthcare expenditures with and with-out the intervention based on estimated differences in healthcarecosts for obese and non-obese children as documented byFinkelstein and Trogdon.34 These healthcare costs are reportedas net present value discounted at 3% per year. The 2015reference year was selected to evaluate the shift in BMI andhealthcare costs over a meaningful 10-year policy window and tocreate consistency across inputs, including demographic charac-teristics, intervention costs, and disease rates. The model esti-mates changes in population BMI for 5-year age and gendergroups for the cohort under the no-intervention and interventionscenarios. All data were collected and analyzed in 2014.
Because no changes in obesity-related morbidity or mortalitywere expected in the 10-year study modeling time frame amongthis cohort of very young children, and because reliable inputs forthe simulation model in years beyond childhood are difficult toobtain, changes in disability-adjusted life years (DALYs) were notassessed. No effect of the interventions at the beginning of the firstyear and full effect throughout the second year were modeled. Thisapproach was used to reflect recent work of Hall et al.35 Therefore,the children in the model who would be in the intervention for lessthan the full 2 years (e.g., those aged 4 and 5 years who startkindergarten in Year 2 of the hypothetical intervention) wereestimated to receive only half the modeled BMI benefits and incurhalf the costs of the 2-year intervention. Additional details on themodeling framework are reported in the overview paper byGortmaker and colleagues.32
Implementation and Equity Considerations
An expert panel of stakeholders, including public health practi-tioners, policymakers, and researchers, met to discuss the feasi-bility of implementing the intervention and the impact of theintervention on equity to complement the quantitative assessment
www.ajpmonline.org
Wright et al / Am J Prev Med 2015;49(1):135–147 137
of the intervention’s costs and effectiveness. These implementationconsiderations included strength of evidence, equity, acceptabilityto real-world decision makers, sustainability, feasibility, andpotential for side effects.
Policy Reach
The intervention was modeled for a cohort of U.S. preschool-agedchildren, aged 2.5–5 years,36 who are expected to use licensed childcare facilities in 2015. Estimates for the number of eligible children,number of facilities, enrollment in facilities, and time spent in carewere obtained from nationally representative child caresurveys.8,28,37,38
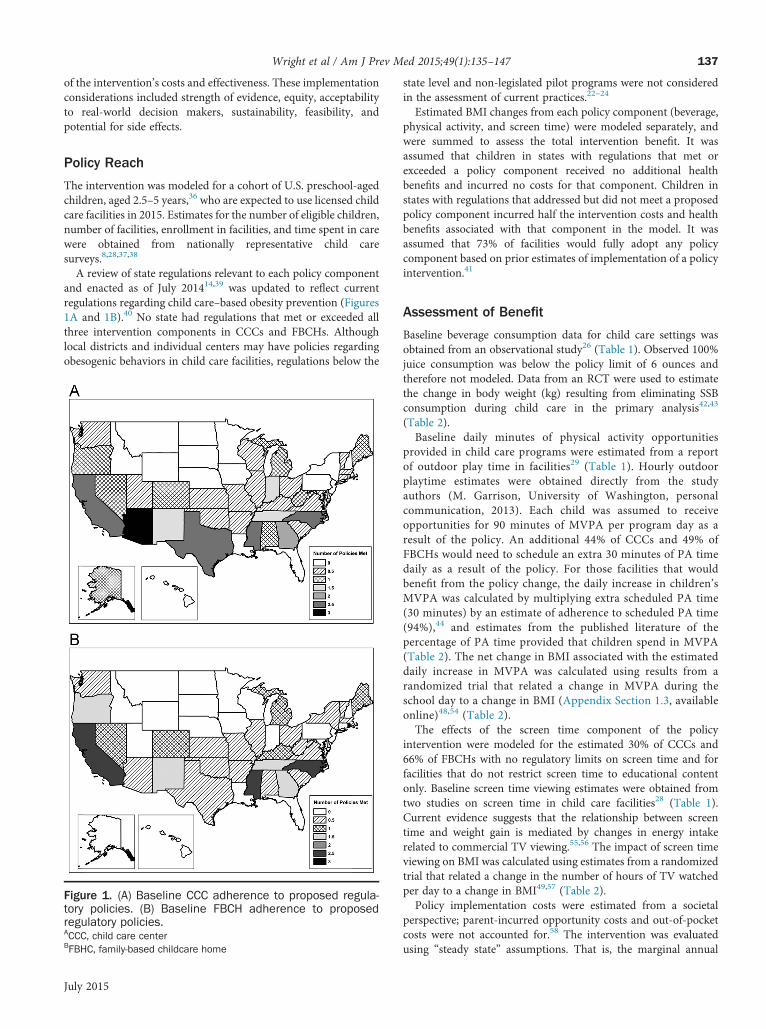
A review of state regulations relevant to each policy componentand enacted as of July 201414,39 was updated to reflect currentregulations regarding child care–based obesity prevention (Figures1A and 1B).40 No state had regulations that met or exceeded allthree intervention components in CCCs and FBCHs. Althoughlocal districts and individual centers may have policies regardingobesogenic behaviors in child care facilities, regulations below the
Figure 1. (A) Baseline CCC adherence to proposed regula-tory policies. (B) Baseline FBCH adherence to proposedregulatory policies.ACCC, child care centerBFBHC, family-based childcare home
July 2015
state level and non-legislated pilot programs were not consideredin the assessment of current practices.22–24
Estimated BMI changes from each policy component (beverage,physical activity, and screen time) were modeled separately, andwere summed to assess the total intervention benefit. It wasassumed that children in states with regulations that met orexceeded a policy component received no additional healthbenefits and incurred no costs for that component. Children instates with regulations that addressed but did not meet a proposedpolicy component incurred half the intervention costs and healthbenefits associated with that component in the model. It wasassumed that 73% of facilities would fully adopt any policycomponent based on prior estimates of implementation of a policyintervention.41
Assessment of Benefit
Baseline beverage consumption data for child care settings wasobtained from an observational study26 (Table 1). Observed 100%juice consumption was below the policy limit of 6 ounces andtherefore not modeled. Data from an RCT were used to estimatethe change in body weight (kg) resulting from eliminating SSBconsumption during child care in the primary analysis42,43
(Table 2).Baseline daily minutes of physical activity opportunities
provided in child care programs were estimated from a reportof outdoor play time in facilities29 (Table 1). Hourly outdoorplaytime estimates were obtained directly from the studyauthors (M. Garrison, University of Washington, personalcommunication, 2013). Each child was assumed to receiveopportunities for 90 minutes of MVPA per program day as aresult of the policy. An additional 44% of CCCs and 49% ofFBCHs would need to schedule an extra 30 minutes of PA timedaily as a result of the policy. For those facilities that wouldbenefit from the policy change, the daily increase in children’sMVPA was calculated by multiplying extra scheduled PA time(30 minutes) by an estimate of adherence to scheduled PA time(94%),44 and estimates from the published literature of thepercentage of PA time provided that children spend in MVPA(Table 2). The net change in BMI associated with the estimateddaily increase in MVPA was calculated using results from arandomized trial that related a change in MVPA during theschool day to a change in BMI (Appendix Section 1.3, availableonline)48,54 (Table 2).The effects of the screen time component of the policy
intervention were modeled for the estimated 30% of CCCs and66% of FBCHs with no regulatory limits on screen time and forfacilities that do not restrict screen time to educational contentonly. Baseline screen time viewing estimates were obtained fromtwo studies on screen time in child care facilities28 (Table 1).Current evidence suggests that the relationship between screentime and weight gain is mediated by changes in energy intakerelated to commercial TV viewing.55,56 The impact of screen timeviewing on BMI was calculated using estimates from a randomizedtrial that related a change in the number of hours of TV watchedper day to a change in BMI49,57 (Table 2).Policy implementation costs were estimated from a societal
perspective; parent-incurred opportunity costs and out-of-pocketcosts were not accounted for.58 The intervention was evaluatedusing “steady state” assumptions. That is, the marginal annual
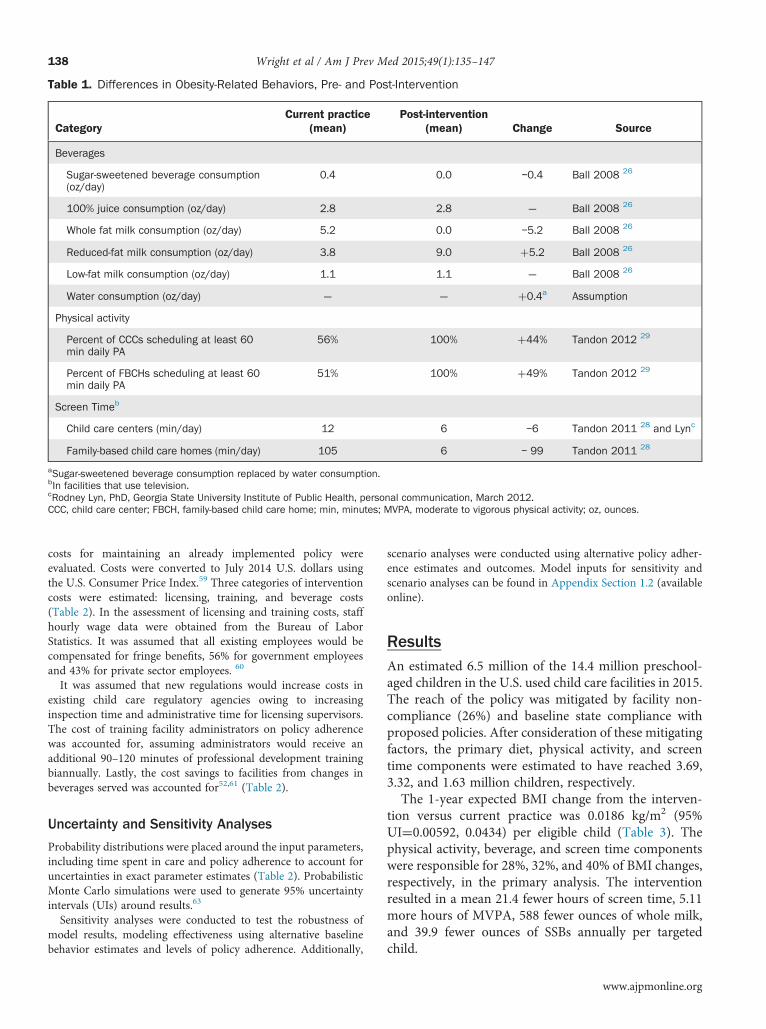
Table 1. Differences in Obesity-Related Behaviors, Pre- and Post-Intervention
CategoryCurrent practice
(mean)Post-intervention
(mean) Change Source
Beverages
Sugar-sweetened beverage consumption(oz/day)
0.4 0.0 –0.4 Ball 2008 26
100% juice consumption (oz/day) 2.8 2.8 — Ball 2008 26
Whole fat milk consumption (oz/day) 5.2 0.0 –5.2 Ball 2008 26
Reduced-fat milk consumption (oz/day) 3.8 9.0 þ5.2 Ball 2008 26
Low-fat milk consumption (oz/day) 1.1 1.1 — Ball 2008 26
Water consumption (oz/day) — — þ0.4a Assumption
Physical activity
Percent of CCCs scheduling at least 60min daily PA
56% 100% þ44% Tandon 2012 29
Percent of FBCHs scheduling at least 60min daily PA
51% 100% þ49% Tandon 2012 29
Screen Timeb
Child care centers (min/day) 12 6 –6 Tandon 2011 28 and Lync
Family-based child care homes (min/day) 105 6 – 99 Tandon 2011 28
aSugar-sweetened beverage consumption replaced by water consumption.bIn facilities that use television.cRodney Lyn, PhD, Georgia State University Institute of Public Health, personal communication, March 2012.CCC, child care center; FBCH, family-based child care home; min, minutes; MVPA, moderate to vigorous physical activity; oz, ounces.
Wright et al / Am J Prev Med 2015;49(1):135–147138
costs for maintaining an already implemented policy wereevaluated. Costs were converted to July 2014 U.S. dollars usingthe U.S. Consumer Price Index.59 Three categories of interventioncosts were estimated: licensing, training, and beverage costs(Table 2). In the assessment of licensing and training costs, staffhourly wage data were obtained from the Bureau of LaborStatistics. It was assumed that all existing employees would becompensated for fringe benefits, 56% for government employeesand 43% for private sector employees. 60
It was assumed that new regulations would increase costs inexisting child care regulatory agencies owing to increasinginspection time and administrative time for licensing supervisors.The cost of training facility administrators on policy adherencewas accounted for, assuming administrators would receive anadditional 90–120 minutes of professional development trainingbiannually. Lastly, the cost savings to facilities from changes inbeverages served was accounted for52,61 (Table 2).
Uncertainty and Sensitivity Analyses
Probability distributions were placed around the input parameters,including time spent in care and policy adherence to account foruncertainties in exact parameter estimates (Table 2). ProbabilisticMonte Carlo simulations were used to generate 95% uncertaintyintervals (UIs) around results.63
Sensitivity analyses were conducted to test the robustness ofmodel results, modeling effectiveness using alternative baselinebehavior estimates and levels of policy adherence. Additionally,
scenario analyses were conducted using alternative policy adher-ence estimates and outcomes. Model inputs for sensitivity andscenario analyses can be found in Appendix Section 1.2 (availableonline).
ResultsAn estimated 6.5 million of the 14.4 million preschool-aged children in the U.S. used child care facilities in 2015.The reach of the policy was mitigated by facility non-compliance (26%) and baseline state compliance withproposed policies. After consideration of these mitigatingfactors, the primary diet, physical activity, and screentime components were estimated to have reached 3.69,3.32, and 1.63 million children, respectively.The 1-year expected BMI change from the interven-
tion versus current practice was 0.0186 kg/m2 (95%UI¼0.00592, 0.0434) per eligible child (Table 3). Thephysical activity, beverage, and screen time componentswere responsible for 28%, 32%, and 40% of BMI changes,respectively, in the primary analysis. The interventionresulted in a mean 21.4 fewer hours of screen time, 5.11more hours of MVPA, 588 fewer ounces of whole milk,and 39.9 fewer ounces of SSBs annually per targetedchild.
www.ajpmonline.org
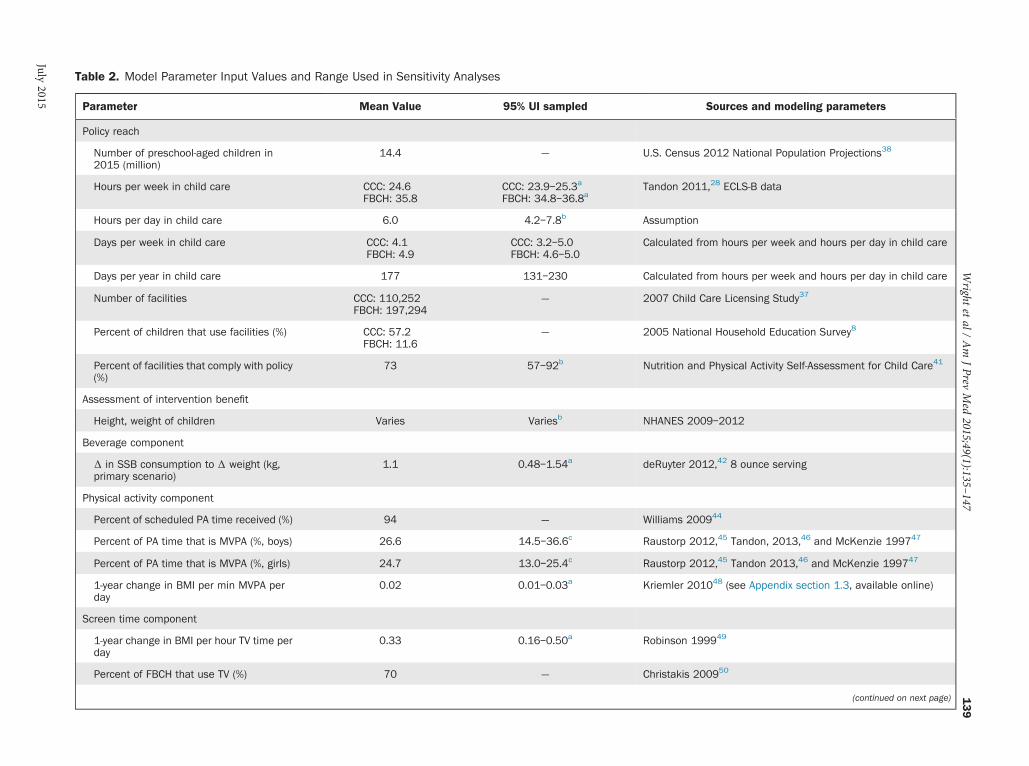
Table 2. Model Parameter Input Values and Range Used in Sensitivity Analyses
Parameter Mean Value 95% UI sampled Sources and modeling parameters
Policy reach
Number of preschool-aged children in2015 (million)
14.4 — U.S. Census 2012 National Population Projections38
Hours per week in child care CCC: 24.6FBCH: 35.8
CCC: 23.9–25.3a
FBCH: 34.8–36.8aTandon 2011,28 ECLS-B data
Hours per day in child care 6.0 4.2–7.8b Assumption
Days per week in child care CCC: 4.1FBCH: 4.9
CCC: 3.2–5.0FBCH: 4.6–5.0
Calculated from hours per week and hours per day in child care
Days per year in child care 177 131–230 Calculated from hours per week and hours per day in child care
Number of facilities CCC: 110,252FBCH: 197,294
— 2007 Child Care Licensing Study37
Percent of children that use facilities (%) CCC: 57.2FBCH: 11.6
— 2005 National Household Education Survey8
Percent of facilities that comply with policy(%)
73 57–92b Nutrition and Physical Activity Self-Assessment for Child Care41
Assessment of intervention benefit
Height, weight of children Varies Variesb NHANES 2009–2012
Beverage component
Δ in SSB consumption to Δ weight (kg,primary scenario)
1.1 0.48–1.54a deRuyter 2012,42 8 ounce serving
Physical activity component
Percent of scheduled PA time received (%) 94 — Williams 200944
Percent of PA time that is MVPA (%, boys) 26.6 14.5–36.6c Raustorp 2012,45 Tandon, 2013,46 and McKenzie 199747
Percent of PA time that is MVPA (%, girls) 24.7 13.0–25.4c Raustorp 2012,45 Tandon 2013,46 and McKenzie 199747
1-year change in BMI per min MVPA perday
0.02 0.01–0.03a Kriemler 201048 (see Appendix section 1.3, available online)
Screen time component
1-year change in BMI per hour TV time perday
0.33 0.16–0.50a Robinson 199949
Percent of FBCH that use TV (%) 70 — Christakis 200950
(continued on next page)
Wright
etal/
Am
JPrev
Med
2015;49(1):135–147
139
July2015
Table 2. Model Parameter Input Values and Range Used in Sensitivity Analyses (continued)
Parameter Mean Value 95% UI sampled Sources and modeling parameters
Percent of CCC that use TV (%) 29 — Christakis 200950
Costsd
Licensing costs
Licensing supervisor hourly wage ($) 25.35 — Estimated from a census of state licensing agency salaries (seeAppendix section 1.1, available online)
Licensing staff hourly wage ($) 20.35 — Estimated from a census of state licensing agency salaries (seeAppendix section 1.1, available online)
Licensing staff inspection time (minutesper center)
30 15–60b Expert stakeholder group consensus
Licensing supervisor % FTE 3 0–5c Expert stakeholder group consensus
Training costs
Child care center administrator hourlywage ($)
25.57 — U.S. Bureau of Labor Statistics 2013 mean salary for Occupation11-9031: Education Administrators, Preschool and Child CareCenter/Program
Child care center administrator trainingtime (minutes per year)
105 90b Expert stakeholder group consensus
Trainer hourly wage ($) 25.35 — Estimated from a census of state licensing agency salaries (seeAppendix, section 1.1, available online)
Trainer time (minutes per center) 8 1–15b Expert stakeholder group consensus
Training materials (per center; $) 10 — Expert stakeholder group consensus
Food costs
Cost per ounce SSB ($) 0.0612 — Powell 201451
Cost per ounce whole milk ($) 0.0295 — Agriculture Marketing Service, U.S. Department of Agriculture52
Cost per ounce reduced fat milk ($) 0.0284 — Agriculture Marketing Service, U.S. Department of Agriculture52
Cost per ounce water ($) o0.001 — Bulk price of disposable cups 53
aRange represents 95% UI. Sample drawn from normal distribution.bRange represents 95% UI. Sample drawn from uniform distribution.cRange represents 95% UI. Sample drawn from beta distribution.dAll costs are reported in July 2014 U.S. dollars.CCC, child care center; Δ, change; FBCH, family-based child care home; FTE, full-time equivalent; kg, kilogram; PA, physical activity; SSB, sugar-sweetened beverage; UI, uncertainty interval.
Wright
etal/
Am
JPrev
Med
2015;49(1):135–147
140
www.ajpm
online.org
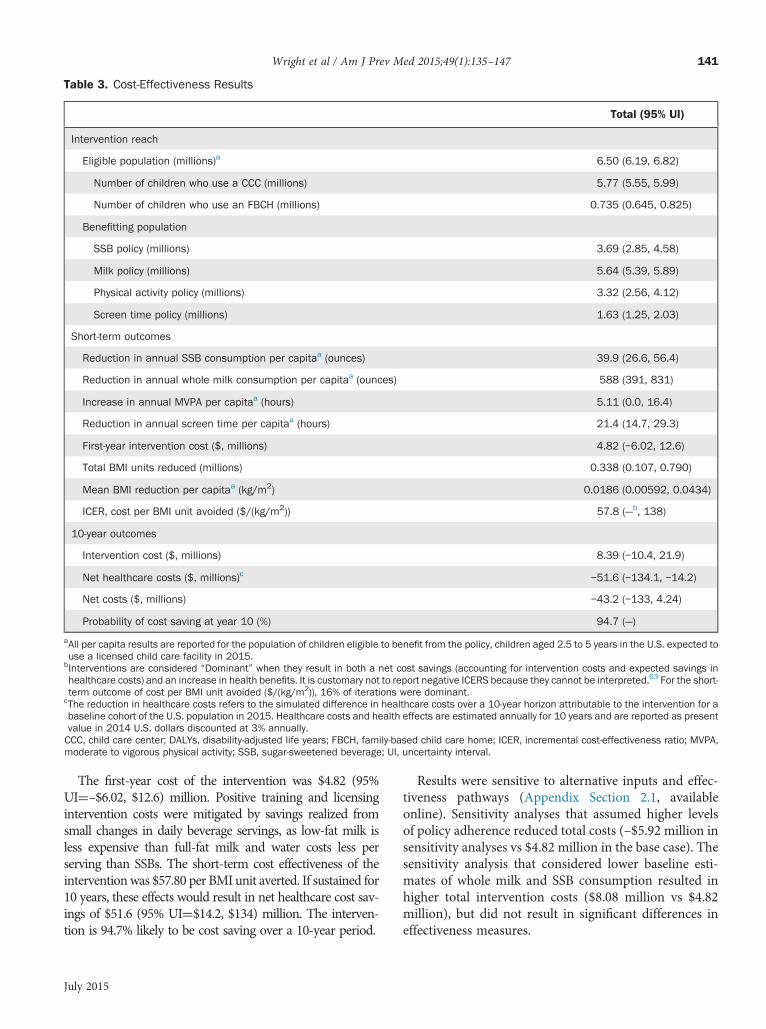
Table 3. Cost-Effectiveness Results
Total (95% UI)
Intervention reach
Eligible population (millions)a 6.50 (6.19, 6.82)
Number of children who use a CCC (millions) 5.77 (5.55, 5.99)
Number of children who use an FBCH (millions) 0.735 (0.645, 0.825)
Benefitting population
SSB policy (millions) 3.69 (2.85, 4.58)
Milk policy (millions) 5.64 (5.39, 5.89)
Physical activity policy (millions) 3.32 (2.56, 4.12)
Screen time policy (millions) 1.63 (1.25, 2.03)
Short-term outcomes
Reduction in annual SSB consumption per capitaa (ounces) 39.9 (26.6, 56.4)
Reduction in annual whole milk consumption per capitaa (ounces) 588 (391, 831)
Increase in annual MVPA per capitaa (hours) 5.11 (0.0, 16.4)
Reduction in annual screen time per capitaa (hours) 21.4 (14.7, 29.3)
First-year intervention cost ($, millions) 4.82 (–6.02, 12.6)
Total BMI units reduced (millions) 0.338 (0.107, 0.790)
Mean BMI reduction per capitaa (kg/m2) 0.0186 (0.00592, 0.0434)
ICER, cost per BMI unit avoided ($/(kg/m2)) 57.8 (—b, 138)
10-year outcomes
Intervention cost ($, millions) 8.39 (–10.4, 21.9)
Net healthcare costs ($, millions)c –51.6 (–134.1, –14.2)
Net costs ($, millions) –43.2 (–133, 4.24)
Probability of cost saving at year 10 (%) 94.7 (—)
aAll per capita results are reported for the population of children eligible to benefit from the policy, children aged 2.5 to 5 years in the U.S. expected touse a licensed child care facility in 2015.
bInterventions are considered “Dominant” when they result in both a net cost savings (accounting for intervention costs and expected savings inhealthcare costs) and an increase in health benefits. It is customary not to report negative ICERS because they cannot be interpreted.63 For the short-term outcome of cost per BMI unit avoided ($/(kg/m2)), 16% of iterations were dominant.
cThe reduction in healthcare costs refers to the simulated difference in healthcare costs over a 10-year horizon attributable to the intervention for abaseline cohort of the U.S. population in 2015. Healthcare costs and health effects are estimated annually for 10 years and are reported as presentvalue in 2014 U.S. dollars discounted at 3% annually.CCC, child care center; DALYs, disability-adjusted life years; FBCH, family-based child care home; ICER, incremental cost-effectiveness ratio; MVPA,moderate to vigorous physical activity; SSB, sugar-sweetened beverage; UI, uncertainty interval.
Wright et al / Am J Prev Med 2015;49(1):135–147 141
The first-year cost of the intervention was $4.82 (95%UI¼–$6.02, $12.6) million. Positive training and licensingintervention costs were mitigated by savings realized fromsmall changes in daily beverage servings, as low-fat milk isless expensive than full-fat milk and water costs less perserving than SSBs. The short-term cost effectiveness of theinterventionwas $57.80 per BMI unit averted. If sustained for10 years, these effects would result in net healthcare cost sav-ings of $51.6 (95% UI¼$14.2, $134) million. The interven-tion is 94.7% likely to be cost saving over a 10-year period.
July 2015
Results were sensitive to alternative inputs and effec-tiveness pathways (Appendix Section 2.1, availableonline). Sensitivity analyses that assumed higher levelsof policy adherence reduced total costs (–$5.92 million insensitivity analyses vs $4.82 million in the base case). Thesensitivity analysis that considered lower baseline esti-mates of whole milk and SSB consumption resulted inhigher total intervention costs ($8.08 million vs $4.82million), but did not result in significant differences ineffectiveness measures.
Wright et al / Am J Prev Med 2015;49(1):135–147142
The CHOICES stakeholder group voiced concernsaround the potential that the policy may result inincreases in tuition or child care costs, thus exacerbatingdisparities among low-income families who may nolonger be able to afford tuition, and among families thatuse unlicensed programs or relatives for care and whosechildren may not receive health benefits from the policy.Stakeholders also expressed concerns about teacherreluctance to revise programming because of burden,lack of equipment, or personal preferences. Conversely,stakeholders believed the existing regulatory and licens-ing structure, and state receptiveness to adopting bestpractices, could aid policy implementation, raise parentalawareness about appropriate diet and physical activitybehaviors for preschoolers, and spill over to the homeenvironment (Table 4).
DiscussionThis is the first study to examine the potential economicimpact of a multi-component child care–based obesitypolicy intervention. Implementing comprehensive obe-sity prevention policies in child care facilities appears tobe a viable and cost-effective obesity prevention strategy.The modeled child care facility policy changes resulted inan estimated 0.0186 kg/m2 per child decrease in BMIamong the eligible population of 6.5 million Americanpreschool-aged children at a cost of $57.80 per BMI unitavoided over the course of 1 year. There is a 94.7%chance that these small BMI changes early on will resultin cost savings over a 10-year time horizon for the cohortof preschool-aged children enrolled in child care facilitiesin 2015 owing to reduced obesity-related healthcare costsincurred during childhood and adolescence.34 Overall,the intervention would result in a net savings of $6.15(95% UI¼–$66.0, $51.9) per dollar spent administeringthe intervention. Because this intervention targetspreschool-aged children, and because most of the healthand economic consequences of obesity are not realizeduntil adulthood, the impact of the intervention over alifetime horizon was not estimated, as children wouldhave to maintain the modest BMI reduction for at least35 years to see any observed benefits related to DALYs ormortality and there would be a great deal of uncertaintyaround those long-term projected results.62,64 The esti-mated change in BMI is equivalent to a 0.16% reductionin mean BMI among children aged 2–4 years or a 0.3%reduction in obesity prevalence in that age group.These findings have implications for stakeholder
concerns about intervention implementation and possi-ble negative externalities. In the first year of the inter-vention, facilities saved on average approximately $9.99and $44.3 per center, per year on milk and SSBs,
respectively, and only spent $3.31 more per center, peryear on water as a result of the beverage policy. Withmore than 270,000 child care facilities affected by thepolicy, these savings add up quickly. The expected costsavings from the beverage policy and low per capita costof the intervention help to mitigate concerns about costs.Moreover, improving the quality of child care in low-performing facilities may improve equity across theboard by leveling the playing field among facilities.The proposed intervention would hypothetically be as
or more effective in reducing BMI than other child care–based obesity interventions that have been conducted todate.65–67 With a large target population and a total1-year implementation cost under $2 per child, thisintervention is low cost relative to smaller U.S. school-and community-based childhood obesity interventions,which range in cost from $15 to $839 per child.68–71
Given differences in effectiveness measures70,71 and thefact that lifetime maintenance of effects was notassumed,68,69,72 the expected cost effectiveness of thisintervention cannot be directly compared to a number ofother cost-effectiveness analyses.The observed health benefits are a function of the
intervention setting and impacted population. Somepotential policy interventions reach a large populationacross multiple ages (e.g., an SSB excise tax43 and limitingthe subsidy for TV ads for unhealthy foods57). BMIreductions among adults would result in more near-termobesity-related health benefits, whereas the targetedpopulation in this study would have to wait decades torealize most of the potential health effects attributable toearly BMI changes. Despite the broad potential reach ofchild care policy interventions, the eligible populationwas limited to 6.5 million of the 14.4 million preschool-aged children in the U.S. who use a child care facility. Itwas also assumed that only 73% of centers would complywith the policy, some states were assumed already to bein partial compliance with the policy, and children maynot attend each day of the year, leading to a smallerbenefitting population. However, the child care settingremains a promising vehicle for obesogenic behaviorchange. Existing infrastructure may be used to trainadministrators and monitor compliance at a low cost.The intervention may have additional spillover benefitsby changing social norms and preferences for healthyeating and sedentary behavior practices, making theintervention a favorable public health strategy.
LimitationsThis analysis was subject to limitations. The total impactof the intervention was estimated by summing theindependent effects of the beverage, physical activity,
www.ajpmonline.org
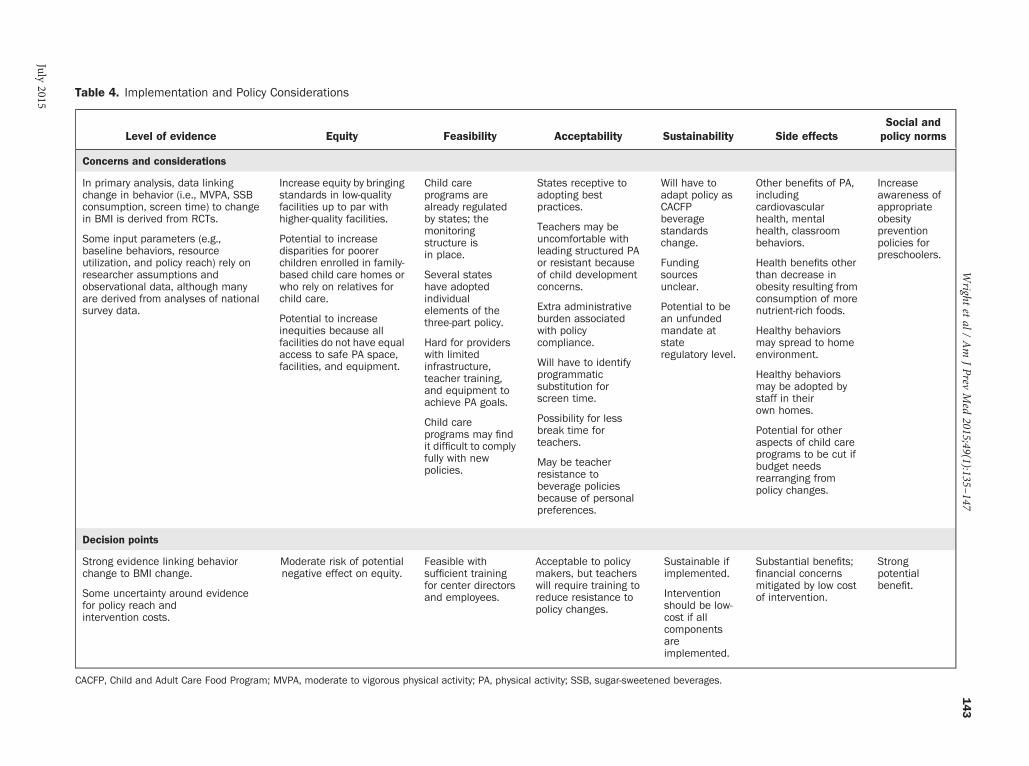
Table 4. Implementation and Policy Considerations
Level of evidence Equity Feasibility Acceptability Sustainability Side effectsSocial andpolicy norms
Concerns and considerations
In primary analysis, data linkingchange in behavior (i.e., MVPA, SSBconsumption, screen time) to changein BMI is derived from RCTs.
Some input parameters (e.g.,baseline behaviors, resourceutilization, and policy reach) rely onresearcher assumptions andobservational data, although manyare derived from analyses of nationalsurvey data.
Increase equity by bringingstandards in low-qualityfacilities up to par withhigher-quality facilities.
Potential to increasedisparities for poorerchildren enrolled in family-based child care homes orwho rely on relatives forchild care.
Potential to increaseinequities because allfacilities do not have equalaccess to safe PA space,facilities, and equipment.
Child careprograms arealready regulatedby states; themonitoringstructure isin place.
Several stateshave adoptedindividualelements of thethree-part policy.
Hard for providerswith limitedinfrastructure,teacher training,and equipment toachieve PA goals.
Child careprograms may findit difficult to complyfully with newpolicies.
States receptive toadopting bestpractices.
Teachers may beuncomfortable withleading structured PAor resistant becauseof child developmentconcerns.
Extra administrativeburden associatedwith policycompliance.
Will have to identifyprogrammaticsubstitution forscreen time.
Possibility for lessbreak time forteachers.
May be teacherresistance tobeverage policiesbecause of personalpreferences.
Will have toadapt policy asCACFPbeveragestandardschange.
Fundingsourcesunclear.
Potential to bean unfundedmandate atstateregulatory level.
Other benefits of PA,includingcardiovascularhealth, mentalhealth, classroombehaviors.
Health benefits otherthan decrease inobesity resulting fromconsumption of morenutrient-rich foods.
Healthy behaviorsmay spread to homeenvironment.
Healthy behaviorsmay be adopted bystaff in theirown homes.
Potential for otheraspects of child careprograms to be cut ifbudget needsrearranging frompolicy changes.
Increaseawareness ofappropriateobesitypreventionpolicies forpreschoolers.
Decision points
Strong evidence linking behaviorchange to BMI change.
Some uncertainty around evidencefor policy reach andintervention costs.
Moderate risk of potentialnegative effect on equity.
Feasible withsufficient trainingfor center directorsand employees.
Acceptable to policymakers, but teacherswill require training toreduce resistance topolicy changes.
Sustainable ifimplemented.
Interventionshould be low-cost if allcomponentsareimplemented.
Substantial benefits;financial concernsmitigated by low costof intervention.
Strongpotentialbenefit.
CACFP, Child and Adult Care Food Program; MVPA, moderate to vigorous physical activity; PA, physical activity; SSB, sugar-sweetened beverages.
Wright
etal/
Am
JPrev
Med
2015;49(1):135–147
143
July2015
Wright et al / Am J Prev Med 2015;49(1):135–147144
and screen time components of the intervention. Effectsfrom each component may not be independent, thus thisapproach may overestimate the total impact of policychanges on health. However, irrespective of expectedhealth benefits, there is evidence that improving thequality of child care programs can result in long-termsocial and welfare benefits. 73,74
State-level regulatory policies, but not actual facilitypractices, were considered when calculating the hypo-thetical impact of the intervention. Several states andlocal child care facilities have existing obesity preventionpolicies.22–24 Conversely, individual facilities in statesmay not be fully compliant with regulatory policies75 andparents may opt out of facility-provided meal plans.These micro-level differences in practices contribute touncertainty around modeled effectiveness estimates.Lastly, baseline compliance with CACFP standards,which already meet the proposed beverage policy stand-ards, among facilities that already receive CACFP fund-ing (approximately 61% of existing centers37,76) maymitigate some of the economic and health benefitsattributed to the beverage component of the interven-tion.15 Beverage consumption estimates from CACFPfacilities, which are mostly in compliance with theproposed beverage policy standards,77 were used insensitivity analyses (Appendix Section 1.4, availableonline). In the sensitivity analysis, the short-term costeffectiveness of the proposed intervention increased to$98.3 per BMI unit avoided from $57.8 per BMI unitavoided in the base case scenario. However, $98.3 perBMI unit avoided is still cost effective relative to otherchildhood obesity interventions.There are limitations related to the existing evidence.
Model inputs came from a variety of sources. Someeffectiveness estimates were derived from small, non-representative studies or were based on randomized trialsamong children slightly older than the preschool-agedchild target population. However, inputs are consistentwith other effectiveness estimates in the literature. Forinstance, the relationship between screen time and BMIwas the same in a randomized trial including preschool-aged children78 and the randomized trial includingelementary school-aged children that was used as aninput for the model.49 Base case beverage consumptionestimates for the model were derived from an observa-tional study in one state.26 Baseline estimates for theamount of PA time offered were derived from a self-report survey,29 and there is no consensus as to whetherincreased outdoor playtime consistently leads toincreased MVPA.79–81 Finally, the policy effectivenessestimates did not account for the fact that more healthfulbehavior changes in child care facilities may impactbehaviors outside of child care facilities. Therefore, the
effects shown here may be overestimated or under-estimated owing to positive spillover or negative com-pensating behaviors, respectively.Although changes in BMI associated with behavior
changes are supported by the published literature, thelink between policy implementation and actualexpected behavior change is less strong. Little existingevidence in the peer-reviewed literature links policychanges, as opposed to behavior changes, directly toBMI outcomes. However, the estimate that 73% offacilities would fully adopt any policy component thatwas used to translate policy changes to behaviorchanges is supported by the child care policy imple-mentation literature41 and is in line with other policyadherence estimates.44,82
Where direct evidence from published literature wasnot available, assumptions were made about inputs suchas the number of days per year a child attended a centerand the labor needed to administer the policy. However,many inputs were supported by evidence in the literature,and sensitivity and scenario analyses show results arefairly robust in terms of researcher assumptions.
ConclusionsThis paper models the anticipated the costs and effective-ness of a multi-component regulatory policy approach toencouraging healthy behaviors among children aged 2.5–5 years in the U.S. that use child care facilities. Imple-menting obesity prevention policies in child care settingsis likely to be cost effective relative to other childhoodobesity interventions, providing 10-year cost savings andhealth benefits.
This work was supported in part by grants from the RobertWood Johnson Foundation (66284), Donald and Sue PritzkerNutrition and Fitness Initiative, JPB Foundation, and is aproduct of a Prevention Research Center supported byCooperative Agreement U48/DP001946 from CDC, includingthe Nutrition and Obesity Policy Research and EvaluationNetwork. The findings and conclusions in this report are thoseof the author(s) and do not necessarily represent the officialposition of CDC. The authors would like to thank the membersof the Stakeholder Group for their contribution to the project.No financial disclosures were reported by the authors of
this paper.
References1. Skinner AC, Skelton JA. Prevalence and trends in obesity and severe
obesity among children in the United States, 1999-2012. JAMA Pediatr.2014;168(6):561–566. http://dx.doi.org/10.1001/jamapediatrics.2014.21.
www.ajpmonline.org
Wright et al / Am J Prev Med 2015;49(1):135–147 145
2. Mokdad AH, Ford ES, Bowman BA, et al. Prevalence of obesity,diabetes, and obesity-related health risk factors, 2001. JAMA. 2003;289(1):76–79. http://dx.doi.org/10.1001/jama.289.1.76.
3. Must A. Morbidity and mortality associated with elevated body weightin children and adolescents. Am J Clin Nutr. 1996;63(3 Suppl):445S–447S.
4. Skinner JD, Carruth BR, Wendy B, Ziegler PJ. Children's foodpreferences: a longitudinal analysis. J Am Diet Assoc. 2002;102(11):1638–1647. http://dx.doi.org/10.1016/S0002-8223(02)90349-4.
5. Pate RR, Baranowski T, Dowda M, Trost SG. Tracking of physicalactivity in young children. Med Sci Sports Exerc. 1996;28(1):92–96. http://dx.doi.org/10.1097/00005768-199601000-00019.
6. Certain LK, Kahn RS. Prevalence, correlates, and trajectory of tele-vision viewing among infants and toddlers. Pediatrics. 2002;109(4):634–642. http://dx.doi.org/10.1542/peds.109.4.634.
7. Craigie AM, Lake AA, Kelly SA, Adamson AJ, Mathers JC. Tracking ofobesity-related behaviours from childhood to adulthood: a systematicreview. Maturitas. 2011;70(3):266–284. http://dx.doi.org/10.1016/j.maturitas.2011.08.005.
8. Iruka I, PR C. Initial results from the 2005 NHES Early ChildhoodProgram Participation Survey. U.S. Department of Education. Wash-ington, DC: National Center for Education Statistics. nces.ed.gov/pubsearch/pubsinfo.asp?pubid=2006075. Published 2006. AccessedApril 16, 2015.
9. Position of the American Dietetic Association: benchmarks fornutrition programs in child care settings. J Am Diet Assoc. 2005;105(6):979–986. http://dx.doi.org/10.1016/j.jada.2005.04.015.
10. Nicklas TA, Baranowski T, Baranowski JC, Cullen K, Rittenberry L,Olvera N. Family and child-care provider influences on preschoolchildren's fruit, juice, and vegetable consumption. Nutr Rev. 2001;59(7):224–235. http://dx.doi.org/10.1111/j.1753-4887.2001.tb07014.x.
11. Story M, Kaphingst KM, French S. The role of child caresettings in obesity prevention. Future Child. 2006;16(1):143–168.http://dx.doi.org/10.1353/foc.2006.0010.
12. Finn K, Johannsen N, Specker B. Factors associated with physical activityin preschool children. J Pediatr. 2002;140(1):81–85. http://dx.doi.org/10.1067/mpd.2002.120693.
13. Baidal JA, Taveras EM. Childhood obesity: shifting the focus to earlyprevention. Arch Pediatr Adolesc Med. 2012;166(12):1179–1181.http://dx.doi.org/10.1001/2013.jamapediatrics.358.
14. Benjamin S. Preventing Obesity In The Child Care Setting: EvaluatingState Regulations. Durham, NC: Duke University; 2010.
15. Kaphingist K, Story M. Child care as an untapped setting for obesityprevention: state child care licensing regulations related to nutrition,physical activity, and media use for preschool-aged children in theUnited States. Prev Chronic Dis. 2009;6(1):A11.
16. Larson N, Ward DS, Neelon SB, Story M. What role can child-caresettings play in obesity prevention? A review of the evidence andcall for research efforts. J Am Diet Assoc. 2011;111(9):1343–1362.http://dx.doi.org/10.1016/j.jada.2011.06.007.
17. Cradock AL, O'Donnell EM, Benjamin SE, Walker E, Slining M. Areview of state regulations to promote physical activity and safety onplaygrounds in child care centers and family child care homes. J PhysAct Health. 2010;7(Suppl 1):S108–S119.
18. McWilliams C, Ball SC, Benjamin SE, Hales D, Vaughn A,Ward DS. Best-practice guidelines for physical activity at child care.Pediatrics. 2009;124(6):1650–1659. http://dx.doi.org/10.1542/peds.2009-0952.
19. National Policy & Legal Analysis Network to Prevent ChildhoodObesity. Model physical activity standards for child-care providers (forinfants through preschool-age children). 2010. http://www.dupagehealth.org/upload/forward_7.pdf.
20. American Academy of Pediatrics: The use and misuse of fruit juice inpediatrics. Pediatrics. 2001;107(5):1210–1213. http://dx.doi.org/10.1542/peds.107.5.1210.
July 2015
21. IOM. Early Childhood Obesity Prevention Policies: Goals, Recommen-dations, and Potential Actions. Washington, DC: IOM; 2011.
22. Tennesee Department of Health. The Gold Sneaker Initiative. health.state.tn.us/Goldsneaker/index.htm. 2011. Accessed April 16, 2015.
23. New York City Department of Mental Health and Hygiene. Part 1:Summary of new regulations on physical activity for group child careservices. www.nyc.gov/html/doh/downloads/pdf/cdp/DayCarePhysicalActivityGuidelines.pdf. Published 2010. Accessed April 16, 2015.
24. Chang DI, Gertel-Rosenberg A, Drayton VL, Schmidt S, Angalet GB. Astatewide strategy to battle child obesity in Delaware. Health Aff (Mill-wood). 2010;29(3):481–490. http://dx.doi.org/10.1377/hlthaff.2009.0742.
25. Tucker P. The physical activity levels of preschool-aged children:a systematic review. Early Child Res Q. 2008;23(4):547–558.http://dx.doi.org/10.1016/j.ecresq.2008.08.005.
26. Ball SC, Benjamin SE, Ward DS. Dietary intakes in North Carolinachild-care centers: are children meeting current recommendations?J Am Diet Assoc. 2008;108(4):718–721. http://dx.doi.org/10.1016/j.jada.2008.01.014.
27. Erinosho TO, Ball SC, Hanson PP, Vaughn AE, Ward DS. Assessingfoods offered to children at child-care centers using the HealthyEating Index-2005. J Acad Nutr Diet. 2013;113(8):1084–1089.http://dx.doi.org/10.1016/j.jand.2013.04.026.
28. Tandon PS, Zhou C, Lozano P, Christakis DA. Preschoolers' total dailyscreen time at home and by type of child care. J Pediatr. 2011;158(2):297–300. http://dx.doi.org/10.1016/j.jpeds.2010.08.005.
29. Tandon PS, Garrison MM, Christakis DA. Physical activity andbeverages in home- and center-based child care programs. J Nutr EducBehav. 2012;44(4):355–359. http://dx.doi.org/10.1016/j.jneb.2011.10.009.
30. Forster M, Veerman JL, Barendregt JJ, Vos T. Cost-effectiveness ofdiet and exercise interventions to reduce overweight and obesity. Int JObes (Lond). 2011;35(8):1071–1078. http://dx.doi.org/10.1038/ijo.2010.246.
31. Carter R, Vos T, Moodie M, Haby M, Magnus A, Mihalopoulos C.Priority setting in health: origins, description and application of theAustralian Assessing Cost-Effectiveness initiative. Expert Rev Pharma-coecon Outcomes Res. 2008;8(6):593–617. http://dx.doi.org/10.1586/14737167.8.6.593.
32. Gortmaker S, Long MW, Resch SC, et al. Cost effectiveness ofchildhood obesity interventions: evidence and methods for CHOICES.Am J Prev Med. 2015;49(1):102–111.
33. Tan-Torres Edejer T, Baltussen R, Adam T, et al., eds. Making Choicesin Health: WHO Guide to Cost-Effectiveness Analysis. Geneva: WHO;2003.
34. Finkelstein EA, Trogdon JG. Public health interventions for addressingchildhood overweight: analysis of the business case. Am J Public Health.2008;98(3):411–415. http://dx.doi.org/10.2105/AJPH.2007.114991.
35. Hall KD, Butte NF, Swinburn BA, Chow CC. Dynamics of childhoodgrowth and obesity: development and validation of a quantitativemathematical model. Lancet Diabetes Endocrinol. 2013;1(2):97–105. http://dx.doi.org/10.1016/S2213-8587(13)70051-2.
36. NAEYC Accreditation. Clarification on Groups activity packet.National Association for Education of Young Children; 2011.
37. National Association for Regulatory Administration. The 2007 ChildCare Licensing Study. Ann Arbor, MI: National Asociation forRegulatory Administration, and National Child Care Informationand Technical Assistance Center; 2009.
38. U.S. Census Bureau. 2012 National Population Projections: down-loadable files. Washington, D.C: U.S. Census Bureau, 2012. www.census.gov/population/projections/data/national/2012/downloadablefiles.html. Last updated Dec. 18, 2014. Accessed April 16, 2015.
39. Benjamin SE, Cradock A, Walker EM, Slining M, Gillman MW.Obesity prevention in child care: a review of U.S. state regulations.BMC Public Health. 2008;8:188. http://dx.doi.org/10.1186/1471-2458-8-188.
Wright et al / Am J Prev Med 2015;49(1):135–147146
40. National Resource Center for Health and Safety in Child Care andEarly Education. Individual states' child care licensure regulations.2011. http://nrckids.org/STATES/states.htm.
41. Ward DS, Benjamin SE, Ammerman AS, Ball SC, Neelon BH,Bangdiwala SI. Nutrition and physical activity in child care: resultsfrom an environmental intervention. Am J Prev Med. 2008;35(4):352–356. http://dx.doi.org/10.1016/j.amepre.2008.06.030.
42. de Ruyter JC, Olthof MR, Seidell JC, Katan MB. A trial of sugar-free orsugar-sweetened beverages and body weight in children. N Engl J Med.2012;367(15):1397–1406. http://dx.doi.org/10.1056/NEJMoa1203034.
43. Long MW, Gortmaker S, Ward Z, et al. Cost effectiveness of a sugar-sweetened beverage excise tax in the U.S. Am J Prev Med. 2015;49(1):112–123.
44. Williams CL, Carter BJ, Kibbe DL, Dennison D. Increasing physicalactivity in preschool: a pilot study to evaluate animal trackers. J NutrEduc Behav. 2009;41(1):47–52. http://dx.doi.org/10.1016/j.jneb.2008.03.004.
45. Raustorp A, Pagels P, Boldemann C, Cosco N, Soderstrom M,Martensson F. Accelerometer measured level of physical activityindoors and outdoors during preschool time in Sweden and the UnitedStates. J Phys Act Health. 2012;9(6):801–808.
46. Tandon PS, Saelens BE, Zhou C, Kerr J, Christakis D. Light sensors andGPS to differentiate indoor vs. outdoor physical activity in pre-schoolers at child care. Pediatric Academic Societies; Washington,DC; 2013.
47. McKenzie TL, Sallis JF, Elder JP, et al. Physical activity levels andprompts in young children at recess: a two-year study of a bi-ethnicsample. Res Q Exerc Sport. 1997;68(3):195–202. http://dx.doi.org/10.1080/02701367.1997.10607998.
48. Kriemler S, Zahner L, Schindler C, et al. Effect of school based physicalactivity programme (KISS) on fitness and adiposity in primaryschoolchildren: cluster randomised controlled trial. BMJ. 2010;340:c785. http://dx.doi.org/10.1136/bmj.c785.
49. Robinson TN. Reducing children's television viewing to prevent obesity:a randomized controlled trial. JAMA. 1999;282(16):1561–1567.http://dx.doi.org/10.1001/jama.282.16.1561.
50. Christakis DA, Garrison MM. Preschool-aged children's televisionviewing in child care settings. Pediatrics. 2009;124(6):1627–1632.http://dx.doi.org/10.1542/peds.2009-0862.
51. Powell LM, Isgor Z, Rimkus L, Chaloupka FJ. Sugar-sweetened beverageprices: estimates from a national sample of food outlets. Chicago:Bridging the Gap Program, Health Policy Center, Institute for HealthResearch and Policy, University of Illinois at Chicago; 2014.
52. Stoker R, Rourke J. Retail prices for whole milk and reduced fat (2%)milk: 2012 summary. Washington, DC: U.S. Department of Agricul-ture, Agricultural Marketing Service, 2012.
53. Factoring in bulk price of disposable cups. 2014. http://www.costco.com/Dart-Insulated-Foam-Cups-White-8oz-1%2c000ct.product.11140186.html.
54. Barrett JL, Gortmaker S, Long MW, et al. Cost effectiveness of anelementary school active physical education policy. Am J Prev Med.2015;49(1):148–159.
55. Taveras EM, Sandora TJ, Shih MC, Ross-Degnan D, Goldmann DA,Gillman MW. The association of television and video viewing with fastfood intake by preschool-age children. Obesity (Silver Spring). 2006;14(11):2034–2041. http://dx.doi.org/10.1038/oby.2006.238.
56. Zimmerman FJ, Bell JF. Associations of television content type andobesity in children. Am J Public Health. 2010;100(2):334–340.http://dx.doi.org/10.2105/AJPH.2008.155119.
57. Sonneville K, LongMW,Ward Z, et al. BMI and healthcare cost impactof eliminating tax subsidy for advertising unhealthy food to youth. AmJ Prev Med. 2015;49(1):124–134.
58. Gold M, Siegel J, Russell L, Weinstein MC. Cost-Effectiveness in Healthand Medicine. New York: Oxford University Press, 1996.
59. Bureau of Labor Statistics. Consumer Price Index. 2014. www.bls.gov/cpi/home.htm.
60. Bureau of Labor Statistics. Employer costs for employee compensation.Washington, DC: U.S. Department of Labor, 2014.
61. Hahn R. The potential economic impact of a U.S. excise tax on selectedbeverages: a report to the American Beverage Association. Washington,DC: Georgetown University, Center for Business and Public Policy;2009.
62. Dalziel K, Segal L. Point: uncertainty in the economic analysis of school-based obesity prevention programs: urgent need for quality evaluation.Obesity (Silver Spring). 2006;14(9):1481–1482. http://dx.doi.org/10.1038/oby.2006.169.
63. Drummond MF, Sculpher MJ, Torrance GW, O'Briend BJ, Stodart GL.Methods for the Economic Evaluation of Health Care Programmes, 3rded., New York: Oxford University Press, 2005.
64. Segal L, Dalziel K. Economic evaluation of obesity interventions inchildren and adults. Int J Obes (Lond). 2007;31(7):1183–1184 authorreply 1185.
65. Mo-suwan L, Pongprapai S, Junjana C, Puetpaiboon A. Effects of acontrolled trial of a school-based exercise program on the obesityindexes of preschool children. Am J Clin Nutr. 1998;68(5):1006–1011.
66. Reilly JJ, Kelly L, Montgomery C, et al. Physical activity to preventobesity in young children: cluster randomised controlled trial. BMJ.2006;333(7577):1041. http://dx.doi.org/10.1136/bmj.38979.623773.55.
67. Fitzgibbon ML, Stolley MR, Schiffer LA, et al. Hip-Hop to Health Jr.Obesity Prevention Effectiveness Trial: postintervention results. Obe-sity (Silver Spring). 2011;19(5):994–1003. http://dx.doi.org/10.1038/oby.2010.314.
68. Wang LY, Yang Q, Lowry R, Wechsler H. Economic analysis of aschool-based obesity prevention program.Obes Res. 2003;11(11):1313–1324.http://dx.doi.org/10.1038/oby.2003.178.
69. Brown HS III, Perez A, Li YP, Hoelscher DM, Kelder SH, Rivera R.The cost-effectiveness of a school-based overweight program. Int JBehav Nutr Phys Act. 2007;4:47. http://dx.doi.org/10.1186/1479-5868-4-47.
70. Janicke DM, Sallinen BJ, Perri MG, et al. Comparison of parent-only vsfamily-based interventions for overweight children in underservedrural settings: outcomes from Project STORY. Arch Pediatr AdolescMed. 2008;162(12):1119–1125. http://dx.doi.org/10.1001/archpedi.162.12.1119.
71. Wang LY, Gutin B, Barbeau P, et al. Cost-ffectiveness of a school-basedobesity prevention program. J Sch Health. 2008;78(12):619–624.http://dx.doi.org/10.1111/j.1746-1561.2008.00357.x.
72. Carter R, Moodie M, Markwick A, et al. Assessing cost-effectiveness inobesity (ACE-Obesity): an overview of the ACE approach, economicmethods and cost results. BMC Public Health. 2009;9:419.http://dx.doi.org/10.1186/1471-2458-9-419.
73. Muennig P, Schweinhart L, Montie J, Neidell M. Effects of aprekindergarten educational intervention on adult health: 37-yearfollow-up results of a randomized controlled trial. Am J PublicHealth. 2009;99(8):1431–1437. http://dx.doi.org/10.2105/AJPH.2008.148353.
74. Muennig P, Robertson D, Johnson G, Campbell F, Pungello EP,Neidell M. The effect of an early education program on adult health:the Carolina Abecedarian Project randomized controlled trial. Am JPublic Health. 2011;101(3):512–516. http://dx.doi.org/10.2105/AJPH.2010.200063.
75. Lessard L, Lesesne C, Kakietek J, et al. Measurement of compliancewith New York City's regulations on beverages, physical activity, andscreen time in early child care centers. Prev Chronic Dis. 2014;11:E183. http://dx.doi.org/10.5888/pcd11.130433.
76. Cooper R, Henchy G. Child and Adult Care Food Program: partic-ipation trends 2009. Washington, DC: Food Research and ActionCenter, 2009.
77. Ritchie LD, Boyle M, Chandran K, et al. Participation in the child andadult care food program is associated with more nutritious foods andbeverages in child care. Child Obes. 2012;8(3):224–229.
www.ajpmonline.org
Wright et al / Am J Prev Med 2015;49(1):135–147 147
78. Epstein LH, Roemmich JN, Robinson JL, et al. A randomized trial ofthe effects of reducing television viewing and computer use on bodymass index in young children. Arch Pediatr Adolesc Med. 2008;162(3):239–245. http://dx.doi.org/10.1001/archpediatrics.2007.45.
79. Alhassan S, Sirard JR, Robinson TN. The effects of increasing outdoorplay time on physical activity in Latino preschool children. Int J PediatrObes. 2007;2(3):153–158. http://dx.doi.org/10.1080/17477160701520108.
80. Sallis JF, Nader PR, Broyles SL, et al. Correlates of physical activity athome in Mexican-American and Anglo-American preschool children.Health Psychol. 1993;12(5):390–398. http://dx.doi.org/10.1037/0278-6133.12.5.390.
81. Cleland V, Crawford D, Baur LA, Hume C, Timperio A, Salmon J. Aprospective examination of children's time spent outdoors, objectively
July 2015
measured physical activity and overweight. Int J Obes (Lond). 2008;32(11):1685–1693. http://dx.doi.org/10.1038/ijo.2008.171.
82. Specker B, Binkley T, Fahrenwald N. Increased periosteal circum-ference remains present 12 months after an exercise intervention inpreschool children. Bone. 2004;35(6):1383–1388. http://dx.doi.org/10.1016/j.bone.2004.08.012.
Appendix
Supplementary data
Supplementary data associated with this article can be found athttp://dx.doi.org/10.1016/j.amepre.2015.03.016.