Embed Size (px)
Citation preview
JDMSOriginal article
1. IntroductionStudy on the movement of a fast-moving rigid body through a water column has wide scientific significance and technical application. The studies of the hydrodynamics involve the non-linear dynamics, body-fluid interaction, and instability theory. The body forces include the gravity and the buoyancy force. The hydrodynamic forces include the drag and lift forces that depend on the fluid-to-body velocity, impact force as the body penetrates the air–water interfaces, the Reynolds number, and the angle of attack (AOA) in the water column. Usually, a non-linear dynamical system is needed to predict the trajectory and orientation of a fast-moving rigid body in the water column.1–4
Recently, such a scientific problem drew attention to the naval research. This is due to the threat of mines in naval operations. Mines are prolific. Currently, there are over 50 countries possessing the capability to mine in the littoral zone. Of these, at least 30 countries have demonstrated production capability and 20 countries have attempted to export. Commercialization and foreign military sales
programs currently drive the abundance of mines. Because mines are flexible and relatively simple means of denying the use of an area, they are the perfect ‘fire and forget’ weapon. Within the past 20 years three U.S. ships, the USS Samuel B. Roberts (FFG-58), Tripoli (LPH-10), and Princeton (CG-59), have fallen victim to mines. Total ship damage was $125 million, while the mines cost approxi-mately $30,000.5 Water mines are characterized by three factors: position in the water (bottom, moored, rising, and
1NavalOceanAnalysisandPredictionLaboratory,NavalPostgraduateSchool,USA
2NavalSurfaceWarfareCenter,USA
Corresponding author:PeterCChu,NavalOceanAnalysisandPredictionLaboratory,DepartmentofOceanography,NavalPostgraduateSchool,Monterey,CA93943,USA.Email:[email protected]
JournalofDefenseModelingandSimulation:Applications,Methodology,Technology8(1)25–36©2011TheSocietyforModelingandSimulationInternationalDOI:10.1177/1548512910387807http://dms.sagepub.com
Modeling of Underwater Bomb Trajectory for Mine Clearance
Peter C Chu1, Jillene M Bushnell1, Chenwu Fan1 andKennard P Watson2
AbstractThefallingofaJointDirectAttackMunition(JDAM)throughawatercolumnwasmodeledusingasixdegreesoffreedommodel(calledSTRIKE35),whichcontainsthreecomponents:hydrodynamics,semi-empiricaldeterminationofthedrag/lift/torquecoefficients(dependingontheReynoldsnumberandtheangleofattack),andwatersurfacecharacteristics.Tovalidateandverifythismodel,threeunderwaterbombtrajectorytestswereconductedintheNavalAirWarfareCenter,WeaponsDivision(NAWC/WD)inthemiddleofIndianWellsValley,California.Duringthetest,several JDAMsweredroppedfromanairplaneintotwofrustumpondswiththesamebottomdiameterofapproximately30.5m,differentsurfacediameters (61m,79m), anddifferentdepths (7.6m,12.1m).High-speeddigital cameraswith light/pressuresensors,andaglobalpositioningsystemwereusedtorecordthelocationandorientationofJDAMs.Model–dataintercomparisonshowsthecapabilityofSTRIKE35,whichmayleadtoanewapproach(breachingtechnology)ofseamineclearanceinveryshallowwater(waterdepthlessthan12.2m,i.e.40ft).
KeywordsJoint DirectAttack Munition, Joint DirectAttack MunitionAssault Breaching System, semi-empirical drag/lift/torquecoefficients, six degrees of freedom underwater bomb trajectory model, Stand-offAssault BreachingWeapon FuzeImprovement,STRIKE35
26 Journal of Defense Modeling and Simulation: Applications, Methodology, Technology 8(1)
floating), method of delivery (aircraft, surface, subsurface), and method of actuation (acoustic and/or magnetic influ-ence, pressure, contacted, controlled). The U.S. Navy has developed operational models to predict the environmental parameters for mine burial prediction.6,7
Many options exist to neutralize mines, but all options have advantages and disadvantages. For example, the mine countermeasure ship (SMCM) is effective but slow and not suitable for a shallow water operation. The mine counter-measure airplane (AMCM) can tow the very capable sled (with the MK-103 through MK-106 installed) into shallow water, but is unable to work in low visibility or at night. The explosive ordnance disposal technicians are excellent, but their limitations come from fatigue, water temperatures, and water depth. Beyond the risk they are taking being in the water, if the water is murky enough to restrict vision, their risk increases. Marine mammals, although excellent at hunting mines and currently our only asset for detection of buried mines, do not neutralize mines due to the risk involved with handling explosives.8,9
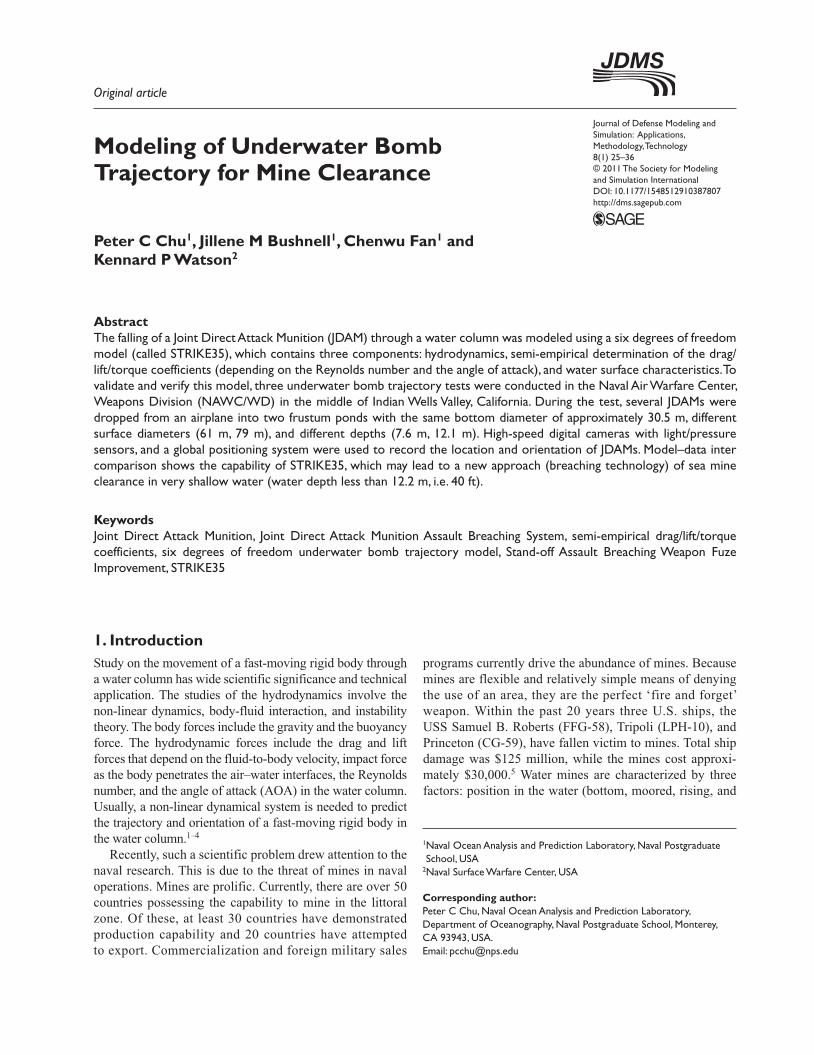
In order to reduce the risk to personnel and to decrease the sweep timeline without sacrificing effectiveness, a new concept has been developed to use the Joint Direct Attack Munition (JDAM, i.e. a ‘smart’ bomb guided to its target by an integrated inertial guidance system coupled with a global positioning system (GPS)) Assault Breaching System (JABS) for mine clearance (Figure 1). The JDAM accuracy, repeat-ability, and fuzing options make the JABS a prime contender for an interim capability. Combined with bomber range and payload capability, this weapon system vastly improves joint
operations, particularly the effectiveness of the JABS as a mine neutralizer in the surf and beach zones.10,11
The goal of this paper is to extend the capability demon-strated in the surf and beach zones to the very shallow water (VSW, i.e. water depth less than 12.2 m). Since the JDAM moves through the water column, prediction of its trajectory and orientation with certain accuracy is important. To do so, a six degrees of freedom (6-DOF) hydrodynamic model (called STRIKE35) was developed based on the results obtained by Chu et al.1, Chu and Fan,2,4 and Chu.3 The model results will be compared to the observational results obtained from the JDAM drop experiments.
The outline of this paper is as follows. Section 2 depicts the JDAM location and orientation in the earth-fixed coordinate system. Section 3 describes the dynamics of a 6-DOF model for predicting the JDAM’s location and orientation (i.e. the STRIKE35 model). Section 4 presents the Navy’s flight testing experiments for drop-ping JDAMs into the two ponds (water depths: 7.6 m, 12.2 m) in the Naval Air Warfare Center, Weapons Divi-sion (NAWC/WD), and observing the surface impact and bottom drift. Section 5 presents the sensitivity studies on the JDAM’s trajectory deviation. The conclusions are listed in Section 6.
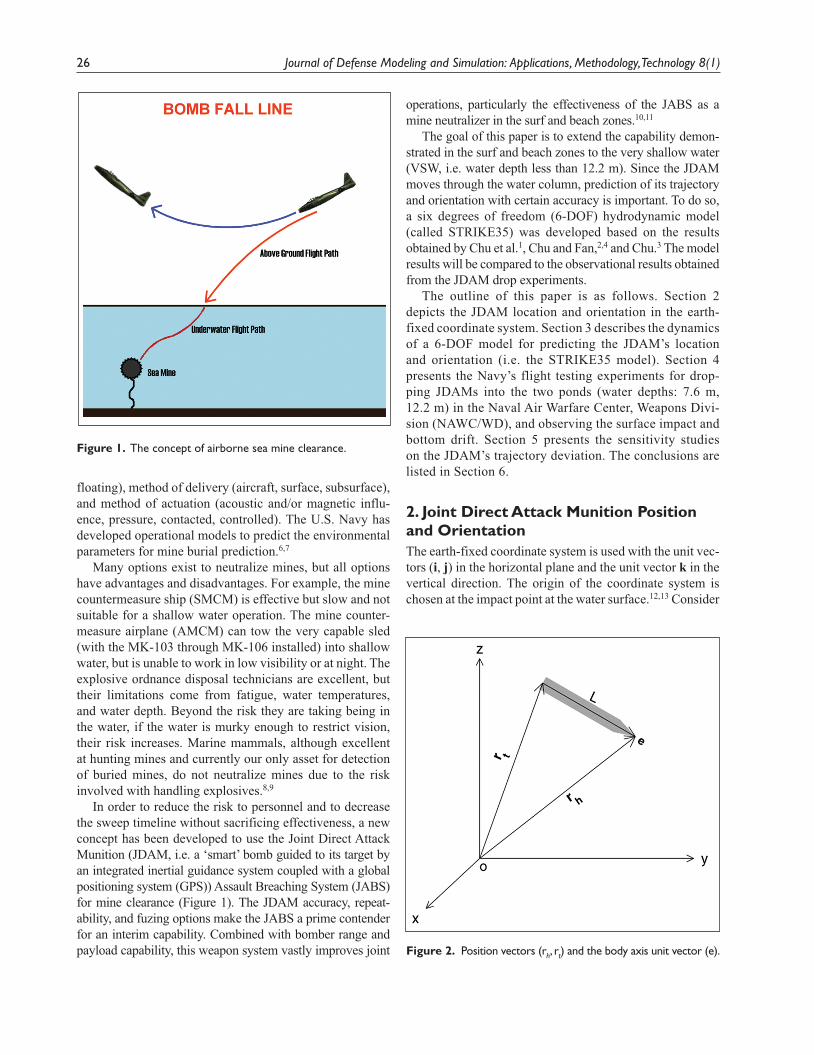
2. Joint Direct Attack Munition Position and OrientationThe earth-fixed coordinate system is used with the unit vec-tors (i, j) in the horizontal plane and the unit vector k in the vertical direction. The origin of the coordinate system is chosen at the impact point at the water surface.12,13 Consider
Figure 1.Theconceptofairborneseamineclearance.
Figure 2. Positionvectors(rh,rt)andthebodyaxisunitvector(e).

Chu et al. 27
an axially symmetric rigid body, such as a JDAM falling through a water column. The two end-points of the body (i.e. head and tail points) are represented by rh(t) and rt(t). The body’s main axis (Figure 2) direction is denoted by
er rr r
h t
h t
--= (1)
The centers of mass (om) and volume (ov) are located on the main axis with σ the distance between ov and om, which has a positive (negative) value when the direction from ov to om is the same (opposite) as the unit vector e (Figure 3). The location (or so-called translation) of the body is repre-sented by the position of om:
r(t) = xi +yj + zk (2)
The translation velocity is given by
,dtd Ur u u e u= = (3)
where (U, eu) are the speed and unit vector of the rigid-body velocity. Let β be the angle of the body’s main axis with the horizontal plane, γ be the angle of the body’s velocity u with the horizontal plane (or the so-called impact angle), and α be the AOA, which is the angle between the direction of the main body axis (e) and the direction of the body velocity (eu)
1 (Figure 3):
cos , sin , sine e e k e k 1 1 1u u: : :a b c= = =- - -] ] ]g g g (4)
Usually, the unit vector eu is represented by (Figure 4)
cos cos cos sin sine i j ku c c c= + + (5)
where ψ is the azimuth angle. Let Vw be the water velocity. The water-to-body relative velocity V (called the relative velocity) is represented by
V ≡ Vw –u ≈ –u = – Ueu (6)
Here, the water velocity is assumed to be much smaller than the rigid-body velocity. A third basic unit vector (eh
m) can be defined perpendicular to both e and eu:
ee ee eh
u
u
##=m (7)
3. A Six Degrees of Freedom Model (STRIKE35)3.1. Momentum EquationThe momentum equation of the rigid body is given by
mdtd nu F F F F Fg b d l c
f= + + + + (8)
where m is the mass of the rigid body,
,mg gF k F k g b- tP= = (9)
are the gravity and buoyancy force and P is the volume of the rigid body. Fd is the drag force on the non-tail part, which is in the opposite direction to the rigid-body velocity. Fl is the lift force on the non-tail part, which is in the plane constructed by the two vectors (e, eu) (i.e. perpendicular to e
hm) and perpendicular to eu, and therefore the lift force is in
the direction of e ehu#m . Both drag and lift forces, exerting
on the center of volume, are represented by
Fd = –fd eu (10)
Fl = flel, el = e ehu#m (11)Figure 3.Angles,centers,andforcesofthebomb.
Figure 4. Unitvectors( , , ,e e e e xyu
cu u u ).
28 Journal of Defense Modeling and Simulation: Applications, Methodology, Technology 8(1)
where fd and fl are the magnitudes of the forces. The magni-tudes (fd, fl) are represented by the drag law:
,f C A U f C A U21
21 2 2
d w l wt t= =ld (12)
where ρ is water density, Aw is the underwater projection area, and (Cd, Cl) are the drag and lift coefficients.13
A JDAM usually has four fins. Two fins in the same plane are called the pair of fins. The center of the fins is denoted by of. The distance between of and om (i.e. σf) with a positive (negative) value when the direction from of to om, is the same (opposite) as the unit vector e. For simplicity, these fins are treated approximately as the NACA0015 air-foils with known drag and lift coefficients. For example, they are listed at http://www.aerospaceweb.org/question/airfoils/q0150b.shtml. Using these coefficients, the com-bined drag and lift forces on a pair of fins ( f
cF ) can be calculated. If the bomb has n pairs of fins, the total drag and lift forces on the fins are represented by n f
cF .
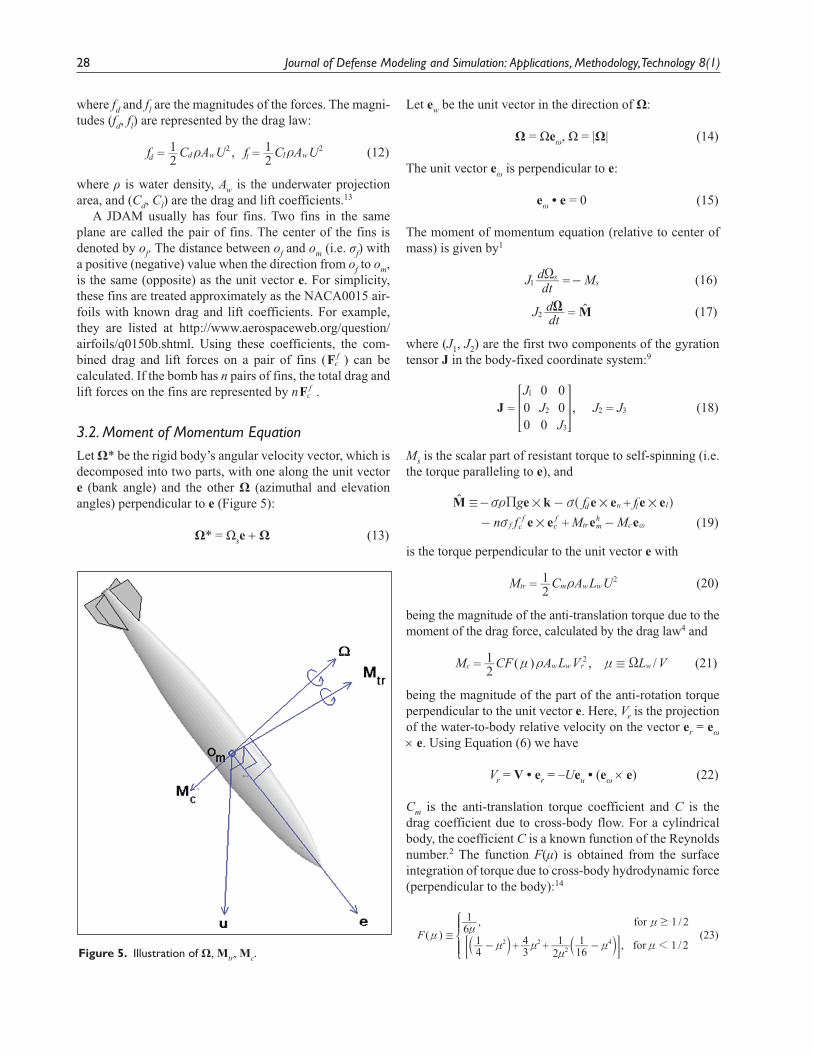
3.2. Moment of Momentum EquationLet Ω* be the rigid body’s angular velocity vector, which is decomposed into two parts, with one along the unit vector e (bank angle) and the other Ω (azimuthal and elevation angles) perpendicular to e (Figure 5):
Ω* = Ωse + Ω (13)
Let ew be the unit vector in the direction of Ω:
Ω = Ωeω, Ω = |Ω| (14)
The unit vector eω is perpendicular to e:
eω • e = 0 (15)
The moment of momentum equation (relative to center of mass) is given by1
Jdt
d M1s
s-X = (16)
Jdtd M2X = t (17)
where (J1, J2) are the first two components of the gyration tensor J in the body-fixed coordinate system:9
,J
JJ
J JJ 00
0
0
00
1
2
3
2 3= => H (18)
Ms is the scalar part of resistant torque to self-spinning (i.e. the torque paralleling to e), and
g f f
n f M M
M e k e e e e
e e e e
u l
ff f
trh
c
# # #
#
/- -
- -
vt v
v
P +
+ ~c m
d l
c
t ^ h (19)
is the torque perpendicular to the unit vector e with
M C A L U21 2
tr m w wt= (20)
being the magnitude of the anti-translation torque due to the moment of the drag force, calculated by the drag law4 and
( ) , /M CF A L V L V21 2
c w w r w/n t n X= (21)
being the magnitude of the part of the anti-rotation torque perpendicular to the unit vector e. Here, Vr is the projection of the water-to-body relative velocity on the vector er = eω × e. Using Equation (6) we have
Vr = V • er = –Ueu • (eω × e) (22)
Cm is the anti-translation torque coefficient and C is the drag coefficient due to cross-body flow. For a cylindrical body, the coefficient C is a known function of the Reynolds number.2 The function F(µ) is obtained from the surface integration of torque due to cross-body hydrodynamic force (perpendicular to the body):14
/1 2for $n
( ),
,F 6
1
41
34
21
161
2 22
4/
- -n
n
n nn
n+ + /1 2for 1nb bl l; E
Z
[
\
]]
]] (23)
Figure 5. IllustrationofΩ, Mtr, Mc.

Chu et al. 29
3.3. Semi-empirical Formulas for the Coefficients (Cd, Cl, Cm)
The drag/lift/torque coefficients should be given before running the 6-DOF model. Unfortunately, there are no existing formulae for a fast-moving rigid body (such as a JDAM) in a water column. The values of the coefficients depend on various physical processes, such as water sur-face penetration, super-cavitation, and bubble dynamics. A diagnostic-photographic method has been developed1 to get semi-empirical formulae for calculating the drag/lift/torque coefficients. This method contains two parts: diagnostic and photographic. The diagnostic part is to establish semi-empirical formulae for the drag, lift, and torque coefficients versus Reynolds number, AOA, and rotation rate. The photographic part15 is to collect data of trajectory and orientation of a fast-moving rigid body using multiple high-speed video cameras (10,000 Hz). Substitution of the digital photographic data into the diagnostic relationships leads to semi-empirical formu-las of drag/lift and torque coefficients with dependence on the Reynolds number (Re), AOA (α), and rotation rate (Ω):1
. .Re *Re . sinC e0 02 0 35 0 0082 2
0.2
d
2
iX= + +a r- - ba
lk (24)
. sin0 35
Re *Re
. sin .Re *Re sin
C 20 1 0 015
2if
1
0.2
2
20.85
l
2 2-
i r
i i a rX=
if #a] b
] b ]
g l
g l g
Z
[
\
]]
] (25)
. sin
ReRe *
. sinRe *ReC
0 07 22
0 02 22
if
0.2
m
#a a r
a r=if 2a
] b
] b
g l
g l
Z
[
\
]]
] (26)
Here, Re* = 1.8 × 10⁷ is the critical Reynolds number, and
2 2sign2.2 2.2 2.21
/ - - - -i r r r a r a]] ]g g g (27)
21
1.8i r
ra= b l , 2 2 12
0.7
-i rra= b l (28)
The semiempirical formulas in Equations (24)–(28) were obtained from several experiments conducted with a 1/12th-scale model of the general purpose bomb (Mk-84), with the fast-moving rigid body in a 6 m deep by 9 m diameter pool, located at the Stanford Research Institute (SRI)’s Corral Hollow Experiment Site. A gas gun was used to shoot the 1/12th-scale model Mk-84 bomb into the water tank with velocities up to 304 ms–1. Four types of Mk-84 model bombs were used, with a total 16 launches for the experiment: warhead with tail section and four fins, with tail section and two fins, with tail section and no fin, and with no tail section.16 In addition, data from a
similar bomb drop experiment conducted at the Naval Postgraduate School15,17 was also used for verification.
4. ExperimentsAs reported by Chu et al.,1 Ray,15 and Gefken,16 the 1/12th-scale model Mk-84 bomb moves at a high velocity through the water and flow separation creates a cavity of air around the body. That cavity then remains in the water long after the bomb has passed and causes two areas of concern. Firstly, will the trajectory remain stable, or will it tumble inside its own air cavity? Secondly, when the bomb does hit the cavitation wall, will the tail fins break? In addition, what happens to the trajectory after the fins break?
A program entitled ‘Stand-off Assault Breaching Weapon Fuze Improvement (SOABWFI)’ was developed and spon-sored by the Office of Naval Research to collect data to evaluate and measure the underwater trajectory deviation for JDAMs through 12.2 m (or shallower) of water during guided releases from an airplane (FA-18E/F). All weapons impacted the target ponds at approximately a 90° angle (i.e. perpendicular to the flat water surface). During the experi-ment, the surface impact point and the horizontal deviation in the trajectory after going through the water column were measured.18,19
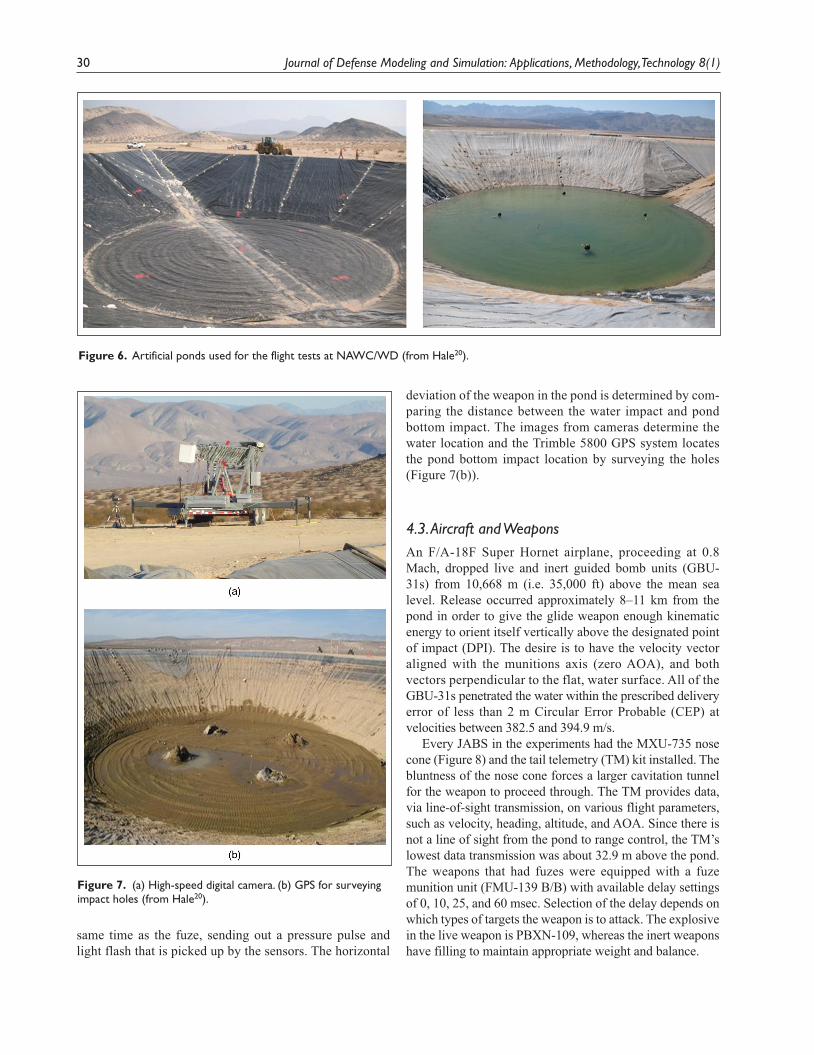
4.1. Test Ponds and TargetsTwo frustum ponds were created in the NAWC/WD in the middle of Indian Wells Valley, California for the experiment.20 Both ponds have a circular bottom with the same diameter of approximately 30.5 m and different sizes. The smaller pond is about 7.6 m deep and the larger is about 12.2 m deep. Sloping sides (2:1) create a surface diameter of roughly 61 m for the smaller pond and 79 m for the larger diameter. A ramp was built into the side of each pond for vehicle access. A plastic liner covers the dirt to contain the brackish water that is sup-plied by a 206 m deep, on-site well that filled both ponds at about 800 gallons per minute. Placed inside the water are fully operational, moored, foreign mines filled with simulant, instead of 2,4,6-trinitrotoluene (TNT) (Figure 6).
4.2. InstrumentationsHigh-speed digital cameras, light sensors, pressure sen-sors, and a GPS were used to collect the data. The range cameras capture 60 frames per second and the two Phantom cameras capture 1000 frames per second. These cameras recorded the location, speed, and orientation of the weapon at the time of water impact (Figure 7(a)). Using orthogonal images from the Phantom cameras, the water impact AOA can be observed. The light and pressure sensors provide the time and depth of detonation for the inert weapons equipped with a fuze and booster. The booster fires at the
30 Journal of Defense Modeling and Simulation: Applications, Methodology, Technology 8(1)
same time as the fuze, sending out a pressure pulse and light flash that is picked up by the sensors. The horizontal
deviation of the weapon in the pond is determined by com-paring the distance between the water impact and pond bottom impact. The images from cameras determine the water location and the Trimble 5800 GPS system locates the pond bottom impact location by surveying the holes (Figure 7(b)).
4.3. Aircraft and WeaponsAn F/A-18F Super Hornet airplane, proceeding at 0.8 Mach, dropped live and inert guided bomb units (GBU-31s) from 10,668 m (i.e. 35,000 ft) above the mean sea level. Release occurred approximately 8–11 km from the pond in order to give the glide weapon enough kinematic energy to orient itself vertically above the designated point of impact (DPI). The desire is to have the velocity vector aligned with the munitions axis (zero AOA), and both vectors perpendicular to the flat, water surface. All of the GBU-31s penetrated the water within the prescribed delivery error of less than 2 m Circular Error Probable (CEP) at velocities between 382.5 and 394.9 m/s.
Every JABS in the experiments had the MXU-735 nose cone (Figure 8) and the tail telemetry (TM) kit installed. The bluntness of the nose cone forces a larger cavitation tunnel for the weapon to proceed through. The TM provides data, via line-of-sight transmission, on various flight parameters, such as velocity, heading, altitude, and AOA. Since there is not a line of sight from the pond to range control, the TM’s lowest data transmission was about 32.9 m above the pond. The weapons that had fuzes were equipped with a fuze munition unit (FMU-139 B/B) with available delay settings of 0, 10, 25, and 60 msec. Selection of the delay depends on which types of targets the weapon is to attack. The explosive in the live weapon is PBXN-109, whereas the inert weapons have filling to maintain appropriate weight and balance.
Figure 6.ArtificialpondsusedfortheflighttestsatNAWC/WD(fromHale20).
Figure 7. (a)High-speeddigitalcamera.(b)GPSforsurveyingimpactholes(fromHale20).
Chu et al. 31
4.4 Underwater Trajectory TestsWhen a JDAM moves at a high speed through the water column, the flow separation creates a cavity of air around the body. That cavity, sometimes called cavitation, then remains in the water long after the bomb has passed and causes two areas of concern. Questions arise: Will the tra-jectory remain stable, or will it tumble inside its own air cavity? Will the tail fins break when the JDAM hits the cavitation wall? What happens to the trajectory after the fins break? The underwater trajectory tests (UTTs) were conducted, collecting data for the JDAM’s underwater location and trajectory in order to answer these questions. In addition, the data can be used to verify the Navy’s 6-DOF model (i.e. STRIKE35).
The first test (UTT-1) was conducted in the shallow pond (7.6 m water depth) by dropping four inert GBU-31s from the F/A-18E/F Super Hornet on 7 August 2008.20 The second test (UTT-2) was conducted in the deep pond (12.2 m water depth) by dropping two inert GBU-31s from the Super Hornet on 28 February 2009.21 A live fire demonstration of the JABS against mine-like (JV) targets (called LFFD-1) occurred at the shallow pond on 19 November 2008.22 The JDAM’s impact angle (γ), azimuth angle (ψ), as well as the location (x, y, z), were observed by the high-speed underwater video cameras mounted to the four towers. All together, there were four drops in UTT-1, one drop in LFFD-1, and two drops in UTT-2. Interested readers are referred to Ray15 and Chu et al.17,18 for detailed information about these tests.
When a JDAM penetrates the water surface with a certain impact angle (γ), the extrapolation of the velocity vector from the point of impact to the bottom represents the case without
considering the hydrodynamics of the water column. With the hydrodynamic effect of the water column, the JDAM will take the actual trajectory (Figure 9). The deviation, D, is the distance between the intersection of the extrapolated trajec-tory with the bottom, and the hole in the bottom made by the bomb. Measurements of the angle between the velocity vector and vertical, and the trajectory azimuth angle, are needed to correct for non-perpendicular impacts, that is, to extrapolate the velocity vector to the bottom.
All the three tests prove stability of the weapon to a cer-tain depth in the water column, regardless of tail or fin separation. They also show that the tail fins most likely do (and the tail section possibly does) not remain intact during the full descent to the pond’s bottom, regardless of the impact AOA. During UTT-1, no underwater video camera was used. During UTT-2, camera images strongly suggest that the first weapon’s tail impacted the cavity wall when the tail was about 1.5 m below the surface (the nose was around 5.5 m in depth), starting the process of breaking pieces off of the tail section, ultimately separating all four tail fins from the body. The second JADM also lost its fins. In the case of UTT-2 (2), the bomb penetrated the bottom at such a shallow angle that it was able to burrow under the pond liner, climb the North face of the pond wall for a dis-tance, re-enter the water traveling upward, and subsequently get airborne again. This is a strong indicator that the JDAM’s tail fins broke off far enough above the bottom of the pond to allow it to turn in the water. After dropping the JDAMs during UTT-1 and UTT-2, the ponds were drained. The trajectory deviation at the bottom (D) was observed.
During UTT-1, the pond was drained after four drops. There was evidence that at least two tail fins came off the weapons. During UTT-2, camera images are only available for the first drop. They strongly suggest the first weapon’s tail impacted the cavity wall when the tail was about 1.5 m below the surface, starting the process of breaking pieces off of the tail section, ultimately separating all four tail fins from the body.
Figure 8.TheMXU-735noseconeusedinSOABWFI(fromHale20).
Figure 9. JDAM’strajectorydeviationD(fromHale20).

32 Journal of Defense Modeling and Simulation: Applications, Methodology, Technology 8(1)
4.5 Data–Model Inter ComparisonDuring the two JDAM dropping tests, UTT-1 (1) and UTT-1 (4), the water entry conditions (water impact speed and AOA at the water surface) were not recorded. They are the initial conditions for running the 6-DOF model. Therefore, the model was integrated from the initial conditions listed in Table 1 for the five drops: UTT-1 (2), UTT-1 (3), UTT-2 (1), UTT-2 (2), and LFFD-1. Table 2 shows comparable values (less than 0.8 m) between observed and modeled trajectory deviation (D) at the bottom.
The Technology Transition Agreement (TTA) between the Office of Naval Research and the Navy states: ‘The weapon maintains a stable trajectory as it penetrates the water column. Trajectory deviation from the flight path angle (velocity vector) should not exceed 7 feet (approxi-mate) for water depths of 10-40 ft’. The statement in the TTA refers to the deviation in the flight path angle with specific reference to the velocity vector at water entry. Translation of this requirement into measurements needed
in the test program is illustrated in Figure 9. Measurements of the angle between the velocity vector and vertical, and the trajectory azimuth angle, are needed to correct for non-perpendicular impacts, that is, to extrapolate the velocity vector to the bottom. It should be noted that the TAA requirement made no mention of yaw and pitch angles – which are lumped together here and called the AOA.20 The JDAM drop experiments show the validity of the JABS for mine clearance in VSW (water depth less than 12.2 m) and the validity of STRIKE35 for JDAM’s location and trajectory in the water column.
5. Sensitivity Studies on the Trajectory DeviationThe JDAM drop experiments were costly and only seven drops were conducted. With the seven drops, it is hard to find the effect of water impact speed, AOA at the surface, and tail fin breaking on the JDAM’s trajectory deviation. For this challenge, we may fulfill this task using the 6-DOF model simulation, including tail fin breaking option.
5.1. Effect of Surface Impact ConditionTo investigate the effects of surface impact speed and AOA on the trajectory deviation, the 6-DOF model was integrated from the initial conditions consisting of varying surface impact speed (381.0–396.2 m/s) and AOA at the surface (1.0–3.4°). The water density is chosen as 1027 kg/m3 (char-acteristic value of sea water).23 In each case, the weapon’s fins immediately fall off when the nose reaches a depth of 3.3 m and the weapon travels to a depth of exactly 12.2 m (i.e. 40 ft water depth). The modeled trajectory deviation (D) at the bottom shows its high dependence on surface impact speed and AOA (Figure 10). All impact velocities, except 381 m/s, start out traversing the water with a pitch back trajectory. Between the impact AOA of about 1.1° and 1.9°, the weapon transitions to the single-curve trajectory style and remains within the TTA (i.e. D = 2.1 m). For above 2° AOA, the weapon experiences a flip-flop trajectory for all the surface impact speeds. The best case for remaining within the limits of the TTA for the greatest range of AOA are impact airspeeds of about 387.1–390.1 m/s, which allow an impact AOA of up to between 2.4° and 2.5°. The upper and lower limit of our sample, 381 and 396.2 m, both only allow up to 2.1° AOA before departing the margin (i.e. D = 2.1 m).
5.2. Effect of Fuze Delay TimeThe SOABWFI Flight Tests used the 10 msec delay on the FMU-139 fuze for the 7.6 m pond demonstrations (LFFD-1 and UTT-1) and the 25 msec delay for the 12.2 m pond dem-onstrations (UTT-2). The third delay, not used yet in the
Table 1. CharacteristicsoftheJDAMs’dropexperiments.Theyareusedasinitialconditionsforthe6-DOFmodel(i.e.STRIKE35).ItisnotedthattheinitialconditionsinUTT-1(1)andUTT-1(4)arenotcomplete.
JDAMdrop Waterimpactvelocity(m/sec)
Angleofattack(degree)atthewatersurface
UTT-1(1) Unknown 1.65UTT-1(2) 389.4 1.44UTT-1(3) 388.2 1.59UTT-1(4) 388.8 ≥1.91*UTT-2(1) 392.2 1.27UTT-2(2) 394.9 2.27LFFD-1 382.5 2.04
Table 2. ComparisonbetweenobservedandmodeledD values.ItisnotedthattheinitialconditionsinUTT-1(1)andUTT-1(4)arenotcomplete.TheSTRIKE35modelwasnotrunforthesetwocases.
JDAMdrop Trajectorydeviationatthebottom(m)observed
Trajectorydeviationatthebottom(m)modeled
UTT-1(1) 0.11UTT-1(2) 0.66 0.43UTT-1(3) 0.56 0.48UTT-1(4) 0.57UTT-2(1) 0.72 0.66UTT-2(2) 0.43 0.12LFFD-1 0.18 0.20
Chu et al. 33
SOABWFI program, is the 60 msec delay. This fuze also has a ±20% tolerance that can detonate the bomb within the time limits. The model is run at each delay setting, at its lower limit (delay time ×80%), and at its upper limit (delay time ×120%). The 6-DOF model was integrated with
time from the initial state (surface impact condition) to the fuze delay time using the inert GBU-31 JDAM con-figuration (tail section with four fins), and then from that time instance (the fuze delay time) to the bottom (i.e., 12.2 m) using the configuration with the tail and fins
Figure 10.WeapondisplacementversusAOAinahypotheticaloceanmixedlayer.
Figure 11.WeapondisplacementversusAOAfor10ms×(1±20%)delay.
34 Journal of Defense Modeling and Simulation: Applications, Methodology, Technology 8(1)
removed. For a delay time of 10 msec, the horizontal devia-tion at 12.2 m depth increases with the surface impact AOA almost monotonically. However, it is less than 1.8 m no matter what the surface impact speed or AOA, even with the upper bond (delay time × 120%) (Figure 11). For a delay
time of 25 msec, the horizontal deviation at 12.2 m depth increases generally with the surface impact AOA, and is less than 2.1 m in most cases, except for the upper bonds with the surface impact AOA of 5–6° (Figure 12). Although the lowest impact speed (381 m/s) has a greater
Figure 12.WeapondisplacementversusAOAfor25ms×(1±20%)delay.
Figure 13.WeapondisplacementversusAOAfor60ms×(1±20%)delay.

Chu et al. 35
deviation for the surface impact AOA less than 3°, the highest speed (396.2 m/s) always has the greatest variation and has the highest deviation for the surface impact AOA larger than 3°. For a delay time of 60 msec, the horizontal deviation at 12.2 m depth is larger than 2.1 m in almost all the cases (Figure 13). All of the surface impact speeds and AOAs up to 3° remain within about 8 m of the water impact point.
6. ConclusionsThe experimental and 6-DOF modeling studies address a problem related to stand-off breaching of mines in the surf zone, beach zone, and the beach exit zone. Current brea-ching capabilities are limited and extremely dangerous, requiring slow, deliberate human-intensive operations. In addition, current capabilities significantly fail to satisfy the operational requirements of the more demanding future battle-space, where the operational tempo will be much higher, the environmental conditions will remain just as challenging, and operations will be conducted under hostile fire.
The studies show the feasibility of using the JABS for mine clearance. The experiments include the seven JDAM drops from the F/A-18E/F Super Hornet to the two ponds (depths: 7.6 m, 12.2. m) in the NAWC/WD. The horizontal drift of the JDAM at the bottom (D) was established by draining the water after the drops and by underwater high-speed video cameras. The values of D vary from 0.11 to 0.72 m, which are within the TTA between the Office of Naval Research and the Navy (i.e. 2.1 m). This strongly suggests high efficiency of the JABS for mine clearance in VSW (depth less than 12.2 m). The 6-DOF model (i.e. STRIKE35) with the same water impact conditions as in the experiments leads to comparable results as obtained from the experiments. This also confirms the validity of the 6-DOF model in prediction of JDAM’s location and tra-jectory in the water column. Preliminary model–data inter comparison shows the capability of STRIKE35, which may lead to a new approach of sea mine breaching technology in VSW.
Dependence of the effects of surface impact speed, AOA, and the fuze delay time on the horizontal drift at the water depth of 12.2 m was investigated using the 6-DOF model. It was found that surface impact speed has little bearing on the overall horizontal trajectory of the weapon from the water impact point. However, the surface AOA has a larger effect. Within the horizontal drift margin (i.e., 2.1 m), the impact AOA may change from 0° to 10° using the 10 msec fuze delay, but only varies from 0° to 4° using the 25 msec fuze delay for the whole water column. For a large fuze delay time (such as 60 msec), the horizontal deviation at 12.2 m depth is much larger than the criterion (i.e. 2.1 m).
Preliminary model–data inter comparison shows the capa-bility of STRIKE35, which may lead to a new approach of sea mine breaching technology in VSW. However, mines and obstacles are deployed in such dynamic environments that experience significant tides. Dynamic boundaries between the beach, the surf zone, and cluttered background make the detection very difficult. In the surf zone, sediment transport rates are high, and significantly affect mine detection condi-tions. The three-dimensional circulation in the surf zone is driven primarily by breaking waves. Sediment movement associated with oscillatory and quasi-steady currents often is strong enough to produce significant changes in the seafloor morphology. The changing bathymetry in turn affects the three-dimensional near-shore circulation. This occurs by creating spatial variability in the intensity of waves breaking and by modifying the bottom roughness. These factors should be taken into account in future studies.
Acknowledgment
The Office of Naval Research Breaching Technology Program (Grant Number: N0001410WX20165, Program Manager: Brian Almquist) supported this study.
7. References
1. Chu, PC, Fan CW and Gefken PR. Diagnostic-photographic determination of drag/lift/torque coefficients of high speed rigid body in water column. ASME J Appl Mech 2010; 77: 011015-1–011015-15.
2. Chu PC and Fan CW. Prediction of falling cylinder through air-water-sediment columns. AMSE J Appl Mech 2006; 73: 300–314.
3. Chu PC. Mine impact burial prediction from one to three dimensions. ASME Appl Mech Rev 2009; 62: 010802.
4. Chu PC and Fan CW. Mine impact burial model (IMPACT35) verification and improvement using sediment bearing factor method. IEEE J Ocean Eng 2007; 32: 34–48.
5. Boorda JM, ADM and USN. ‘CSS Mine Countermeasures CNO White Paper: Mine Countermeasures - An Integral Part of Our Strategy and Our Forces’ (circa 1996, accessed 9 July 1999).
6. Elmore PA, Wilkens R, Weaver T and Richardson MD. IMPACT 28 and 35 Simulations of 2003 Baltic Sea Cruise: Model Results and Comparison with Data. In: Fifth Annual ONR Workshop on Mine Burial Prediction, Kona, HI, 31 January–2 February, 2005.
7. Chu PC and Ray G. Prediction of high speed rigid body maneuvering in air-water-sediment columns. Adv Fluid Mech 2006; 6: 123–132.
8. Bruhn D. Wooden ships and iron men: the U.S. Navy’s ocean minesweepers, 1953-1994. Westminster, MD: Heritage Books, Inc., 2007, p.368.
9. Naval Studies Board. Naval mine warfare: operational and technical challenges for naval forces. Washington, DC: National Academy Press, 2001, p.218.

36 Journal of Defense Modeling and Simulation: Applications, Methodology, Technology 8(1)
10. Almquist B. Assault breaching system technologies. In: East Coast Amphibious and Mine Countermeasure Workshop, Panama City, FL, 9–10 September 2008.
11. Almquist B and McLaughlin T. Assault breaching system technologies. In: Proceedings of the 99th Annual Science and Engineering Annual Technology Conference/DoD Tech Exposition, Charleston, SC, 15–17 April 2008.
12. Chu PC, Fan CW, Evans AD and Gilles A. Triple coordi-nate transforms for prediction of falling cylinder through the water column. ASME J Appl Mech 2004; 71: 292–298.
13. Chu PC and Fan CW. Pseudo-cylinder parameterization for mine impact burial prediction. ASME J Fluids Eng 2005; 127: 1515–1520.
14. Rouse H. Fluid mechanics for hydraulic engineers. New York: McGraw-Hill, 1938.
15. Ray G. Bomb strike experiments for mine clearance opera-tions. MS Thesis in Meteorology and Physical Oceanography. Monterey, CA: Naval Postgraduate School, 2006. p.197.
16. Gefken PR. Evaluation of precision-guided bomb trajectory through water using scale-model experiments. SRI Final Technical Report No. PYU-16600, 2006, p.50.
17. Chu PC, Gilles A and Fan CW. Experiment of falling cylin-der through the water column. Exp Therm Fluid Sci 2005; 29: 555–568.
18. Chu PC, Almquist JB, Gefken P and Watson K. Underwater bomb trajectory prediction for stand-off assault breach-ing weapon fuse improvement (SOABWFI). In: European Undersea Defense Technology – Europe, Carnes, France, 9–11 June 2009.
19. Watson K, Makarsky J, Powell M and Goeller J. Flight test to determine underwater stability of a precision guided
weapon for use in mine clearance. In: 11th Joint Classified Bombs/Warheads & Ballistics Symposium, Monterey, CA, 3–6 August 2009.
20. Hale JS. Stand-off assault breaching weapon fuze improve-ment (SOABWFI) underwater trajectory test - 1 (UTT-1). Boeing Report, No. 09J0059, 2009, p.33.
21. Crussel R. Stand-off assault breaching weapon fuze improve-ment (SOABWFI) underwater trajectory test - 2 (UTT-2). Boeing Report, No. 09J0142, 2009, p.13.
22. Crussel R. Stand-off assault breaching weapon fuze improve-ment (SOABWFI) live fire flight demonstration -1 (LFFD-1). Boeing Report, No. 09J0078, 2009, p.35.
23. Bushnell JM. 2009. Tail separation and density effects on the underwater trajectory of the JDAM. MS Thesis in Meteorology and Physical Oceanography. Monterey, CA: Naval Postgraduate School, p.83.
Author Biographies
Peter C Chu is a full professor and head of the Naval Ocean Analysis and Prediction Laboratory at the U. S. Naval Postgraduate School.
Jillene M Bushnell is a Lieutenant Commander (USN) at the U. S. Naval Postgraduate School.
Chenwu Fan is an oceanographer at the Naval Ocean Analysis and Prediction Laboratory, the U. S. Naval Postgraduate School.
Kennard P Watson is an engineer, at the Naval Surface War-fare Center, Integration and Experimentation Branch (HS15).