Embed Size (px)
Citation preview
Modelling of building physics on building and component level 36
BauSIM 2020 September 23-25, Online Conference DOI: 10.3217/978-3-85125-786-1-03 © Creative Commons BY-NC-ND
MODELING OF SOLAR RADIATION TRANSMISSION THROUGH TRIPLE GLAZING BASED ONLY ON ON-SITE MEASUREMENTS
F. Veynandt1 and C. Heschl1
1Fachhochschule Burgenland GmbH, Eisenstadt, Austria
ABSTRACT A model is developed which can calculate the irradiance behind a glazed façade, based on measured incident solar radiation. Data from a real office building is used to establish and test the model. On-site irradiance measurements on both sides of the facades are exploited to calibrate the model. The main parameters are the average diffuse transmittance and a correlation for the direct transmittance, as a function of the incidence angle. Correction of the measurements, including the frame reflection, are taken into account. Hence, the model contributes to the solar heat flux identification, in the perspective of model predictive control application.
INTRODUCTION To achieve the transition to a sustainable and decarbonized society, low energy buildings with grid friendly operating control strategies are needed. Model Predictive Control (MPC) is an interesting approach tackling these challenges (Serale et al. 2018). With information on energy supply (renewable energy available, market price) and energy demand forecast (needs of the building), an MPC system can optimize the operation of the building by making the most of the demand side flexibility. MPC requires a model to predict the energy consumption of the building under consideration of the thermal comfort constraints. This model can be established based on construction data and operation history. To model the physical behavior of the building, the relevant heat fluxes must be identified. In particular for buildings with a high share of glazed façades, understanding and modelling the solar irradiance balance through glazed elements is strategic.
Several approaches are possible to model the optical behavior of a glazing, which can be classified into detailed and simplified models (Rubin et al 1999). Detailed physical models involve the optical properties of each panes or elements of the glazed façade. This approach enables the modeling of complex fenestration systems, including coatings and shading (Laouadi et al. 2007). Laboratory measurements or detailed data from manufacturer are required. In the mentioned classification, simplified models can be empirical, semi-empirical, monolithic or thin-film models. A single thin-film model reduces the glazing to three parameters, possibly spectrally
defined (Maestre et al. 2007). The parameters are identified from spectral measurements at normal incidence angle. Additional models extend normal measurement data to any incidence angle (Roos et al. 2001). In an existing building, measurements from real operation can be obtained and an empirical approach is suitable.
In the present study, an office building with a three pane glazing façade is investigated. Measurement in real operation are used to characterize the façade with an empirical model. This work supports the development of an MPC control system for this building.
BUILDING AND INSTRUMENTATION The living-lab Energetikum is an office building equipped with extensive sensor technology to monitor in details the behavior of the building. Several technologies are also implemented in the building: heating, cooling, ventilation, shading, as well as energy production and storage. This offers many opportunities for experimenting and learning on these technologies.
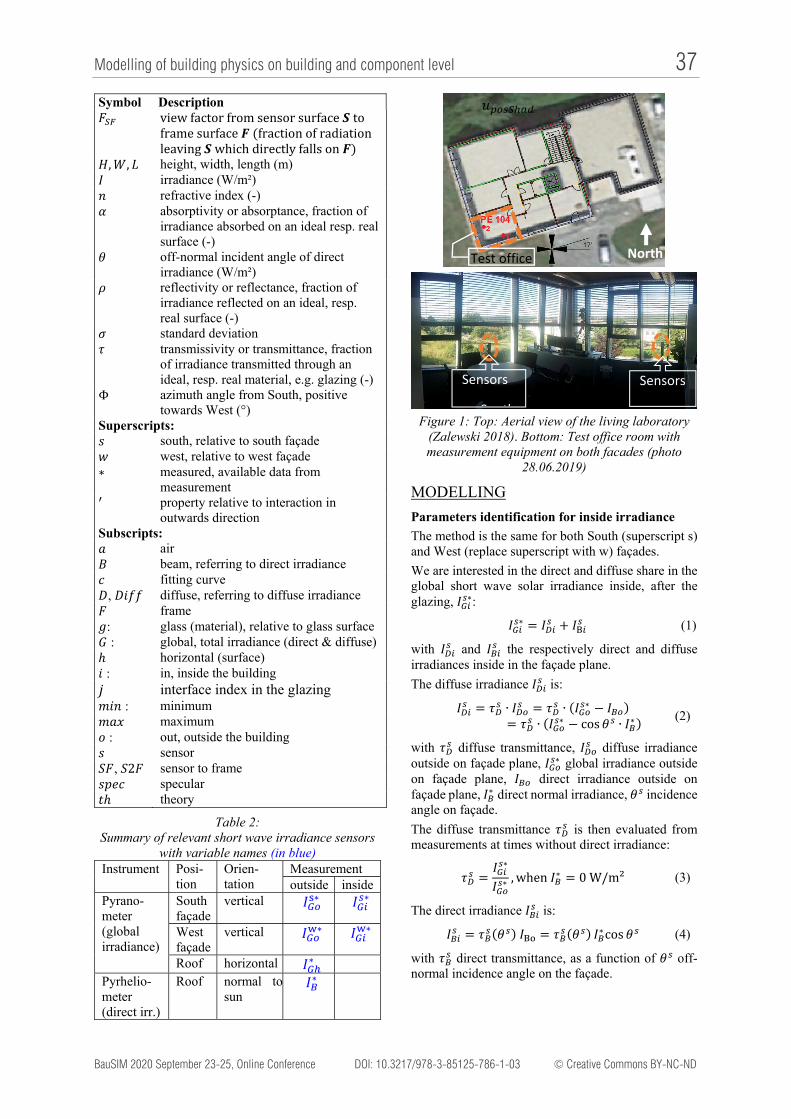
The South and West façades are entirely covered with triple-pane glazing. According to information obtained from the manufacturer, the first and third panes have a low-emissivity coating on the inner side of the glazing. The glazing has an expected solar transmittance of 38 % and solar heat gain coefficient of 50 %. The adjustable slat blinds are not analysed in this paper. Figure 1 gives a view of the building from outside and of the room under study from inside. Details about the building and the irradiance monitoring equipment are described in a separate report (Zalewski 2018). Table 1 lists all symbols used in the following.
To offer a solution for the case when no detailed information about the glazing is available, we develop a measurement based model. Data from one year monitoring period is used for the analysis: from 8 June 2018 to 7 June 2019. Table 2 presents the relevant shortwave irradiance sensors for the façade analysis.
Table 1: List of symbols
Symbol Description 𝑎, 𝑏, 𝑐, 𝑑, 𝑒
parameters of the fitting curve
Modelling of building physics on building and component level 37
BauSIM 2020 September 23-25, Online Conference DOI: 10.3217/978-3-85125-786-1-03 © Creative Commons BY-NC-ND
Symbol Description 𝐹 view factor from sensor surface 𝑺 to
frame surface 𝑭 fraction of radiation leaving 𝑺 which directly falls on 𝑭
𝐻, 𝑊, 𝐿 height, width, length (m) 𝐼 irradiance (W/m²) 𝑛 refractive index (-) 𝛼 absorptivity or absorptance, fraction of
irradiance absorbed on an ideal resp. real surface (-)
𝜃 off-normal incident angle of direct irradiance (W/m²)
𝜌 reflectivity or reflectance, fraction of irradiance reflected on an ideal, resp. real surface (-)
𝜎 standard deviation 𝜏 transmissivity or transmittance, fraction
of irradiance transmitted through an ideal, resp. real material, e.g. glazing (-)
Φ azimuth angle from South, positive towards West (°)
Superscripts: 𝑠 south, relative to south façade 𝑤 west, relative to west façade ∗ measured, available data from
measurement ′ property relative to interaction in
outwards direction Subscripts: 𝑎 air 𝐵 beam, referring to direct irradiance 𝑐 fitting curve 𝐷, 𝐷𝑖𝑓𝑓 diffuse, referring to diffuse irradiance 𝐹 frame 𝑔: glass (material), relative to glass surface𝐺 : global, total irradiance (direct & diffuse)ℎ horizontal (surface) 𝑖 : in, inside the building 𝑗 interface index in the glazing 𝑚𝑖𝑛 : minimum 𝑚𝑎𝑥 maximum 𝑜 : out, outside the building 𝑠 sensor 𝑆𝐹, 𝑆2𝐹 sensor to frame 𝑠𝑝𝑒𝑐 specular 𝑡ℎ theory
Table 2: Summary of relevant short wave irradiance sensors
with variable names (in blue) Instrument Posi-
tion Orien-tation
Measurement outside inside
Pyrano-meter (global irradiance)
South façade
vertical 𝐼 ∗ 𝐼 ∗
West façade
vertical 𝐼 ∗ 𝐼 ∗
Roof horizontal 𝐼∗ Pyrhelio-meter (direct irr.)
Roof normal to sun
𝐼∗
Figure 1: Top: Aerial view of the living laboratory
(Zalewski 2018). Bottom: Test office room with measurement equipment on both facades (photo
28.06.2019)
MODELLING
Parameters identification for inside irradiance
The method is the same for both South (superscript s) and West (replace superscript with w) façades.
We are interested in the direct and diffuse share in the global short wave solar irradiance inside, after the glazing, 𝐼 ∗:
𝐼 ∗ 𝐼 𝐼 (1)
with 𝐼 and 𝐼 the respectively direct and diffuse irradiances inside in the façade plane.
The diffuse irradiance 𝐼 is:
𝐼 𝜏 ∙ 𝐼 𝜏 ∙ 𝐼 ∗ 𝐼𝜏 ∙ 𝐼 ∗ cos 𝜃 ∙ 𝐼∗
(2)
with 𝜏 diffuse transmittance, 𝐼 diffuse irradiance outside on façade plane, 𝐼 ∗ global irradiance outside on façade plane, 𝐼 direct irradiance outside on façade plane, 𝐼∗ direct normal irradiance, 𝜃 incidence angle on façade.
The diffuse transmittance 𝜏 is then evaluated from measurements at times without direct irradiance:
𝜏𝐼 ∗
𝐼 ∗ , when 𝐼∗ 0 W/m² (3)
The direct irradiance 𝐼 is:
𝐼 𝜏 𝜃 𝐼 𝜏 𝜃 𝐼∗ cos 𝜃 (4)
with 𝜏 direct transmittance, as a function of 𝜃 off-normal incidence angle on the façade.
𝑢
NorthTest office
Sensors
S th
Sensors
Modelling of building physics on building and component level 38
BauSIM 2020 September 23-25, Online Conference DOI: 10.3217/978-3-85125-786-1-03 © Creative Commons BY-NC-ND
The direct transmittance 𝜏 can be evaluated from measurements in function of the incidence angle 𝜃 , combining equations (1, (2 and (4:
𝜏 𝜃𝐼 ∗ 𝜏 ∙ 𝐼 ∗ cos 𝜃 ∙ 𝐼∗
cos 𝜃 ∙ 𝐼∗ (5)
In this way, the transmittances 𝜏 and 𝜏 𝜃 are identified from measurement. Assuming isotropic transmission, the position of the sun relative to the façade can be characterized by the incidence angle 𝜃 , which is calculated from the orientation of the façade and the time and date of the year. The solar position is calculated with a simple algorithm, precise enough for engineering calculations (Duffie et al. 2006, p. 10-15).
Local effects on sensors
The value measured from a sensor gives a punctual information, while the integrated information over the entire glazing surface is of interest for the energy balance in the building. Local variations are mainly due to: (i) the sensor position and orientation; (ii) shading from the horizon, when elevation angle is low, and from the frame, when the angle of incidence is high; (iii) reflection on the frame, causing higher irradiance on the sensor; (iv) partially drawn shutters, so the sensor indicates either the shaded part or the non-shaded part situation; (v) errors inherent to the sensor technology. For the latter, high quality pyranometers (SMP10 from Kipp&Zonen) are used, which keeps measurement errors from the sensors very low. For example, the directional response for beam radiation has less than 10 W/m² deviation from the theoretical cosine law for up to 80° inclination with 1000 W/m² irradiance at normal incidence. The influence of shutters is not analysed in this paper. We focus here on the first three aspects, which are detailed hereafter in this section.
Sensor position and orientation
The orientation of the sensor, if not exactly parallel to the façade, causes a systematic error. The position and orientation of the sensors have been checked through direct measurements, as well as through post-processing the measurement data. In the daily irradiance profiles, misalignment creates a systematic shift of the measurement in comparison to the recalculated irradiance from global horizontal measurement and geometrical parameters for position and orientation. The best fit is obtained for the actual position of the sensor. If the building orientation is known like in our case, a correction of the possible misalignment of the sensors is achieved (-0.5 to -3.5° in our case). If the orientation of the building is not known, this approach enables the determination of the façade orientation purely from measurement data analysis.
Shading from the horizon and from the frame
The horizon angular height has also been derived from measurements, observing at which angle a practically
shut down of direct irradiance occurs (0° on South, 4.5° on West).
Shading from the frame also cuts the direct irradiance from the sensor, but solar irradiance continues to enter the building. This has to be taken into account when the actual solar gains in the room are calculated (out of the scope of this paper). The maximum incidence angle for the sensor to receive light from the sun is expressed in terms of relative azimuth. The upper and lower limits on relative azimuth Φ for which direct irradiance is measured from the sensors are: 76.7°Φ 68.2° and 71.4° Φ 35.7°, respectively on South and West façade.
Reflection from the frame
The frame reflectance is taken into account on the West façade. This has a significant impact only on the sensor from this façade, because it is close to the side of the window. The direct irradiance reflecting on the frame in diffuse and specular ways increases the irradiance on the inside sensor. A simple model can describe this effect, considering the reflectance of the frame painting in two components: specular reflectance (𝜌 0° 0.1 for normal incidence angle and 𝜌 90° 1, following Fresnel laws) and diffuse reflectance (𝜌 0.8 isotropic) (see ALUCOBOND ARCHITECTURAL material properties data base).
Diffuse reflectance is mainly –and here exclusively considered– as due to diffuse reflection of direct solar radiation:
𝜌 𝐹 𝜌 (6)
with 𝐹 the view factor from the sensor to the northern-side frame. The view factor 𝐹 of the glazing frame from the sensor can be calculated using the formula for a patch to rectangular plate in perpendicular configuration [see catalogue of view factors: (Modest Michael 2013, 1)]:
From small planar patch at 90º to rectangular plate of sides H=0.18m and W=1m at a separation L=0.185m,
with ℎ , 𝑒 , 𝑧 √ℎ 𝑒 :
𝐹1
2πtan
1𝑒
𝑒𝑧
tan1𝑧
(7)
For the sensor on the West façade: 𝐹 0.0705
Specular reflectance depends on the sun position:
𝜌 𝜌 𝑖𝑓 Φ Φ Φ𝜌 0 𝑜𝑡ℎ𝑒𝑟𝑤𝑖𝑠𝑒
(8)
with Φ the relative azimuth of the sun on the facade within its limits [Φ ; Φ ].
The irradiance from the diffuse and specular reflection of direct irradiance on the frame is then transmitted through the glazing and accounts for an additional factor 𝜏 _ to correct the measured transmittance 𝜏 ∗
Modelling of building physics on building and component level 39
BauSIM 2020 September 23-25, Online Conference DOI: 10.3217/978-3-85125-786-1-03 © Creative Commons BY-NC-ND
on the sensor from the actual glazing transmittance 𝜏 :
𝜏 ∗ 𝜏 𝜏 _ (9)
with:
𝜏 _ 𝜌 𝜏 𝜌 𝜏 (10)
The actual glazing transmittance can then be expressed as follow:
𝜏𝜏 ∗ 𝐹 𝜌
1 𝜌 (11)
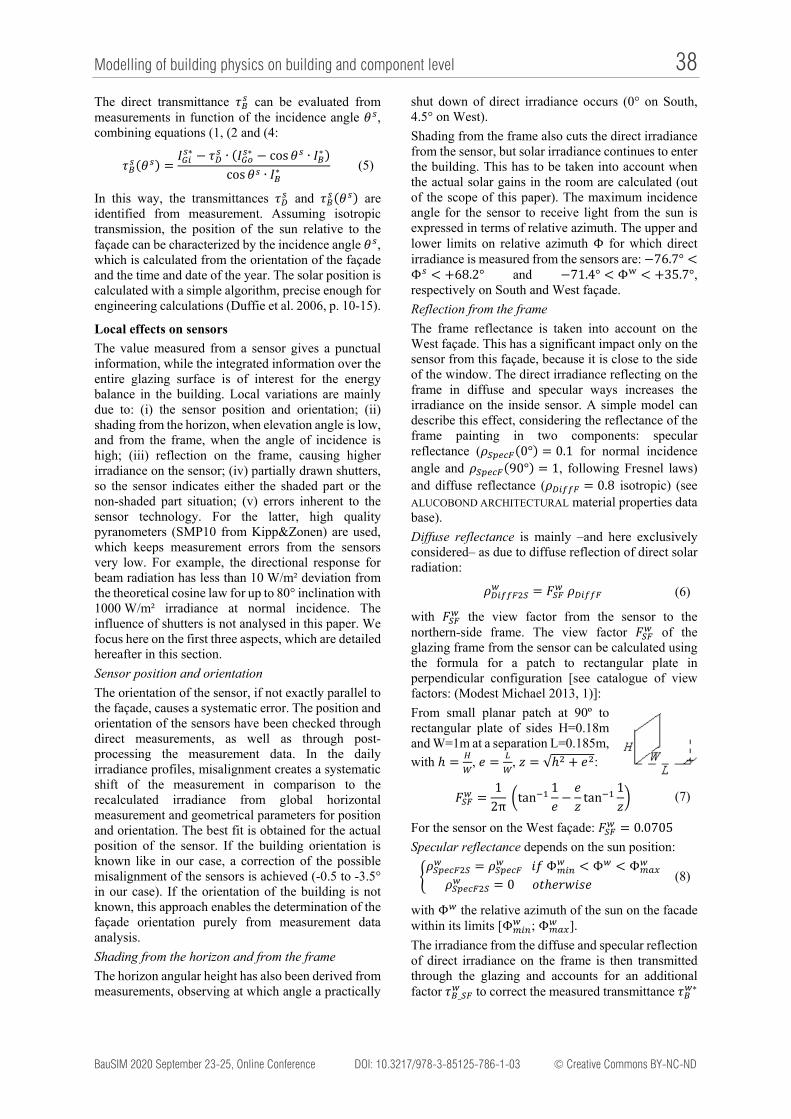
The calculation of the reflection on the frame shows a significant influence on the West façade sensor with up to 15 % additional irradiance on the sensor as the curve in Figrue 2 shows. The measured direct transmittance is overestimated in comparison to the glazing direct transmittance, for relative azimuth angles between 77° and 36°. The reference curve for the glazing direct transmittance in Figure 2 is using a correlation for triple glazing (Arasteh et al. 2009).
The same calculation on the South façade reveals only 1% increase, because the sensor is far from the side frame (wider window).
The measurement data in the following are taking into account the corrections for misalignment of the sensors and for the frame reflection. In the perspective of calculating the short wave solar irradiance gains, the limitations on the relative azimuth angle, through shading of the sensor, are also identified.
Figure 2: Direct transmittance of triple glazing from correlation (𝛕𝐁 correlation 3G) and from correlation with correction for frame reflection on the sensor (𝛕𝐁
from sensor view)
Diffuse transmittance
Measurement points without direct irradiance are selected over the entire measurement period (8 June 2018 to 7 June 2019) by verifying all the following conditions: I∗ 10𝑊/𝑚²; I 20𝑊/𝑚²; I5𝑊/𝑚²; no shadow from shading system nor from horizon. The average diffuse transmittance on the selected “diffuse-only” data is (standard deviation into brackets):
on South facade 𝜏 0.27 (𝜎 0.054) on West façade 𝜏 0.25 (𝜎 0.066).
Although both facades have the same glazing construction, several factors can explain the different
effective diffuse transmittance between South and West, such as differences: (i) in the window width, (ii) in the non-isotropic diffuse sky, (iii) in the ground reflectance, in the data points (different times) matching the selection criteria for “diffuse-only” irradiance. On the same façade, the diffuse reflectance is also submitted to variations of the sky (brightness variation of the sky with the weather: clear or cloudy sky) and to variations of the ground (albedo variation of diffuse reflecting bodies: vegetation summer/winter cycle, snow cover... and non-ideal Lambert diffusion because of partially specular reflecting bodies). Given the numerous influencing factors, the standard deviation is interestingly not too high.
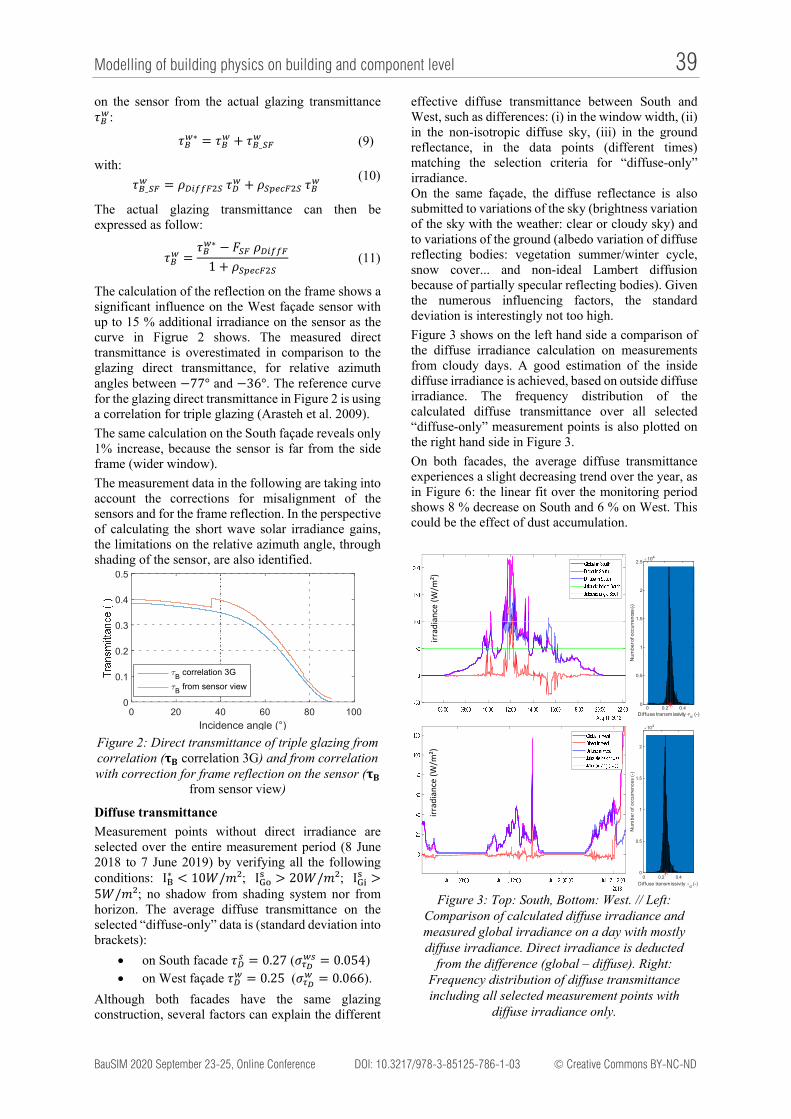
Figure 3 shows on the left hand side a comparison of the diffuse irradiance calculation on measurements from cloudy days. A good estimation of the inside diffuse irradiance is achieved, based on outside diffuse irradiance. The frequency distribution of the calculated diffuse transmittance over all selected “diffuse-only” measurement points is also plotted on the right hand side in Figure 3.
On both facades, the average diffuse transmittance experiences a slight decreasing trend over the year, as in Figure 6: the linear fit over the monitoring period shows 8 % decrease on South and 6 % on West. This could be the effect of dust accumulation.
Figure 3: Top: South, Bottom: West. // Left:
Comparison of calculated diffuse irradiance and measured global irradiance on a day with mostly diffuse irradiance. Direct irradiance is deducted
from the difference (global – diffuse). Right: Frequency distribution of diffuse transmittance including all selected measurement points with
diffuse irradiance only.
0 20 40 60 80 100
Incidence angle (°)
0
0.1
0.2
0.3
0.4
0.5
B correlation 3G
B from sensor view
0 0.2 0.4Diffuse transmissivity d (-)
0
0.5
1
1.5
2
2.5
Nu
mbe
r of o
ccurr
en
ces
(-)
104
0 0.2 0.4
Diffuse transmissivity d (-)
0
0.5
1
1.5
2
Nu
mb
er
of
occ
urr
en
ces
(-)
104
irradiance (W/m
²)
irradiance (W/m
²)
Modelling of building physics on building and component level 40
BauSIM 2020 September 23-25, Online Conference DOI: 10.3217/978-3-85125-786-1-03 © Creative Commons BY-NC-ND
Figure 4: Evolution of diffuse transmittance over the measurement period: “diffuse-only” data points and
linear regression on South and on West.
Direct transmittance
Direct transmittance depends on the incidence angle on the glass surface. The direct transmittance, for example on South facade 𝜏 , of direct light through a triple glazing can be fitted to a correlation of the following form (Arasteh et al. 2009):
𝜏 𝑎 cos 𝜃 b cos 𝜃 𝑐 cos 𝜃𝑑 cosθ 𝑒
(12)
with 𝜃 the incidence angle of direct irradiance on South and 𝑎 , 𝑏 , 𝑐 , 𝑑 and 𝑒 constant fitting coefficients.
The direct transmittance of the glazing is evaluated by regression from measurement data, after filtering out irrelevant data points, step by step. The colors on Figure 7 illustrate the different filter steps: shadow from building structure or night, shadow from shutters, direct irradiance below 10 W/m², air mass over 2.5. The remaining points are mostly relevant to evaluate direct transmittance 𝜏 from the ratio between direct irradiance levels inside 𝐼 versus outside 𝐼 :
𝜏𝐼𝐼
(13)
with:
𝐼 𝐼∗ cos 𝜃 (14)
𝐼 𝐼 ∗ 𝜏 𝐼 ∗ 𝐼 (15)
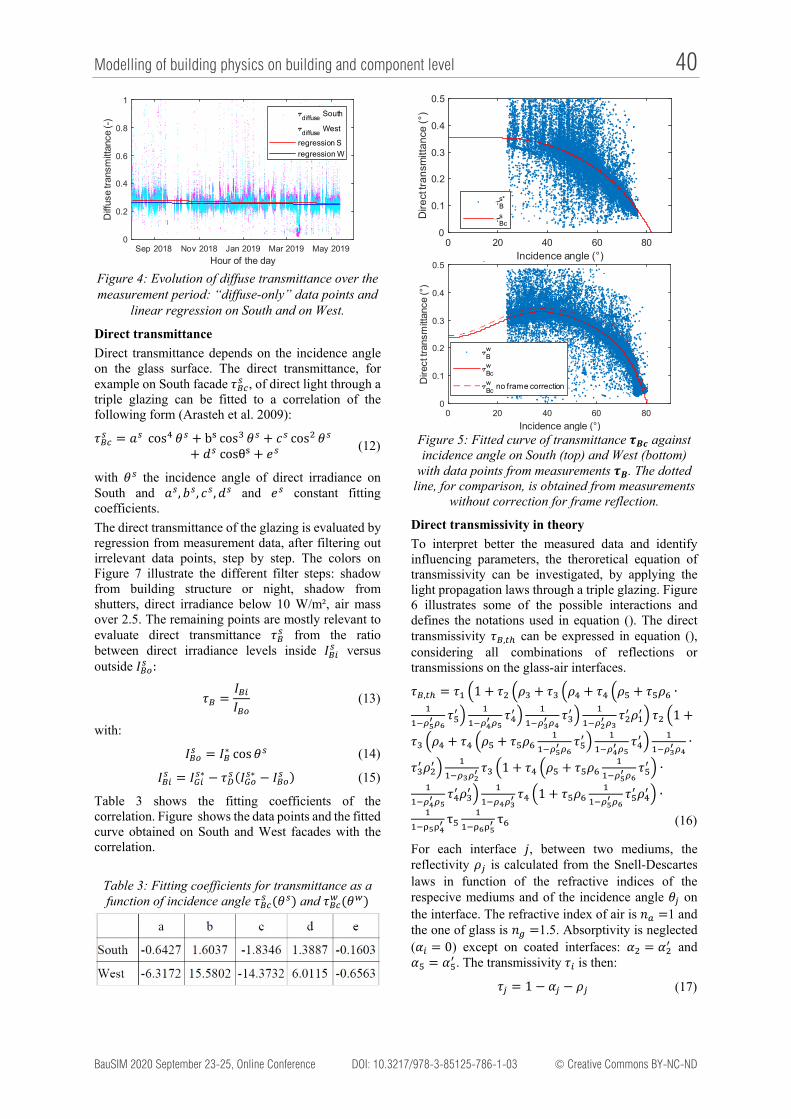
Table 3 shows the fitting coefficients of the correlation. Figure shows the data points and the fitted curve obtained on South and West facades with the correlation.
Table 3: Fitting coefficients for transmittance as a function of incidence angle 𝜏 𝜃 and 𝜏 𝜃
Figure 5: Fitted curve of transmittance 𝝉𝑩𝒄 against incidence angle on South (top) and West (bottom)
with data points from measurements 𝝉𝑩. The dotted line, for comparison, is obtained from measurements
without correction for frame reflection.
Direct transmissivity in theory
To interpret better the measured data and identify influencing parameters, the theroretical equation of transmissivity can be investigated, by applying the light propagation laws through a triple glazing. Figure 6 illustrates some of the possible interactions and defines the notations used in equation (). The direct transmissivity 𝜏 , can be expressed in equation (), considering all combinations of reflections or transmissions on the glass-air interfaces.
𝜏 , 𝜏 1 𝜏 𝜌 𝜏 𝜌 𝜏 𝜌 𝜏 𝜌 ∙
𝜏 𝜏 𝜏 𝜏 𝜌 𝜏 1
𝜏 𝜌 𝜏 𝜌 𝜏 𝜌 𝜏 𝜏 ∙
𝜏 𝜌 𝜏 1 𝜏 𝜌 𝜏 𝜌 𝜏 ∙
𝜏 𝜌 𝜏 1 𝜏 𝜌 𝜏 𝜌 ∙
τ τ (16)
For each interface 𝑗, between two mediums, the reflectivity 𝜌 is calculated from the Snell-Descartes laws in function of the refractive indices of the respecive mediums and of the incidence angle 𝜃 on the interface. The refractive index of air is 𝑛 1 and the one of glass is 𝑛 1.5. Absorptivity is neglected (𝛼 0) except on coated interfaces: 𝛼 𝛼 and 𝛼 𝛼 . The transmissivity 𝜏 is then:
𝜏 1 𝛼 𝜌 (17)
Sep 2018 Nov 2018 Jan 2019 Mar 2019 May 2019
Hour of the day
0
0.2
0.4
0.6
0.8
1D
iffus
e tr
ansm
ittan
ce (-
) diffuse South
diffuse West
regression S
regression W
0 20 40 60 80Incidence angle (°)
0
0.1
0.2
0.3
0.4
0.5
Dir
ect
tra
nsm
itta
nce
(°)
Bs*
Bcs
0 20 40 60 80
Incidence angle (°)
0
0.1
0.2
0.3
0.4
0.5
Dire
ct tr
ansm
ittan
ce (°
)
,
Bw
Bcw
Bcw no frame correction
Modelling of building physics on building and component level 41
BauSIM 2020 September 23-25, Online Conference DOI: 10.3217/978-3-85125-786-1-03 © Creative Commons BY-NC-ND
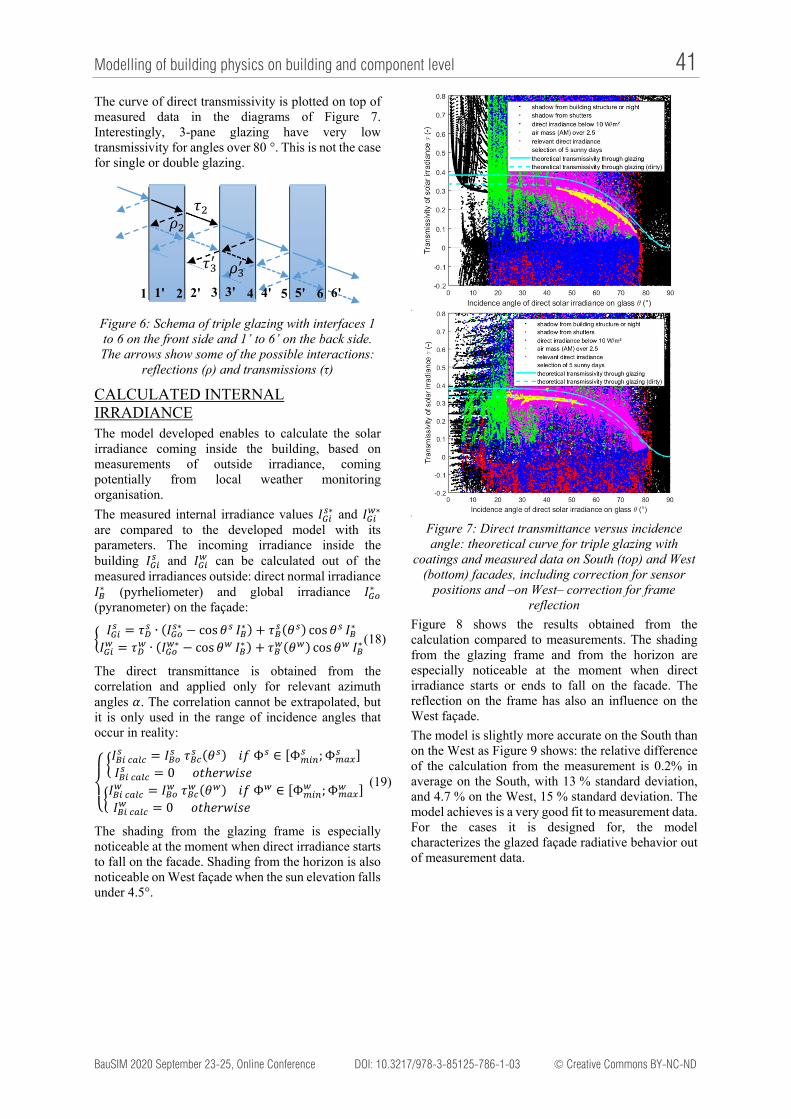
The curve of direct transmissivity is plotted on top of measured data in the diagrams of Figure 7. Interestingly, 3-pane glazing have very low transmissivity for angles over 80 °. This is not the case for single or double glazing.
Figure 6: Schema of triple glazing with interfaces 1 to 6 on the front side and 1’ to 6’ on the back side. The arrows show some of the possible interactions:
reflections (ρ) and transmissions (τ)
CALCULATED INTERNAL IRRADIANCE The model developed enables to calculate the solar irradiance coming inside the building, based on measurements of outside irradiance, coming potentially from local weather monitoring organisation.
The measured internal irradiance values 𝐼 ∗ and 𝐼 ∗ are compared to the developed model with its parameters. The incoming irradiance inside the building 𝐼 and 𝐼 can be calculated out of the measured irradiances outside: direct normal irradiance 𝐼∗ (pyrheliometer) and global irradiance 𝐼∗ (pyranometer) on the façade:
𝐼 𝜏 ∙ 𝐼 ∗ cos 𝜃 𝐼∗ 𝜏 𝜃 cos 𝜃 𝐼∗
𝐼 𝜏 ∙ 𝐼 ∗ cos 𝜃 𝐼∗ 𝜏 𝜃 cos 𝜃 𝐼∗ (18)
The direct transmittance is obtained from the correlation and applied only for relevant azimuth angles 𝛼. The correlation cannot be extrapolated, but it is only used in the range of incidence angles that occur in reality:
⎩⎨
⎧𝐼 𝐼 𝜏 𝜃 𝑖𝑓 Φ ∈ Φ ; Φ𝐼 0 𝑜𝑡ℎ𝑒𝑟𝑤𝑖𝑠𝑒
𝐼 𝐼 𝜏 𝜃 𝑖𝑓 Φ ∈ Φ ; Φ𝐼 0 𝑜𝑡ℎ𝑒𝑟𝑤𝑖𝑠𝑒
(19)
The shading from the glazing frame is especially noticeable at the moment when direct irradiance starts to fall on the facade. Shading from the horizon is also noticeable on West façade when the sun elevation falls under 4.5°.
Figure 7: Direct transmittance versus incidence angle: theoretical curve for triple glazing with
coatings and measured data on South (top) and West (bottom) facades, including correction for sensor
positions and –on West– correction for frame reflection
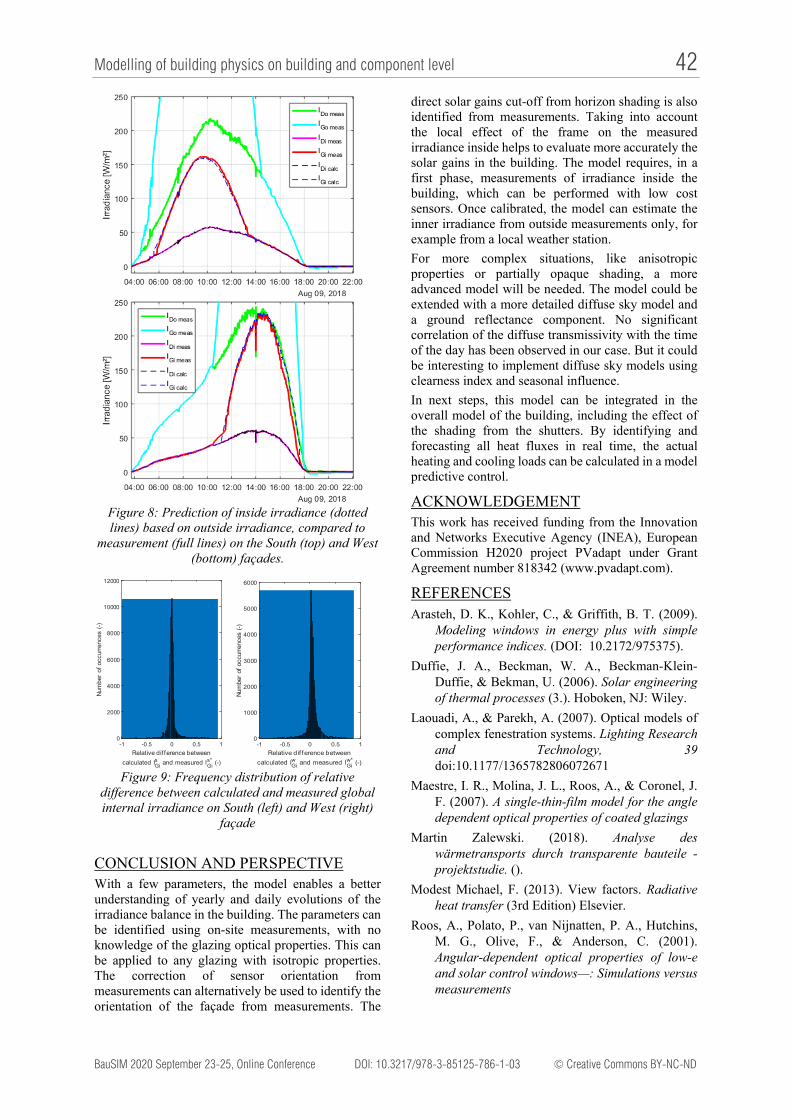
Figure 8 shows the results obtained from the calculation compared to measurements. The shading from the glazing frame and from the horizon are especially noticeable at the moment when direct irradiance starts or ends to fall on the facade. The reflection on the frame has also an influence on the West façade.
The model is slightly more accurate on the South than on the West as Figure 9 shows: the relative difference of the calculation from the measurement is 0.2% in average on the South, with 13 % standard deviation, and 4.7 % on the West, 15 % standard deviation. The model achieves is a very good fit to measurement data. For the cases it is designed for, the model characterizes the glazed façade radiative behavior out of measurement data.
1 2 3 4 5 6
𝜏 𝜌
1' 2' 3' 4' 5' 6'
𝜏 𝜌
Modelling of building physics on building and component level 42
BauSIM 2020 September 23-25, Online Conference DOI: 10.3217/978-3-85125-786-1-03 © Creative Commons BY-NC-ND
Figure 8: Prediction of inside irradiance (dotted lines) based on outside irradiance, compared to
measurement (full lines) on the South (top) and West (bottom) façades.
Figure 9: Frequency distribution of relative
difference between calculated and measured global internal irradiance on South (left) and West (right)
façade
CONCLUSION AND PERSPECTIVE With a few parameters, the model enables a better understanding of yearly and daily evolutions of the irradiance balance in the building. The parameters can be identified using on-site measurements, with no knowledge of the glazing optical properties. This can be applied to any glazing with isotropic properties. The correction of sensor orientation from measurements can alternatively be used to identify the orientation of the façade from measurements. The
direct solar gains cut-off from horizon shading is also identified from measurements. Taking into account the local effect of the frame on the measured irradiance inside helps to evaluate more accurately the solar gains in the building. The model requires, in a first phase, measurements of irradiance inside the building, which can be performed with low cost sensors. Once calibrated, the model can estimate the inner irradiance from outside measurements only, for example from a local weather station.
For more complex situations, like anisotropic properties or partially opaque shading, a more advanced model will be needed. The model could be extended with a more detailed diffuse sky model and a ground reflectance component. No significant correlation of the diffuse transmissivity with the time of the day has been observed in our case. But it could be interesting to implement diffuse sky models using clearness index and seasonal influence.
In next steps, this model can be integrated in the overall model of the building, including the effect of the shading from the shutters. By identifying and forecasting all heat fluxes in real time, the actual heating and cooling loads can be calculated in a model predictive control.
ACKNOWLEDGEMENT This work has received funding from the Innovation and Networks Executive Agency (INEA), European Commission H2020 project PVadapt under Grant Agreement number 818342 (www.pvadapt.com).
REFERENCES Arasteh, D. K., Kohler, C., & Griffith, B. T. (2009).
Modeling windows in energy plus with simple performance indices. (DOI: 10.2172/975375).
Duffie, J. A., Beckman, W. A., Beckman-Klein-Duffie, & Bekman, U. (2006). Solar engineering of thermal processes (3.). Hoboken, NJ: Wiley.
Laouadi, A., & Parekh, A. (2007). Optical models of complex fenestration systems. Lighting Research and Technology, 39 doi:10.1177/1365782806072671
Maestre, I. R., Molina, J. L., Roos, A., & Coronel, J. F. (2007). A single-thin-film model for the angle dependent optical properties of coated glazings
Martin Zalewski. (2018). Analyse des wärmetransports durch transparente bauteile - projektstudie. ().
Modest Michael, F. (2013). View factors. Radiative heat transfer (3rd Edition) Elsevier.
Roos, A., Polato, P., van Nijnatten, P. A., Hutchins, M. G., Olive, F., & Anderson, C. (2001). Angular-dependent optical properties of low-e and solar control windows—: Simulations versus measurements
-1 -0.5 0 0.5 1
Relative dif ference between
calculated IGis and measured IGi
s* (-)
0
2000
4000
6000
8000
10000
12000
Num
ber
of o
ccur
renc
es (
-)
-1 -0.5 0 0.5 1
Relative dif ference between
calculated IGiw and measured IGi
w* (-)
0
1000
2000
3000
4000
5000
6000
Num
ber
of o
ccur
renc
es (
-)
Modelling of building physics on building and component level 43
BauSIM 2020 September 23-25, Online Conference DOI: 10.3217/978-3-85125-786-1-03 © Creative Commons BY-NC-ND
Rubin, M., Powles, R., & Von Rottkay, K. (1999). Models for the angle-dependent optical properties of coated glazing materials
Serale, G., Fiorentini, M., Capozzoli, A., Bernardini, D., & Bemporad, A. (2018). Model Predictive Control (MPC) for Enhancing Building and HVAC System Energy Efficiency: Problem Formulation, Applications and Opportunities. Energies, 11, S. 631. doi:10.3390/en11030631