Embed Size (px)
Citation preview

ARTICLE
Modeling of Shear Stress Experienced byEndothelial Cells Cultured on MicrostructuredPolymer Substrates in a Parallel Plate FlowChamber
Alan Brown, George Burke, Brian J. Meenan
Biomaterials and Tissue Engineering Research Group (BTERG), Nanotechnology and
Integrated Bioengineering Centre (NIBEC), University of Ulster, Newtownabbey BT37 0QB,
UK; telephone: 44-28-90368814; fax: 44-28-90366863; e-mail: [email protected]
Received 24 August 2010; revision received 15 October 2010; accepted 15 November 2010
Published online 1 December 2010 in Wiley Online Library (wileyonlinelibrary.com). D
OI 10.1002/bit.23022ABSTRACT: The application of physical stimuli to cellpopulations in tissue engineering and regenerative medicinemay facilitate significant scientific and clinical advances.However, for the most part, these stimuli are evaluated inisolation, rather than in combination. This study wasdesigned to combine two physical stimuli. The first beinga microstructured tissue culture polystyrene substrate,known to produce changes in cell shape and orientation,and the second being laminar shear stress in a parallel plateflow chamber. The combined effects of these stimuli onendothelial cell monolayers cells were evaluated in a parallelplate flow chamber and using a computational fluiddynamics (CFD) model. The topography of the cell mono-layers cultured on different microstructured surfaces wasdetermined using confocal laser scanning microscopy(CLSM), and this topographic information was used toconstruct the CFD model. This research found that whilethe specific underlying structures were effectively planarizedby the cell monolayer, significant differences in cell shapeand orientation were observed on the different microstruc-tured surfaces. Cells cultured on grooved substrates alignedin the direction of the grooves and showed higher retentionafter 1-h LSS conditioning than those cultured on pillars.The modeled shear stress distributions also showed differ-ences. While minor differences in the magnitude of shearstress were noted, aligned cell monolayers experienced sig-nificantly lower spatial gradients of shear stress when com-pared with cells that were not pre-aligned by surface features.The results presented here provide an analysis of how oneform of physical stimulus can be moderated by another andalso provide a methodology by which the understanding ofcell responses to topographic and mechanical stimuli can befurther advanced.
Biotechnol. Bioeng. 2011;108: 1148–1158.
� 2010 Wiley Periodicals, Inc.
KEYWORDS: shear stress; computational fluid dynamics;tissue engineering; microstructure; topography; bioreactor
Correspondence to: Alan Brown
1148 Biotechnology and Bioengineering, Vol. 108, No. 5, May, 2011
Introduction
Appropriate control of cell populations is a key considera-tion for realization of the clinical benefits offered by tissueengineering and regenerative medicine. Manipulation of cellphenotype commonly involves the provision of stimuli,such as the responses to bioactive materials (Brunette et al.,2005) and/or the use of bioreactors (Wendt et al., 2009).Quantifying the precise physical stimuli that cells experiencein vitro is of key importance in ensuring safe and effectivesources for clinical application, and in evaluating the likelyperformance of tissue engineered constructs or implantablebiomaterials in vivo.
Two specific forms of physical stimuli that have beenidentified as being significant for directing endothelial cellresponse are fluid shear stress (Brown, 2000) and the surfacetopography of the growth substrate (Brunette et al., 2005;Charest et al., 2006). While these stimuli are mostcommonly evaluated separately, considering their combinedeffects on endothelial cell function will advance under-standing of such mechanical cues and could be targetedtowards the vascularization of tissue engineered constructsor the design of vascular implant materials. Yazdani et al.(2010) reported the improved performance of a vasculargraft after preconditioning with shear stress. Whether pre-alignment of cells using surface patterns would be beneficialin this application could be evaluated using these methods.
Endothelial cells exist as a monolayer in vivo that is indirect contact with flowing blood, such that they continuallyexperience shear stress. Different parts of the circulatorysystem have different geometries and experience variationsin flow rates. These differences, combined with the pulsatilenature of blood flow and other physiological factors, suchas the radial expansion and contraction of arteries, ensurethat the endothelial cell monolayer is subject to levels ofshear stress which vary with both time and space (LaMackand Friedman, 2007; Satcher et al., 1992). Shear stress is the
� 2010 Wiley Periodicals, Inc.

force due to frictional drag by a fluid flowing over a surface,and acts parallel to the direction of flow. The magnitudeof the shear force at a boundary depends on the flowvelocity, the viscosity of the fluid and the dimensions of thevessel (Ballermann et al., 1998), and is proportional to therate of change of the fluid velocity in the normal directionto the surface as indicated in Equation (1).
t/ dv
dz(1)
The geometry of the surface will therefore have asignificant bearing on the shear stress experienced. Inthe case of endothelial cells, it is the surface of the cellmonolayer that must be considered, rather than the surfaceof the underlying substrate. However, if the substratehas pronounced features that influence the nature of themonolayer then this will contribute to the shear forcesthe cells experience.
Endothelial cells undergo a variety of different changes inresponse to shear (Ballermann et al., 1998) and have beenobserved to respond to the magnitude of the stress and tothe temporal and spatial variations of the shear stress applied(Davies et al., 1997; LaMack and Friedman, 2007; Nagelet al., 1999). Indeed, cells have been shown to respond togradients of shear in ways that differ from their responseto the magnitude of the shear stress alone (Bao et al., 1999;Davies et al., 1986; DePaola et al., 1992; Kleinstreuer et al.,1996). If these complex responses to shear stress are to bebetter understood it is necessary to accurately determinethe magnitude and gradients of shear stress experienced bythe cells. Significant advances in the methods used toobserve and quantify cell responses, such as the use of cDNAmicroarrays (Chiu et al., 2005) have led to improved analysisof the biological response. However, there has been muchless research aimed at the quantification of the precise shearstress stimuli that the cells actually experience.
Many in vitro studies of the effects of shear stress onendothelial cells assume that the contacting surface issmooth and planar. The reality is that the surface of a typicalendothelial cell monolayer is not planar, but is undulating innature (Barbee et al., 1994; Satcher et al., 1992). As indicatedearlier, the surface of the substrate on which such cells arecultured can produce variations in the topography of thecell monolayer surface. Hence, consideration of a planar cellsurface ignores the undoubted spatial gradients of shearstress that result.
Computational fluid dynamics (CFD) has been usedpreviously to quantify the variations that can occur in shearstress in such circumstances. Models have been developedto describe particular conditions within bioreactors (Cioffiet al., 2006; Lesman et al., 2010; Sucosky et al., 2004), parallelplate flow chambers (Anderson et al., 2006; Bacabac et al.,2005; Lawrence et al., 2009) and at the level of the cellmonolayer (Barbee et al., 1995; Satcher et al., 1992) inculture. For example, Anderson modeled cells as rigid
hemispheres in order to highlight the inaccuracy of thesimple planar surface assumption (Anderson et al., 2006;Davies and Barbee, 1994). The nature of the endothelialcell monolayer has been modeled from direct measurements(Barbee, 2002; Barbee et al., 1995; Davies and Barbee, 1994;Fukushima et al., 2001) or has been represented as eithera sinusoidal undulating surface (Choi and Barakat, 2009;Satcher et al., 1992) or as a 2D Gaussian function(Yamaguchi et al., 2000).
Topographical features have also been shown to producemorphological and cytoskeletal effects in contactingendothelial cells. The effects observed include alignment(Chen et al., 1998; Kidoaki and Matsuda, 2007a), withspecific features and increased cell adhesion (Martines et al.,2004; Zorlutuna et al., 2009; Kato et al., 2001; Kidoaki andMatsuda, 2007b). The effects that substrate surface featureshave in the early stages of cell morphology and cytoskeletalactivity will have an on-going impact on the shear stressexperienced by the cell monolayer. Studies of endothelial cellalignment to patterned surfaces have generally investigatedparallel ridge structures. Alignment has been observed forthese structures for a wide range of dimensions, from a pitchof 400 nm (Liliensiek et al., 2010) up to the width of the cell(Curtis and Wilkinson, 1997), and with groove heightsgreater than 200 nm (Uttayarat et al., 2005). In this study apitch of 3.2mm and a groove height of 0.5mm were used.With larger grooves, cells can often be seen in higherdensities either in the grooves (Daxini et al., 2006) or onthe ridges (Brown et al., 2010). The purpose of this studyis to investigate the effects of an aligned endothelial cellmonolayer, so these dimensions were chosen to be smallerthan the dimensions of the cells, so that a homogeneousaligned layer was produced. Microscale features were chosenbecause of the ease of fabrication using standard photo-lithographic methods. Pillar features were also producedwith similar nominal dimensions.
Studies of the effects of combining surface features andLSS on endothelial cells have been limited. Daxini et al.(2006) showed enhanced retention of BAECs undershear stress with large grooves. Zorlutuna et al. (2009) alsoshowed enhanced adhesion of endothelial cells culturedon microstructured grooved substrates, with the highestretention on the largest features tested (650 nm pitch,300 nm depth). Hsu et al. (2005) investigated migration ofBAECs under a combination of surface patterns and LSS andreported that shear stress predominated beyond a certainthreshold.
In this study, CFD has been used to model the magnitudeand gradients of shear stress that is experienced byendothelial cells on substrates with defined microstructuralfeatures when cultured under parallel plate flow chamberconditions. The CFD model used has been created usingexperimental data obtained from endothelial cell mono-layers cultured on substrates with the surface features ofinterest, and has been compared with the effects of 1-hexposure of bovine aortic endothelial cells (BAECs) to LSSin a parallel plate flow chamber. The chamber conditions
Brown et al.: Microstructured Polymer Substrates 1149
Biotechnology and Bioengineering

used in the CFD model are based on these experimentalconditions. Endothelial cell response to the combinationof shear stress and surface topography in a parallel platechamber has been evaluated by both computational andexperimental methods.
Materials and Methods
Substrate Preparation and Processing
Disks of tissue culture polystyrene (TCP) of 100mmdiameterwere cut from commercial grade T-175 tissue culture flasks(Sarstedt, Numbrecht, Germany) using a hot wire cutter. Twodistinct microscale patterns were created on the surfaces ofthese disks using an automated hot embossing system(EVG520HE, EV Group, Scharding, Austria). The stampsused to create the features were fabricated in silicon bystandard photolithography and etching processes and theresulting features created are shown in Figure 1.
The embossed TCP discs were then cut either into75mm� 25mm substrates for flow chamber testing, orinto 10mm� 10mm pieces for static cell culture experi-ments. Control samples of the TCP were also cut into similarsized substrates.
Endothelial Cell Culture and Flow Testing
Primary BAECs were expanded in culture under standardcell culture conditions in minimum essential mediasupplemented with 10% fetal bovine serum and 50mg/mL gentamycin sulfate. All media and supplementswere sourced from Invitrogen (Paisley, UK) or SigmaAldrich (Dorset, UK). Cells between passages 4 and 7 weresubsequently seeded at 5� 104 cells per cm2 onto both themicrostructured and control TCP substrates and cultureduntil they were confluent.
Figure 1. Feature arrays created in tissue culture polystyrene by hot embossing with
pillars.
1150 Biotechnology and Bioengineering, Vol. 108, No. 5, May, 2011
Confluent cell monolayers were subjected to 1 h of LSS in aparallel plate flow chamber. The flow chamber was designedand fabricated in-house, the details of which have beenpresented elsewhere (Brown and Meenan, 2007). Shear stresstests were conducted at 5.5mL/min, based on a nominal shearstress of 1 Pa, and 4mL/min, based on a nominal shear stressof 0.7 Pa. At least two samples of each surface type wereexposed to each flow rate. Static control samples were culturedat the same time without exposure to LSS.
After flow testing, cellmonolayers were fixed in 4% solutionof paraformaldehyde in phosphate-buffered saline (PBS)containing 0.1% Triton X-100 to permeabilize the plasmamembrane. Actin was labeled using Alexa-Fluor 488conjugated Phalloidin and the cell nuclei were labeled using40,6-diamidino-2-phenylindole (DAPI) (Molecular Probes,Invitrogen, Paisley, UK). Some cells were also stained forb-tubulin via incubation in an anti-tubulin antibody (SigmaAldrich) followed by incubation in Alexa Fluor 546 fluorescentsecondary antibody (Molecular Probes, Invitrogen). Sampleswere mounted for microscopy using Vectashield mountingmedia (Vector Labs, Peterborough, UK) and covered with aglass cover slip.
Image Analysis of Cultured Endothelial Cells
To evaluate endothelial cell retention after LSS, eight widefield micrographs of the DAPI fluorescent channel persubstrate were taken using an Axio Imager M1 microscopeand camera (Zeiss, Oberkochen, Germany). Cells werecounted using the analyze particles function of ImageJ. Inorder to visualize alignment and topography the fluores-cently labeled, static cultured cell monolayers on thefeatured substrates and control surfaces were imaged usinga Confocal Laser Scanning Microscope (LSM 5 Pascalmounted on an Axio Imager M1 microscope, Zeiss).Confocal laser scanning microscopy (CLSM) image stackswere converted to topographic maps using LSM Image
silicon stamps showing (a) 3mm wide, 0.5mm high ridges, (b) 3mm wide, 0.5mm high

Examiner software (Zeiss). The peak to valley height of thecell monolayer was measured at more than 2000 points oneach surface. The noise that results from this methodologycan produce both saturated and dark pixels, which produceoutlying data points. In order to minimize the effect of theseoutliers, the peak to valley height of the wavy cell monolayerwas taken to be equal to plus and minus 2 standarddeviations of the measurement sample, based on theobservation that the measured heights are normallydistributed. To determine the lengths of the major axisand minor axis and the orientation of the cells, imageanalysis of CLSM images was performed using Image J (U.S.National Institutes for Health, USA) (Rasband, 2009).
Model Geometry for Computational Fluid DynamicsStudies
A model of a section in the center of the parallel plate flowchamber, measuring 600mm� 600mm and 180mm highwas created using commercial geometry creation software(Gambit v2.2.30, Fluent, Inc., Cannonsberg, PA). Toevaluate the effects of surface topography on the shearstress experienced at the substrate surface, two micro-structured topographies created by hot embossing were alsocreated in this 600mm� 600mm� 180mm section.
The cell monolayer surface was modeled as a sinusoidalwavy surface with undulations in both the x and y directions,using the method described by Choi and Barakat (2009) andusing the dimensions obtained from the CLSM maps ofthe endothelial cells cultured on the featured substrates,using Equation (2):
z ¼ hsin2px
lx
� �þ hsin2
py
ly
� �(2)
where lx is the average length of a cell in the x direction, ly isthe mean length of a cell in the y direction and h is the peakto valley height of the cell monolayer. The x direction on thiscell monolayer surface will be referred to as the streamwisedirection, parallel to the direction of flow and the y directionof the cell monolayer will be referred to as the spanwisedirection, perpendicular to the direction of flow.
These cell monolayer surface geometries were againcreated within the same 600mm� 600mm� 180mm sec-tion of the flow chamber model. For all the geometries, thesurface of interest was meshed using a triangular pavedmeshwith 3mm minimum dimensions, and the remainingvolume was meshed with a tetrahedral mesh of largerelements in conjunction with a boundary layer. Thismethodology resulted in between 850,000 and 950,000mesh volumes for each of the various geometries.
CFD models of the full size experimental flow chamberwere also produced and compared with the small sectionmodel to ensure that the smaller model was representative.The small section model was necessary in order to createboth the 3mm feature geometry and an appropriate mesh,
while keeping the computational model efficient. Both thefull channel model and the small section model gave meanshear stress values in the region of interest within 5% of thetheoretical shear stress calculated using Equation (3). Thesmall section model solution was determined to be meshindependent by comparing solutions based on more and lessdetailed meshing schemes.
ðtÞ ¼ 6ðmÞQ =wh2 (3)
Shear Stress Modeling
A commercial CFD package (Fluent v 6.2.16, Fluent, Inc.) wasused to set up and analyze the model described above. Fluidinlet conditions were based on experimental conditionsreported elsewhere (Brown et al., 2010), with a volumetricflow rate that subjects a planar slide to nominal shear stressesof 0.75 and 1Pa. No-slip boundary conditions were used forall surfaces and at the boundaries of the fluid domain. Theculture medium was modeled as a Newtonian fluid withdensity P equal to 1,000 kg/m3 and viscosity m, equal to8.9� 10�4 Pa s. For all these models the maximum Reynoldsnumber was calculated to be less than 10 for the flow ratesemployed, confirming the flow in the chamber to be laminar.
Shear stress contour maps were obtained from the Fluentsoftware for a 200mm2 region of interest for each of thesurfaces in order to minimize the effects of model boundaries.For the sinusoidal endothelial cell monolayer surfaces, theshear stress was also quantified in the direction of flow alongthe centerlines of at least three rows of cells for each surface.The spatial gradient of shear stress in the direction of flow wasestimated from these data by considering the linear gradientbetween three adjacent points upstream and three adjacentpoints downstream of the point of interest.
Results
After 72 h in culture, BAECs formed a confluent monolayerof cells on both the structured and unstructured surfaces.In particular, cells were observed to align with the ridgedstructures as shown in Figure 2 which shows CLSM imagesof these aligned and non-aligned BAEC monolayers.
Laminar Shear Stress Testing
After exposure to a flow rate of 5.5mL/min, equivalent toa nominal shear stress of 1 Pa for 1 h in the parallel plate flowchamber, significantly lower numbers of cells were observedthan for the static control samples, as shown in Figure 3. Theridge structures showed 35% of cells remaining after LSS,compared with 21% for the pillar structures and 22% for theTCP surfaces. After exposure to 1-h LSS at 4mL/min,equivalent to a nominal LSS of 0.7 Pa, a similar pattern wasobserved, with the ridges (68%) retaining a significantlyhigher proportion of the cells than the pillar structures
Brown et al.: Microstructured Polymer Substrates 1151
Biotechnology and Bioengineering
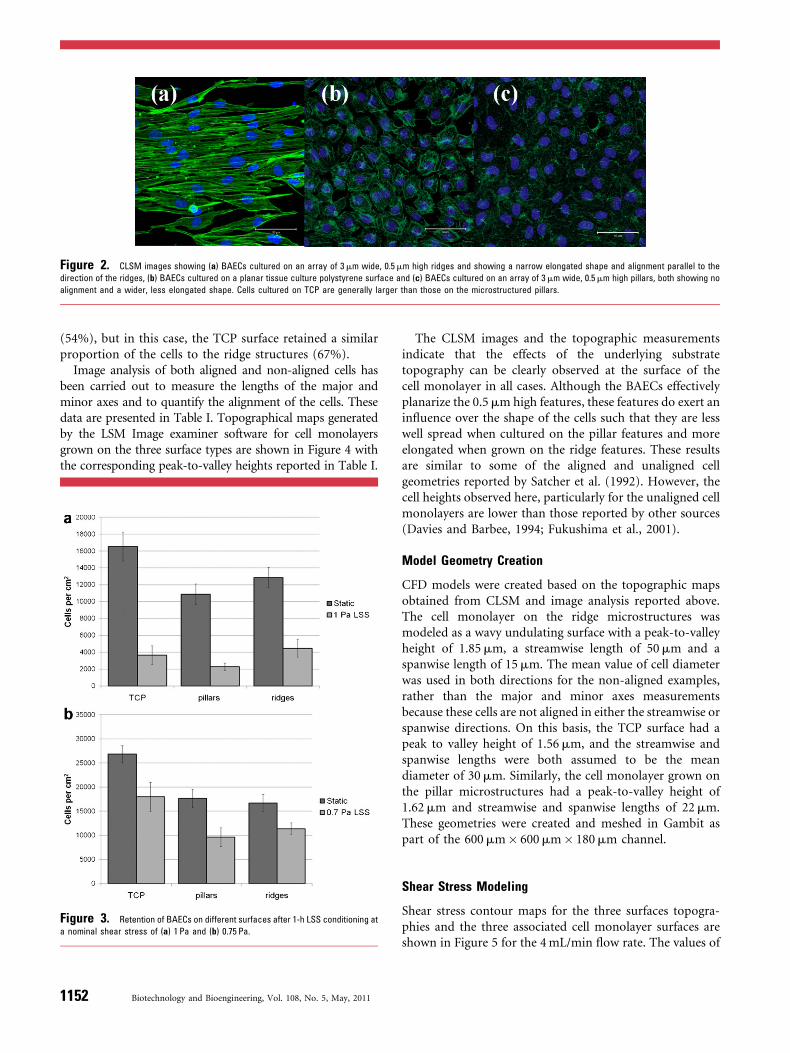
Figure 2. CLSM images showing (a) BAECs cultured on an array of 3mm wide, 0.5mm high ridges and showing a narrow elongated shape and alignment parallel to the
direction of the ridges, (b) BAECs cultured on a planar tissue culture polystyrene surface and (c) BAECs cultured on an array of 3mm wide, 0.5mm high pillars, both showing no
alignment and a wider, less elongated shape. Cells cultured on TCP are generally larger than those on the microstructured pillars.
(54%), but in this case, the TCP surface retained a similarproportion of the cells to the ridge structures (67%).
Image analysis of both aligned and non-aligned cells hasbeen carried out to measure the lengths of the major andminor axes and to quantify the alignment of the cells. Thesedata are presented in Table I. Topographical maps generatedby the LSM Image examiner software for cell monolayersgrown on the three surface types are shown in Figure 4 withthe corresponding peak-to-valley heights reported in Table I.
Figure 3. Retention of BAECs on different surfaces after 1-h LSS conditioning at
a nominal shear stress of (a) 1 Pa and (b) 0.75 Pa.
1152 Biotechnology and Bioengineering, Vol. 108, No. 5, May, 2011
The CLSM images and the topographic measurementsindicate that the effects of the underlying substratetopography can be clearly observed at the surface of thecell monolayer in all cases. Although the BAECs effectivelyplanarize the 0.5mm high features, these features do exert aninfluence over the shape of the cells such that they are lesswell spread when cultured on the pillar features and moreelongated when grown on the ridge features. These resultsare similar to some of the aligned and unaligned cellgeometries reported by Satcher et al. (1992). However, thecell heights observed here, particularly for the unaligned cellmonolayers are lower than those reported by other sources(Davies and Barbee, 1994; Fukushima et al., 2001).
Model Geometry Creation
CFD models were created based on the topographic mapsobtained from CLSM and image analysis reported above.The cell monolayer on the ridge microstructures wasmodeled as a wavy undulating surface with a peak-to-valleyheight of 1.85mm, a streamwise length of 50mm and aspanwise length of 15mm. The mean value of cell diameterwas used in both directions for the non-aligned examples,rather than the major and minor axes measurementsbecause these cells are not aligned in either the streamwise orspanwise directions. On this basis, the TCP surface had apeak to valley height of 1.56mm, and the streamwise andspanwise lengths were both assumed to be the meandiameter of 30mm. Similarly, the cell monolayer grown onthe pillar microstructures had a peak-to-valley height of1.62mm and streamwise and spanwise lengths of 22mm.These geometries were created and meshed in Gambit aspart of the 600mm� 600mm� 180mm channel.
Shear Stress Modeling
Shear stress contour maps for the three surfaces topogra-phies and the three associated cell monolayer surfaces areshown in Figure 5 for the 4mL/min flow rate. The values of

Table I. Mean dimensions and orientation angles of both aligned and non-aligned cells.
Major axis
length (lx)mm
Minor axis
length (ly)mm Orientation
Peak to valley
height (h)mm
equivalent to 4s
3mm wide, 0.5mm high ridges (n¼ 43) 49.7,a s¼ 10.7 13.0,a s¼ 4.8 Preferentially aligned
parallel to the ridges
1.85
Tissue culture polystyrene (n¼ 42) 40.9,a s¼ 9.1 18.7,a s¼ 6.3 Randomly oriented 1.56
3mm wide, 0.5mm high pillars (n¼ 69) 26.6,a s¼ 5.8 17.4, s¼ 3.1 Randomly oriented 1.62
aP< 0.01.
the mean shear stress exerted by fluid flow over the modifiedsubstrates are shown in Table II. The values for the pillar andridged features were 0.63 and 0.52 Pa, respectively. Both ofthese values are significantly lower than the 0.75 Pa observedfor the unfeatured TCP surface (Fig. 5a). The peak shearstress was highest for the pillar features at 1.74 Pa, a value132% higher than the shear stress predicted by assuminga planar surface using Equation (3) and 60% higher than thepeak shear stress modeled on a planar surface. For the ridgedstructure, the peak shear stress was 1.59 Pa, 112% higherthan the shear stress predicted using Equation (3) and 45.9%higher than the peak shear stress modeled for a planarsurface.
The shear stress experienced at the surface of thesemicrostructured polymer substrates does not adequatelyrepresent that actually experienced by endothelial cellscultured thereon. The cell culture studies carried out hereindicate that the cell monolayers have a planarizing effect onthe substrate features such that the microscale features arenot directly evident. However, these cell monolayers arenot adequately modeled by a planar geometry nor by asimple wave form since the effects of the substratemicrostructure on the cell alignment and shape can clearlybe seen to influence the resultant shear stress, as illustratedin Figure 5e and f. Whereas, the mean shear stress on allof the cell monolayers is in fact close to the mean shear stresspredicted when one assumes a planar surface, the peak shearstress is significantly higher at the high points of the cellmonolayer surface.
Spatial Gradient of Shear Stress
Histograms of shear stress and shear stress gradients forthe three cell monolayer surfaces are shown in Figure 6. Itis clear from these histogram representations that themagnitude of shear stress is similar for all three surfaces,with only a slight increase in the proportion of the surfaceat the higher levels of shear stress for the cell surfaces grownon the microstructured substrates. When the surface of thecell monolayer is represented by a sinusoidal wavytopography, the shear stress is strongly correlated withthe feature height (Satcher et al., 1992). This is then to beexpected to be the case in these data based on the peak-to-valley heights measured by CLSM. However, the spatialshear stress gradient measured in the direction of flow is
noticeably different for the three cell monolayer surfacesgrown on the differently featured surfaces. Cells grown on theridged features show a significantly lower shear stress gradientin the streamwise direction than those grown on the pillarfeatures with the former condition showing both the largestshear stress gradients and also the highest proportion of thesurface exposed to larger spatial shear stress gradients.
Discussion
The response of endothelial cells to shear stress has beenextensively studied over the last 30 years both in vivo (Andoand Yamamoto, 2009; Chen and Tzima, 2009; Li et al., 2005;Tzima et al., 2005) and in vitro (Levesque and Nerem, 1985;Malek and Izumo, 1996). The response of these cells to shearhas been found to be complex, playing a role in cytoskeletalchanges, including the alignment of cell monolayers(Frangos et al., 1988; Metallo et al., 2008), diseases suchas atherosclerosis (Sucosky et al., 2009); (Dai et al., 2004;Li et al., 2009) and vascular remodeling including tubuleformation (Brooks et al., 2004; Carmeliet, 2000; Risau, 1997;Traub and Berk, 1998; Tressel et al., 2007; Ueda et al., 2004).While these prior studies have enabled significant advancesin the understanding of cell responses to flow, thecomplexities associated with in vivo vascular geometryand with flow chamber and bioreactor design havehighlighted the need for modeling strategies to determinelocal shear stress magnitudes and gradients.
Experimental results presented here have highlightedthat cells aligned by culturing on microscale groovedsurfaces retain more cells after exposure to LSS than thosewith similar scale patterns that do not induce alignment.Cells cultured on TCP surfaces were retained in similarproportion to the aligned cells at lower flow rates, butretention was poorer at higher flow rates. These results pointto interactions between the specific surface adhesion of cellsto a substrate and their alignment to microstructure thatmight explain the differences in cell retention after shearstress.
The data produced from the CFD models created inthis study confirm that the actual shear stress experiencedby a cell monolayer in a parallel plate flow chamberis significantly different from that which is predicted byassuming a planar monolayer exposed to an idealized formof Poiseuille flow. Although, it has been recognized
Brown et al.: Microstructured Polymer Substrates 1153
Biotechnology and Bioengineering

Figure 4. Topography map taken from the actin (phalloidin) channel of the CLSM image stack, showing (a) aligned cells on 3mmwide, 0.5mm high ridges and (b) non-aligned
cells on planar tissue culture polystyrene and (c) non-aligned cells on 3mm wide, 0.5mm high pillars.
previously that knowledge of the actual surface topographyof the cell monolayer is important to achieve an accurateassessment of the shear stress they experience (Andersonet al., 2006; Barbee, 2002), few studies have adequately taken
1154 Biotechnology and Bioengineering, Vol. 108, No. 5, May, 2011
this into account. In addition, this research also suggests thatCFD models that use the underlying substrate topography(Daxini et al., 2006) alone do not accurately reflect the shearstress experienced by the cell monolayer due to the

Figure 5. Shear stress contours at the surface of the three substrate surfaces:
(a) tissue culture polystyrene, (b) 3mm wide, 0.5mm high pillars, (c) 3mm wide, 0.5mm
high ridges and at the surface of the modeled cell monolayer grown on the three
surfaces, respectively, (d), (e), and (f).
planarizing effect that the cell monolayer has on microscalesubstrate features. Hence, it is only by using measureddata from the cell monolayer surface in the CFD model thatan accurate picture of shear stress resulting from contactwith flowing fluid can be obtained.
In previous studies where models have been producedof cells that have been aligned as a result of exposure to fluidshear stress, both the peak shear stress and the spatialgradients of shear stress at the cell monolayer surfacehave been observed to be lower for aligned cells than forrandomly oriented cells (Barbee, 2002; Davies and Barbee,
Table II. Modeled shear stress.
TCP Pillars Ridges
Cells on
TCP
Cells on
pillars
Cells on
ridges
Mean shear
stress (Pa)
0.75 0.63 0.52 0.76 0.76 0.75
Maximum shear
stress (Pa)
1.09 1.74 1.59 1.32 1.43 1.4
Minimum shear
stress (Pa)
0.51 0.05 0.02 0.41 0.43 0.44
Standard
deviation (Pa)
0.06 0.35 0.3 0.11 0.12 0.14
1994; Davies et al., 1995; Fukushima et al., 2001). Satcheret al. (1992) generated a model surface which representedthe cell monolayer surface as a sinusoidal oscillating surface,and noted that shear stress gradients were lower for alignedcells. The results presented here indicate that there is only amarginally lower peak shear stress for aligned and elongatedcells than that observed for randomly oriented cells on themicrostructured surfaces. However, there is a significantreduction in the spatial shear stress gradient in the flowdirection for the aligned and elongated cells. It is suggestedthat the similarity in the peak shear stress magnitudes resultsfrom the corresponding similarity in the peak-to-valleyheights as measured for the aligned and non-aligned cellsurfaces. Previous studies where significantly lower peakshear stresses are observed for aligned cells generallycorrespond to the presence of lower peak-to-valley heightvalues for aligned cells compared to that for non-alignedcells (Davies et al., 1995; Fukushima et al., 2001). Thecytoskeletal effects that are observed as a result of flowinduced alignment are known to differ from those observedfor cells aligned by culturing on specific surface features(Vartanian et al., 2008), with the reorganization of bothactin stress fibers and of the microtubule structure seen inresponse to shear but not with alignment to a micro-patterned surface. Hence the cell shape and the peak to valleyheights measured in this study may differ from thosemeasured on cells aligned by exposure to shear stress.
By evaluating of the effects of microstructured surfaces onthe topography of cultured endothelial cell monolayers, andcombining this withCFD, it has been possible to createmodelswhich represent the effect these underlying surface featureshave on the shear stress experienced by cell grown thereon in aparallel plate flow chamber. The representation of a cellmonolayer as a sinusoidal wavy surface provides a means ofgenerating amore effectivemodel of the cell monolayer than isprovided by assuming a planar surface and requires only theoverall dimensions of the cells to be known. These modelscould provide insight into the differences between cellalignment due to shear stress exposure and cell alignmentin response to the underlying substrate.
The use of 3mm wide, 0.5mm high microstructuralfeatures on TCP substrates has resulted in measureddifferences in cell shape. Hot embossed hexagonal packedpillars result in cells that were less well spread out than thosefound on pristine TCP, while parallel ridges resulted incells that were significantly elongated and aligned in thedirection of the ridges. In the case of the 0.5mm highfeatures considered here, the monolayer of endothelialcells cultured thereon planarized the microstructure to theextent that the 0.5mm steps could not be detected byobserving the topography of the cell monolayer surface.Nevertheless, this CFD study highlights that there is a notableeffect of the underlying substrate on the morphology of cellscultured thereon and thus on the shear stress magnitudes andgradients that result. An understanding of how these cell–substrate interactions will affect the performance of the cellmonolayer when exposed to shear stress could have
Brown et al.: Microstructured Polymer Substrates 1155
Biotechnology and Bioengineering

Figure 6. Histograms of shear stress at the modeled cell monolayer surface on (a) TCP, (b) 3mmwide, 0.5mm high pillars, (c) 3mmwide, 0.5mm high ridges and histograms of
shear stress gradient (d), (e), and (f) at the surface of the modeled cell monolayer grown on the same surfaces.
applications in the design of vascular implants that encouragecell alignment where this is clinically advantageous, and in thedesign of tissue engineering scaffolds and bioreactors, wherethe processes of angiogenesis might be influenced by both thesubstrate and the shear stress exposure in a bioreactor.
The authors acknowledge the National Access Programme award
(NAP 149) from the Tyndall National Institute funded by Science
Foundation Ireland for the fabrication of hot embossing stamps.
1156 Biotechnology and Bioengineering, Vol. 108, No. 5, May, 2011
References
Anderson EJ, Falls TD, Sorkin AM, Tate MLK. 2006. The imperative for
controlled mechanical stresses in unraveling cellular mechanisms of
mechanotransduction. Biomed Eng Online (Electronic Resource)
5:27.
Ando J, Yamamoto K. 2009. Vascular mechanobiology: Endothelial cell
responses to fluid shear stress. Circ J 73:1983–1992.
Bacabac RG, Smit TH, Cowin SC, Van Loon JJWA, Nieuwstadt FTM,
Heethaar R, Klein-Nulend J. 2005. Dynamic shear stress in parallel-
plate flow chambers. J Biomech 38:159–167.

Ballermann BJ, Dardik A, Eng E, Liu A. 1998. Shear stress and the
endothelium. Kidney Int 54:S100–S108.
Bao X, Lu C, Frangos JA. 1999. Temporal gradient in shear but not steady
shear stress induces PDGF-A and MCP-1 expression in endothelial
cells: Role of NO, NF kappa B, and egr-1. Arterioscler Thromb Vasc
Biol 19:996–1003.
Barbee KA. 2002. Role of subcellular shear-stress distributions in endothe-
lial cell mechanotransduction. Ann Biomed Eng 30:472–482.
Barbee K, Davies P, Lal R. 1994. Shear stress-induced reorganization of the
surface topography of living endothelial cells imaged by atomic force
microscopy. Circ Res 74:163–171.
Barbee KA, Mundel T, Lal R, Davies PF. 1995. Subcellular distribution of
shear stress at the surface of flow-aligned and nonaligned endothelial
monolayers. Am J Physiol Heart Circ Physiol 268:H1765–H1772.
Brooks AR, Lelkes PI, Rubanyi GM. 2004. Gene expression profiling of
vascular endothelial cells exposed to fluid mechanical forces: Relevance
for focal susceptibility to atherosclerosis. Endothelium 11:45.
Brown TD. 2000. Techniques for mechanical stimulation of cells in vitro: A
review. J Biomech 33:3–14.
Brown A, Meenan BJ. 2007. Investigating the effects of fluid shear forces on
cellular responses to profiled surfaces in-vitro: A computational and
experimental investigation. Conf Proc IEEE Eng Med Biol Soc
2007:5387–5390.
Brown A, Meenan BJ, Burke G. 2010. The effect of microstructured surfaces
on endothelial cell response to laminar shear stress. Proc ESB2010,
September 2010, Tampere, Finland.
Brunette DM, Hamilton DW, Chehroudi B, Waterfield JD. 2005. Update on
improving the bio-implant interface by controlling cell behaviour using
surface topography. Int Congr Ser 1284:229–238.
Carmeliet P. 2000.Mechanisms of angiogenesis and arteriogenesis. NatMed
6:389–395.
Charest JL, Eliason MT, Garcia AJ, King WP. 2006. Combined microscale
mechanical topography and chemical patterns on polymer cell culture
substrates. Biomaterials 27:2487–2494.
Chen Z, Tzima E. 2009. PECAM-1 is necessary for flow-induced vascular
remodeling. Arterioscler Thromb Vasc Biol 29:1067–1073.
Chen CS, Mrksich M, Huang S, Whitesides GM, Ingber DE. 1998. Micro-
patterned surfaces for control of cell shape, position, and function.
Biotechnol Prog 14:356–363.
Chiu JJ, Lee PL, Chang SF, Chen LJ, Lee CI, Lin KM, Usami S, Chien S. 2005.
Shear stress regulates gene expression in vascular endothelial cells in
response to tumor necrosis factor-alpha: A study of the transcription
profile with complementary DNA microarray. J Biomed Sci 12:481–502.
Choi HW, Barakat AI. 2009. Modulation of ATP/ADP concentration at the
endothelial cell surface by flow: Effect of cell topography. Ann Biomed
Eng 37:2459–2468.
Cioffi M, Boschetti F, Raimondi MT, Dubini G. 2006. Modeling evaluation
of the fluid-dynamic microenvironment in tissue-engineered con-
structs: A micro-CT based model. Biotechnol Bioeng 93:500–510.
Curtis A, Wilkinson C. 1997. Topographical control of cells. Biomaterials
18:1573–1583.
Dai G, Kaazempur-MofradMR, Natarajan S, Zhang Y, Vaughn S, Blackman
BR, Kamm RD, Garcıa-Cardena G, Gimbrone MA. 2004. Distinct
endothelial phenotypes evoked by arterial waveforms derived from
atherosclerosis-susceptible, -resistant regions of human vasculature.
Proc Natl Acad Sci USA 101:14871–14876.
Davies P, Barbee K. 1994. Endothelial cell surface imaging: Insights into
hemodynamic force transduction. News Physiol Sci 9:153–157.
Davies PF, Remuzzi A, Gordon EJ, Dewey CF, Jr., Gimbrone MA, Jr. 1986.
Turbulent fluid shear stress induces vascular endothelial cell turnover
in vitro. Proc Natl Acad Sci USA 83:2114–2117.
Davies PF, Mundel T, Barbee KA. 1995. A mechanism for heterogeneous
endothelial responses to flow in vivo and in vitro. J Biomech 28:1553–
1560.
Davies PF, Barbee KA, Volin MV, Robotewskyj A, Chen J, Joseph L, Griem
ML, Wernick MN, Jacobs E, Polacek DC, dePaola N, Barakat AI. 1997.
Spatial relationships in early signaling events of flow-mediated
endothelial mechanotransduction. Annu Rev Physiol 59:527–549.
Daxini SC, Nichol JW, Sieminski AL, Smith G, Gooch KJ, Shastri VP. 2006.
Micropatterned polymer surfaces improve retention of endothelial cells
exposed to flow-induced shear stress. Biorheology 43:45–55.
DePaola N, Gimbrone MA, Jr., Davies PF, Dewey CF, Jr. 1992. Vascular
endothelium responds to fluid shear stress gradients. Arterioscler
Thromb 12:1254–1257.
Frangos JA, McIntire LV, Eskin SG. 1988. Shear stress induced stimulation
of mammalian cell metabolism. Biotechnol Bioeng 32:1053–1060.
Fukushima S, Nagatsu A, Kaibara M, Oka K, Tanishita K. 2001. Measure-
ment of surface topography of endothelial cell and wall shear stress
distribution on the cell. JSME Int J Ser C 44:972–981.
Hsu S, Thakar R, Liepmann D, Li S. 2005. Effects of shear stress on
endothelial cell haptotaxis on micropatterned surfaces. Biochem Bio-
phys Res Commun 337:401–409.
Kato S, Ando J, Matsuda T. 2001. MRNA expression on shape-engineered
endothelial cells: Adhesion molecules ICAM-1 and VCAM-1. J Biomed
Mater Res 54:366–372.
Kidoaki S, Matsuda T. 2007a. Shape-engineered fibroblasts: Cell elasticity
and actin cytoskeletal features characterized by fluorescence and atomic
force microscopy. J Biomed Mater Res A 81:803–810.
Kidoaki S, Matsuda T. 2007b. Shape-engineered vascular endothelial cells:
Nitric oxide production, cell elasticity, and actin cytoskeletal features. J
Biomed Mater Res A 81:728–735.
Kleinstreuer C, Lei M, Archie JP, Jr. 1996. Flow input waveform effects on
the temporal and spatial wall shear stress gradients in a femoral graft-
artery connector. J Biomech Eng 118:506–510.
LaMack JA, Friedman MH. 2007. Individual and combined effects of shear
stress magnitude and spatial gradient on endothelial cell gene expres-
sion. Am J Physiol Heart Circ Physiol 293:H2853–H2859.
Lawrence BJ, Devarapalli M, Madihally SV. 2009. Flow dynamics in
bioreactors containing tissue engineering scaffolds. Biotechnol Bioeng
102:935–947.
Lesman A, Blinder Y, Levenberg S. 2010. Modeling of flow-induced shear
stress applied on 3D cellular scaffolds: Implications for vascular tissue
engineering. Biotechnol Bioeng 105:645–654.
Levesque MJ, Nerem RM. 1985. The elongation and orientation of cultured
endothelial cells in response to shear stress. J Biomech Eng 107:341–
347.
Li YJ, Haga JH, Chien S. 2005. Molecular basis of the effects of shear stress
on vascular endothelial cells. J Biomech 38:1949–1971.
Li M, Scott DE, Shandas R, Stenmark KR, Tan W. 2009. High pulsatility
flow induces adhesion molecule and cytokine mRNA expression in
distal pulmonary artery endothelial cells. Ann Biomed Eng 37:1082–
1092.
Liliensiek SJ, Wood JA, Yong J, Auerbach R, Nealey PF, Murphy CJ. 2010.
Modulation of human vascular endothelial cell behaviors by nanoto-
pographic cues. Biomaterials 31:5418–5426.
Malek A, Izumo S. 1996. Mechanism of endothelial cell shape change and
cytoskeletal remodeling in response to fluid shear stress. J Cell Sci
109:713–726.
Martines E, McGhee K, Wilkinson C, Curtis A. 2004. A parallel-plate flow
chamber to study initial cell adhesion on a nanofeatured surface. IEEE
Trans Nanobiosci 3:90–95.
Metallo CM, Vodyanik MA, de Pablo JJ, Slukvin II, Palecek SP. 2008. The
response of human embryonic stem cell-derived endothelial cells to
shear stress. Biotechnol Bioeng 100:830–837.
Nagel T, Resnick N, Dewey CF, Jr., Gimbrone MA, Jr. 1999. Vascular
endothelial cells respond to spatial gradients in fluid shear stress by
enhanced activation of transcription factors. Arterioscler Thromb Vasc
Biol 19:1825–1834.
RasbandWS. 2009. ImageJ. US National Institutes of Health, Bethesda,MD,
USA. available at: http:\\rsb.info.nih,gov/ij/ accessed 11/10/2010
Risau W. 1997. Mechanisms of angiogenesis. Nature 386:671–674.
Satcher RL, Jr., Bussolari SR, Gimbrone MA, Jr., Dewey CF, Jr. 1992. The
distribution of fluid forces on model arterial endothelium using
computational fluid dynamics. J Biomech Eng 114:309–316.
Sucosky P, Osorio DF, Brown JB, Neitzel GP. 2004. Fluid mechanics of a
spinner-flask bioreactor. Biotechnol Bioeng 85:34–46.
Brown et al.: Microstructured Polymer Substrates 1157
Biotechnology and Bioengineering

Sucosky P, Balachandran K, Elhammali A, Jo H, Yoganathan AP. 2009.
Altered shear stress stimulates upregulation of endothelial VCAM-1
and ICAM-1 in a BMP-4- and TGF-{beta}1-dependent pathway.
Arterioscler Thromb Vasc Biol 29:254–260.
Traub O, Berk BC. 1998. Laminar shear stress: Mechanisms by which
endothelial cells transduce an atheroprotective force. Arterioscler
Thromb Vasc Biol 18:677–685.
Tressel SL, Huang R, Tomsen N, Jo H. 2007. Laminar shear inhibits tubule
formation and migration of endothelial cells by an angiopoietin-2-
dependent mechanism. Arterioscler Thromb Vasc Biol 27:2150–2156.
Tzima E, Irani-TehraniM, KiossesWB, Dejana E, Schultz DA, Engelhardt B,
Cao G, DeLisser H, Schwartz MA. 2005. A mechanosensory complex
that mediates the endothelial cell response to fluid shear stress. Nature
437:426–431.
Ueda A, Koga M, Ikeda M, Kudo S, Tanishita K. 2004. Effect of shear stress
on microvessel network formation of endothelial cells with in vitro
three-dimensional model. Am J Physiol Heart Circ Physiol 287:H994–
H1002.
1158 Biotechnology and Bioengineering, Vol. 108, No. 5, May, 2011
Uttayarat P, Toworfe GK, Dietrich F, Lelkes PI, Composto RJ. 2005.
Topographic guidance of endothelial cells on silicone surfaces with
micro- to nanogrooves: Orientation of actin filaments and focal
adhesions. J Biomed Mater Res Part A 75A:668–680.
Vartanian KB, Kirkpatrick SJ, Hanson SR, Hinds MT. 2008. Endothelial cell
cytoskeletal alignment independent of fluid shear stress on micropat-
terned surfaces. Biochem Biophys Res Commun 371:787–792.
Wendt D, Riboldi SA, Cioffi M, Martin I. 2009. Potential and bottlenecks of
bioreactors in 3D cell culture and tissue manufacturing. Adv Mater
21:3352–3367.
Yamaguchi T, Yamamoto Y, Liu H. 2000. Computational mechanical model
studies on the spontaneous emergent morphogenesis of the cultured
endothelial cells. J Biomech 33:115–126.
Yazdani SK, Tillman BW, Berry JL, Soker S, Geary RL. 2010. The fate of an
endothelium layer after preconditioning. J Vasc Surg 51:174–183.
Zorlutuna P, Rong Z, Vadgama P, Hasirci V. 2009. Influence of nanopat-
terns on endothelial cell adhesion: Enhanced cell retention under shear
stress. Acta Biomater 5:2451–2459.