Embed Size (px)
Citation preview


MODELING OF NONLINEAR BEHAVIOR OF STEEL BEAM TO COLUMN
SEMI-RIGID CONNECTIONS WITH 3-D SOLID FINITE ELEMENTS
A THESIS SUBMITTED TO
THE GRADUATE SCHOOL OF NATURAL AND APPLIED SCIENCES
OF
MIDDLE EAST TECHNICAL UNIVERSITY
BY
NURETTİN MURAT AZAP
IN PARTIAL FULFILLMENT OF THE REQUIREMENTS
FOR
THE DEGREE OF MASTER OF SCIENCE
IN
CIVIL ENGINEERING
JULY 2013


Approval of the thesis:
MODELING OF NONLINEAR BEHAVIOR OF STEEL BEAM TO COLUMN
SEMI-RIGID CONNECTIONS WITH 3-D SOLID FINITE ELEMENTS
Submitted by NURETTİN MURAT AZAP in partial fulfillment of the requirements for the
degree of Master of Science in Civil Engineering Department, Middle East Technical
University by,
Prof. Dr. Canan ÖZGEN
Dean, Graduate School of Natural and Applied Sciences
Prof. Dr. Ahmet Cevdet YALÇINER
Head of Department, Civil Engineering
Assoc. Prof. Dr. Afşin SARITAŞ
Supervisor, Civil Engineering Dept., METU
Examining Committee Members
Prof. Dr. Mehmet UTKU
Civil Engineering Dept., METU
Assoc. Prof. Dr. Afşin SARITAŞ
Civil Engineering Dept., METU
Assoc. Prof. Dr. Oğuzhan HASANÇEBİ
Civil Engineering Dept., METU
Asst. Prof. Dr. Ercan GÜRSES
Aerospace Engineering Dept., METU
Dr. Cenk TORT
Miteng
Date : 11.07.2013

iv
I hereby declare that all information in this document has been obtained and presented in
accordance with academic rules and ethical conduct. I also declare that, as required by
these rules and conduct, I have fully cited and referenced all material and results that are
not original to this work.
Name, Last name : N. Murat AZAP
Signature :

v
ABSTRACT
MODELING OF NONLINEAR BEHAVIOR OF STEEL BEAM TO COLUMN
SEMI-RIGID CONNECTIONS WITH 3-D SOLID FINITE ELEMENTS
AZAP, Nurettin Murat
M.S., Department of Civil Engineering
Supervisor: Assoc. Prof. Dr. Afşin SARITAŞ
July 2013, 70 pages
In steel structural systems, beam to column connections are usually assumed either rigid
or pinned in practice. In reality rigid connections have some flexibility and shear connections
have some rigidity incorporated in their real behavior with significant nonlinearity included, as
well; thus this behavior results into the categorization of some connections as semi-rigid. Beam
to column connection regions contain one or more of the following components: angles, plates,
welds, and bolts. Understanding the physical actions occurring between all these parts is crucial.
In this regards the development and use of numerical tools and also further experimental studies
trying to identify the monotonic and cyclic behavior of semi-rigid connections have gained
significant attention. Detailed modeling and analysis of structural members by using advanced
finite element programs is very common nowadays. Conducting experiments may supplement
verification of numerical simulations; however experimental works may not be practical in some
cases. Despite the advance in computer technology, for the modeling of the complex interaction
of geometric and material nonlinearities in steel semi-rigid connections the use of regular
computers may not always suffice in terms of computer power and large amounts of analysis
time is still needed.
In this thesis 3-D finite element modeling and analysis of semi-rigid connections is
undertaken, where for this purpose a special type of bolted beam to column connection is chosen
due to its truly semi-rigid characteristic. Previous experiments conducted on this connection type
in the last three decades are considered for the numerical study undertaken in this thesis. Results
obtained from numerical simulations are compared with experimental data and the reliability of
3-D modeling of connections with the use of advanced nonlinear finite element programs is
assessed. In order to model bolted beam to column connections accurately in a numerical
simulation for all connection topologies, detailed understanding of the nonlinearities that need to
be taken into account during the use of finite element software should be well known. In this

vi
regards, special attention has been given in this thesis for the presentation of how a bolted beam
to column connection region shall be modeled, as well.
Keywords: Steel, bolted beam to column connections, semi-rigid connections, finite element
method, nonlinear analysis with 3-D finite elements

vii
ÖZ
YARI-RİJİT ÇELİK KİRİŞ-KOLON BAĞLANTILARIN DOĞRUSAL OLMAYAN
DAVRANIŞININ 3 BOYUTLU SONLU ELEMANLARLA MODELLENMESİ
AZAP, Nurettin Murat
Yüksek Lisans, İnşaat Mühendisliği Bölümü
Tez Yöneticisi: Doç. Dr. Afşin SARITAŞ
Temmuz 2013, 70 sayfa
Pratikte, çelik yapı sistemlerindeki kiriş–kolon bağlantıları genellikle ya rijit (moment)
ya da basit (mafsal) bağlantı tipleri olarak varsayılmaktadırlar. Gerçek durumda bağlantı
tiplerinin dikkate değer lineer olmayan davranışları göz önüne alındığında, rijit bağlantıların bir
miktar esnekliğe sahip olduğu ve basit bağlantıların da bir miktar rijitliğe sahip oldukları, hatta
bu sebepten dolayı da bazı bağlantı tiplerinin yarı-rijit bağlantı adı altında kategorize edildikleri
bilinmektedir. Kiriş-kolon bağlantı bölgeleri bir ya da birden fazla sayıda/miktarda köşebent,
plaka, kaynak ve bulon gibi birleşenleri içermektedirler. Tüm bu bileşenlerin birbirleri ile olan
fiziksel etkileşimlerinin anlaşılması son derece önemlidir. Bu bakımdan, sayısal programlar
kullanarak ve deneysel çalışmalar yürüterek yarı-rijit bağlantıların monotonik ve çevrimsel
davranışlarının araştırılması çok önemli bir ilgi konusu haline gelmiştir. Yapısal elemanların
detaylı analizi ve modellenmesi için gelişmiş sonlu elemanlar programlarının kullanımı çok
yaygın hale gelmiştir. Sayısal simülasyonların deneyler ile tamamlanması mümkündür ancak,
deneysel çalışmaların yürütülmesi bazı durumlarda pratik olmayabilmektedir. Bilgisayar
teknolojisindeki ilerlemelere rağmen, yarı-rijit bağlantılardaki doğrusal olmayan geometrik ve
malzeme davranışlarının karmaşık özelliğinin modellenmesi günlük bilgisayar kullanımı ile
yetersiz kalabilmekte ve uzun zamanlar alabilmektedir.
Bu tezde yarı-rijit bağlantıların üç boyutlu sonlu elemanlarla modellenmesi ve analizi
gerçekleştirilmiş ve karşılaştırmalar özellikle bulonlu kolon-kiriş bağlantıların yarı-rijit
karakteristiğine odaklanmıştır. Yapılan araştırmalar sonucu bulunmuş, son 30 yılda bu bağlantı
tipi ile ilgili gerçekleştirilmiş deneysel çalışmalar bu tez kapsamı altında dikkate alınmıştır.
Sayısal simülasyonların sonuçları, deneysel veriler ile karşılaştırılmış ve gelişmiş lineer olmayan
sonlu elemanlar programı ile modellenmiş üç boyutlu bağlantı modellerinin güvenirliliği
bulunmaya çalışılmıştır. Bulonlu kolon-kiriş tipi bağlantıların doğru olarak sayısal bir biçimde
modellenebilmeleri için, sonlu elemanlar programlarının kullanımlarının ve lineer olmayan

viii
davranışların detaylı bir biçimde bilinmeleri gerekmektedir. Bu bakımdan bulonlu bir kolon-kiriş
bağlantısının modellenmesi ile ilgili özel bir sunum da bu tez kapsamında verilmiştir.
Anahtar Kelimeler: Çelik, bulonlu kiriş-kolon bağlantıları, yarı-rijit bağlantılar, sonlu elemanlar
yöntemi, üç boyutlu sonlu elemanlarla doğrusal olmayan analiz

ix
ACKNOWLEDGMENTS
I wish to express my deepest gratitude to my supervisor and mentor Assoc. Dr. Afşin
SARITAŞ for his continuous support, guidance, advice, criticism, encouragements and insight
throughout the thesis work and also during my graduate student life.
The help, tolerance, patience and continuous support of my friends, colleagues and all
previous & current business managers are also acknowledged with great appreciation.
I wish to express my sincere thanks to the professors and faculty members for advice
and valuable knowledge that I got from them during my graduate education. In this regards, I
would like to say thanks especially to Assoc. Prof. Ayşegül ASKAN GÜNDOĞAN for being
both a friend & a professor in this period.
I would especially like to express my deepest thanks to my second sister Yaşam
KIZILDAĞ, who has always been with me from high school to the end of graduate life with
endless support, patience and friendship.
I am most grateful for being one of the most patient and supportive person in my
graduate student life for Duygu Melis ARSLAN. She has always supported and encouraged me
from the beginning to the end of my study & graduate life with boundless patience and
compassion. In this regards, I would specially like to thank her.
This thesis is especially dedicated to my family members and I would also like to offer
my deepest thanks to each of my family members; my mother S. Gülşen AZAP, my father
Selçuk AZAP, my sister Tuğba ÇAYIRCIOĞLU & my brother Z. Cenk ÇAYIRCIOĞLU for
their patience, infinite support and endless love during my study & life. Also I would like to
thank my nephew Zeynep ÇAYIRCIOĞLU for being my source of happiness.

x
TABLE OF CONTENTS
ABSTRACT .................................................................................................................................. v
ÖZ ........................................................................................................................................... vii
ACKNOWLEDGMENTS ............................................................................................................ ix
TABLE OF CONTENTS .............................................................................................................. x
LIST OF TABLES ...................................................................................................................... xii
LIST OF FIGURES .................................................................................................................... xiii
LIST OF SYMBOLS AND ABBREVIATIONS ........................................................................ xv
CHAPTERS
1. INTRODUCTION .............................................................................................................. 1
1.1 General ............................................................................................................................. 1
1.2 Semi-Rigid Connection Types.......................................................................................... 2
1.2.1 Single Web – Angle / Plate Connections ................................................................... 3
1.2.2 Double Web – Angle Connections ............................................................................. 5
1.2.3 Top and Bottom L Angle Connections ....................................................................... 5
1.2.4 Top and Seat Angles with Double Web Angles Connections .................................... 6
1.2.5 Plate Welded Connections.......................................................................................... 7
1.3 Literature Review ........................................................................................................... 10
1.3.1 Experimental Studies ................................................................................................ 10
1.3.2 Numerical Simulations ............................................................................................. 11
1.4 Organization of Thesis ................................................................................................... 12
2. FINITE ELEMENT MODELING OF NONLINEAR SEMI-RIGID CONNECTIONS .. 13
2.1 Material Properties & Models ........................................................................................ 13
2.2 Meshing .......................................................................................................................... 14
2.2.1 Meshing for Bolts ..................................................................................................... 16
2.2.2 Meshing of L-Shaped Angles and I-Section Beam .................................................. 18
2.3 Robustness of Simulations ............................................................................................. 20
2.4 Nonlinear Contact Modeling Between Surfaces ............................................................ 21
2.4.1 Contact Simulation for Bolt Bearing ........................................................................ 24
2.5 Bolt Pretension ............................................................................................................... 25
xi
3. NONLINEAR FINITE ELEMENT MODELLING .......................................................... 29
3.1 Azizinamini’s Experiments ............................................................................................. 29
3.1.1 Material Properties ................................................................................................... 29
3.1.2 Test Specimens ......................................................................................................... 30
3.2 Calado’s Experiments ..................................................................................................... 38
3.2.1 Material Properties ................................................................................................... 38
3.2.2 Test Specimens ......................................................................................................... 39
3.3 Komuro’s Experiments ................................................................................................... 46
3.3.1 Material Properties ................................................................................................... 47
3.3.2 Test Specimens ......................................................................................................... 48
3.4 Remarks on Numerical Analysis ..................................................................................... 52
4. SUMMARY AND CONCLUSION .................................................................................. 55
4.1 Summary ......................................................................................................................... 55
4.2 Conclusion ...................................................................................................................... 55
4.3 Recommendations for Future Researchers ...................................................................... 57
REFERENCES ............................................................................................................................ 59
APPENDIX A .............................................................................................................................. 61

xii
LIST OF TABLES
TABLES
Table 2.1 Approximate Time Consumption ................................................................................. 21
Table 3.1 Azizinamini (1985) Coupon Test Results .................................................................... 30
Table 3.2 Specimens of Azizinamini (1985) used in FE Simulations .......................................... 30
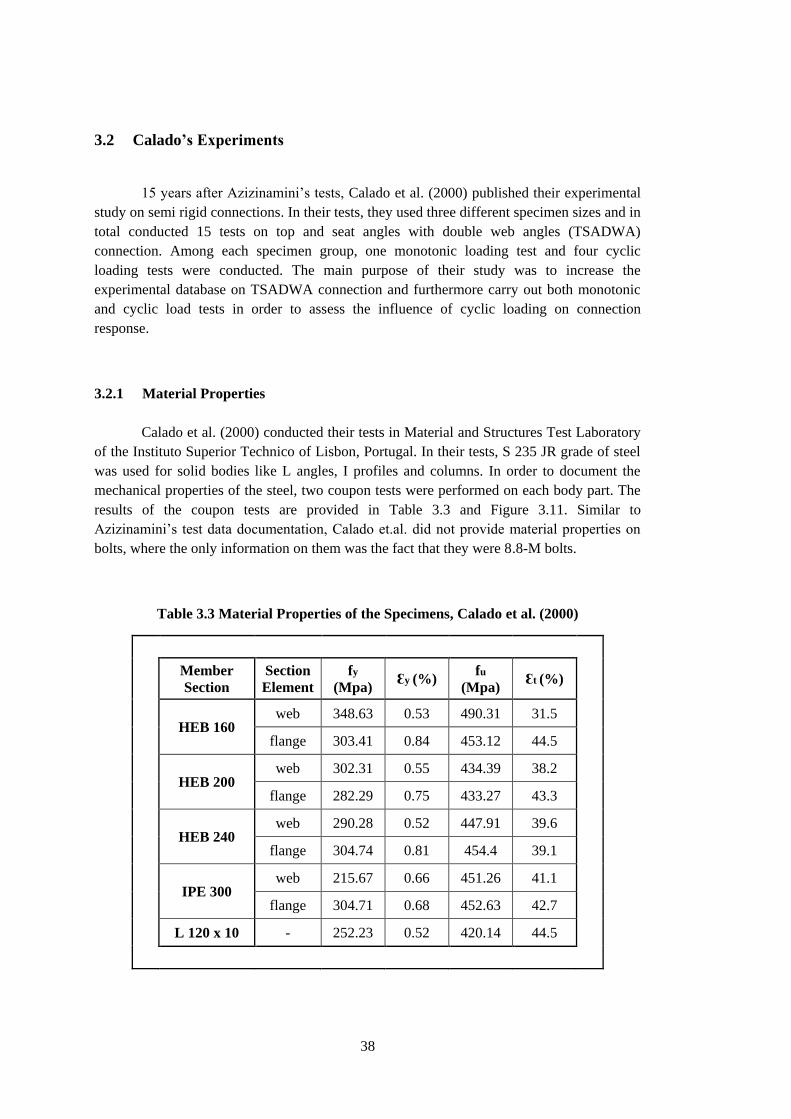
Table 3.3 Material Properties of the Specimens, Calado et al. (2000) ......................................... 38
Table 3.4 Specimen Table for Calado et al. (2000) ...................................................................... 40
Table 3.5 Coupon Test Results of the Materials, Komuro et al. (2003) ....................................... 47
Table 3.6 Test Specimen Table of Komuro et al. (2003) ............................................................. 48

xiii
LIST OF FIGURES
FIGURES
Figure 1.1 Typical Moment – Rotation (M - R) Curve for Beam – Column Connection
Azizinamini (1985) ........................................................................................................................ 3
Figure 1.2 Single Web Angle (L Profile) Connection Type, Chen et al. (2011) ........................... 4
Figure 1.3 Single Web Plate Connection Type, Chen et al. (2011) ............................................... 4
Figure 1.4 Double Web Angles Connection Type ......................................................................... 5
Figure 1.5 Top and Seat Angles Connection Type, Chen et al. (2011) ......................................... 6
Figure 1.6 Top and Seat Angles with Double Web Angles Connection Type ............................... 7
Figure 1.7 Extended End-Plate (Only Tension Side) Connection Type ........................................ 8
Figure 1.8 Extended End-Plate (Both Tension and Compression Side) Connection Type ............ 8
Figure 1.9 Flush End-Plate Connection Type, Chen et al. (2011) ................................................. 9
Figure 1.10 Header Plate Connection Type, Chen et al. (2011) .................................................... 9
Figure 2.1 Meshing Type Options, ANSYS Workbench ............................................................. 14
Figure 2.2 Element Size of the Mesh, ANSYS Workbench ........................................................ 15
Figure 2.3 Element Midside Nodes, ANSYS Workbench ........................................................... 15
Figure 2.4 Different Meshing Options, ANSYS Workbench ...................................................... 16
Figure 2.5 Profile – Bolt Connection (Default) ........................................................................... 17
Figure 2.6 Profile – Bolt Connection (Refined L profile only) .................................................... 17
Figure 2.7 Profile – Bolt Connection (Refined L profile and bolts) ............................................ 17
Figure 2.8 Coarse I-Section Beam – Fine Angles ........................................................................ 19
Figure 2.9 Beam Body Mesh Comparison Table ......................................................................... 19
Figure 2.10 Back Profiles, L Angles & Bolts Meshing Comparison Table ................................. 20
Figure 2.11 Numerical Test Setup for Friction Coefficient Comparison ..................................... 23
Figure 2.12 Influence of Friction Coefficient on Structure Response ......................................... 23
Figure 2.13 Undeformed shape of the profile for contact demonstration .................................... 24
Figure 2.14 Deformed shape of the bolt for contact demonstration............................................. 25
Figure 2.15 Stress Distribution of the profile for contact demonstration, ANSYS Workbench .. 25
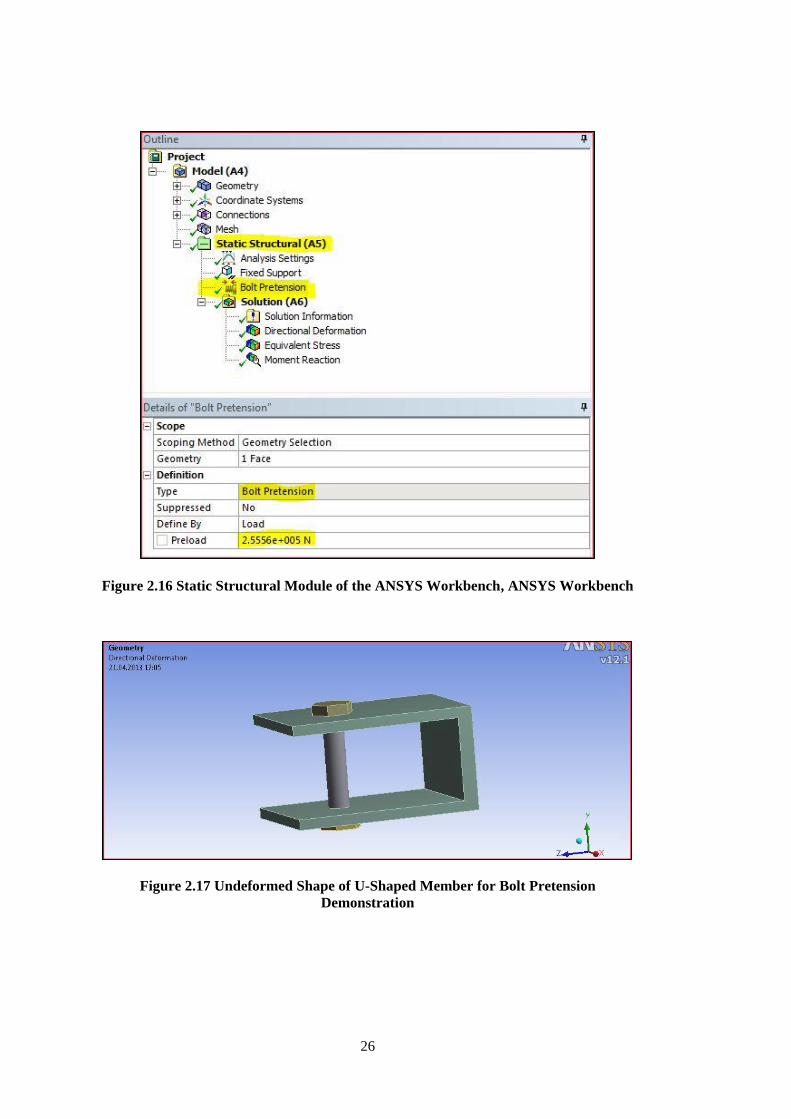
Figure 2.16 Static Structural Module of the ANSYS Workbench, ANSYS Workbench ............ 26
Figure 2.17 Undeformed Shape of U-Shaped Member for Bolt Pretension Demonstration ....... 26
Figure 2.18 Deformed Shape of U-Shaped Member for Bolt Pretension Demonstration ........... 27
Figure 3.1 8sx Test Specimen Setup, Azizinamini (1985) ........................................................... 31
Figure 3.2 14sxTest Specimen Setup, Azizinamini (1985) .......................................................... 31
Figure 3.3 Nonlinear Undeformed Finite Element Model for 8S1 .............................................. 32
Figure 3.4 Expected Deformed Shape, Azizinamini (1985) ........................................................ 32
Figure 3.5 Nonlinear Deformed Finite Element Model for 14S5 ................................................ 33
Figure 3.6 Comparison of Moment-Rotation Responses for 14S1 Specimen of Azizinamini .... 33
Figure 3.7 Comparison of Moment-Rotation Responses for 14S5 Specimen of Azizinamini .... 34

xiv
Figure 3.8 Comparison of Moment-Rotation Responses for 8S1 Specimen of Azizinamini ....... 35
Figure 3.9 Comparison of Moment-Rotation Responses for 8S2 Specimen of Azizinamini ....... 36
Figure 3.10 Moment-Rotation Responses for 8S3 Specimen of Azizinamini ............................. 37
Figure 3.11 Coupon Test Results of the Specimens, Calado et al. (2000) ................................... 39
Figure 3.12 Experimental Test Setups for the Specimens, Calado et al. (2000) .......................... 41
Figure 3.13 Testing Lay-out, Calado et al. (2000) ....................................................................... 41
Figure 3.14 Undeformed Shape of model for BCC7 .................................................................... 42
Figure 3.15 Deformed Shape of model for BCC7 ........................................................................ 43
Figure 3.16 Deformed Shape of Experimental Test Setup ........................................................... 43
Figure 3.17 Comparison of Moment-Rotation Responses for BCC7 Specimen of Calado et al.
(2000) ........................................................................................................................................... 44
Figure 3.18 Comparison of Moment-Rotation Responses for BCC9 Specimen of Calado et al.
(2000) ........................................................................................................................................... 45
Figure 3.19 Comparison of Moment-Rotation Responses for BCC-10 Specimen of Calado et al.
(2000) ........................................................................................................................................... 46
Figure 3.20 Stress – Strain Relationship of the Materials, Komuro et al. (2003) ........................ 47
Figure 3.21 Experimental Test Setups, Komuro et al. (2003) ...................................................... 48
Figure 3.22 Experimental Setup of the Specimens, Komuro et al. (2003) ................................... 49
Figure 3.23 Deformed Shape of the Specimen, Komuro et al. (2003) ......................................... 49
Figure 3.24 Deformed Shape, Komuro et al. (2003) .................................................................... 50
Figure 3.25 Deformed View of W18 ............................................................................................ 50
Figure 3.26 Comparison of Moment-Rotation Responses for W18 Specimen of Komuro et al.
(2003) ........................................................................................................................................... 51
Figure 3.27 Comparison of Moment-Rotation Responses for W29 Specimen of Komuro et al.
(2003) ........................................................................................................................................... 52

xv
LIST OF SYMBOLS AND ABBREVIATIONS
3-D Three Dimensional
R Rotation
AISC American Institute of Steel Construction
ASTM American Society for Testing and Materials
DWA Double Web Angle
FE Finite Element
M Moment
SWAP Single Web – Angle / Plate
TSA Top and Seat Angle
TSADWA Top, Seat and Double Web Angle

0

1
CHAPTER 1
1. INTRODUCTION
1.1 General
Members forming steel structural systems such as beams, columns, bracings,
flooring and roofing systems are all separately fabricated and connected to each other during
construction. The relative motion of the connecting parts could be simply idealized as either
fully restrained or partly free to move. Among all these connections, beam to column
connections are usually considered as the most important part of a steel structure. Beam to
column connections are usually assumed either rigid (fully restrained against rotation) or
pinned (free to rotate) in practice (Citipitioglu et al. 2002). These two end cases are
idealizations of reality and there is always partial restraint provided by the connection
region. For some connection types though the behavior of the connection is much different
than these two ideal end cases and these types of connections are called as partially
restrained or semi-rigid. Beam to column connection regions contain one or more of the
following components: angles, plates, welds, and bolts. There is some flexibility/rigidity
provided by the connection region due to the presence of all these parts when compared with
respect to the ideal two end cases. Especially after Northridge Earthquake in 1994 and Kobe
Earthquake in 1995, nonlinear behavior of a connection became a critical issue for the
performance assessment of a structure during severe ground motions. In this regards the
development and use of numerical tools and also further experimental studies trying to
identify the monotonic and cyclic behavior of semi-rigid connections have gained significant
attention.
Detailed modeling and analysis of structural members by using advanced finite
element programs is very common nowadays, especially if the real behavior of that member
is a matter of interest for the designer or researcher. Conducting experiments may
supplement numerical simulations in some cases; however experimental works may not be
feasible and possible in some commercial projects or scientific studies. Researchers in
academic institutes often use numerical simulations in order to assess the validity of
available nonlinear analysis modules provided by software packages. With the advance in
computer technology, regular computers are easily used towards that aim and results can be
obtained in a relatively short amount of time in most cases. With respect to the modeling of
the complex interaction of geometric and material nonlinearities in steel semi-rigid
connections, the use of regular computers may not always suffice in terms of computer
power, and large amounts of analysis time is still needed.
This thesis will focus on top and seat with double web angles (TSADWA)
connection due to its rising use in practice and also rising interest in research community due

2
to its truly semi-rigid characteristics in terms of initial stiffness, strength and ductility. The
first experiment conducted towards understanding the nonlinear behavior of this connection
was undertaken by Rathbun (1936). 50 years after that study, Azizinamini (1985) conducted
experiments on TSADWA connection and published his work. In the last decade and a half,
two further experimental studies were conducted on this connection type (detailed literature
review is given later in this chapter). With respect to the numerical simulation and validation
of finite element modeling capabilities, researchers only considered the tests conducted by
Azizinamini up to now for TSADWA connection type. This thesis will encompass all
TSADWA connection tests conducted in the last three decades, the results obtained from
numerical simulations will be compared with experimental data and the reliability of 3-D
modeling of connections with the use of advanced nonlinear finite element programs will be
assessed. In order to model bolted beam to column connections accurately in a numerical
simulation for all connection topologies, detailed understanding of the nonlinearities that
need to be taken into account during the use of finite element software package should be
well known. In this regards, special attention has been given in this thesis for the
presentation of how a bolted beam to column connection region is modeled in ANSYS
Workbench, as well.
In the next section, detailed review on the types of semi-rigid steel connections,
literature review on TSADWA semi-rigid connection tests and the numerical simulations
undertaken by the use of 3-D finite element programs will be provided in detail.
1.2 Semi-Rigid Connection Types
Steel is one of the most preferred, studied and known structural material in
construction sector, yet there are still some uncertainties with regards to the behavior of
some of its parts especially under high seismicity, such as the nonlinear behavior of the
connection regions.
Significant amount of research has been carried and are still going on in order to
understand the physical actions and resulting responses occurring in various types of steel
connections. As mentioned before, there is an assumption related with the behavior of steel
connections in practice, i.e. the fully rigid or ideally pinned cases. A wrong designed
connection can cause catastrophic failures for the whole structural system due to wrong
assumptions/ design calculations or incorrect implementations on the construction site. In
order to prevent these undesired situations, all assumptions and design variables should be
selected correctly. In other words, all related researches and structural codes should be well
known. Various steel connections used nowadays actually deviate from the fully rigid case
both in terms of stiffness and strength. Furthermore, deformation demands imposed on these
types of connections are off special interest and the assumption of fully rigid connection type
for these pose significant potential problems.
In order to analyze semi-rigid connection behavior accurately, the moment rotation
curves provide the means of realizing the capacity provided by the connection and the

3
production of these curves have the utmost importance. For instance, top and seat angles and
double web angles (TSADWA) connection type have higher moment capacity when
compared with the double web angles (DWA) connection. As a general rule of thumb, a
stiffer connection usually has higher moment capacity. Typical moment-rotation curves for
various semi-rigid connection types have been presented in Figure 1.1.
In the following, all semi-rigid connection types used popularly in practice will be
presented.
Figure 1.1 Typical Moment – Rotation (M - R) Curve for Beam – Column Connection
Azizinamini (1985)
1.2.1 Single Web – Angle / Plate Connections
In single web angle/plate (SWAP) type of connections, column and beam profiles
are connected to each other with the help of a simple angle or plate. The single web angle (L
profile) connection type can be seen in Figure 1.2 and also the single web plate connection
type can be found in Figure 1.3.

4
Figure 1.2 Single Web Angle (L Profile) Connection Type, Chen et al. (2011)
Figure 1.3 Single Web Plate Connection Type, Chen et al. (2011)
The single web angle (L profile) connection type has bolts that connect the beam and
column to the angle body only from one side of the beam. With the help of these bolts’ shear
and tensile force capacities, the designer can connect the beam and column to each other. It
can be easily observed that the single web angle connection has half the moment capacity of
double web angle connections.

5
The single web plate connection has a welded connection type supported with bolts
as shown in Figure 1.3. The beam or column section is welded to the plate and the opposite
of welded section has the mechanical bolted connection. This kind of connection helps the
worker in terms of construction ease.
As part of this connection type, when these sub-types are compared with each other,
rigidity of the single plate type of SWAP connection is equal or greater than the single web
angle connections.
1.2.2 Double Web – Angle Connections
Double web angle (DWA) type of connection has two angles (L profiles) connecting
the column and beam profiles by the help of bolts as shown in Figure 1.4.
Figure 1.4 Double Web Angles Connection Type
In DWA connection, the column and beam profiles connect with each other with
usually two identical and opposite sided L angles with the help of bolts. Previously, rivets
were used in order to connect these profiles with each other instead of bolts. Improvements
in the production of high strength bolts lead to their widespread use, and most of the
specifications allow the use of bolts instead of rivets. According to AISC-ASD specifications
(1989), double web angle type of connection is considered as simple (shear) connection.
1.2.3 Top and Bottom L Angle Connections
Top and seat angles (TSA) connection type has two angles (L profiles) that connect
the column and the beam by the help of bolts to each other as shown in Figure 1.5.

6
Figure 1.5 Top and Seat Angles Connection Type, Chen et al. (2011)
According to AISC-ASD specifications (1989), the top angle provides lateral
support of the compression flange of the beam, on the other hand the bottom or also called as
seat angle is for transferring only the vertical reaction from the beam to column (not transfers
any moment to the end of the beam). Obviously under cyclic loading conditions these
assumptions can be generalized for positive and negative cycles of loading conditions.
Experimental results show that these kinds of connections are able to transfer some moment
forces between the beam and the column.
1.2.4 Top and Seat Angles with Double Web Angles Connections
Top and seat angles with double web angles (TSADWA) connection type has four
angles (L profiles) that connect the column and the beam by the help of bolts to each other as
shown in Figure 1.6.

7
Figure 1.6 Top and Seat Angles with Double Web Angles Connection Type
Chen et al. (2011)
In order to transfer the shear forces and to improve connection restraint, double web
angles are added to top and seat angles type of connection. According to AISC-ASD
specifications (1989), this type of connection is considered as “semi-rigid”.
1.2.5 Plate Welded Connections
Plate welded connections have only a plate connecting the column and the beam by
the help of bolts and welds to each other. There are several different types of plate welded
connections;
Extended end-plate (only tension side) (Figure 1.7)
Extended end-plate (both tension and compression side) (Figure 1.8)
Flush end-plate (Figure 1.9)
Header plate (Figure 1.10)

8
Figure 1.7 Extended End-Plate (Only Tension Side) Connection Type
Chen et al. (2011)
Figure 1.8 Extended End-Plate (Both Tension and Compression Side) Connection Type
Chen et al. (2011)

9
Figure 1.9 Flush End-Plate Connection Type, Chen et al. (2011)
Figure 1.10 Header Plate Connection Type, Chen et al. (2011)
Practically, engineers usually design the structures as welded to the beam (on
production process) and bolted to the column (on site) in order to attain the ease of assembly
for the workers. As known, the shear and tensile strength values of welds are not greater than
the steel’s strength values and also welding process should be done in clean surface
conditions. Welder’s capability and site conditions can prevent the production of strong and
clean weld connections between the column and the beam.

10
1.3 Literature Review
This section presents the research studies on the experimental works and 3D
nonlinear finite element modeling and simulations on top and seat angles with double web
angles (TSADWA) connections. First the experimental research studies will be presented,
and then the numerical studies will be given.
1.3.1 Experimental Studies
Initial experimental studies related with semi-rigid connections were conducted with
rivets instead of bolts prior to 1950s. Rathbun (1936) was the first researcher conducting
experiments on TSADWA connections, and he used rivets on the column and beams in order
to connect them to each other. Rathbun carried out 7 DWA connection tests, 3 TSA
connection tests, and 2 TSADWA connection tests.
With the use of high strength bolts, rivets are interchanged with bolts almost in most
experimental studies conducted on beam to column connections.
The main experimental work conducted on TSADWA connections was carried at
University of South Carolina by Azizinamini (1985). In his Ph.D. study, Azizinamini
conducted 20 TSADWA connection tests and 2 TSA connection tests, where the material
properties related to the steel profiles were all documented; however no information related
to bolts were given. Azizinamini investigated mostly monotonic loadings on the connections,
but cyclic loading effects were also considered in some specimens. Azizinamini provided
experimental results in terms of moment-rotation curves, and all of those curves had smooth
polynomial shape.
Calado et al. (2000) conducted 15 TSADWA connections tests in which 3 different
sizes of top, bottom and web angles were considered. The main purpose of the experimental
study was to improve the experimental database on TSADWA connections for both
monotonic and cyclic loading conditions. The comparison between the monotonic and cyclic
loading tests revealed minimal effect on strength and stiffness degradation due to loading
reversals. Furthermore, the cyclic moment-rotation curves of that study clearly showed
significant pinching effects.
Komuro et al. (2003) conducted 1 TSA and 2 TSADWA connection tests under both
monotonic and cyclic loading conditions. The experimental moment rotation curves obtained
from the study were compared with the equations suggested by Kishi and Chen (1990) for
TSDWA connections under monotonic loading conditions, and good match was attained.
One of the important conclusions of that study was the significance of pinching effect in the
definition of cyclic moment-rotation behavior.
It is evident that the amount of experimental work undertaken on TSADWA
connections is few, especially when compared with other connection types. Detailed

11
documentation of experimental studies on all connection types listed in Section 1.2 could be
found in Chen et al. (2011).
1.3.2 Numerical Simulations
In this section, research studies focusing on 3-D detailed modeling of the connection
region with bolts, contact, friction and pretension besides all the material and geometrical
nonlinearities will be documented.
Initial attempts to model steel connections were undertaken without the use of
available finite element software such as ANSYS or ABAQUS. In the study by
Krishnamurthy and Graddy (1976) and in a later study by Krishnamurty (1980), finite
element method was employed for the modeling of bolted steel connections, where linear
elastic material conditions and the use of eight node elements were considered. Contact was
artificially provided through attaching and releasing nodes on the presence of compressive or
tensile normal stress distributions on the contact surfaces, respectively.
With the rise of advanced software packages especially by the end of 1990’s,
numerical simulations tried to bring in as many nonlinear actions as possible. Yang et al.
(2000) modeled double web angles connections with angles bolted to column and welded to
beam, where ABAQUS finite element program was used in order to get the moment- rotation
curves under elastic-perfectly plastic material behavior. In their analysis, contact between the
bolt heads and the angles was considered, but contact and bearing interaction between the
bolt shanks and bolt holes was neglected.
Citipitioglu et al. (2002) carried out one of the most elaborate numerical study on
TSADWA connections, in which ABAQUS finite element program was used and the
monotonic experiments conducted by Azizinamini were considered only. In their study, they
used all capabilities provided by ABAQUS and considered contact and friction effect
between surfaces. Since Azizinamini (1985) did not provide information on bolt material
properties and bolt pretension values, Citipitioglu et al. (2002) worked on a calibration
method for the determination of these. It was concluded that the bolt pretension value is
important in terms of closely matching the numerical results with experimental ones. In
terms of bolt material properties, nominal values were used.
Danesh et al. (2006) also considered the monotonic experiments carried out by
Azizinami, and used ANSYS finite element program to get moment-rotation type curves for
TSADWA connections. In their study, they compared the numerical results from their study
with the experimental data and also with the numerical results of Citipitioglu et al. (2002).
The calibration of material properties was similar to the effort by Citipitioglu. Bolt
pretension was applied as first load case in analysis, and then transverse displacement was
imposed on the beam.

12
In a later study by Uslu and Saritas (2010), monotonic experiments carried out by
Azizinamini were used for 3-D finite element modeling of TSADWA connections, and the
reliability of proposed simplified mathematical models in literature were assessed.
Within the scope of this thesis, previous experimental studies undertaken on
TSADWA connections in the last 3 decades will be considered for numerical modeling, and
the validity of using current software packages in estimating the main nonlinear phenomena
in TSADWA connections will be assessed, in terms of estimation of initial stiffness,
hardening slope and plastic moment capacity.
1.4 Organization of Thesis
This thesis is divided into four chapters. The first chapter begins general introduction
and continues with information regarding to the steel connection types, and ends with
literature review on experimental and numerical studies on top and seat angles with double
web angles connections.
The second chapter presents the use of ANSYS Workbench finite element program
towards detailed modeling of beam to column connection region with bolts, pretension,
contacts, friction and material and geometric nonlinearities. First, the type of material models
that can be used in ANSYS is given, and then meshing procedures and modeling of bodies
and bolts are explained in great length. The time consumption records are given and the
contact properties and bolt pretension definitions that need to be employed in analysis are
clarified with demonstrations.
In the third chapter, experimental studies from previous experimental research
studies conducted on top and seat angles with double web angles connection were compared
with the finite element model results obtained from current work. Information about the
experimental studies is also given.
The last chapter contains the summary and conclusion sections. In order to lead the
future researchers related with the semi-rigid finite element modeling, suggestions and
recommendations are provided.
13
CHAPTER 2
2. FINITE ELEMENT MODELING OF NONLINEAR SEMI-RIGID
CONNECTIONS
This chapter presents the nonlinear finite element modeling of semi-rigid
connections by using ANSYS Workbench. Modeling a detailed response of steel beam to
column connection region resulting from the complex interaction of material, geometric and
contact nonlinearities in ANSYS is still a fairly difficult effort to undertake. Commercial
programs nowadays have vast element and material libraries for the solution of nonlinear
material and geometric problems in structural mechanics. In this regards, ANSYS provides
all of these modeling and solution strategies and is actually one of the most popular and
advanced finite element program related with engineering design and analysis. With
technological improvements in the last two decades, users of finite element programs
demand friendlier user interfaces in order to define complex physical problems in ANSYS.
This demand pushed the developers of ANSYS to provide the Workbench module and
improve its capabilities. Despite the fact that Workbench module of ANSYS provides
simplifications to the users with respect to its classical version, users still face with
significant modeling difficulties especially in structural mechanics problems.
In this chapter, defining and meshing the geometrical shapes with all its bodies,
contact between surfaces, pretension in the bolts, definition of nonlinear material parameters
and eventually the solution strategies through the use of ANSYS Workbench will be
presented. Furthermore, small scale examples will demonstrate the relevance of the effort
presented in this chapter with the research study conducted in the later chapters.
2.1 Material Properties & Models
Engineering Data module of ANSYS Workbench provides the following 3-D
nonlinear constitutive models for the definition of 3-D stress-strain relations for steel
material.
Bilinear isotropic hardening
Multilinear isotropic hardening
Bilinear kinematic hardening
Multilinear kinematic hardening
Nonlinear material parameters that need to be provided in Engineering Data module
base on uniaxial tests. It is well known that hardening in steel is mostly associated with
kinematic hardening; thus isotropic hardening in steel could be assumed zero except than

14
low-cycle and high-cycle fatigue analyses. In this thesis, bilinear kinematic hardening model
without any isotropic hardening is used.
2.2 Meshing
The meshing procedure is one of the most important parts of the modeling of the
physical domain in any finite element analysis. As the name itself implies, a continuous body
is actually meshed through a finite number of elements. The accuracy of the meshed domain
could be assessed through further refinement of the body parts and comparison of the results
between three different levels of mesh refinement. It is also important to identify the regions
where strong nonlinearities would be present, and such regions should actually be treated
separately and meshed finer as a subdomain. A very fine mesh usually results in extremely
long analysis durations and the creation of large amount of data. Thus, the selection of a
medium fine mesh would both provide sufficiently accurate results and reliable solution to
the users. In this section of the chapter, the preferred meshing strategy is presented in detail
next.
There are 8 main types of the meshing options for the users in ANSYS Workbench
Static Structural module (see Figure 2.1):
1) Method,
2) Sizing,
3) Contact Sizing,
4) Refinement,
5) Mapped Face Meshing,
6) Match Control,
7) Pinch,
8) Inflation
Figure 2.1 Meshing Type Options, ANSYS Workbench

15
After the user completes drawing the geometry of the physical body, ANSYS
Workbench provides automatic or selective meshing of the domain. The sizing of the mesh
could be set with “sizing” option in various ways. One of the options for setting the meshing
is relevant center module. The user could select from 3 options that are “coarse / medium /
fine”. These options are the automatic meshing sizing provided by ANSYS, where the
default mode is “coarse”. The alternative for sizing of the mesh is manual selection of
element size as shown in Figure 2.2.
Figure 2.2 Element Size of the Mesh, ANSYS Workbench
The type of solid finite element that will be used in the analysis can be selected
through an indirect input of whether element midside nodes will be kept or dropped. An 8-
node brick element does not have any midside nodes and results into linear shape functions
for the approximation of element displacement field, while the use of midside nodes results
in higher order shape functions. The solid element’s midside nodes could be defined through
“Element Midside Nodes” option in ANSYS Workbench as shown in Figure 2.3. In this
thesis, midside nodes option is selected as “program controlled”.
Figure 2.3 Element Midside Nodes, ANSYS Workbench

16
In order to get more accurate nonlinear behavior and save in solution time, only
connection region is meshed finer in this thesis. In the next subsections, meshing of the
various parts of the physical domain is discussed.
2.2.1 Meshing for Bolts
Different meshing strategies could be employed on different bodies of a bolted
semi-rigid steel connection. The bolt shank, nuts and the contact surfaces between the bolts
and the steel beam and column are the most important regions in terms of meshing. In
Figure 2.4, different meshing strategies are presented and discussed below:
The right top bolt has the same mesh sizing of 5 mm for the bolt shank and nuts.
The left top bolt is an example for a finer meshing along bolt shank. If the designer
tries to investigate the stress distributions more accurately on bolt shank, this kind of
meshing could be employed.
The right bottom bolt has much finer mesh sizing compared to the left top bolt.
Left bottom bolt shows the automatically generated mesh with user selection of
“refinement” option in ANSYS Workbench.
Figure 2.4 Different Meshing Options, ANSYS Workbench
In terms of meshing of bolts and the connecting parts, automatic meshing and
independent body sizing options provided by ANSYS Workbench results in a coarse mesh as
shown in Figure 2.5. With body sizing on the L-shaped angles, this region is meshed finer by
using the refinement option, resulting in Figure 2.6. Similarly, the nuts could be
independently meshed by body sizing and refinement options, and this effort results in the
finer meshed angles and bolts as shown in Figure 2.7.

17
Figure 2.5 Profile – Bolt Connection (Default)
Figure 2.6 Profile – Bolt Connection (Refined L profile only)
Figure 2.7 Profile – Bolt Connection (Refined L profile and bolts)

18
2.2.2 Meshing of L-Shaped Angles and I-Section Beam
In order to model the semi-rigid connection set up considered in this thesis, the
connection region between the column face and beam end requires detailed meshing as
explained in previous sections. Since the connection region also includes top and bottom
angles and furthermore web angles connecting the beam to column face, these parts should
also be meshed fine. On the other hand, the beam with I-section only transfers the forces
acting at its end to the connection region, thus a coarser mesh can be chosen along the length
of the beam after the connection region terminates. Additionally, the refinement property of
the program is investigated on bolt sections in order to find out the accuracy of the results.
The bolt’s refinement meshing property have the positive effect on results but not effective
enough. However, this little positive behavior of this meshing type is very effective on the
computation time of overall.
In verification studies, it has been observed that refinement of the mesh along the
remaining free part of the beam does not change the results but only increases the
computation time. Three different beam body mesh options are considered on Azizinamini’s
8S3 specimen (see Chapter 3 for details on this specimen), where fine meshed angles and
coarse meshed I-section beam discretization option is shown in Figure 2.8. Moment-rotation
curves for different meshed beam bodies are presented in Figure 2.9 and compared, and it is
evident that further refinement on the beam body affects the results little with respect to the
coarse mesh option on beam profile shown in Figure 2.8.
For bolts, L angles and back profile bodies, moment-rotation curves for three
different meshing levels are presented in Figure 2.10 for Azizinamini’s 8S3 specimen. The
beam body mesh is kept constant and all remaining body meshing sizes are changed
accordingly. It is evident that coarse meshing option results in large errors in the estimation
of nonlinear response.

19
Figure 2.8 Coarse I-Section Beam – Fine Angles
Figure 2.9 Beam Body Mesh Comparison Table

20
Figure 2.10 Back Profiles, L Angles & Bolts Meshing Comparison Table
2.3 Robustness of Simulations
Within the scope of this thesis, hundreds of trials have been conducted for the
purpose of investigating the influence of meshing detail on the accuracy of results and
furthermore on the computation times. In a finite element analysis, robustness is a crucial
issue to take into account.
Computation times corresponding to various level of mesh refinement on different
parts of the connection set up are given in Table 2.1. Meshing levels have been considered
for following bodies: bolts, L-shaped angles, I-section beam, and column face. Analyses are
conducted on an Intel Core i5 Processor with 2.50 GHz CPU and with 4 GB RAM regular
notebook computer. During analysis trials, it has been observed that the optimum mesh
selection is attained by considering coarse mesh on I-section beam and rest of the mesh
medium refined.

21
Table 2.1 Approximate Time Consumption
Mes
hin
g T
yp
e Bodies Refinement
at the
Connection
Parts
Analysis
Type
Computation Time
(Approximate) I
Profile
L
Angles Bolts
Coarse Coarse Coarse No Monotonic 30 minutes - 1 hour
Fine Fine Fine No Monotonic 6 hours – 12 hours
Coarse Fine Fine No Monotonic 30 minutes – 3 hours
Coarse Fine Fine Yes Monotonic 3 hours – 12 hours
Coarse Medium Medium Yes Monotonic 30 minutes – 3 hours
Coarse Coarse Coarse No Cyclic 24 hours – 72 hours
Coarse Fine Fine No Cyclic 72 hours – 144 hours
Fine Fine Fine No Cyclic 144 hours - … hours
During these trials, influence of cyclic loadings has been investigated, as well. It has
been observed that cyclic analysis takes considerable amount of time even when the mesh
level is coarse. In literature, to the knowledge of the author of this thesis, there is no research
study published on the 3-D nonlinear cyclic analysis of even small structural systems that
include material, geometric and contact nonlinearities. Evident from Table 2.1, such an
analysis is computationally expensive first of all, then convergence issues cause further
challenges when compared with monotonic analysis, and lastly accuracy attained from cyclic
analysis cannot be easily verified due to lack of cyclic experimental data.
2.4 Nonlinear Contact Modeling Between Surfaces
Contact analysis is a naturally nonlinear phenomenon and description of contact
between surfaces is therefore one of the most important parts of the modeling of semi-rigid
connections through the use of advanced 3-D finite element programs. All contact bodies
should be modeled independently and carefully so that the real physical behavior could be
captured with sufficient accuracy in simulations.
In ANSYS, after the user finalizes drawing of the geometry of model, contact types
should be defined. There are 5 different nonlinear types of contact options in ANSYS
Workbench:

22
- Bonded: This is the default contact type in ANSYS Workbench. Gap
opening/closing and furthermore sliding are not allowed in this contact type.
- No Separation: Gap opening/closing is not allowed as in bonded contact; however,
sliding is allowed with friction coefficient equals to zero.
- Frictionless: Gap opening/closing is allowed and sliding is allowed with friction
coefficient equals to zero.
- Rough: Gap opening/closing is allowed; sliding is not allowed and friction
coefficient is set a large value by default through penalty formulation.
- Frictional: Gap opening/closing is allowed, and sliding is allowed if the sliding
force is greater than the maximum static friction force that would develop between
contact surfaces.
Frictional contact should be the type of contact to be used in steel semi-rigid
connections and actually between all contact surfaces in other problems; since there is in
reality always friction between all contact surfaces. It has been observed that frictionless and
bonded solutions provide mostly much better convergences if the assumptions to use these
contact types are valid under certain conditions. Due to the pretension present in the bolts, it
has been observed that selection of frictional contact between all surfaces is not necessary
and does not provide further accuracy in results.
In order to study the influence of friction coefficient on a simple structure, the
following numerical setup shown in Figure 2.11 is prepared. The middle plate is pulled and
the deformation value is measured from the bottom of middle plate. The numerical results
obtained from varying the friction coefficient value between the plates are given in Figure
2.12. It is evident that the deformed shape of the setup matches with the expected physical
shape. Furthermore, increases in the friction coefficient value result in successive increases
in the nonlinear curves. It is suggested to conduct physical tests on steel surfaces with
different smoothness properties and assess the accuracy of ANSYS in representing the
frictional behavior of parts in the presence of material and geometric nonlinearities.

23
Figure 2.11 Numerical Test Setup for Friction Coefficient Comparison
Figure 2.12 Influence of Friction Coefficient on Structure Response

24
2.4.1 Contact Simulation for Bolt Bearing
Most steel connections are manufactured with a hole that is greater than the bolt can
fill in and the use of screws and opening screw threads in the plate are impractical especially
if the plate gets thick. During loading of a plate to bolt connection, bearing stresses between
the plate and bolt results in localized yielding in the plate’s inner surface during contact,
while the bolt remains elastic due to its high strength. Most manufactures try to avoid
damage in the area of the hole and try to transform the shear forces between the bolt and
plate through high friction forces caused due to bolt pretension. Obviously, it is also desired
not to lose stiffness in the connection region due to the gap between the bolt and the plate, as
well. In case that such a pretension is not provided, then simulation of this complex
nonlinear phenomenon in ANSYS requires special definition of contact types between
surfaces.
In this section, a demonstration example is considered in order to assess whether
such localized bearing stresses are caused through proper definition of contact types. For this
purpose, a plate with a hole is fixed at its side edges, and a bolt that passes through the hole
is moved as it bears on the plate. Undeformed configuration of this example is shown in
Figure 2.13.
Contact type between the surfaces is considered as frictional, and nodes on the bolt
surface are considered as slave nodes in the contact definition of ANSYS and the nodes on
plate’s inner surface are considered as master nodes. As the two ends of the bolt presses on
the plate in Figure 2.14, it has been observed that high bearing stresses are correctly
localized at the contact point and stresses evolve through the contact region (Figure 2.15). It
has been further observed that the initial diameter of the bolt hole increases due to the
bearing action caused by bolt. Although not shown here, the bolt is also cyclically moved
back and forth, and a proper description of the circular bolt region deforming on both
directions has been captured.
Figure 2.13 Undeformed shape of the profile for contact demonstration

25
Figure 2.14 Deformed shape of the bolt for contact demonstration
Figure 2.15 Stress Distribution of the profile for contact demonstration, ANSYS
Workbench
2.5 Bolt Pretension
In order to define an accurate nonlinear behavior of semi-rigid connections, proper
definition of bolt pretension is needed. As discussed above, bolt pretension provides transfer
of shear forces acting on the bolt without damaging the area of the hole; thus, connection
stiffness is increased from start of loading.
In ANSYS Workbench, pretension on a bolt can be provided in Static Structural
module as shown in Figure 2.16.
As a demonstration of bolt pretension action, a U-shaped member made of steel is
considered, where the side walls are connected through a bolt with nuts as shown in
Figure 2.17. As pretension force initiates on the side walls, it is observed that the squeezing
action is captured in the simulation in Figure 2.18.
26
Figure 2.16 Static Structural Module of the ANSYS Workbench, ANSYS Workbench
Figure 2.17 Undeformed Shape of U-Shaped Member for Bolt Pretension
Demonstration

27
Figure 2.18 Deformed Shape of U-Shaped Member for Bolt Pretension Demonstration

28

29
CHAPTER 3
3. NONLINEAR FINITE ELEMENT MODELLING
In this chapter numerical simulations on top and seat angles with double web angles
(TSADWA) connection by the use of ANSYS Workbench will be compared with
experimental results of Azizinamini (1985), Calado et al. (2000) and Komuro et al. (2003).
In this comparative study, all geometric and material properties used in ANSYS are taken
from the experimental data provided in the tests. Utmost effort is given in terms of modeling
all three different tests in a uniform manner by the use of ANSYS Workbench software.
3.1 Azizinamini’s Experiments
Azizinamini (1985) in his Ph.D. study conducted experiments on TSADWA
connection under mostly monotonic loading conditions, where some of the specimens were
cyclically tested. This study was the first study carried out on TSADWA connection 50 years
after the study by Rathbun (1936).
3.1.1 Material Properties
Grade of steel used in all connection parts, i.e. top, seat and web angles, and beam
and column sections was ASTM A36 type. On these parts of the specimens, coupons were
tested under uniaxial tensile loading and the material properties obtained from the tests were
documented (Table 3.1). In the numerical study conducted in this thesis, average of the
values in Table 3.1 are used for the calibration of steel material in the connecting angles and
webs, as well as beam and column sections. In Azizinami’s thesis, there was no information
related to the material properties of the bolts, and for this reason the nominal properties
reported for ASTM A325 heavy hex high strength type steel is considered.

30
Table 3.1 Azizinamini (1985) Coupon Test Results
Designation
Mechanical Properties
Yield Stress
(ksi)
Ultimate
Strength (ksi)
Elongation in
2-inch Gage
Length
(percent)
ASTM A36
42.8 69.9 23.8
42.9 67.9 22.9
39.3 68.0 32.5
37.6 67.9 31.9
36.5 71.9 31.3
43.7 69.9 31.3
40.0 64.0 34.4
38.0 66.0 37.5
3.1.2 Test Specimens
Within the scope of this thesis, 5 different connection specimens from Azizinamini’s
tests were examined and compared with nonlinear finite element simulation results. Tag
number and geometric properties of these specimens are listed in Table 3.2. 8Sx type
specimens had smaller beam cross sections compared to 14Sx specimens, and consequently
less stiffness and moment carrying capacities, as well. In all specimens shown in Table 3.2,
7/8 and 3/4 inches diameter bolts were used.
Table 3.2 Specimens of Azizinamini (1985) used in FE Simulations
Sp
ecim
en
Nu
mb
er
Ty
pe
of
Tes
t
Bea
m
Sec
tio
n
Top & Bottom Flange Angles Web Angles
An
gle
Len
gth
(in
ches
)
Bo
lt
Sp
aci
ng
(in
ches
)
An
gle
Len
gth
(in
ches
)
8S1 Static W8x21 L 6x3.5x0.3125 6 3.5 2 x L4x3.5x0.25 5.5
8S2 Static W8x21 L 6x3.5x0.375 6 3.5 2 x L4x3.5x0.25 5.5
8S3 Static W8x21 L 6x3.5x0.3125 8 3.5 2 x L4x3.5x0.25 5.5
14S1 Static W14x38 L 6x4x0.375 8 5.5 2 x L4x3.5x0.25 8.5
14S5 Static W14x38 L 6x4x0.375 8 5.5 2 x L4x3.5x0.25 8.5
Experimental set up of the tests is shown in Figure 3.1 and Figure 3.2 for 8Sx and
14Sx specimens, respectively. In order to save time, the symmetry about the centroid of the

31
test set up is taken into account. In the finite element model, the back face of the column
flange is assumed to be fixed supported and the end of the beam profile is displaced in the
transverse direction (Figure 3.3).
Figure 3.1 8sx Test Specimen Setup, Azizinamini (1985)
Figure 3.2 14sxTest Specimen Setup, Azizinamini (1985)

32
Figure 3.3 Nonlinear Undeformed Finite Element Model for 8S1
With regards to the modeling and meshing strategy employed for the test specimens
in numerical environment, detailed information is available in Chapter 2. As a summary, all
contact surfaces between the connecting parts, bolt pretension, friction values, and nonlinear
material definitions for steel are provided in ANSYS Workbench. The expected deformed
shape of the connection region, i.e. the column face connecting to the beam through angles
and bolts, is demonstrated pictorially in Azizinamini’s study (Figure 3.4). Due to downward
movement of the beam, the top angle is expected to deform significantly and a gap would
open up there, and the bottom angle profile is expected to be compressed. The finite element
model set up in this thesis has successfully captured this physical action, as shown for
specimen 14S5 in Figure 3.5.
Figure 3.4 Expected Deformed Shape, Azizinamini (1985)

33
Figure 3.5 Nonlinear Deformed Finite Element Model for 14S5
The moment-rotation curves obtained from the numerical simulations is compared
next with the experimental moment-rotation curves for the specimens listed in Table 3.2.
The first comparison regarding to Azizinamini’s tests is for 14S1 specimen. The
bolts connecting this specimen is loaded first with a 250 kN pretension force, and 0.1 friction
coefficient is used on all steel surfaces. The numbers of nodes and elements used for the
simulation of 14S1 specimen were 55,287 and 20,305, respectively. All modeling and
meshing details could be found in Chapter 2.
Figure 3.6 Comparison of Moment-Rotation Responses for 14S1 Specimen of
Azizinamini
As can be easily seen in Figure 3.6, moment-rotation curve obtained from numerical
simulation provides a good overall match with experimental data; however there is a

34
discrepancy observed in the initial stiffness of the connection. Furthermore, slight
overestimation of plastic moment capacity of connection is also evident in the plot.
Undeformed and deformed shapes of the finite element model could be found in Appendix
A. Evident from these results, the physical actions that occurred in this specimen was
satisfactorily simulated through the detailed modeling of the connection region in ANSYS
Workbench.
Second comparison from Azizinamini tests is for 14S5 specimen. As presented in
Table 3.2, W14x38 type of beam (I profile) is used with 6 × 4 × 0.375 inches top and bottom
angles (L profiles) and 4 × 3.5 × 0.25 inches web angles. 250 kN pretension value is given
on the bolts and 0.1 value of friction is applied between surfaces. 81,560 nodes and 27,649
elements were used in order to model 14S5 specimen. 14S1 and 14S5 specimens are exactly
the same except than the difference in bolt diameters. 0.75 inch diameter bolts were used in
14S1 and 0.875 inch diameter bolts were used in 14S5.
Figure 3.7 Comparison of Moment-Rotation Responses for 14S5 Specimen of
Azizinamini
With larger diameter bolts, 14S5 specimen is expected to have a larger moment
capacity compared to 14S1 specimen. Both the experimental and the numerical results
clearly indicate this expected strength increase in the connection region as seen in Figure 3.7.
Similar to 14S1 specimen results, the numerical simulation underestimated the initial
stiffness of the connection response, but very close overall match is observed with the
experimental data when the whole moment-rotation curves are compared. Undeformed and
deformed finite element models of this specimen are presented in Appendix A.

35
Concluding on the numerical results with that of experimental results of 14Sx
specimens, it is observed that good match is obtained in overall responses and the use of
ANSYS Workbench finite element program in this regards was satisfactory and the
capabilities of this software package to simulate complex nonlinearities in the connection
region is sufficient.
In the second group of Azizinamini’s tests, i.e. 8Sx type specimens, W8x21 type of
beams (I profiles) were used in the experimental set up (Table 3.2). In this thesis, three of the
8Sx specimens are considered for modeling in ANSYS; where the web angles of these
specimens had the same dimensions, i.e. 2×L4 × 3.5 × 0.25 inches L profiles with 5.5 inches
length, and L 6 x 3.5 x 0.3125 inches top and bottom angles with 6 inches length.
Azizinamini’s test setup was presented in Figure 3.2 and the finite element model for
undeformed shape could be found in Appendix A. In ANSYS model, 175 kN pretension
force was applied on the bolts for 8S1 specimen. 18,799 nodes and 7,994 elements were used
in order to model this specimen in ANSYS.
Figure 3.8 Comparison of Moment-Rotation Responses for 8S1 Specimen of
Azizinamini
Comparison of the numerical and experimental moment-rotation curves reveal
similar patterns as observed in 14Sx specimens. The initial stiffness of the connection is
underestimated, but this time the plastic moment capacity is perfectly captured, and the

36
overall comparison of both moment-rotation curves indicate good match. The deformed
shape of the nonlinear finite element model could be found in Appendix A.
Second comparison from Azizinamini 8Sx tests is for 8S2 specimen, where the web
angles had the same dimensions with 8S1 that is 2 × L 4 × 3.5 × 0.25 inches with 5.5 inches
length. The top and bottom angles (L profiles) have 2 x L 6 x 3.5 x 0.375 inches with 6
inches length. For 8S2 specimen, 175 kN pretension force is applied on the bolts as done for
8S1 specimen. 24,930 nodes and 9,947 elements were used in order to model the nonlinear
behavior of 8S2 specimen in ANSYS.
Figure 3.9 Comparison of Moment-Rotation Responses for 8S2 Specimen of
Azizinamini
Moment-rotation response obtained from numerical simulation for 8S2 specimen is
compared with the experimental data in Figure 3.9. Among all specimens analyzed and
modeled from Azizinamini’s tests, the largest deviation between the experimental and
numerical results occurred in this specimen. Similar to other specimen results, the initial
stiffness is underestimated, but this time the plastic moment capacity is overestimated with
much larger error compared to other specimen results. The deformed shape of the nonlinear
finite element model could be found in Appendix A.
The last specimen considered among 8Sx group of specimens is 8S3. As mentioned
before, the web angles had the same dimensions with 8S1 & 8S2 specimens, i.e. 2 × L 4 ×

37
3.5 × 0.25 inches with 5.5 inches length. The top and bottom angles (L profiles) have
dimensions 2 × L 6 × 3.5 × 0.3125 inches with 8 inches length. For 8S3 specimen, 175 kN
pretension force is applied on the bolts as done similarly for 8S1 and 8S2 specimens. 24,947
nodes and 10,204 elements were used in order to model 8S3 in ANSYS.
Figure 3.10 Moment-Rotation Responses for 8S3 Specimen of Azizinamini
Moment-rotation response obtained from numerical simulation for 8S3 specimen is
compared with the experimental data in Figure 3.10. The numerical simulation of 8S3
specimen provides good match compared with the experimental data, where only the initial
stiffness is underestimated but the plastic moment capacity is perfectly captured as in the
case of 8S1 specimen. The deformed shape of the nonlinear finite element model could be
found in Appendix A.
As a summary of the numerical simulations on Azizinamini’s 14Sx and 8Sx
specimens, good match is obtained in terms of tracing the nonlinear moment-rotation curves.
Discrepancies in numerical and experimental results exist especially in the initial stiffness,
and overall plastic moment capacities are mostly captured with great accuracy. Close match
attained from numerical models indicate sufficient capture of the physical actions present in
the connection region, where this is also verified with the simulated deformed shapes of the
connection region of the specimens.
38
3.2 Calado’s Experiments
15 years after Azizinamini’s tests, Calado et al. (2000) published their experimental
study on semi rigid connections. In their tests, they used three different specimen sizes and in
total conducted 15 tests on top and seat angles with double web angles (TSADWA)
connection. Among each specimen group, one monotonic loading test and four cyclic
loading tests were conducted. The main purpose of their study was to increase the
experimental database on TSADWA connection and furthermore carry out both monotonic
and cyclic load tests in order to assess the influence of cyclic loading on connection
response.
3.2.1 Material Properties
Calado et al. (2000) conducted their tests in Material and Structures Test Laboratory
of the Instituto Superior Technico of Lisbon, Portugal. In their tests, S 235 JR grade of steel
was used for solid bodies like L angles, I profiles and columns. In order to document the
mechanical properties of the steel, two coupon tests were performed on each body part. The
results of the coupon tests are provided in Table 3.3 and Figure 3.11. Similar to
Azizinamini’s test data documentation, Calado et.al. did not provide material properties on
bolts, where the only information on them was the fact that they were 8.8-M bolts.
Table 3.3 Material Properties of the Specimens, Calado et al. (2000)
Member
Section
Section
Element
fy
(Mpa) Ɛy (%)
fu
(Mpa) Ɛt (%)
HEB 160
web 348.63 0.53 490.31 31.5
flange 303.41 0.84 453.12 44.5
HEB 200
web 302.31 0.55 434.39 38.2
flange 282.29 0.75 433.27 43.3
HEB 240
web 290.28 0.52 447.91 39.6
flange 304.74 0.81 454.4 39.1
IPE 300
web 215.67 0.66 451.26 41.1
flange 304.71 0.68 452.63 42.7
L 120 x 10 - 252.23 0.52 420.14 44.5

39
Figure 3.11 Coupon Test Results of the Specimens, Calado et al. (2000)
3.2.2 Test Specimens
Within the scope of this thesis, all specimens tested monotonically by Calado et al.
(2000) are considered for numerical modeling and simulation in ANSYS. The specimens are
listed below in Table 3.4 and also presented in Figure 3.12.
IPE 300 type of beams (I profiles) were used in the tests with two top and bottom L
angles with 120×120×10mm dimension and two web angles with L 120×80×10mm
dimension. The column profile dimensions are variable as expressed in Table 3.4. The test
setup and dimensions are presented in Figure 3.13, where IPE 300 type beam member is
connected to the column profiles with the help of the two identical top and bottom angles
and two identical web angles. The system is designed symmetrically. While connecting the
top and bottom angles to the column and I profile, the 8.8 quality M16 bolts were used and
for the web angles, 3 bolts with 8.8 quality were used.
Despite the lack of material data on the bolts, the value of pretension force applied
on the bolts was provided by Calado et al. (2000), and it was 88 kN. It has to be reminded
that in Azizinamini’s tests, no data on bolts was available, both for material properties and
pretension force. Since the pretension force on the bolts was available for Calado specimens,
that value is first applied on the bolts in the numerical model in ANSYS. The value of
friction coefficient was not available in the paper by Calado, therefore it was taken as the
same used in Azizinamini’s tests.

40
Table 3.4 Specimen Table for Calado et al. (2000)
Specimen
Number
Type
of Test
Beam
Section
Top & Bottom
Flange Angles
(mm)
Web Angles
(mm)
Column
Section
BCC7 Static IPE300 L 120x120x10 L 120x80x10 HEB 200
BCC9 Static IPE300 L 120x120x10 L 120x80x10 HEB 160
BCC10 Static IPE300 L 120x120x10 L 120x80x10 HEB 240

41
Figure 3.12 Experimental Test Setups for the Specimens, Calado et al. (2000)
Calado et al. (2000) applied a displacement from the end of the beam section as seen
in Figure 3.13 and plotted the moment-rotation results in terms of moment calculated from
the measured force at load application multiplied by the distance between the load
application point and the centroid of the column section that is connected to the beam
element. In their paper, it was argued that such a plot is a common way of representing the
moment-rotation behavior of connections. This calculation procedure is also followed in
plotting the moment-rotation results of the numerical simulations.
Figure 3.13 Testing Lay-out, Calado et al. (2000)

42
The whole beam profile (IPE 300) is modeled in ANSYS and only the upper flange
of the column profile is modeled as a thick plate providing restraint at the end as seen in
Figure 3.14, where the back faces of the column top flanges were fixed.
The first verification of the numerically simulated specimens is the presentation of
the deformed shapes. Comparison of the deformed shape obtained from finite element model
in Figure 3.15 presents good match with the experimental ones shown in
Figure 3.16, proving the sufficiency of the numerical model in capturing the physical
deformations present in the connection region. At the end of loading, significant opening is
created in top angle profile and the bottom angle profile presses on the column flange.
Figure 3.14 Undeformed Shape of model for BCC7

43
Figure 3.15 Deformed Shape of model for BCC7
Figure 3.16 Deformed Shape of Experimental Test Setup

44
The first specimen compared among Calado et al. (2000)’s monotonic tests is
specimen BCC7. As presented in Table 3.4, IPE 300 type of beam is used for this specimen
with HEB 200 column section, 2 × L120×120×10mm top and bottom angles and 2 ×
L120×80×10mm web angles. In terms of bolts, 8.8 quality M16 bolts were used in the
experiments as mentioned before and the bolts were loaded with 88 kN pretension force first
before loading laterally. 24,094 nodes and 10,108 elements were used in order to model the
nonlinear behavior of BCC7 specimen in ANSYS.
Figure 3.17 Comparison of Moment-Rotation Responses for BCC7 Specimen of
Calado et al. (2000)
When experimental results are compared with the finite element results as presented
in Figure 3.17, significant underestimation of the initial elastic stiffness is evident in the plot
of numerical results. This discrepancy can be closed with increased pretension force applied
on the bolts, but such an approach was not followed in this thesis, since the pretension force
was documented in Calado et al. (2000)’s tests and that value was used the same in order to
be consistent. It is also worth to mention that increasing pretension force excessively also
causes premature yielding of the connecting parts, and this leads to an undesired failure of
the connection region. Despite the discrepancy in the initial stiffness, the final plastic
moment capacity of the connection is accurately capture with the finite element model
analysis. Furthermore, the deformed shape of the specimen clearly shows correct physical
action in the connection region as shown in Appendix A.
The second comparison is conducted on BCC9 specimen of Calado et al. (2000). As
presented in Table 3.4, IPE 300 type of beam was used with HEB 160 column section, 2 ×
L120×120×10mm top and bottom angles and 2 × L120×80×10mm web angles. 8.8 quality

45
bolts with M16 dimension were used and 88 kN pretension force is applied in the numerical
model as done in the experiment. 21,884 nodes and 7,984 elements were used in order to
model BCC9 specimen in ANSYS.
Figure 3.18 Comparison of Moment-Rotation Responses for BCC9 Specimen of
Calado et al. (2000)
Moment-rotation response obtained from finite element simulation of BCC9
specimen is compared with the experimental data in Figure 3.18. It is evident that similar to
BCC7 specimen, initial stiffness is overly underestimated, yet the final plastic moment
capacity is still close to the experimental data. Undeformed and deformed shapes of the finite
element models for BCC9 specimen could be found in Appendix A.
The final specimen used for comparison is BCC10 from Calado et al. (2000)’s tests.
In this specimen, HEB 240 type of column profile was used, resulting in increased moment-
rotation behavior. 8.8 quality M16 bolts were used on 2 × L120×120×10mm top and bottom
angles and 2 × L120×80×10mm web angles. 88 kN pretension force was applied on the bolts
before lateral loading. 22,555 nodes and 7,946 elements were used in order to model BCC10
specimen in ANSYS, i.e. same discretization is employed between all simulated specimens
of Calado et al. (2000).

46
Figure 3.19 Comparison of Moment-Rotation Responses for BCC-10 Specimen of
Calado et al. (2000)
In Figure 3.19, it is observed that the initial stiffness is overly underestimated once
again, yet the final plastic moment capacity is closely captured when compared with
experimental data. Undeformed and deformed shapes of the finite element models for
BCC10 specimen could be found in Appendix A.
As a conclusion of these three specimens, initial stiffness values of all simulated
specimens of Calado et al. (2000) are underestimated, while the final plastic moment
capacities of the specimens are closely captured. In terms of deformation of the connection
region, finite element simulations can closely capture the deformations at the ultimate
loading point, yet the flexibility of the connection region under much lower deformations are
in great error when compared with experimental measurements. This discrepancy occurs
despite the fact that same modeling approach as done in Azizinamini’s specimens was
followed for Calado et al. (2000) with the fact that the documented pretension value by
Calado et al. (2000) was used on the bolts for consistency.
3.3 Komuro’s Experiments
Komuro et al. (2003) published a conference paper on the monotonic and cyclic
behavior of semi-rigid connections. As part of their study, they have considered three
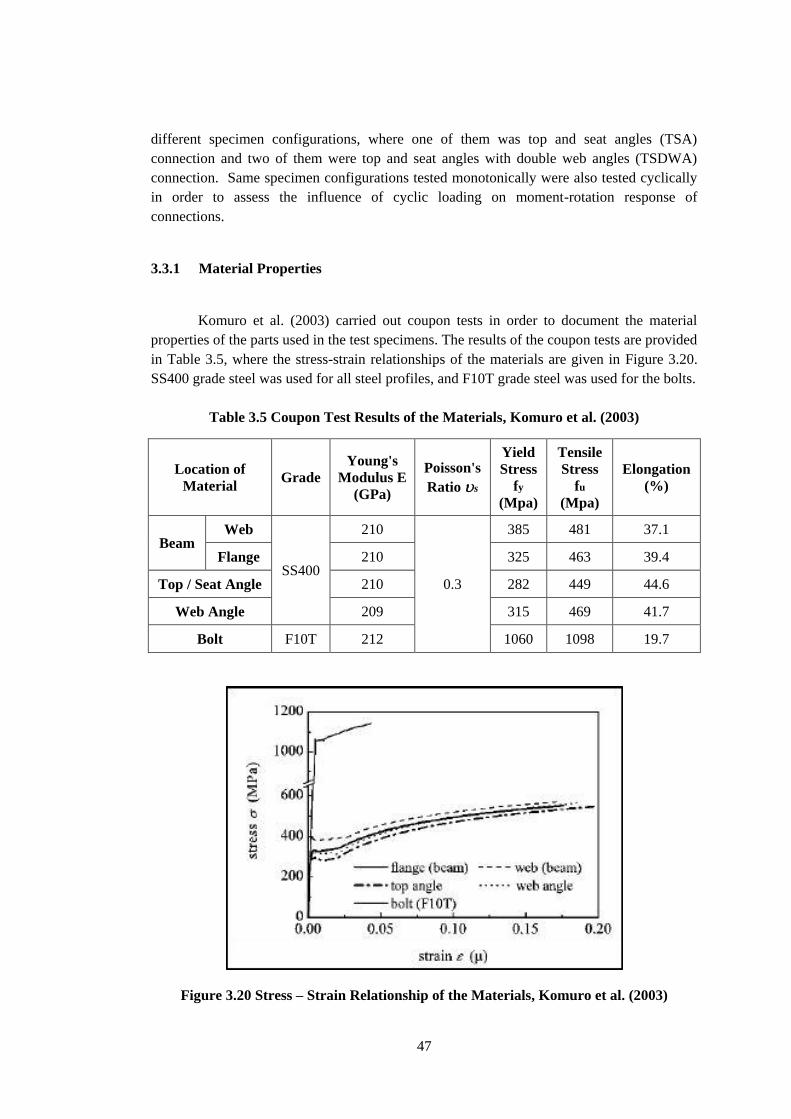
47
different specimen configurations, where one of them was top and seat angles (TSA)
connection and two of them were top and seat angles with double web angles (TSDWA)
connection. Same specimen configurations tested monotonically were also tested cyclically
in order to assess the influence of cyclic loading on moment-rotation response of
connections.
3.3.1 Material Properties
Komuro et al. (2003) carried out coupon tests in order to document the material
properties of the parts used in the test specimens. The results of the coupon tests are provided
in Table 3.5, where the stress-strain relationships of the materials are given in Figure 3.20.
SS400 grade steel was used for all steel profiles, and F10T grade steel was used for the bolts.
Table 3.5 Coupon Test Results of the Materials, Komuro et al. (2003)
Location of
Material Grade
Young's
Modulus E
(GPa)
Poisson's
Ratio s
Yield
Stress
fy
(Mpa)
Tensile
Stress
fu
(Mpa)
Elongation
(%)
Beam Web
SS400
210
0.3
385 481 37.1
Flange 210 325 463 39.4
Top / Seat Angle 210 282 449 44.6
Web Angle 209 315 469 41.7
Bolt F10T 212 1060 1098 19.7
Figure 3.20 Stress – Strain Relationship of the Materials, Komuro et al. (2003)
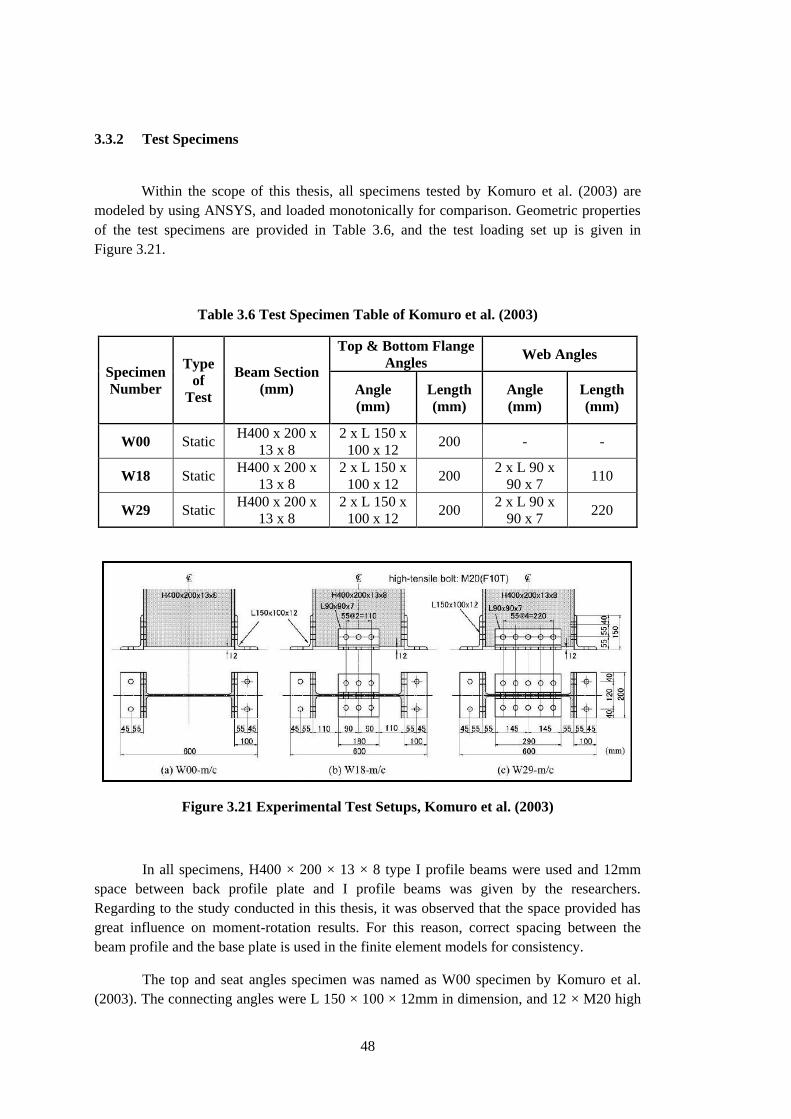
48
3.3.2 Test Specimens
Within the scope of this thesis, all specimens tested by Komuro et al. (2003) are
modeled by using ANSYS, and loaded monotonically for comparison. Geometric properties
of the test specimens are provided in Table 3.6, and the test loading set up is given in
Figure 3.21.
Table 3.6 Test Specimen Table of Komuro et al. (2003)
Specimen
Number
Type
of
Test
Beam Section
(mm)
Top & Bottom Flange
Angles Web Angles
Angle
(mm)
Length
(mm)
Angle
(mm)
Length
(mm)
W00 Static H400 x 200 x
13 x 8
2 x L 150 x
100 x 12 200 - -
W18 Static H400 x 200 x
13 x 8
2 x L 150 x
100 x 12 200
2 x L 90 x
90 x 7 110
W29 Static H400 x 200 x
13 x 8
2 x L 150 x
100 x 12 200
2 x L 90 x
90 x 7 220
Figure 3.21 Experimental Test Setups, Komuro et al. (2003)
In all specimens, H400 × 200 × 13 × 8 type I profile beams were used and 12mm
space between back profile plate and I profile beams was given by the researchers.
Regarding to the study conducted in this thesis, it was observed that the space provided has
great influence on moment-rotation results. For this reason, correct spacing between the
beam profile and the base plate is used in the finite element models for consistency.
The top and seat angles specimen was named as W00 specimen by Komuro et al.
(2003). The connecting angles were L 150 × 100 × 12mm in dimension, and 12 × M20 high

49
tensile F10T grade bolts were used for connecting the angles to other parts. W18 type of
connection has the same connection materials and parts with W00 specimen and the
following additional web angles and bolts were used: 2 × L 90 × 90 × 7 mm angles with
110mm length and 9 × M20 high tensile F10T grade bolts for connecting the web angels to
other parts. For W29 specimen, larger web angles were used with 27 × M20 high tensile
F10T grade bolts connecting the web angles to other parts. As a result, the moment capacity
of W29 specimen was the greatest among all specimens.
The experimental test setup is presented in Figure 3.22, where the column of the test
setup is fixed to the basement and the end of the beam is imposed a transverse displacement
at its end. Instead of modeling the whole column assuming that it provides full restraint at
end, only the top flange of the column is modeled in ANSYS, and the back face of the
column’s top flange is fixed. There was no data regarding the amount of pretension force
applied on the bolts, thus similar to Calado et al. (2000)’s tests 88 kN pretension force is
applied on all bolts.
Figure 3.22 Experimental Setup of the Specimens, Komuro et al. (2003)
Figure 3.23 Deformed Shape of the Specimen, Komuro et al. (2003)

50
In terms of comparison of numerical and experimental results, first the pictorial
representation of the deformed shape presented by Komuro et al. (2003) in Figure 3.21 can
be compared with the deformed shape of the connection obtained from finite element
simulation for W18 specimen in Figure 3.25. Evident from this comparison, the physical
deformations in the connection region is accurately captured at the end of loading of the
specimen.
Figure 3.24 Deformed Shape, Komuro et al. (2003)
Figure 3.25 Deformed View of W18
For the comparison of moment-rotation responses, only the top and seat angles with
double web angle specimens are considered. First W18 specimen is presented here, where
the geometric properties are available in Table 3.6. In the finite element model, all bolts were
first loaded with a pretension force of 88 kN. 24,448 nodes and 9,743 elements were used in
order to model the nonlinear behavior of W18 specimen in ANSYS.

51
Figure 3.26 Comparison of Moment-Rotation Responses for W18 Specimen of
Komuro et al. (2003)
Comparison of moment-rotation response obtained from numerical simulation
reveals underestimated initial stiffness for the connection when compared with the
experimental data in Figure 3.26. Despite this discrepancy, the plastic moment capacity of
the connection is closely captured by the finite element model.
Last specimen compared from Komuro et al. (2003)’s tests is W29 specimen. In the
finite element model, all bolts were first loaded with a pretension force of 88 kN once again,
then the lateral loading was applied. 24,403 nodes and 9,581 elements were used in order to
model the nonlinear behavior of W29 specimen in ANSYS.

52
Figure 3.27 Comparison of Moment-Rotation Responses for W29 Specimen of
Komuro et al. (2003)
Moment-rotation responses of the numerical and experimental results are given in
Figure 3.27. It is observed that the overall moment-rotation curve from finite element
simulation is close to the experimental one, but the initial stiffness is once again
underestimated, and the plastic moment capacity is slightly underestimated, as well.
3.4 Remarks on Numerical Analysis
In any comparative study deviations exist between experimental data and numerical
simulations. Uncertainties in experimental work stem from the experimental set up,
measurements of geometrical and material data, imposition of loading and boundary
conditions and lastly due to error in readings of experimental results. Assuming that all these
are close to perfection in an experimental study, it is also possible to witness problems in the
documentation of the conducted study, as well. On the other end, numerical studies may
contain significant amounts of mistakes, as well. These are mainly caused by the person
improperly modeling the problem at hand and insufficient knowledge and use of an available
software package and its available modules. Lastly, it is also possible that a certain finite
element package may not sufficiently replicate the real physical action due to lack of
analysis modules in it.

53
The specimens modeled in this thesis were all top and seat angles with double web
angles (TSADWA) connections. Most of the material and geometrical properties and test
setup configuration were available in the specimens considered for analysis; however, the
friction coefficient values were all missing in the experimental documentations, and
properties on bolts and pretension values were missing in some of the tests. Furthermore, it
was assumed that the column connecting to the connection provides full restrained and it
would be sufficient to model only the top flange of the column.

54

55
CHAPTER 4
4. SUMMARY AND CONCLUSION
4.1 Summary
The first chapter of this thesis started with general introduction on semi-rigid steel
connections and then the motivation of the thesis was presented and semi-rigid connection
types and properties were given. Within the scope of this thesis, only top and seat angles
with double web angles (TSADWA) connection type is considered, therefore Chapter 1
continued with the literature review on experimental studies and 3-D finite element
simulations on TSADWA connection.
In the second chapter of this thesis, nonlinear finite element modeling of semi-rigid
connection steps was defined in detail through the use of ANSYS Workbench FE program.
Modeling capabilities of the program and material modeling module have been stated, and
the meshing procedure of all parts of the connection is defined. Afterwards, the difficulties
on setting up such complicated connection models in ANSYS were discussed with regards to
the time consumption and robustness of simulations. Then, contact modeling module in
ANSYS Workbench was presented through a demonstration example. At the end of the
chapter, application of pretension force on a bolt was documented and an example was
given.
In the third chapter, the nonlinear finite element modeling results and comparisons
for previous experimental studies on TSADWA connection were presented. Totally 10
experimental studies was analyzed from 3 different researches, that are respectively;
Azizinamini (1985), Calado et al. (2000) and finally Komuro et al. (2003). For each
experimental specimen group, information was given with regards to the material, geometric
properties and test setup. Then, the results obtained from finite element simulations were
compared with the experimental data.
4.2 Conclusion
Researchers have been focusing on studying and assessing the nonlinear behavior of
various types of semi-rigid connections in the last two decades. Experimental and numerical
studies conducted on semi-rigid connections are few especially on top and seat angles with
double web angles (TSADWA) connection. The first experiment conducted was in 1936,
followed by 1985 study by Azizinamini. There is a rising interest on the study of the
monotonic and cyclic behavior of this connection type in the last decade. This interest also

56
led some researchers to conduct numerical studies on this connection type; however, the
numerical studies up to now did not try to compare all of the experiments conducted on this
connection type. Due to scarce data, it can be concluded that there is still lack of knowledge
on the physical actions going on especially through the cyclic loading of TSADWA
connection. Conflicting conclusions with regards to the influence of cyclic loading on overall
energy dissipation characteristics exist in the literature.
Within the scope of this thesis, it was intended to validate the results of all tests
conducted on TSADWA connection specimens in literature. The purpose in this regards is to
assess whether the current advanced finite element programs can provide means for such a
simulation through detailed modeling of all nonlinearities occurring in the connection region.
The results of moment-rotation curves obtained from finite element simulations were
compared with experimental results. Initially, conducting cyclic analysis was targeted;
however, this effort was quickly terminated due to difficulties in time consumption of
analysis and furthermore the cyclic simulations did not provide satisfactory results when
compared with experimental ones. It was later realized that no one in literature presented
cyclic numerical results on bolted steel connections by using 3-D finite element software and
considering contact, friction, material and geometric nonlinearities; thus this clearly points
out a common problem faced in the scientific community. For this reason, the thesis focused
on only comparison of monotonic responses of the selected specimen groups that are not all
together modeled in a numerical simulation before.
The comparison studies and discussions resulting from the detailed finite element
models conducted within the scope of this thesis provide a comprehension for future
structural engineers on bolted semi-rigid steel connections, especially TSADWA connection
type.
The main conclusions of this thesis are listed below:
Use of ANSYS finite element program gives physically accurate representations of
the deformed shape of the connection region when compared with experimental
ones.
The initial stiffness of the moment – rotation curves obtained from finite element
simulations yielded lower estimates compared with the experimental ones.
Plastic moment capacities of the connection specimens have been closely captured
through numerical simulations.
Cyclic modeling studies were implemented in the beginning of the thesis. Due to
enormous time consumption and convergence problems, conducting cyclic analysis
on bolted semi-rigid connections had been terminated. Furthermore, the cyclic
moment-rotation curves obtained from cyclic analysis did not provide close
estimations with the experimental ones.
To the knowledge of author of this thesis, there is no documented study on the cyclic
simulation of bolted semi-rigid connections in literature. This clearly indicates a
common problem faced in the scientific community. Despite all technological
improvements, the current state of advanced finite element programs cannot
satisfactorily provide sufficient means to conduct cyclic analysis on such type of
connections.

57
Despite the fact that technological improvements in computers and numerical
methods are immense, conducting even monotonic analysis on such complicated 3-D
models require significant amount of expertise and careful modeling of the problem.
A researcher/engineer should always be aware of the fact that a software package
may not contain all necessary means to successfully carry out an intended numerical
simulation, especially when verification with experimental data is sought.
Documentations on experiments conducted on TSADWA connection are not
complete enough to provide all parameters needed to conduct a numerical
verification study.
4.3 Recommendations for Future Researchers
The following recommendations are listed as a result of the problems encountered
during finite element modeling and analysis of bolted semi-rigid connections conducted in
this thesis:
Due to lack of cluster computers, cyclic analysis was not carried out as part of this
thesis. Future researchers should definitely use the parallel processing capabilities
with advanced finite element programs in order to assess the state of modules and
libraries provided by software packages.
Current thesis study considered using only ANSYS for numerical simulations. In
order to assess the state of current finite element packages, ABAQUS and MSC-
Nastran should also be taken into account.
It would be helpful to conduct simple experimental tests, such as the numerical
demonstrations considered in Chapter 2. By conducting these experiments in the
laboratory, numerical verification studies can be conducted on much smaller scale
specimens than the complicated TSADWA connection configurations. In this
regards, ANSYS and ABAQUS may be used at least to assess the strengths and
weaknesses of each software package to simulate nonlinear contact, friction and
application of pretension force.

58

59
REFERENCES
ANSYS Workbench Finite Element Analysis Program, V.12.1.0 ANSYS Inc. 2
ANSYS Workbench User Manual V.12.1.0 ANSYS Inc.
Azizinamini, A. (1985). “Cyclic characteristics of bolted semi-rigid steel beam to
column connections” PhD thesis, University of South Carolina, Columbia
Calado, L., G. De Matteis and R. Landolfo (2000). "Experimental response of top
and seat angle semi-rigid steel frame connections." Materials and Structures 33(8):
499-510
Chen, W.-F., N. Kishi and M. Komuro (2011). Semi-rigid connections handbook, J.
Ross Publishing.
Citipitioglu, A., R. Haj-Ali and D. White (2002). "Refined 3D finite element
modeling of partially-restrained connections including slip." Journal of
Constructional Steel Research 58(5): 995-1013
Danesh, F., A. Pirmoz and A. S. Daryan (2007). "Effect of shear force on the initial
stiffness of top and seat angle connections with double web angles." Journal of
Constructional Steel Research 63(9): 1208-1218
Kishi, N. and W.-F. Chen (1990). "Moment-rotation relations of semirigid
connections with angles." Journal of Structural Engineering 116(7): 1813-1834
Komuro, M., N. Kishi and R. Hasan (2003). Quasi-static loading tests on moment-
rotation behavior of top-and seat-angle connections. STESSA Conference

60
Krishnamurthy, N. (1980). "Modelling and prediction of steel bolted connection
behavior." Computers & Structures 11(1): 75-82
Krishnamurthy, N. and D. E. Graddy (1976). "Correlation between 2-and 3-
dimensional finite element analysis of steel bolted end-plate connections."
Computers & Structures 6(4): 381-389
Rathbun, J. Charles (1936), “Elastic Properties of Riveted Connections”,
Transactions of the American Society of Civil Engineers, Vol. 101, pp 524-563,
1936
The AISC Specification for Structural Steel Buildings (2005)
Uslu, C.H. and A. Saritas (2010). “Mathematical Models for Semi-Rigid
Connections: Top and Seat Angle with Double Web Angles Connection” 9th
International Congress on Advances in Civil Engineering, Turkey
Yang, J.-G., T. Murray and R. Plaut (2000). "Three-dimensional finite element
analysis of double angle connections under tension and shear." Journal of
Constructional Steel Research 54(2): 227-244

61
APPENDIX A
NONLINEAR FINITE ELEMENT MODEL SETUPS FOR AZIZINAMINI (1985)
Figure A. 1 Azizinamini 8S1 Undeformed
Figure A. 2 Azizinamini 8S1 Deformed

62
Figure A. 3 Azizinamini 8S2 Undeformed
Figure A. 4 Azizinamini 8S2 Deformed Shapes

63
Figure A. 5 Azizinamini 8S3 Undeformed
Figure A. 6 Azizinamini 8S3 Deformed

64
Figure A. 7 Azizinamini 14S1 Undeformed
Figure A. 8 Azizinamini 14S1 Deformed

65
Figure A. 9 Azizinamini 14S5 Undeformed
Figure A. 10 Azizinamini 14S5 Deformed

66
NONLINEAR FINITE ELEMENT MODEL SETUPS FOR CALADO ET AL. (2000)
Figure A. 11 Calado BCC-7 Undeformed
Figure A. 12 Calado BCC-7 Deformed

67
Figure A. 13 Calado BCC-9 Undeformed
Figure A. 14 Calado BCC-9 Deformed

68
Figure A. 15 Calado BCC-10 Undeformed
Figure A. 16 Calado BCC-10 Deformed

69
NONLINEAR FINITE ELEMENT MODEL SETUPS FOR KOMURO ET AL. (2003)
Figure A. 17 Komuro W18 Undeformed
Figure A. 18 Komuro W18 Deformed

70
Figure A. 19 Komuro W29 Undeformed
Figure A. 20 Komuro W29 Deformed