Embed Size (px)
Citation preview
Modeling of Multiphase Flow and Argon Bubble Entrapment in Continuous Slab Casting of Steel
Mingyi Liang1, Seong-Mook Cho1, Hamed Olia1, Lipsa Das1, Xiaoming Ruan2, and Brian G. Thomas1
1Department of Mechanical Engineering, Colorado School of Mines Brown Hall W370-B, 1610 Illinois Street, Golden, CO, 80401, USA
Phone: 303-273-3309 Email: [email protected] (Seong-Mook Cho) and [email protected] (Brian G. Thomas)
2Steelmaking Research Department, Research Institute Baoshan Iron & Steel Co., Ltd. 889 Fujin Rd., Shanghai 201900, P.R. China.
Keywords: continuous casting; multiphase flow; flow patterns; argon; bubbles; inclusions; particle capture; slabs
INTRODUCTION
In continuous casting of steel, fluid flow in the nozzle and strand can potentially entrap detrimental particles, including inclusions from upstream refining operations, mold slag and argon bubbles. Argon gas is often injected through porous regions in the nozzle refractory in order to lessen nozzle clogging problems [1]. The gas bubbles often become coated with inclusion particles they contact. Although most of the gas escapes through the top-surface slag layer, some can become entrapped into either solidifying steel or hooks near the meniscus, causing permanent defects in the final product, such as pinholes, slivers, blisters and expensive rejects [2].
Thus, there is great incentive to understand particle transport and capture phenomena and to optimize the flow pattern in continuous steel casting to minimize particle entrapment and the associated quality problems. However, due to the harsh environment of the process, it is impossible to observe the internal flow behavior and particle defect formation in the commercial process while they occur. Particle capture is also difficult to in water models or lab-scale models. Thus, combining computational models of all of the complex phenomena together with feasible plant measurements, such as surface flow velocity and the locations of defects in the as-cast slabs, is a useful way to investigate this problem.
In this work, a new, computationally efficient modeling methodology has been developed and validated with plant measurements to quantify multiphase flow of molten steel and argon, particle transport and capture during steady continuous casting of steel slabs. Two cases have been simulated on the same caster, for conditions (Table I) which tend to produce higher quality steel (Case 1) and increased frequency of internal particle-capture defects (Case 2). The flow patterns in nozzle and strand, bubble capture locations and fractions were compared to investigate internal particle defects.
Table I. Caster dimensions and process conditions
Parameters Symbols Case 1 Case 2 Port down angle 𝜃 15° 0°
Slab thickness / width 𝑡 / 𝑤 300mm / 2300mm Tundish height ℎ 1040mm Casting speed 𝑣 0.6m/min Steel flow rate 𝑚 2.9tonne/min
Slide gate opening 𝐸 / 𝐸 62% Submergence depth ℎ 140mm 180mm
Argon flow rate in UTN: Hot / Cold
𝑄 _ / 𝑄 _ 23.3LPM / 5.2SLPM 23.2LPM / 5.4SLPM
Argon flow rate in upper plate: Hot / Cold
𝑄 _ / 𝑄 _ 9.1LPM / 2.2SLPM 16.2LPM / 3.9SLPM
Argon volume fraction 𝑓 7.2% 8.7% Molten steel density 𝜌 7000kg/m3
Molten steel dynamic viscosity 𝜇 0.0063kg/mꞏs
2219© 2019 by the Association for Iron & Steel Technology.
AISTech 2019 — Proceedings of the Iron & Steel Technology Conference6–9 May 2019, Pittsburgh, Pa., USA
DOI 10.1000.377.228
METHODOLOGY
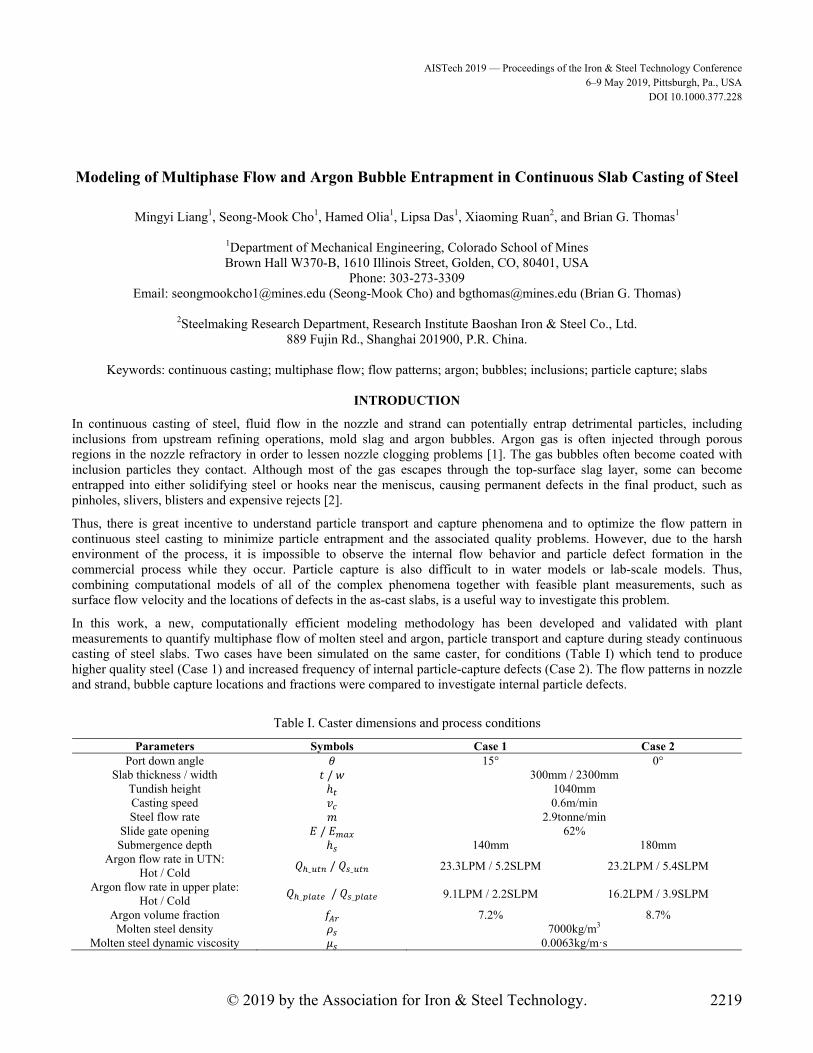
Figure 1 shows a flow chart of the modeling methodology and model validation in this work. With the given nozzle and strand geometries, and casting conditions including argon gas injection and cooling, various models with subroutines are used to simulate particle defect formation considering the effects of molten steel-argon gas flow, argon bubble size distribution, and steel solidification in the real caster. Firstly, the pressure distribution in the tundish, slide-gate and nozzle is calculated with the Pressure-drop Flow-rate model for Slide Gate systems program (PFSG) [3]. Secondly, based on the calculated pressure, the mean argon bubble size is chosen using a two-stage bubble formation model [4]. Then, the mean bubble size and estimated spread parameter of the bubble size distribution measured in a water model, are used to select a Rosin-Rammler size distribution [5] for argon bubbles in the nozzle. Next, molten steel-argon bubble flow patterns in the nozzle and strand are computed with an Eulerian-Eulerian multiphase Computational Fluid Dynamics (CFD) model. The results are validated with nail board test measurements in the real caster. Then, particle transport and capture are simulated with a Lagrangian Discrete Phase CFD model, coupled with the advanced shell capture model [6, 7, 8, 9] and hook capture model [10] for the different bubble sizes of the selected Rosin-Rammler distribution. Finally, the model predictions of the locationand size of captured bubbles are compared with Ultrasonic Test (UT) measurements of the strand / slab. Further descriptionof each model follows.
Figure 1. Flow chart for modeling methodology and validation
Pressure Distribution in the Nozzle: PFSG Model Flow rate and pressure distribution through the metal delivery system is needed by the CFD model for the flow-control opening, and for the prediction of air aspiration problems. This can be calculated using the user-friendly in-house programs, PFSG for slide-gate systems [3] and PFSR for stopper-rod systems [11-12]. These models solve a 1D system of Bernoulli equations for the pressure changes at different points down the system to calculate the complete pressure distribution for a given flow rate and set of casting conditions. Starting at the liquid level in the tundish at 1atm, the PFSG model includes flow through the Upper Tundish Nozzle (UTN), three-plate slide gate, Submerged Entry Nozzle (SEN), and its bifurcated outlet ports, up to molten steel top surface in the mold at 1atm. This efficient model can easily estimate the pressure distribution before developing full 3-D complex computational model.
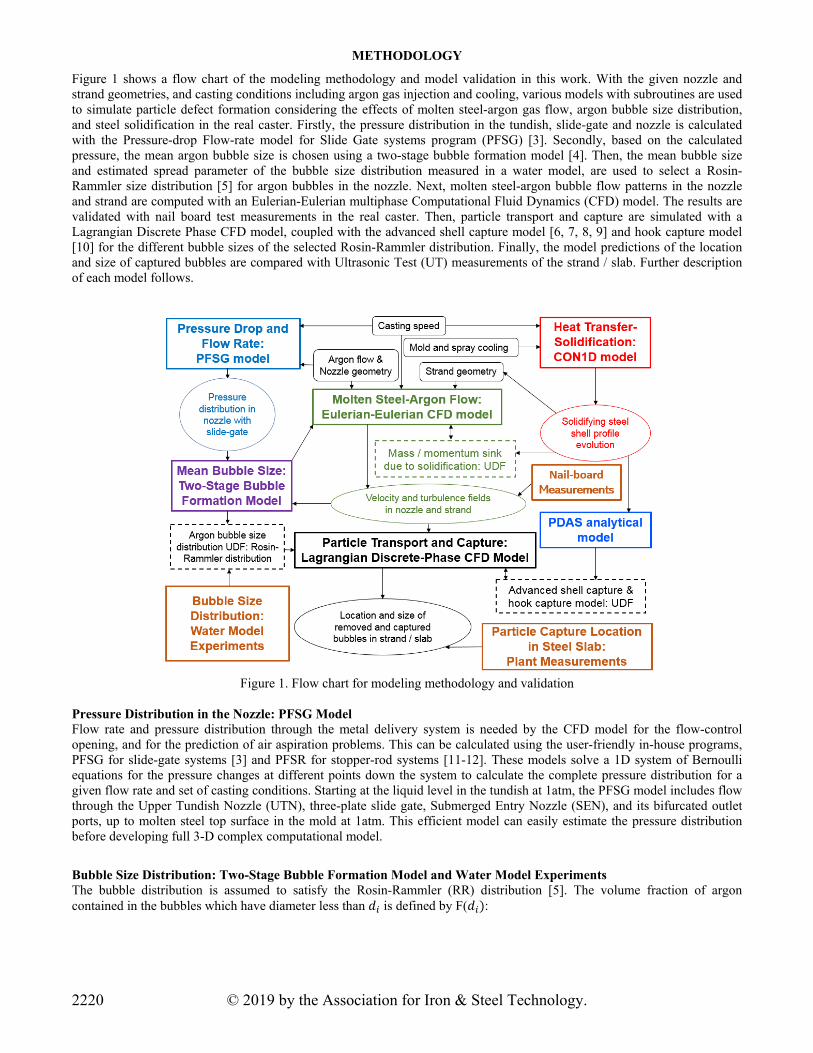
Bubble Size Distribution: Two-Stage Bubble Formation Model and Water Model Experiments The bubble distribution is assumed to satisfy the Rosin-Rammler (RR) distribution [5]. The volume fraction of argon contained in the bubbles which have diameter less than 𝑑 is defined by F(𝑑 :
© 2019 by the Association for Iron & Steel Technology.2220
F(𝑑 =𝑉 𝑑 𝑑
𝑉 1 - exp
𝑑𝑑
(1)
where the mean diameter of the bubbles 𝑑 is determined by a two-stage bubble size model [4] and the spread parameter, 𝑛, is taken as 3.5 based on curve fitting bubble size measurements in a water model [13]. The mean diameters are 5.4 mm for argon injected both into the UTN and upper plate for Case 1, and is 5.4 mm and 6.2 mm for the UTN and upper plate for Case 2. For the argon flow rate and size distributions here, the number of bubbles injected per 0.01s is shown in Figure 2.
(a) (b)
Figure 2. Number and volume fraction of bubbles injected for (a) Case 1 and (b) Case 2 Molten Steel-Argon Gas Flow: Eulerian-Eulerian CFD Model To simulate multiphase flow in the liquid pool of the caster, a three-dimensional Eulerian-Eulerian multiphase model of molten steel-argon gas flow is employed using the commercial finite-volume CFD software package ANSYS FLUENT [14] with User-Defined Functions (UDFs) to account for steel solidification (mass / momentum sinks) [6, 15]. The Eulerian-Eulerian model solves separate continuity equations and sets of momentum equations for each phase. To model turbulence, the Shear-Stress-Transport (SST) k-𝜔 turbulence model [16] is adopted, owing to its better treatment of highly-resolved, low-Re boundary layers (relative to the standard k-ε model), and its much higher computational efficiency (relative to LES simulations). This model combines the standard k-ε in the bulk with the standard k-𝜔 model near the walls with a blending function [16]. It finds the turbulent viscosity by solving two extra scalar equations for the turbulent kinetic energy (k) and specific dissipation rate (𝜔).
Particle Transport: Lagrangian Discrete Phase CFD Model The Lagrangian Discrete Phase Model (DPM) is used to simulate particle transport in the molten steel pool in the caster. Starting with the calculated multiphase flow pattern, the trajectories of ~300,000 discrete particles are then computed for each case. Because the same gas bubble size distribution and fraction is used in both the Eurlian-Eulerian and DPM simulations, the solution should be as accurate as possible for a Reynolds-Averaged Navier-Stokes (RANS) model. Because the dispersed argon bubbles have a low volume fraction (less than 12 %), particle-particle interaction were not considered in this work. During the DPM particle trajectory tracking procedure, the isotropic Discrete Random Walk model [17] is used to approximate the chaotic dispersion of particles due to turbulence in the real transient flow field.
Particle Capture Model: FLUENT UDF An advanced particle capture criterion [6, 7, 8, 9] is applied to predict the capture of particles touching the solidification front. Bubbles smaller than the Primary Dendrite Arm Spacing (PDAS) can flow between arms and become entrapped. Larger particles may become engulfed into the solidification front, if the particle remains stationary at the solidification front for long enough time. The latter occurs according a balance of 8 different forces at the solidification front, which includes the drag from tangential velocities, which can wash the particles away, back into the main flow. Details of this criterion are provided elsewhere [6, 7, 8, 9]. Particles can also be captured as they rise beneath solidified meniscus hooks, which is modeled by creating hook zones [10].
1.0E-09
1.0E-08
1.0E-07
1.0E-06
1.0E-05
1.0E-04
1.0E-03
1.0E-02
1.0E-01
1.0E+00
0
10
20
30
40
50
60
70
80
Bub
ble
volu
me
frac
tion
Num
ber
of b
ubbl
es in
ject
ed p
er 0
.01s
(#)
Bubble diameter (mm)
UTN
Upper Plate
Bubble volume fraction
1.0E-09
1.0E-08
1.0E-07
1.0E-06
1.0E-05
1.0E-04
1.0E-03
1.0E-02
1.0E-01
1.0E+00
0
10
20
30
40
50
60
70
80
Bub
ble
volu
me
frac
tion
Num
ber
of b
ubbl
es in
ject
ed p
er 0
.01s
(#)
Bubble diameter (mm)
UTNUpper PlateBubble volume fraction
2221© 2019 by the Association for Iron & Steel Technology.
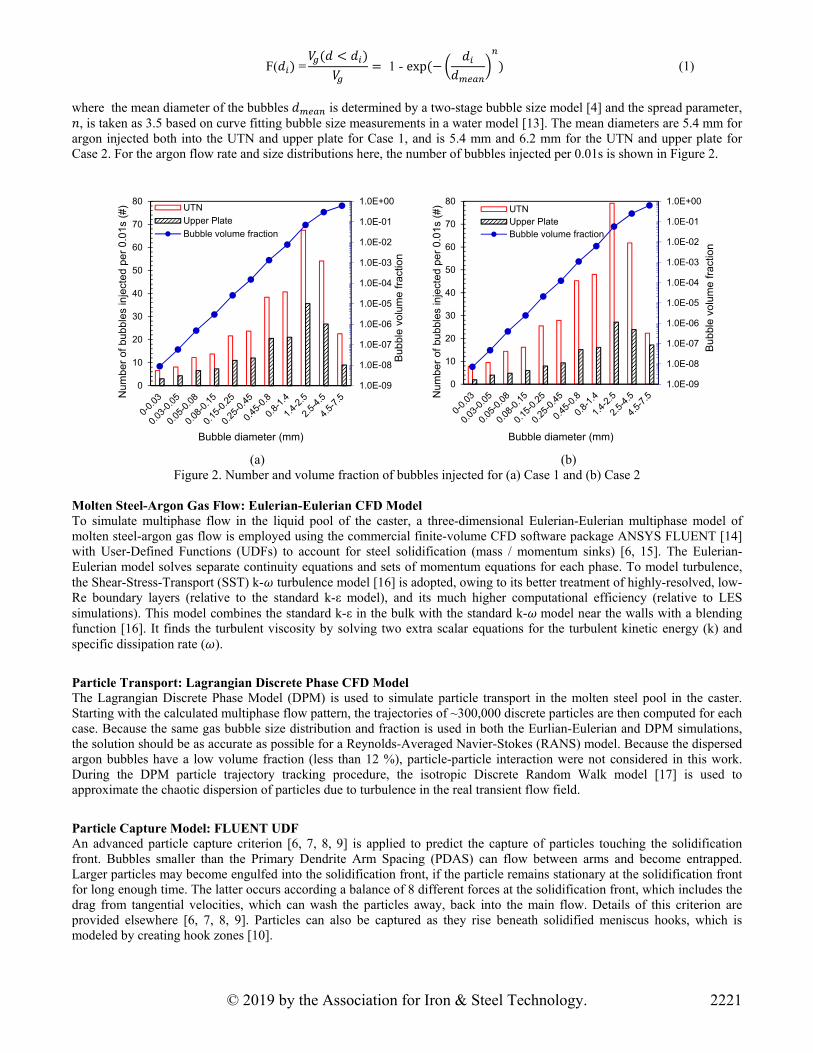
Heat Transfer and Solidification: CON1D Shell thickness profiles in the mold and strand on both wide and narrow faces are calculated from the CON1D model [18], and are given in Figure 3. The strand shell thickness can be roughly characterized by a solidification constant of 3.2 mm/√𝑠 (0.98 in/√𝑚𝑖𝑛 ), based on fitting the CON1D output to s=𝐾√𝑡𝑖𝑚𝑒. In addition to defining the shape of the liquid pool for the model domain, the shell thickness profile is implemented into the mass/momentum sink UDFs and the particle capture models.
(a) (b) Figure 3. Steel shell thickness profiles down the steel strand (a) Narrow face, and (b) Wide face
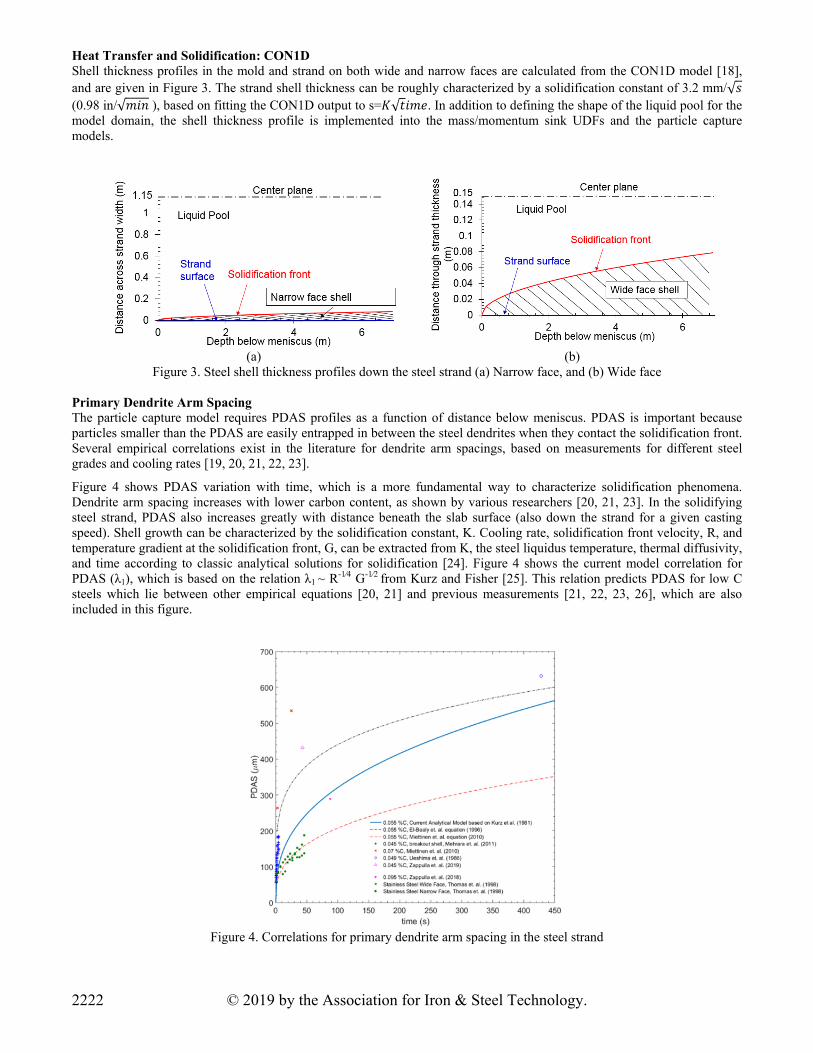
Primary Dendrite Arm Spacing The particle capture model requires PDAS profiles as a function of distance below meniscus. PDAS is important because particles smaller than the PDAS are easily entrapped in between the steel dendrites when they contact the solidification front. Several empirical correlations exist in the literature for dendrite arm spacings, based on measurements for different steel grades and cooling rates [19, 20, 21, 22, 23].
Figure 4 shows PDAS variation with time, which is a more fundamental way to characterize solidification phenomena. Dendrite arm spacing increases with lower carbon content, as shown by various researchers [20, 21, 23]. In the solidifying steel strand, PDAS also increases greatly with distance beneath the slab surface (also down the strand for a given casting speed). Shell growth can be characterized by the solidification constant, K. Cooling rate, solidification front velocity, R, and temperature gradient at the solidification front, G, can be extracted from K, the steel liquidus temperature, thermal diffusivity, and time according to classic analytical solutions for solidification [24]. Figure 4 shows the current model correlation for PDAS (λ1), which is based on the relation λ1 ~ R-1∕4 G-1∕2 from Kurz and Fisher [25]. This relation predicts PDAS for low C steels which lie between other empirical equations [20, 21] and previous measurements [21, 22, 23, 26], which are also included in this figure.
Figure 4. Correlations for primary dendrite arm spacing in the steel strand
© 2019 by the Association for Iron & Steel Technology.2222
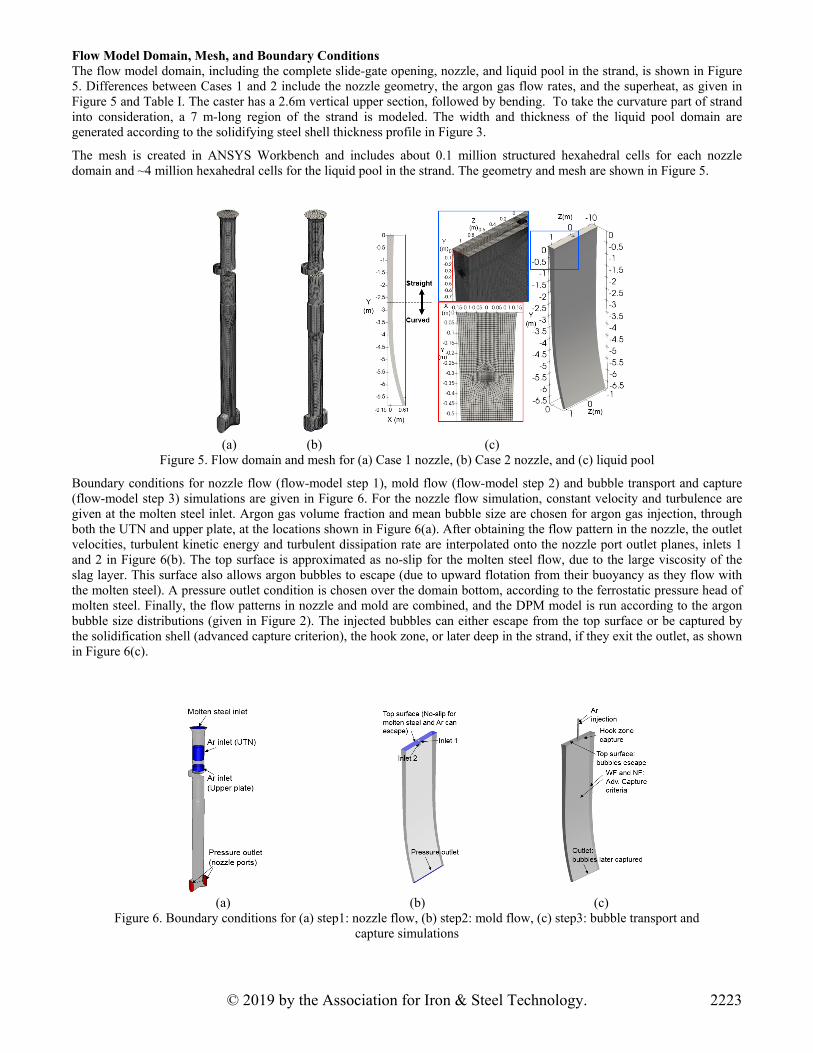
Flow Model Domain, Mesh, and Boundary Conditions The flow model domain, including the complete slide-gate opening, nozzle, and liquid pool in the strand, is shown in Figure 5. Differences between Cases 1 and 2 include the nozzle geometry, the argon gas flow rates, and the superheat, as given in Figure 5 and Table I. The caster has a 2.6m vertical upper section, followed by bending. To take the curvature part of strand into consideration, a 7 m-long region of the strand is modeled. The width and thickness of the liquid pool domain are generated according to the solidifying steel shell thickness profile in Figure 3.
The mesh is created in ANSYS Workbench and includes about 0.1 million structured hexahedral cells for each nozzle domain and ~4 million hexahedral cells for the liquid pool in the strand. The geometry and mesh are shown in Figure 5.
(a) (b) (c) Figure 5. Flow domain and mesh for (a) Case 1 nozzle, (b) Case 2 nozzle, and (c) liquid pool
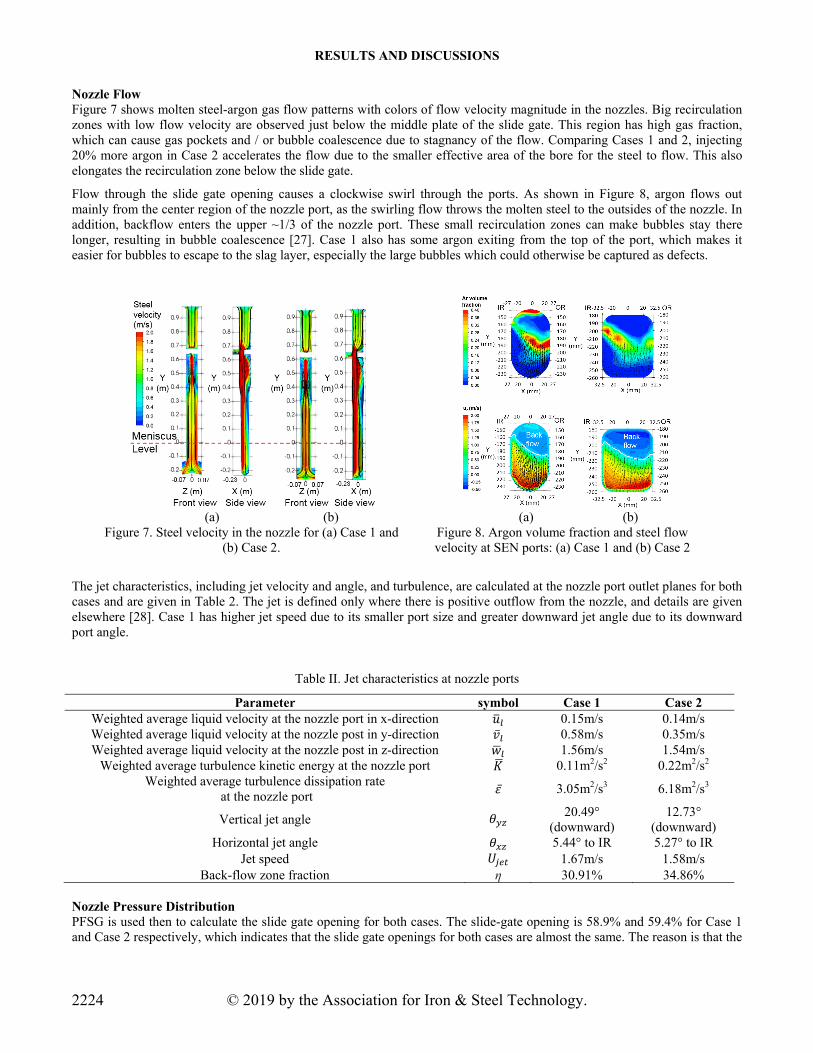
Boundary conditions for nozzle flow (flow-model step 1), mold flow (flow-model step 2) and bubble transport and capture (flow-model step 3) simulations are given in Figure 6. For the nozzle flow simulation, constant velocity and turbulence are given at the molten steel inlet. Argon gas volume fraction and mean bubble size are chosen for argon gas injection, through both the UTN and upper plate, at the locations shown in Figure 6(a). After obtaining the flow pattern in the nozzle, the outlet velocities, turbulent kinetic energy and turbulent dissipation rate are interpolated onto the nozzle port outlet planes, inlets 1 and 2 in Figure 6(b). The top surface is approximated as no-slip for the molten steel flow, due to the large viscosity of the slag layer. This surface also allows argon bubbles to escape (due to upward flotation from their buoyancy as they flow with the molten steel). A pressure outlet condition is chosen over the domain bottom, according to the ferrostatic pressure head of molten steel. Finally, the flow patterns in nozzle and mold are combined, and the DPM model is run according to the argon bubble size distributions (given in Figure 2). The injected bubbles can either escape from the top surface or be captured by the solidification shell (advanced capture criterion), the hook zone, or later deep in the strand, if they exit the outlet, as shown in Figure 6(c).
(a) (b) (c) Figure 6. Boundary conditions for (a) step1: nozzle flow, (b) step2: mold flow, (c) step3: bubble transport and
capture simulations
2223© 2019 by the Association for Iron & Steel Technology.
RESULTS AND DISCUSSIONS
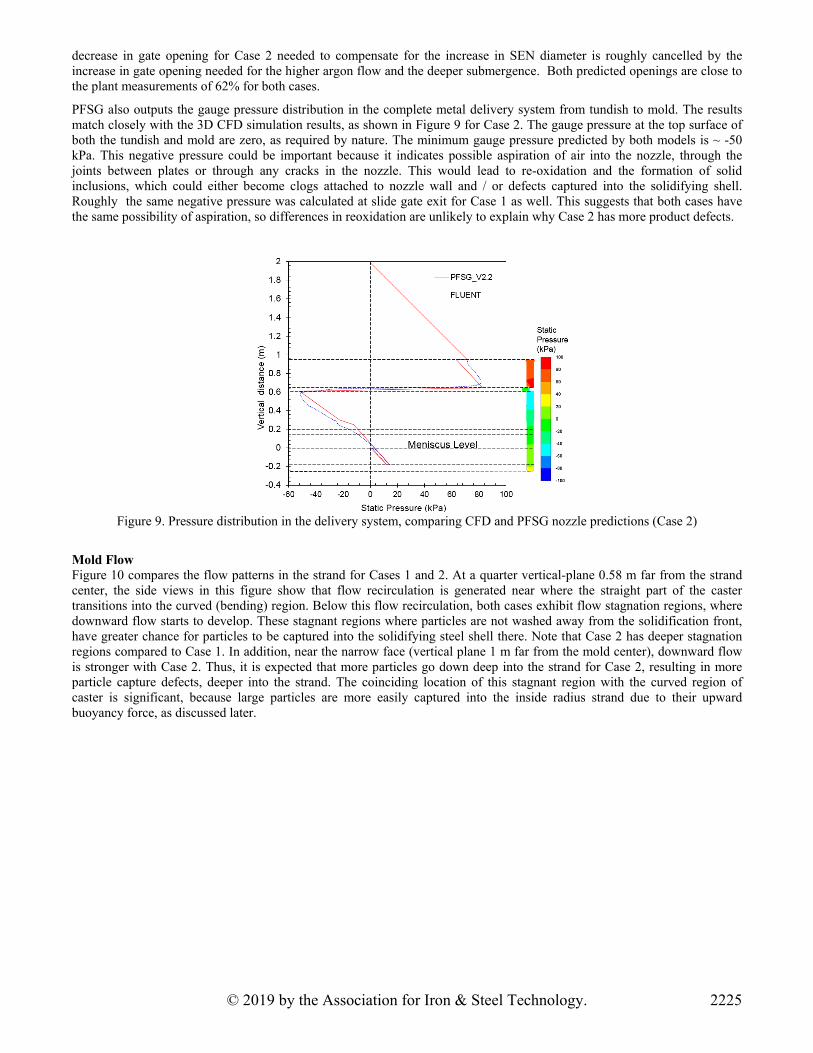
Nozzle Flow Figure 7 shows molten steel-argon gas flow patterns with colors of flow velocity magnitude in the nozzles. Big recirculation zones with low flow velocity are observed just below the middle plate of the slide gate. This region has high gas fraction, which can cause gas pockets and / or bubble coalescence due to stagnancy of the flow. Comparing Cases 1 and 2, injecting 20% more argon in Case 2 accelerates the flow due to the smaller effective area of the bore for the steel to flow. This also elongates the recirculation zone below the slide gate.
Flow through the slide gate opening causes a clockwise swirl through the ports. As shown in Figure 8, argon flows out mainly from the center region of the nozzle port, as the swirling flow throws the molten steel to the outsides of the nozzle. In addition, backflow enters the upper ~1/3 of the nozzle port. These small recirculation zones can make bubbles stay there longer, resulting in bubble coalescence [27]. Case 1 also has some argon exiting from the top of the port, which makes it easier for bubbles to escape to the slag layer, especially the large bubbles which could otherwise be captured as defects.
(a) (b) (a) (b)Figure 7. Steel velocity in the nozzle for (a) Case 1 and
(b) Case 2.Figure 8. Argon volume fraction and steel flow velocity at SEN ports: (a) Case 1 and (b) Case 2
The jet characteristics, including jet velocity and angle, and turbulence, are calculated at the nozzle port outlet planes for both cases and are given in Table 2. The jet is defined only where there is positive outflow from the nozzle, and details are given elsewhere [28]. Case 1 has higher jet speed due to its smaller port size and greater downward jet angle due to its downward port angle.
Table II. Jet characteristics at nozzle ports
Parameter symbol Case 1 Case 2 Weighted average liquid velocity at the nozzle port in x-direction 𝑢 0.15m/s 0.14m/s Weighted average liquid velocity at the nozzle post in y-direction �̅� 0.58m/s 0.35m/s Weighted average liquid velocity at the nozzle post in z-direction 𝑤 1.56m/s 1.54m/s
Weighted average turbulence kinetic energy at the nozzle port 𝐾 0.11m2/s2 0.22m2/s2 Weighted average turbulence dissipation rate
at the nozzle port 𝜀 ̅ 3.05m2/s3 6.18m2/s3
Vertical jet angle 𝜃 20.49° (downward)
12.73° (downward)
Horizontal jet angle 𝜃 5.44° to IR 5.27° to IR Jet speed 𝑈 1.67m/s 1.58m/s
Back-flow zone fraction η 30.91% 34.86%
Nozzle Pressure Distribution PFSG is used then to calculate the slide gate opening for both cases. The slide-gate opening is 58.9% and 59.4% for Case 1 and Case 2 respectively, which indicates that the slide gate openings for both cases are almost the same. The reason is that the
© 2019 by the Association for Iron & Steel Technology.2224
decrease in gate opening for Case 2 needed to compensate for the increase in SEN diameter is roughly cancelled by the increase in gate opening needed for the higher argon flow and the deeper submergence. Both predicted openings are close to the plant measurements of 62% for both cases.
PFSG also outputs the gauge pressure distribution in the complete metal delivery system from tundish to mold. The results match closely with the 3D CFD simulation results, as shown in Figure 9 for Case 2. The gauge pressure at the top surface of both the tundish and mold are zero, as required by nature. The minimum gauge pressure predicted by both models is ~ -50 kPa. This negative pressure could be important because it indicates possible aspiration of air into the nozzle, through the joints between plates or through any cracks in the nozzle. This would lead to re-oxidation and the formation of solid inclusions, which could either become clogs attached to nozzle wall and / or defects captured into the solidifying shell. Roughly the same negative pressure was calculated at slide gate exit for Case 1 as well. This suggests that both cases have the same possibility of aspiration, so differences in reoxidation are unlikely to explain why Case 2 has more product defects.
Figure 9. Pressure distribution in the delivery system, comparing CFD and PFSG nozzle predictions (Case 2)
Mold Flow Figure 10 compares the flow patterns in the strand for Cases 1 and 2. At a quarter vertical-plane 0.58 m far from the strand center, the side views in this figure show that flow recirculation is generated near where the straight part of the caster transitions into the curved (bending) region. Below this flow recirculation, both cases exhibit flow stagnation regions, where downward flow starts to develop. These stagnant regions where particles are not washed away from the solidification front, have greater chance for particles to be captured into the solidifying steel shell there. Note that Case 2 has deeper stagnation regions compared to Case 1. In addition, near the narrow face (vertical plane 1 m far from the mold center), downward flow is stronger with Case 2. Thus, it is expected that more particles go down deep into the strand for Case 2, resulting in more particle capture defects, deeper into the strand. The coinciding location of this stagnant region with the curved region of caster is significant, because large particles are more easily captured into the inside radius strand due to their upward buoyancy force, as discussed later.
2225© 2019 by the Association for Iron & Steel Technology.
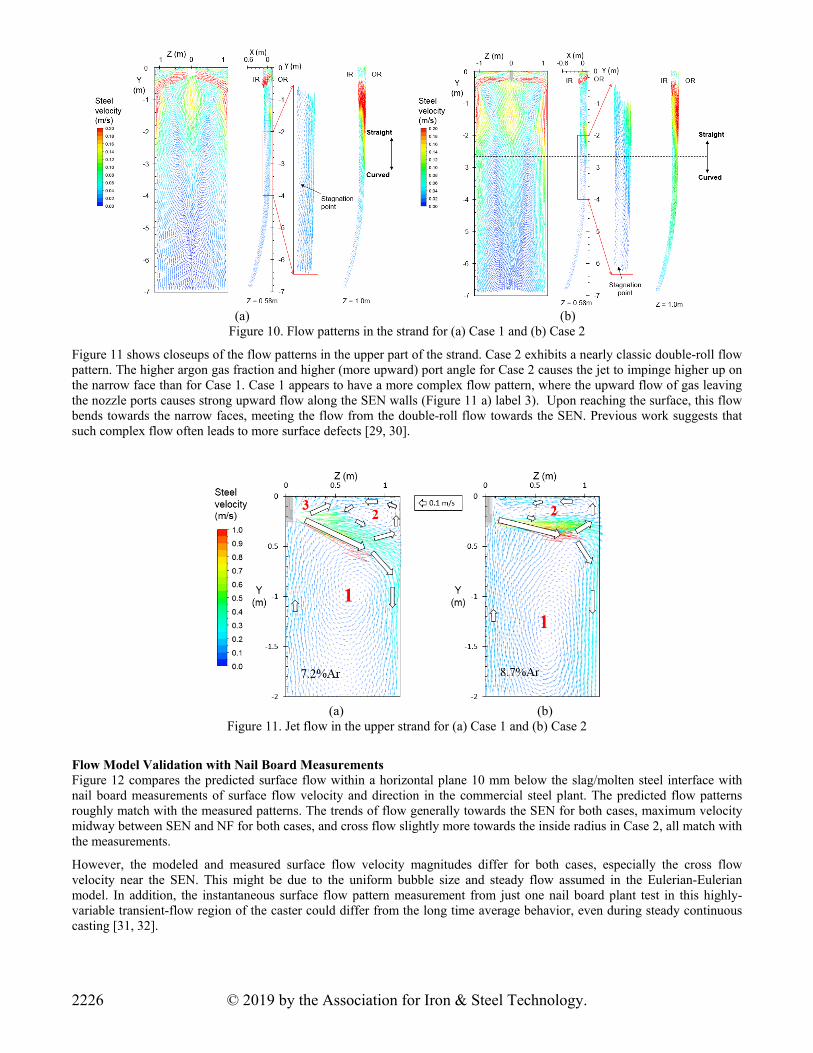
(a) (b) Figure 10. Flow patterns in the strand for (a) Case 1 and (b) Case 2
Figure 11 shows closeups of the flow patterns in the upper part of the strand. Case 2 exhibits a nearly classic double-roll flow pattern. The higher argon gas fraction and higher (more upward) port angle for Case 2 causes the jet to impinge higher up on the narrow face than for Case 1. Case 1 appears to have a more complex flow pattern, where the upward flow of gas leaving the nozzle ports causes strong upward flow along the SEN walls (Figure 11 a) label 3). Upon reaching the surface, this flow bends towards the narrow faces, meeting the flow from the double-roll flow towards the SEN. Previous work suggests that such complex flow often leads to more surface defects [29, 30].
(a) (b) Figure 11. Jet flow in the upper strand for (a) Case 1 and (b) Case 2
Flow Model Validation with Nail Board Measurements Figure 12 compares the predicted surface flow within a horizontal plane 10 mm below the slag/molten steel interface with nail board measurements of surface flow velocity and direction in the commercial steel plant. The predicted flow patterns roughly match with the measured patterns. The trends of flow generally towards the SEN for both cases, maximum velocity midway between SEN and NF for both cases, and cross flow slightly more towards the inside radius in Case 2, all match with the measurements.
However, the modeled and measured surface flow velocity magnitudes differ for both cases, especially the cross flow velocity near the SEN. This might be due to the uniform bubble size and steady flow assumed in the Eulerian-Eulerian model. In addition, the instantaneous surface flow pattern measurement from just one nail board plant test in this highly-variable transient-flow region of the caster could differ from the long time average behavior, even during steady continuous casting [31, 32].
© 2019 by the Association for Iron & Steel Technology.2226
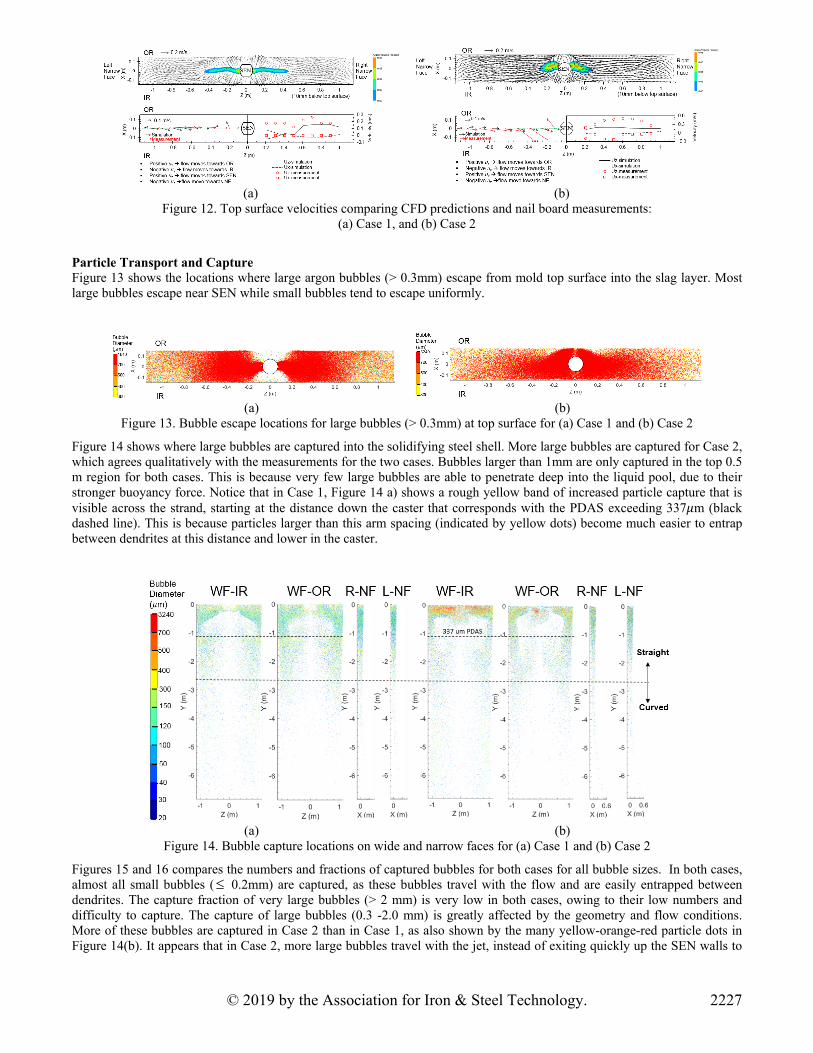
(a) (b)
Figure 12. Top surface velocities comparing CFD predictions and nail board measurements: (a) Case 1, and (b) Case 2
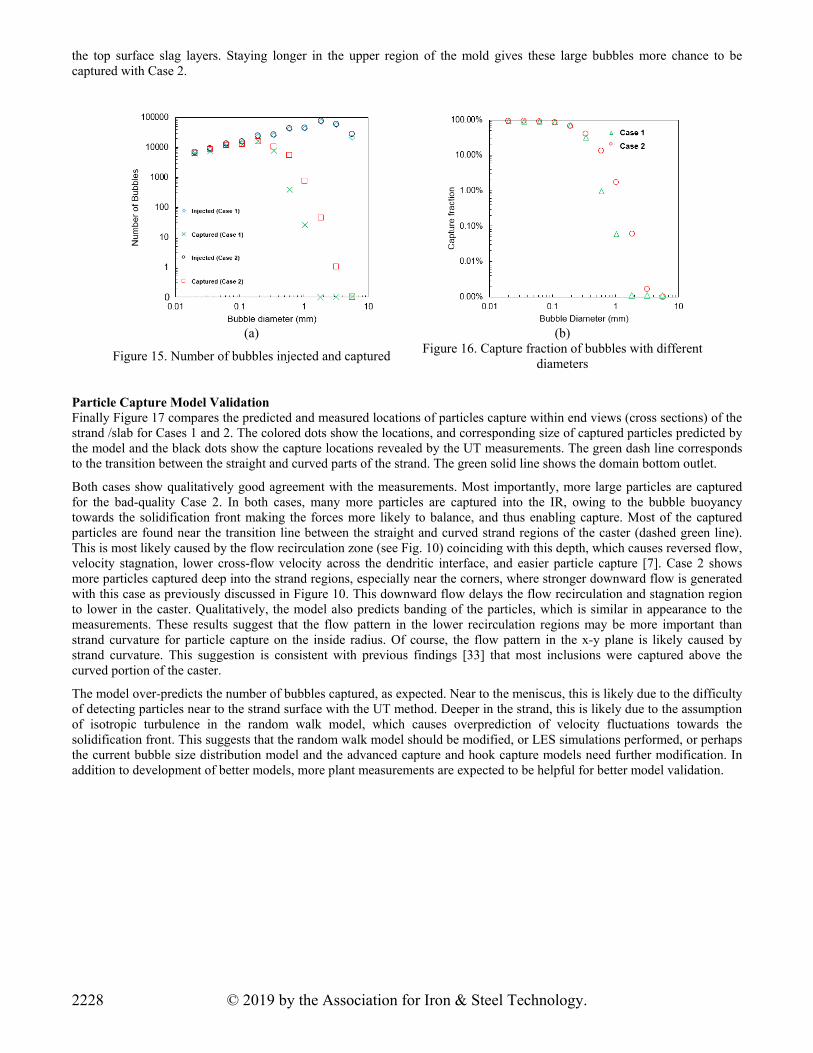
Particle Transport and Capture Figure 13 shows the locations where large argon bubbles (> 0.3mm) escape from mold top surface into the slag layer. Most large bubbles escape near SEN while small bubbles tend to escape uniformly.
(a) (b)
Figure 13. Bubble escape locations for large bubbles (> 0.3mm) at top surface for (a) Case 1 and (b) Case 2
Figure 14 shows where large bubbles are captured into the solidifying steel shell. More large bubbles are captured for Case 2, which agrees qualitatively with the measurements for the two cases. Bubbles larger than 1mm are only captured in the top 0.5 m region for both cases. This is because very few large bubbles are able to penetrate deep into the liquid pool, due to their stronger buoyancy force. Notice that in Case 1, Figure 14 a) shows a rough yellow band of increased particle capture that is visible across the strand, starting at the distance down the caster that corresponds with the PDAS exceeding 337𝜇m (black dashed line). This is because particles larger than this arm spacing (indicated by yellow dots) become much easier to entrap between dendrites at this distance and lower in the caster.
(a) (b)
Figure 14. Bubble capture locations on wide and narrow faces for (a) Case 1 and (b) Case 2
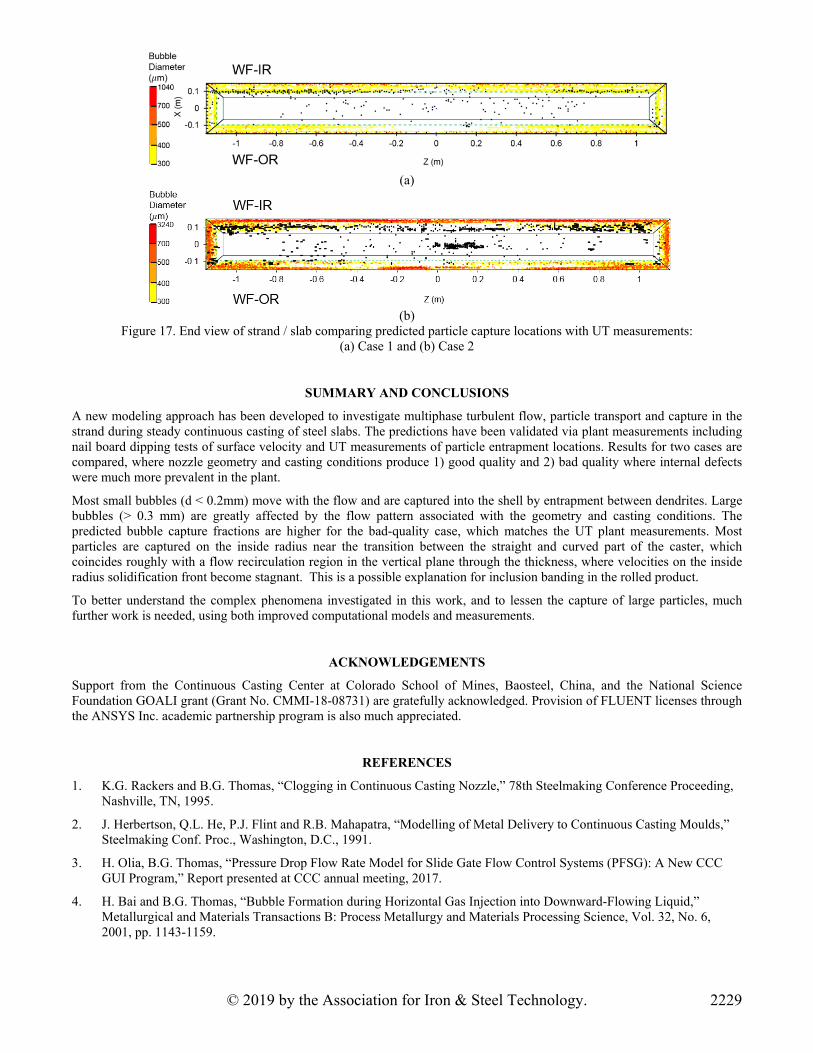
Figures 15 and 16 compares the numbers and fractions of captured bubbles for both cases for all bubble sizes. In both cases, almost all small bubbles ( 0.2mm) are captured, as these bubbles travel with the flow and are easily entrapped between dendrites. The capture fraction of very large bubbles (> 2 mm) is very low in both cases, owing to their low numbers and difficulty to capture. The capture of large bubbles (0.3 -2.0 mm) is greatly affected by the geometry and flow conditions. More of these bubbles are captured in Case 2 than in Case 1, as also shown by the many yellow-orange-red particle dots in Figure 14(b). It appears that in Case 2, more large bubbles travel with the jet, instead of exiting quickly up the SEN walls to
2227© 2019 by the Association for Iron & Steel Technology.
the top surface slag layers. Staying longer in the upper region of the mold gives these large bubbles more chance to be captured with Case 2.
(a) (b)
Figure 15. Number of bubbles injected and captured Figure 16. Capture fraction of bubbles with different
diameters
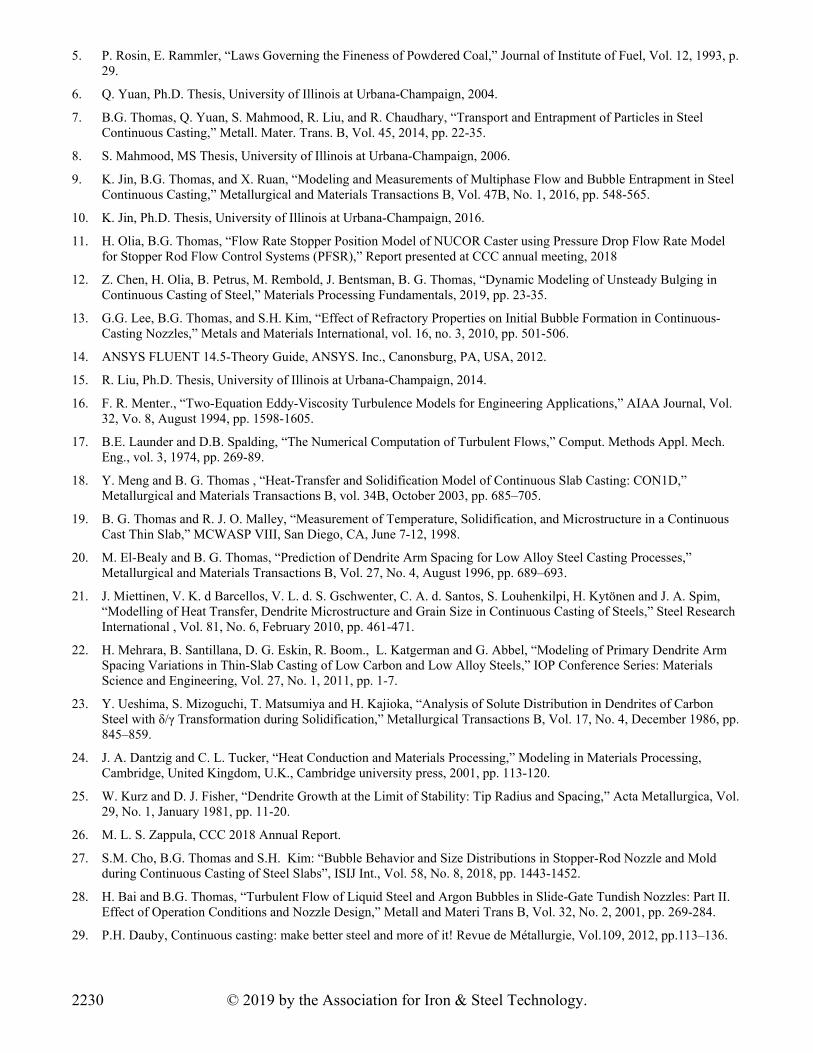
Particle Capture Model Validation Finally Figure 17 compares the predicted and measured locations of particles capture within end views (cross sections) of the strand /slab for Cases 1 and 2. The colored dots show the locations, and corresponding size of captured particles predicted by the model and the black dots show the capture locations revealed by the UT measurements. The green dash line corresponds to the transition between the straight and curved parts of the strand. The green solid line shows the domain bottom outlet.
Both cases show qualitatively good agreement with the measurements. Most importantly, more large particles are captured for the bad-quality Case 2. In both cases, many more particles are captured into the IR, owing to the bubble buoyancy towards the solidification front making the forces more likely to balance, and thus enabling capture. Most of the captured particles are found near the transition line between the straight and curved strand regions of the caster (dashed green line). This is most likely caused by the flow recirculation zone (see Fig. 10) coinciding with this depth, which causes reversed flow, velocity stagnation, lower cross-flow velocity across the dendritic interface, and easier particle capture [7]. Case 2 shows more particles captured deep into the strand regions, especially near the corners, where stronger downward flow is generated with this case as previously discussed in Figure 10. This downward flow delays the flow recirculation and stagnation region to lower in the caster. Qualitatively, the model also predicts banding of the particles, which is similar in appearance to the measurements. These results suggest that the flow pattern in the lower recirculation regions may be more important than strand curvature for particle capture on the inside radius. Of course, the flow pattern in the x-y plane is likely caused by strand curvature. This suggestion is consistent with previous findings [33] that most inclusions were captured above the curved portion of the caster.
The model over-predicts the number of bubbles captured, as expected. Near to the meniscus, this is likely due to the difficulty of detecting particles near to the strand surface with the UT method. Deeper in the strand, this is likely due to the assumption of isotropic turbulence in the random walk model, which causes overprediction of velocity fluctuations towards the solidification front. This suggests that the random walk model should be modified, or LES simulations performed, or perhaps the current bubble size distribution model and the advanced capture and hook capture models need further modification. In addition to development of better models, more plant measurements are expected to be helpful for better model validation.
© 2019 by the Association for Iron & Steel Technology.2228
(a)
(b) Figure 17. End view of strand / slab comparing predicted particle capture locations with UT measurements:
(a) Case 1 and (b) Case 2
SUMMARY AND CONCLUSIONS
A new modeling approach has been developed to investigate multiphase turbulent flow, particle transport and capture in the strand during steady continuous casting of steel slabs. The predictions have been validated via plant measurements including nail board dipping tests of surface velocity and UT measurements of particle entrapment locations. Results for two cases are compared, where nozzle geometry and casting conditions produce 1) good quality and 2) bad quality where internal defects were much more prevalent in the plant.
Most small bubbles (d < 0.2mm) move with the flow and are captured into the shell by entrapment between dendrites. Large bubbles (> 0.3 mm) are greatly affected by the flow pattern associated with the geometry and casting conditions. The predicted bubble capture fractions are higher for the bad-quality case, which matches the UT plant measurements. Most particles are captured on the inside radius near the transition between the straight and curved part of the caster, which coincides roughly with a flow recirculation region in the vertical plane through the thickness, where velocities on the inside radius solidification front become stagnant. This is a possible explanation for inclusion banding in the rolled product.
To better understand the complex phenomena investigated in this work, and to lessen the capture of large particles, much further work is needed, using both improved computational models and measurements.
ACKNOWLEDGEMENTS
Support from the Continuous Casting Center at Colorado School of Mines, Baosteel, China, and the National Science Foundation GOALI grant (Grant No. CMMI-18-08731) are gratefully acknowledged. Provision of FLUENT licenses through the ANSYS Inc. academic partnership program is also much appreciated.
REFERENCES
1. K.G. Rackers and B.G. Thomas, “Clogging in Continuous Casting Nozzle,” 78th Steelmaking Conference Proceeding,Nashville, TN, 1995.
2. J. Herbertson, Q.L. He, P.J. Flint and R.B. Mahapatra, “Modelling of Metal Delivery to Continuous Casting Moulds,”Steelmaking Conf. Proc., Washington, D.C., 1991.
3. H. Olia, B.G. Thomas, “Pressure Drop Flow Rate Model for Slide Gate Flow Control Systems (PFSG): A New CCCGUI Program,” Report presented at CCC annual meeting, 2017.
4. H. Bai and B.G. Thomas, “Bubble Formation during Horizontal Gas Injection into Downward-Flowing Liquid,”Metallurgical and Materials Transactions B: Process Metallurgy and Materials Processing Science, Vol. 32, No. 6,2001, pp. 1143-1159.
2229© 2019 by the Association for Iron & Steel Technology.
5. P. Rosin, E. Rammler, “Laws Governing the Fineness of Powdered Coal,” Journal of Institute of Fuel, Vol. 12, 1993, p.29.
6. Q. Yuan, Ph.D. Thesis, University of Illinois at Urbana-Champaign, 2004.
7. B.G. Thomas, Q. Yuan, S. Mahmood, R. Liu, and R. Chaudhary, “Transport and Entrapment of Particles in SteelContinuous Casting,” Metall. Mater. Trans. B, Vol. 45, 2014, pp. 22-35.
8. S. Mahmood, MS Thesis, University of Illinois at Urbana-Champaign, 2006.
9. K. Jin, B.G. Thomas, and X. Ruan, “Modeling and Measurements of Multiphase Flow and Bubble Entrapment in SteelContinuous Casting,” Metallurgical and Materials Transactions B, Vol. 47B, No. 1, 2016, pp. 548-565.
10. K. Jin, Ph.D. Thesis, University of Illinois at Urbana-Champaign, 2016.
11. H. Olia, B.G. Thomas, “Flow Rate Stopper Position Model of NUCOR Caster using Pressure Drop Flow Rate Modelfor Stopper Rod Flow Control Systems (PFSR),” Report presented at CCC annual meeting, 2018
12. Z. Chen, H. Olia, B. Petrus, M. Rembold, J. Bentsman, B. G. Thomas, “Dynamic Modeling of Unsteady Bulging inContinuous Casting of Steel,” Materials Processing Fundamentals, 2019, pp. 23-35.
13. G.G. Lee, B.G. Thomas, and S.H. Kim, “Effect of Refractory Properties on Initial Bubble Formation in Continuous-Casting Nozzles,” Metals and Materials International, vol. 16, no. 3, 2010, pp. 501-506.
14. ANSYS FLUENT 14.5-Theory Guide, ANSYS. Inc., Canonsburg, PA, USA, 2012.
15. R. Liu, Ph.D. Thesis, University of Illinois at Urbana-Champaign, 2014.
16. F. R. Menter., “Two-Equation Eddy-Viscosity Turbulence Models for Engineering Applications,” AIAA Journal, Vol.32, Vo. 8, August 1994, pp. 1598-1605.
17. B.E. Launder and D.B. Spalding, “The Numerical Computation of Turbulent Flows,” Comput. Methods Appl. Mech.Eng., vol. 3, 1974, pp. 269-89.
18. Y. Meng and B. G. Thomas , “Heat-Transfer and Solidification Model of Continuous Slab Casting: CON1D,”Metallurgical and Materials Transactions B, vol. 34B, October 2003, pp. 685–705.
19. B. G. Thomas and R. J. O. Malley, “Measurement of Temperature, Solidification, and Microstructure in a ContinuousCast Thin Slab,” MCWASP VIII, San Diego, CA, June 7-12, 1998.
20. M. El-Bealy and B. G. Thomas, “Prediction of Dendrite Arm Spacing for Low Alloy Steel Casting Processes,”Metallurgical and Materials Transactions B, Vol. 27, No. 4, August 1996, pp. 689–693.
21. J. Miettinen, V. K. d Barcellos, V. L. d. S. Gschwenter, C. A. d. Santos, S. Louhenkilpi, H. Kytönen and J. A. Spim,“Modelling of Heat Transfer, Dendrite Microstructure and Grain Size in Continuous Casting of Steels,” Steel ResearchInternational , Vol. 81, No. 6, February 2010, pp. 461-471.
22. H. Mehrara, B. Santillana, D. G. Eskin, R. Boom., L. Katgerman and G. Abbel, “Modeling of Primary Dendrite ArmSpacing Variations in Thin-Slab Casting of Low Carbon and Low Alloy Steels,” IOP Conference Series: MaterialsScience and Engineering, Vol. 27, No. 1, 2011, pp. 1-7.
23. Y. Ueshima, S. Mizoguchi, T. Matsumiya and H. Kajioka, “Analysis of Solute Distribution in Dendrites of CarbonSteel with δ/γ Transformation during Solidification,” Metallurgical Transactions B, Vol. 17, No. 4, December 1986, pp.845–859.
24. J. A. Dantzig and C. L. Tucker, “Heat Conduction and Materials Processing,” Modeling in Materials Processing,Cambridge, United Kingdom, U.K., Cambridge university press, 2001, pp. 113-120.
25. W. Kurz and D. J. Fisher, “Dendrite Growth at the Limit of Stability: Tip Radius and Spacing,” Acta Metallurgica, Vol.29, No. 1, January 1981, pp. 11-20.
26. M. L. S. Zappula, CCC 2018 Annual Report.
27. S.M. Cho, B.G. Thomas and S.H. Kim: “Bubble Behavior and Size Distributions in Stopper-Rod Nozzle and Moldduring Continuous Casting of Steel Slabs”, ISIJ Int., Vol. 58, No. 8, 2018, pp. 1443-1452.
28. H. Bai and B.G. Thomas, “Turbulent Flow of Liquid Steel and Argon Bubbles in Slide-Gate Tundish Nozzles: Part II.Effect of Operation Conditions and Nozzle Design,” Metall and Materi Trans B, Vol. 32, No. 2, 2001, pp. 269-284.
29. P.H. Dauby, Continuous casting: make better steel and more of it! Revue de Métallurgie, Vol.109, 2012, pp.113–136.
© 2019 by the Association for Iron & Steel Technology.2230

30. B. G. Thomas, Chapter 14. In Making, Shaping and Treating of Steel, AISE, (2003).
31. S.M. Cho, B. G. Thomas and S.H. Kim, “Effect of Nozzle Port Angle on Transient Flow and Surface Slag Behaviorduring Continuous Steel-Slab Casting,” Metall and Materi Trans B, vol. 50(B), pp. 52-76, 2018.
32. S.M. Cho, B. G. Thomas and S.H. Kim, “Transient Two-Phase Flow in Slide-Gate Nozzle and Mold of ContinuousSteel Slab Casting with and without Double-Ruler Electro-Magnetic Braking,” Metall and Materi Trans B, Vol. 47(B),2016, pp. 3080-3098.
33. G.G. Lee, H.J. Shin, B.G. Thomas and S.H. Kim, “Asymmetric Multi-phase Fluid Flow and Particle Entrapment ina Continuous Casting Mold,” AISTech 2008 Steelmaking Conference Proc., Pittsburgh, PA, May 5-8, 2008, Assoc.Iron Steel Tech., Warrendale, PA, Vol. 1.
2231© 2019 by the Association for Iron & Steel Technology.