Embed Size (px)
Citation preview
Modeling of Moisture Transport in Woodwith Hysteresis and Temperature-Dependent Sorption Characteristics
Carsten Rode, Ph.D. Christian Odin Clorius, Ph.D.
ABSTRACT
Transient calculation models that predict moisture content in wood and other hygroscopic construction members employ thesorption curve of the materials to express the relationship between relative humidity of air and equilibrium moisture content.However, the sorption curves are somewhat temperature dependent, and they exhibit hysteresis, so the equilibrium state dependson the sorption history. Most transient moisture transport models neglect these facts. This paper will attempt to refine the currentmodels by implementing a sorption “surface” spanned by relative humidity, temperature, and the resulting moisture content.
The paper mainly indicates that taking hysteresis into account will tend to reduce the effective moisture capacity of buildingmaterials for short-term moisture variations, while taking the influence of temperature on the sorption properties into accountwill tend to increase the apparent moisture capacity in practical situations where heating of a building element is normally ensuedby its drying.
The paper will investigate the effect of considering moisture content dependency of the vapor permeability, sorption hyster-esis, and temperature dependency of the sorption curves in an existing calculation model, which is used to predict the moistureconditions in solid wood constructions. This paper presents measurements of moisture content in almost 5-in.-thick roof elementsof solid wood, which are located over an open stable for cattle. A previous comparison between measurement and prediction ofthe moisture content of the wood had indicated the possibility of using temperature-dependent sorption data as a way to improvethe correspondence—particularly the question about the magnitude of the seasonal variations. The calculation results with thenew model are presented alongside with experimental results and practical experiences of such constructions.
INTRODUCTION
The influence of moisture content on the mechanicalbehavior of timber constructions is traditionally and accordingto the European code (Eurocode 5 2001) handled by thesystem of service classes and the corresponding modificationfactors. Whereas this system is very expedient and rationalwith respect to the strength and stiffness properties, there is ashortcoming of the system regarding the assessment of fluc-tuations of moisture content within the service classes. Thisassessment is needed both in the case where changes in mois-ture content give rise to global deformations of the structure(for an example, see Clorius [2003]) and in cases where mois-
ture-induced deformations give rise to internal stresses and,hence, formally should be treated as a load case.
The present investigation is a refinement to present toolsfor numerical assessment of moisture fluctuations in wood asit presents an implementation of a procedure for determiningmoisture transport and moisture content by use of tempera-ture-dependent sorption characteristics. This is particularlyrelevant for wood members at outdoor covered conditions.The procedure is implemented as an extension to an existingcomputer model (Pedersen 1990a) for moisture and tempera-ture calculations for constructions of hygroscopic materials.
The background ideas for engaging in the present inves-tigation arose in consequence of the following two observa-
©2004 ASHRAE.
Carsten Rode is an associate professor and Christian Odin Clorius is an assistant professor in the Department of Civil Engineering, TechnicalUniversity of Denmark, Lyngby, Denmark.
tions made when using the existing tools for determiningwood moisture content in response to natural climate varia-tions:
• Wood members exposed to variations in the ambient cli-mate air temperature, Tair, and relative humidity, RH,show a damped transient moisture content response. Themagnitude of the damping depends on the value of thepermeability and member thickness. For thick woodmembers, the variation of the transient moisture contentis significantly smaller than the variation of equilibriummoisture content governed by the climate variations.
• Wood members exposed to repeated variations in theambient climate have mean moisture content, which ishigher than the equilibrium moisture content deter-mined, assuming mean value of the ambient climateconditions. The elevated moisture content is due to thewater vapor permeability of wood increasing signifi-cantly with the moisture content. The wooden memberis more permeable and open to moisture uptake at highvalues of ambient RH than it is at low values of ambientRH. Consequently, thick wood members are providedwith a “moisture-trap” function elevating the meanmoisture content.
The damped response in moisture content (MC) of thickmembers is generally known. In practice, however, it is oftenonly tentatively quantified, and structural engineers tend tooverestimate the amplitude of the MC fluctuations. The effectof the shape of the water vapor permeability function, δp(RH),on the long-term mean transient moisture content of wood hasbeen identified in Arfvidsson (1999) and in Clorius and Peder-sen (2003). The effect is not generally recognized, but model-ing shows that the effect is not negligible for thick woodmembers in the Nordic climates.
The modeled long-term mean transient moisture contentfor thick wood members at outdoor covered conditions, suchas presented by Clorius and Pedersen (2003), exhibits smallamplitude in annual MC variation. For recurring exposure toa Danish climate, the modeled amplitude is in the order of lessthan 1% moisture content by weight. This variation is suspi-ciously small, and by any means in the same order as the vari-ation of the sorption characteristic with temperature. Hence,the inclusion of a temperature-dependent sorption character-istic might increase the modeled long-term annual MC ampli-tude. This paper addresses the implementation of suchtemperature-dependent sorption characteristics and tenta-tively tests modeling results against field measurements madein a solid wood roof construction over a two-year period.Furthermore, the paper presents a study of the effect of includ-ing and, respectively, not including hysteresis in combinationwith temperature-dependent sorption characteristic.
MODELING METHOD
Karagiozis (2001) reports on a hygrothermal simulationmodel that includes temperature dependency of the sorptioncurves and mentions that this feature is important when simu-lating wood-based material elements. However, no results ofthis importance seem to be reported in literature. One shouldalso observe the fact that, even if such functionality werepresent, the practical problem of obtaining reliable experi-mental sorption data at temperatures other than 20°C (68°F)remains. However, this paper will present the developmentand use of a model that takes the temperature effect intoaccount. The model will be used to analyze a case of a wood-based structure, and wood is a material for which temperature-dependent sorption data can be found in the literature.
The modeling of moisture content has been performed byuse of an existing computer model for transient calculation ofcombined heat and moisture transport (Pedersen 1990a),which has been modified to take into account the temperaturedependency of the sorption curves of materials. In the presentcontext, the model has the following functionalities:
• Sorption-isotherm can be defined with an adsorptionand desorption branch.
• Hysteresis can be modeled in an empirical way (Peder-sen 1990b).
• A moisture-dependent water vapor permeability can bedefined.
• The model is capable of calculating several moisturetransport forms (e.g., vapor, liquid, and convective).
• The load history can be defined in time series for tem-perature and relative humidity, covering periods of ayear or more with data points in one-hour intervals.
Material data, such as the water vapor permeability ordata for the sorption curves, are entered in the program’s data-base as a list of data points that describe each parameter’sdependency on other parameters. For instance, a sorptioncurve is described as a number of points of type (RH-MC), andthe program makes linear interpolation between them. Withthis approach, more accuracy can be achieved by increasingthe number of data points, and it has the advantage that orig-inal measuring points can be used directly as input for theprogram. Furthermore, it is not dependent on a predefinedfunctional form of the data and, therefore, does not rely on howwell the functional form fits the actual material data.
The model employed is based on finite control volumesand uses an implicit scheme for the numerical solution of thefinite difference equations. However, since the material prop-erties are not constant, the problem is nonlinear, and a certainprocedure needs to be followed to ensure good approximationof the moisture-dependent variables, conservation of mass ofthe overall solution, and speed of calculation:
• The temperature distribution is calculated first in eachtime step. The temperatures are found in a transient way
2 Buildings IX
also using a finite control volume approach and consid-ering solar gain on the external surface, longwave radia-tion to the sky, moisture-dependent thermalconductivities, and latent heat of phase change of mois-ture. The temperature distribution determines the newdistribution of saturation vapor pressures.
• The finite difference equations are set up based on a for-mulation that uses vapor pressure, p, as the determiningvariable. Vapor pressure is the driving force for vapordiffusion according to Fick’s law, and via the slope ofthe sorption curve, ξ, and knowledge of the saturationvapor pressures, ps, in the beginning and end of the timestep, the change of moisture content, u, of each controlvolume can be expressed by changes in relative humid-ity, p/ps. Liquid transport is considered as an explicitsource term found from Darcy’s law using the liquidpressures, Pl, from the previous time step. In differentialform, the equation can be set up as
(1)
The material properties needed are the density, ρ, watervapor permeability, δ, and the slope of the sorption curve,and they are found from the last known relative humidity,ϕ. Also used is the liquid water permeability, K, which isfound at the last known moisture content. A new vaporpressure distribution is found for the whole calculationdomain by solving the set of equations (Equation 1) for allcontrol volumes.
• A similar procedure is used to determine new liquidpressures based on suction curves that give the relation-ship between change of moisture content and change ofliquid pressure. The slope of the suction curve isΞ = ∂u / ∂Pl. Vapor diffusion is calculated as an explicitsource term based on the vapor pressures from the previ-ous time step.
(2)
New liquid pressures are found by solving the set of equa-tions (Equation 2) expressed in liquid pressure.
• The new moisture contents are determined from a conti-nuity equation determining the increment in moisturecontent from Fick’s and Darcy’s laws using the newvapor and liquid pressures.
(3)
where ∂gv and ∂gl are water vapor and liquid fluxes,respectively.
The new relative humidity is found from the new moisturecontent and the sorption curve.
• The model also has provisions for calculating moisturetransport by convection in the form of moisture carriedwith infiltrating air. This feature will not be used in thispaper.
Hysteresis
The program code handles scanning curves by an empir-ical approach using the weighted values of the slope of theadsorption and desorption branch.
(4)
where ξa and ξd are slopes of the sorption curves, or “specificmoisture capacities,” for the adsorption and desorptioncurves, respectively.
When the most recent moisture history—the two preced-ing time steps—shows an increase in MC, the slope of theadsorption scanning is determined by
(5)
where ua and ud are the moisture contents on the adsorptionand desorption curves corresponding to the current relativehumidity, and u is the most recently determined moisturecontent. Correspondingly, the slope of the desorption scan-ning curve is determined by
(6)
This empirical paradigm for modeling hysteresis hasproven to be a well working way to improve the description oftransient sorption processes in materials and is today a stan-dard feature of the program used for this paper. The effect ofthe hysteresis is a reduction of the apparent moisture capacityof a material. Since the scanning curves have a lower slopethan the adsorption and desorption isotherms, the effect will bea larger variation in local vapor pressure when the moisturecontent of a material is varying. Thus, hysteresis is worthwhileconsidering when the short-term dynamic moisture responseof a material is of interest. It may be one of the explanationsof a phenomenon such as “retarded sorption” or “non-Fickian”behavior (Håkansson 1998; Peuhkuri 2003), which is espe-cially observed for organic-based materials. However, whenthe interest is the long-term behavior of a construction part ina building envelope, it may not be relevant to consider theintermediate (daily) variations that result from the scanningcurves, and then the mean curve between adsorption anddesorption can be used (Pedersen 1990b).
The objective of the present paper is not to explore theeffect of changes to the above empirical formulation of hyster-esis; indeed, some investigations (e.g., Goossens [2003])
ρξ ϕ( )
∂p
ps-----⎝ ⎠⎛ ⎞
∂t--------------
∂ δ ϕ( )∂p
new
∂x--------------
⎝ ⎠⎛ ⎞
∂x-----------------------------------
∂ K u( )∂Pl
old
∂x-------------
⎝ ⎠⎜ ⎟⎛ ⎞
∂x----------------------------------- .+=
ρΞ u( )∂ Pl( )
∂t-------------
∂ δ ϕ( )∂p
old
∂x-------------
⎝ ⎠⎛ ⎞
∂x----------------------------------
∂ K u( )∂Pl
new
∂x---------------
⎝ ⎠⎜ ⎟⎛ ⎞
∂x-------------------------------------+=
ρ∂u∂t------
∂gv∂x--------–
∂gl∂x-------–=
ξa∂ua∂ϕ--------= and ξd
∂ud∂ϕ--------=
ξhys ,a
0.1 u ua–( )2ξd u ud–( )
2ξa+
ud ua–( )2
--------------------------------------------------------------------- ,=
ξhys ,d
u ua–( )2ξd 0.1 u ud–( )
2ξa+
ud ua–( )2
--------------------------------------------------------------------- .=
Buildings IX 3
suggest that there is still room for improvement of the coeffi-cients of the model suggested by Equations 5 and 6. The objec-tive of this paper is to investigate the effect of includingtemperature-dependent sorption given the previous choice ofhysteresis formulation.
Temperature-Dependent Sorption Characteristic
The temperature dependency of the sorption characteris-tic is taken into account in the modeling procedure by allowingseveral sorption curves to describe the sorption characteristicsat different temperature levels.
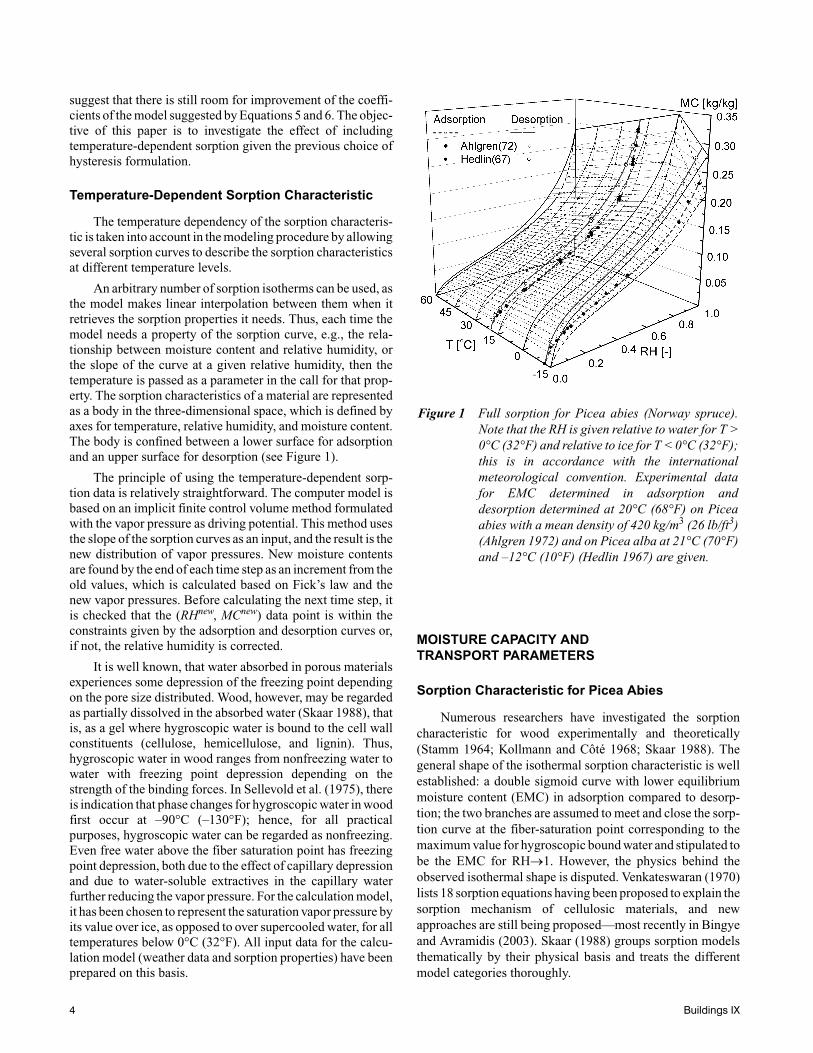
An arbitrary number of sorption isotherms can be used, asthe model makes linear interpolation between them when itretrieves the sorption properties it needs. Thus, each time themodel needs a property of the sorption curve, e.g., the rela-tionship between moisture content and relative humidity, orthe slope of the curve at a given relative humidity, then thetemperature is passed as a parameter in the call for that prop-erty. The sorption characteristics of a material are representedas a body in the three-dimensional space, which is defined byaxes for temperature, relative humidity, and moisture content.The body is confined between a lower surface for adsorptionand an upper surface for desorption (see Figure 1).
The principle of using the temperature-dependent sorp-tion data is relatively straightforward. The computer model isbased on an implicit finite control volume method formulatedwith the vapor pressure as driving potential. This method usesthe slope of the sorption curves as an input, and the result is thenew distribution of vapor pressures. New moisture contentsare found by the end of each time step as an increment from theold values, which is calculated based on Fick’s law and thenew vapor pressures. Before calculating the next time step, itis checked that the (RHnew, MCnew) data point is within theconstraints given by the adsorption and desorption curves or,if not, the relative humidity is corrected.
It is well known, that water absorbed in porous materialsexperiences some depression of the freezing point dependingon the pore size distributed. Wood, however, may be regardedas partially dissolved in the absorbed water (Skaar 1988), thatis, as a gel where hygroscopic water is bound to the cell wallconstituents (cellulose, hemicellulose, and lignin). Thus,hygroscopic water in wood ranges from nonfreezing water towater with freezing point depression depending on thestrength of the binding forces. In Sellevold et al. (1975), thereis indication that phase changes for hygroscopic water in woodfirst occur at –90°C (–130°F); hence, for all practicalpurposes, hygroscopic water can be regarded as nonfreezing.Even free water above the fiber saturation point has freezingpoint depression, both due to the effect of capillary depressionand due to water-soluble extractives in the capillary waterfurther reducing the vapor pressure. For the calculation model,it has been chosen to represent the saturation vapor pressure byits value over ice, as opposed to over supercooled water, for alltemperatures below 0°C (32°F). All input data for the calcu-lation model (weather data and sorption properties) have beenprepared on this basis.
MOISTURE CAPACITY ANDTRANSPORT PARAMETERS
Sorption Characteristic for Picea Abies
Numerous researchers have investigated the sorptioncharacteristic for wood experimentally and theoretically(Stamm 1964; Kollmann and Côté 1968; Skaar 1988). Thegeneral shape of the isothermal sorption characteristic is wellestablished: a double sigmoid curve with lower equilibriummoisture content (EMC) in adsorption compared to desorp-tion; the two branches are assumed to meet and close the sorp-tion curve at the fiber-saturation point corresponding to themaximum value for hygroscopic bound water and stipulated tobe the EMC for RH→1. However, the physics behind theobserved isothermal shape is disputed. Venkateswaran (1970)lists 18 sorption equations having been proposed to explain thesorption mechanism of cellulosic materials, and newapproaches are still being proposed—most recently in Bingyeand Avramidis (2003). Skaar (1988) groups sorption modelsthematically by their physical basis and treats the differentmodel categories thoroughly.
Figure 1 Full sorption for Picea abies (Norway spruce).Note that the RH is given relative to water for T >0°C (32°F) and relative to ice for T < 0°C (32°F);this is in accordance with the internationalmeteorological convention. Experimental datafor EMC determined in adsorption anddesorption determined at 20°C (68°F) on Piceaabies with a mean density of 420 kg/m3 (26 lb/ft3)(Ahlgren 1972) and on Picea alba at 21°C (70°F)and –12°C (10°F) (Hedlin 1967) are given.
4 Buildings IX
The relation between sorption characteristics at differenttemperatures is widely recognized to be explainable by ther-modynamics of sorption via an application of the Clausius-Clapeyron equation to the differential heat of sorption. Thedifferential heat of sorption ∆HS, i.e., difference in energyneeded to vaporize sorbed water and free water, is assumed tobe temperature independent and, at isosteric conditions, obeythe following relation between temperature and activity:
(7)
where R is the ideal gas constant. As the differential heat ofsorption is a positive quantity, a positive temperature incre-ment T2 > T1 will entail that the isosteric MC be reached inequilibrium with a value of the relative humidity RH2 > RH1.Thus, the isobaric EMC decreases for increasing temperature.The Clausius-Clapeyron equation (Equation 7) has beenimplemented in numerous instances, often in a context wherethe integrated differential heat of sorption is determined on thebasis of isosteric readings on two or more isotherms andcompared to calorimetric determinations of the total heat ofwetting, e.g., Strømdahl (2000). Skaar (1988) compiles manyof the reported investigations in a comprehensive collection.Cudinov et al. (1978a, 1978b) use Equation 7 to argue that themaximum value of hygroscopically bound water is obtainedfor T = 0°C (32°F), and that EMC will decrease on both sidesof the freezing point isotherm except for small values of EMC.
In the present context, the theoretical approaches summa-rized above have only been employed as overall guidelines ina more empirical approach for establishing a full sorptionsurface. The strategy for establishing the adsorption anddesorption surfaces has been to use a slender but well-estab-lished empirical basis for isothermal sorption at differenttemperatures and connect these experimental evidences in thethree-dimensional sorption space (T-RH-MC), thus generat-ing the necessary data-set input for the model. In order to getfull use of the available experimental data at isothermal condi-tions, the sorption fit model given in Equation 8 has been used.The model is a slight rewriting of a fit-model originallypresented in Nielsen (1989) and used in a comparative studyof sorption models in Strømdahl (2000). In the originalversion, the model is rationalized in the theoretical frameworkof the BET theory. However, in the present context, it is usednot for its theoretical merits but for its ability to conform to theshape of the empirical data. Hence, the five parameters (P1 –P5) of Equation 8 are to be viewed as pure fit parameters in theprocedure for nonlinear least-squares regression analysis ofdimensionless RH as dependent variable to dimensionless MCas independent variable.
(8)
The setpoint for the sorption surface has been the canon-ical Scandinavian values for the sorption-isotherm for Picea
abies (Norway spruce) (Ahlgren 1972). These data, herequoted from Hansen (1986), were generated at isothermal20°C (68°F) conditions for material with a mean density of420 kg/m3 (26 lb/ft3), a density in proximity to the materialused in the case study. The second set of data originates fromHedlin (1967), where the sorption isotherms for Picea alba atsubfreezing temperature, –12°C (10°F), and at referencetemperature, 21°C (70°F), are presented. It should be recog-nized that the subfreezing isothermal sorption tests by Hedlin(1967) are the largest subfreezing test series for cellulosicmaterials reported in the literature and practically the only oneavailable for wood (see Cudinov et al. [1978a]). From a sorp-tion point of view, Picea alba and Picea abies are expected tobehave similarly, and the data from both species prove to beindiscernible at the reference temperature. Hence, it isassumed that the subfreezing values for Picea alba are validalso for abies. Both sets of experimental data are shown inFigure 1 along with fits by means of Equation 8. Observe thatthough the used fit model is not defined for RH = 1, it has alimit value that is used. At reference 20°C (68°F) conditions,the fits to adsorption and desorption based on data from Hedlin(1967) and Ahlgren (1972) jointly meet in a marginally differ-ent limit value corresponding to a fiber saturation point of 33%moisture content by weight.
At subfreezing conditions, the adsorption and desorptionbranches shown in Figure 1 do not meet in a common fibersaturation point. That this is correct and not due to an error onthe reported data stems from the shift of basis for relativehumidity at T = 0°C (32°F). At above-freezing temperatures,the saturation vapor pressure is determined over a plane watersurface, psat,w, and at subfreezing temperatures, the saturationvapor pressure is determined over a plane surface of ice, psat,i.Shift in saturation pressure base can be expressed aspsat,i = β(T)psat,w, where β(T) < 1. Hence, as hygroscopic waterin wood is nonfreezing, the hygroscopic sorption capacity ofthe material does not reach true fiber saturation when RHi→1.The hygroscopic sorption capacity would first be reached atRHw→1, assuming a boundary condition corresponding tosaturated vapor pressure over supercooled water. Thus, as thesaturation vapor pressure relative to ice, psat,i, is an arbitrarychoice from the point of view of hygroscopic capacity of thewood, the ice basis entails that the isotherm corresponding tobase supercooled water is simply truncated at the value β(T),and the isotherm appears open at RHi→1. At the temperature–12°C (10°F) used in reported subfreezing tests by Hedlin(1967), the water-ice base ratio is β = 0.88.
The use of an ice basis at subfreezing temperatures is byfar the most natural choice, as boundary conditions of vaporover water in a supercooled state will not appear under naturalconditions. However, there is one additional remark to bemade regarding the desorption branch at subfreezing temper-atures: the desorption is a “first desorption” branch onlyreached when the domain is entered from higher temperatures.That is, sorption sites made available at a higher temperaturewill not be reactivated after the first desorption at a lower
HS∆[ ]MC
R T1 T2 RH2 RH1⁄( )ln T2 T1–( )⁄[ ]MC
⋅ ⋅≈
MC1 RH
P1–
1 RH–-----------------------
RHP1 P2×
1 RHP2 P3×
–( )⋅
1 RHP2
–-------------------------------------------------------------------+
⎝ ⎠⎜ ⎟⎛ ⎞ P4 RH⋅
1 P5+ RH⋅-----------------------------=
Buildings IX 5
subfreezing temperature. This is to be seen in analogy with theirreversible loss of sorption sites during first desorption fromgreen state—only the subfreezing first desorption is reversiblewhen reentering the domain again from higher temperature,but irreversibly lost at isothermal conditions. This remarkentails that the sorption surface of Figure 1 should ideally beequipped with an additional desorption surface at subfreezingtemperature for reversible desorption after first desorption.Data for construction of this second and later subfreezingdesorption branch does not exist. Hedlin (1967) “wets” thespecimens after adsorption at a higher temperature anddesorps from this state. Hence, this refinement has not beenimplemented in the program code, and all states between theadsorption and desorption surfaces at subfreezing tempera-tures are allowed. Concerning the case study, the refinement isof minor importance because subfreezing temperatures in theDanish climate are reached only occasionally. However, inmore northern regions with permanent subfreezing tempera-tures, the drying of wood during winter will be morepronounced than predicted from modeling using the sorptionsurfaces of Figure 1.
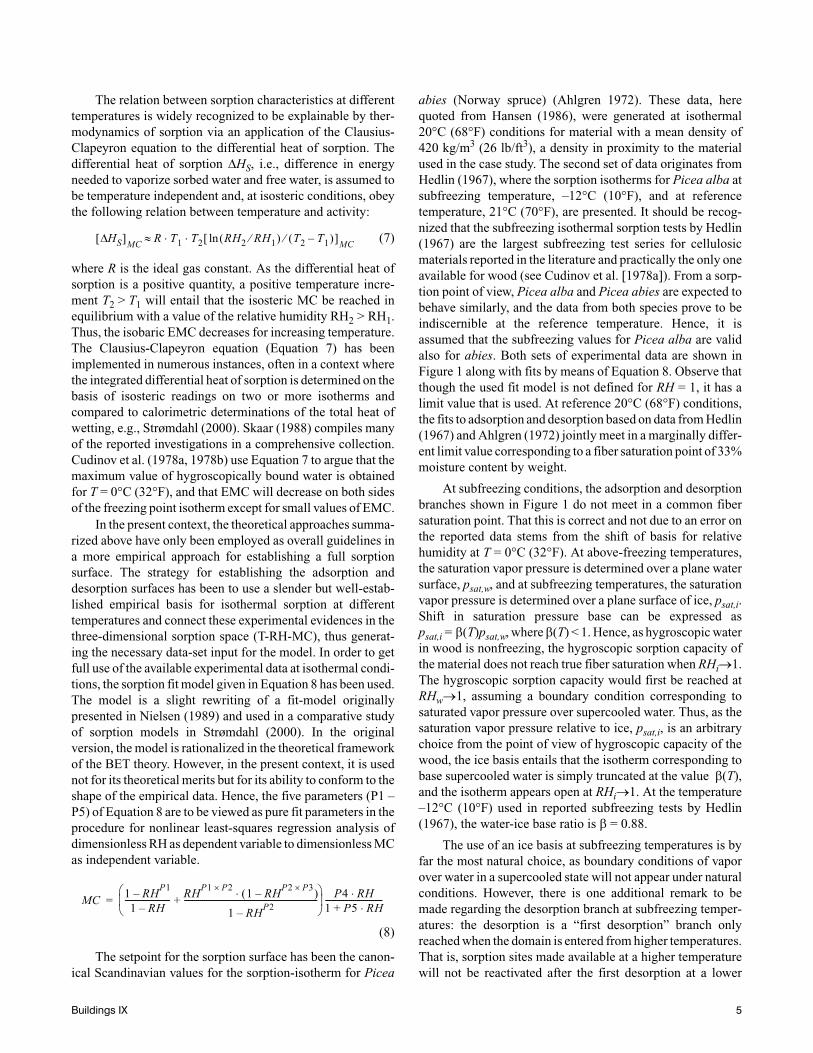
The Hedlin-Ahlgren setpoint data at 20°C (32°F) havebeen given isobaric extensions for all above-freezing temper-atures, as seen in Figure 1. These extensions have been estab-lished by use of the isobar temperature-dependent slopes, α,that can be determined from the adsorption and desorptiondata reported by Kelsey (1956) at four equidistant isothermalconditions between 10°C (50°F) and 55°C (131°F). Thoughmore investigations of temperature dependency of sorptionabove-freezing temperature exist, the data from (Kelsey 1956)are the most consistent and comprehensive. The tested mate-rial was Araucaria klinkii Lauterb. (Klinki pine). The isobarictemperature-dependent slopes, α, are notwithstanding applieddirectly to the Picea abies sorption surface. The compilingprocedure consists of individual sorption fits by use of Equa-tion 8 to each of the eight series of adsorption and desorptiondata. RH-equidistant fit-values for each of the four isothermalconditions are plotted with RH increments of 2.5% in a T-MCdiagram, as shown in Figure 2. In this diagram, a linear regres-sion procedure with temperature as an independent variable isemployed to generate the isobars. The data yield graduallydecreasing isobar slopes and comply to the linear regressionwith coefficients of determination r2 in excess of 0.99 exceptfor the isobars at RH > 0.875. It is observed that the Clausius-Clapeyron equation is fulfilled by isosteric readings of(RH,T)-data sets in Figure 2.
The trend in the data from Kelsey (1956) for near-fibersaturation shows an approximate 0.1% decrease in MC byweight pr. 10°C (18°F) temperature increase. This corre-sponds to an above-freezing trend reported by Stamm andLoughborough (1935) and others (see, e.g., Skaar [1988]).Most handbook values for temperature dependency follow thesame trend, e.g., Forest Products Society (1999). The experi-mental results presented by Drewes (1985) confirm the obser-vation made from Figure 2 that the slope of the temperature
dependency decreases for decreasing RH. The sorptionsurfaces in Figure 1 have been finalized by use of the isobarslopes of Figure 2 and a corresponding diagram generated foradsorption. The trace of the setpoint data at reference temper-ature in T = 0°C (32°F) is linearly connected to the Hedlin(1967) data in –12°C (10°F) and given a modest extrapolationto –15°C (5°F). The surface has not been extended beyond60°C (140°F), as initiating plasticization of the cell wallconstituents might change the sorption behavior at hightemperatures (Stamm 1964) and render further linear extrap-olation invalid.
Water Vapor Transport Characteristic
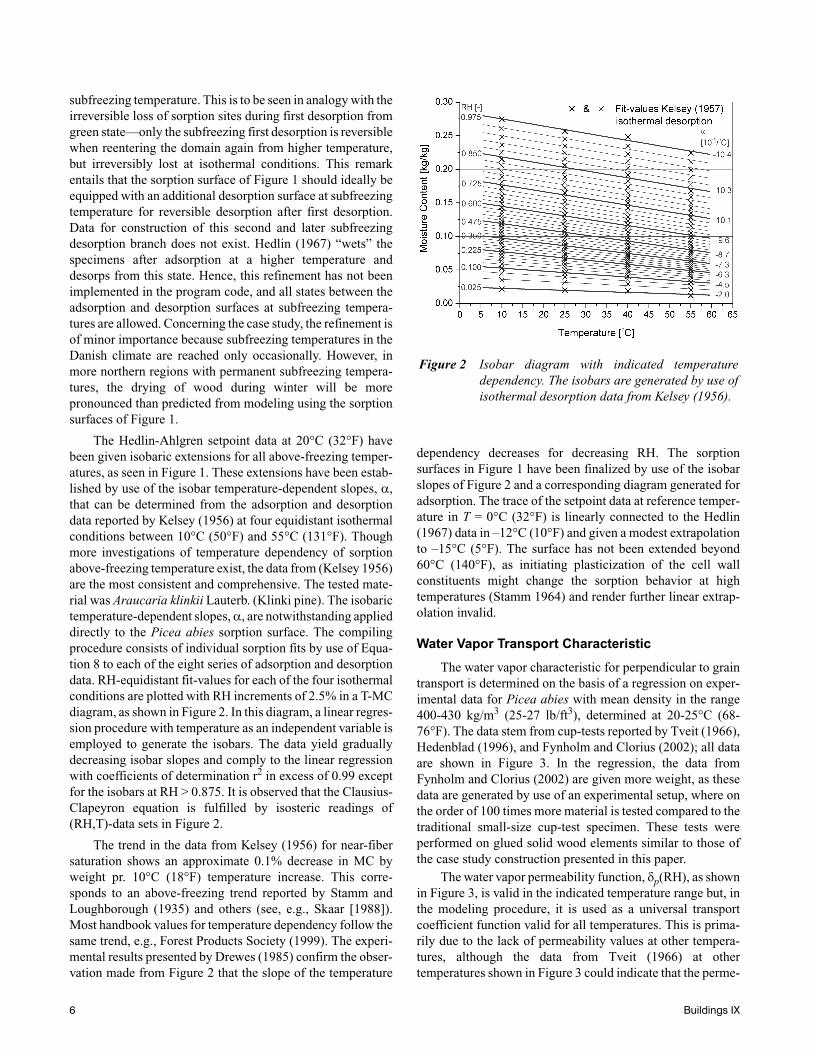
The water vapor characteristic for perpendicular to graintransport is determined on the basis of a regression on exper-imental data for Picea abies with mean density in the range400-430 kg/m3 (25-27 lb/ft3), determined at 20-25°C (68-76°F). The data stem from cup-tests reported by Tveit (1966),Hedenblad (1996), and Fynholm and Clorius (2002); all dataare shown in Figure 3. In the regression, the data fromFynholm and Clorius (2002) are given more weight, as thesedata are generated by use of an experimental setup, where onthe order of 100 times more material is tested compared to thetraditional small-size cup-test specimen. These tests wereperformed on glued solid wood elements similar to those ofthe case study construction presented in this paper.
The water vapor permeability function, δp(RH), as shownin Figure 3, is valid in the indicated temperature range but, inthe modeling procedure, it is used as a universal transportcoefficient function valid for all temperatures. This is prima-rily due to the lack of permeability values at other tempera-tures, although the data from Tveit (1966) at othertemperatures shown in Figure 3 could indicate that the perme-
Figure 2 Isobar diagram with indicated temperaturedependency. The isobars are generated by use ofisothermal desorption data from Kelsey (1956).
6 Buildings IX
ability decreases with temperature. However, with a lack offurther knowledge, the outlined procedure with a temperature-independent permeability characteristic is chosen.
With regard to the problems of diffusion as such, it isnoted that many of the abnormalities observed and attributedto “non-Fickian” behavior can be explained if the traditionalFickian diffusion model is replaced by the “double” Fickianmodel established by Krabbenhøft (2003). His model operateswith parallel diffusion of water vapor and diffusion of cell wallbound water and includes the velocity of sorption and itsdependency of moisture increment step size and degree ofsaturation. This model put forward in Krabbenhøft (2003) isvery convincing in its ability to model the diffusion abnormal-ities observed by Wadsö (1993). Within this paper, however,the diffusion model is more traditional, and the focus is prima-
rily the effect of a temperature-dependent sorption character-istic.
SOLID WOOD CASE STUDY CONSTRUCTION
Construction and Field Measuring
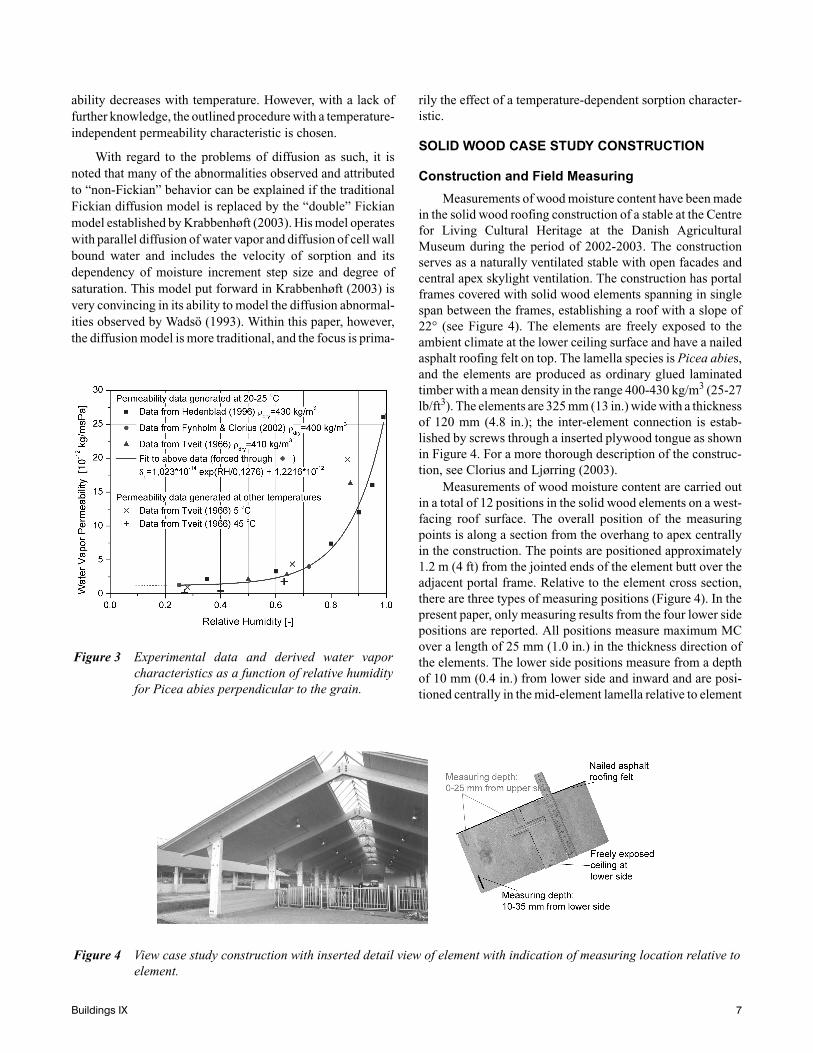
Measurements of wood moisture content have been madein the solid wood roofing construction of a stable at the Centrefor Living Cultural Heritage at the Danish AgriculturalMuseum during the period of 2002-2003. The constructionserves as a naturally ventilated stable with open facades andcentral apex skylight ventilation. The construction has portalframes covered with solid wood elements spanning in singlespan between the frames, establishing a roof with a slope of22° (see Figure 4). The elements are freely exposed to theambient climate at the lower ceiling surface and have a nailedasphalt roofing felt on top. The lamella species is Picea abies,and the elements are produced as ordinary glued laminatedtimber with a mean density in the range 400-430 kg/m3 (25-27lb/ft3). The elements are 325 mm (13 in.) wide with a thicknessof 120 mm (4.8 in.); the inter-element connection is estab-lished by screws through a inserted plywood tongue as shownin Figure 4. For a more thorough description of the construc-tion, see Clorius and Ljørring (2003).
Measurements of wood moisture content are carried outin a total of 12 positions in the solid wood elements on a west-facing roof surface. The overall position of the measuringpoints is along a section from the overhang to apex centrallyin the construction. The points are positioned approximately1.2 m (4 ft) from the jointed ends of the element butt over theadjacent portal frame. Relative to the element cross section,there are three types of measuring positions (Figure 4). In thepresent paper, only measuring results from the four lower sidepositions are reported. All positions measure maximum MCover a length of 25 mm (1.0 in.) in the thickness direction ofthe elements. The lower side positions measure from a depthof 10 mm (0.4 in.) from lower side and inward and are posi-tioned centrally in the mid-element lamella relative to element
Figure 3 Experimental data and derived water vaporcharacteristics as a function of relative humidityfor Picea abies perpendicular to the grain.
Figure 4 View case study construction with inserted detail view of element with indication of measuring location relative toelement.
Buildings IX 7
W2.8+ )
2
⎠⎞
---------------------------
width (Figure 4). The reported measurements are intended tomeasure MC in a region where moisture transport is domi-nated by diffusion through the element in the transverse direc-tion of the wood.
Measuring Method and Calibration Corrections
The measuring method employed is based on the tradi-tional resistance-type moisture content meter method. Themeasuring system uses permanently inserted stainless-steelscrews as electrodes at the measuring positions. The elec-trodes were inserted via 16 mm holes drilled from theelement’s upper side to the prescribed depth. As this procedureincurs some inaccuracy and as the electrode-screw unwill-ingly can have been countersunk in the insertion process, thenominal measuring depths given in Figure 4 should probablybe given an uncertainty of ±5 mm. Attention is drawn to thefact that the electrodes have a finite extension in the directionof the moisture gradient (25 mm) (1.0 in.), and resistance-typemeasuring always gives the highest value of MC in the regionbetween the uninsulated electrodes. Hence, the measuredvalues are maximum MC values obtained in a region with atleast 25 mm (1.0 in.) extension in the gradient direction, andthe position of the maximum value is not necessarily the samethroughout a season.
To avoid intrusion of water and water vapor through theinsertion holes, these were carefully filled with silicone seal-ant after electrode insertion. The disturbance of the moisturetransport field above the measuring point due to the sealant-filled hole is assessed to be of minor importance as the perme-ability to moisture transport velocity in the longitudinal direc-tion is approximately 20 times higher than the permeability inthe transverse direction, and, hence, the construction is easilyable to remedy the moisture field disturbance incurred by thehole. The electrode distance is approximately 30 mm—thisdistance is, however, of vanishing importance to the measuredMC (Forsén and Tarvainen 2000). Standard power cables wereused to connect electrodes and a central terminal box. Bananaplugs connected to the external socket of the meter providedthe interface between moisture meter and terminal box. Thislatter interface is a standard interface for many meters withexternal hammer electrodes.
In all instances but a few, measuring is performed on aweekly basis on Friday morning between 8:00 and 9:00 a.m.For the reported measuring period, two different moisturemeters were used—during the first year, a meter with twosignificant digits and, in the second year, an apparatus withthree significant digits were used. Both moisture meters wereamong the ones tested in Forsén and Tarvainen (2000). Thesetting of the meters was with respect to temperature 20°C(68°F), irrespective of wood temperature. This minimizesfaults in the measuring process and, of course, requires post-measuring correction for wood temperature. The species’setting was chosen to be the best offered but is of no majorimportance, as the meters were calibrated against referencecalibration device with six fixed resistances in the range from
10,000 MOhm to 1.8 MOhm, covering the range 10% to26.3% moisture content by weight for Picea abies. Thedeclared maximum deviation of the fixed resistances is ±2%,and the calibration box used is subjected to external calibra-tion on a regular basis. It is stressed that MC readings in excessof 27% tend to be unstable, or at least not necessarily follow-ing the calibration curve used. This is so as the resistance forhigh MC becomes very low in the order 1 MOhm, and thestability of the accuracy of the meters is not to be trusted inthese ranges without careful meter-individual calibration—preferably including electrodes. Such refined calibration hasnot been performed for the meters and electrode used. Forsénand Tarvainen (2000) are even more conservative with respectto apparatus precision at high MC levels and set an upper limitof 24% MC for a 95% confidence interval within ±1.5% mois-ture content by weight for well-conditioned material.
The species calibration by use of the reference box resis-tance, R in MOhm, is the Scandinavian standard calibrationcurve for moisture-dependent resistance in Picea abies ofNordic provenience:
(9)
The temperature correction employed is like the standardcorrection curve used in Scandinavia, given in Equation 10.The correction requires a device setpoint of 20°C (68°F) andwood temperature input in degree Celsius.
(10)
Both the species and temperature calibration formulaoriginate in their latest version from Samuelsson (1990) (foran English version, see Samuelsson [1992]) and are confirmedby the testing performed in Forsén and Tarvainen (2000).
Measuring Results
The field-measured values for wood moisture content—calibrated to correct species by Equation 9 and corrected fortemperature by Equation 10—are shown in Figure 5.
The temperature adjustment is made by use of woodtemperatures generated in the modeling process by use ofactual local climatic data. For all practical purposes, the morn-ing wood temperatures used for the reported lower sidemeasuring points are the same as the simultaneous air temper-ature. The overall shape of the annual MC oscillation followsthe anticipated trend—dry in summer, wet in winter. Themeasured values in excess of 27% MC by weight should notbe interpreted directly as the actual MC due to the mentionedinstability of the resistance meters for very low resistances. Itis, however, striking that even at these high measured valuesthe weekly oscillation pattern is congruent for all four measur-ing points.
ln R( ) 27.18 exp 0.0852– MCMeasured,TW
20C=⋅( )⋅ 2.30–=
MCTemp. Corrected
MCMeasured, setpoint T
W20C=
0.567 0.0260–+ TW
2.8+( )⋅ 0.000051+ T(⋅⎝⎛
0.881 1.0056( )TW
2.8+( )⋅
⎝ ⎠⎜ ⎟⎛ ⎞
----------------------------------------------------------------------------------------------------------------------------------------------------------------------------------------------------------------=
8 Buildings IX
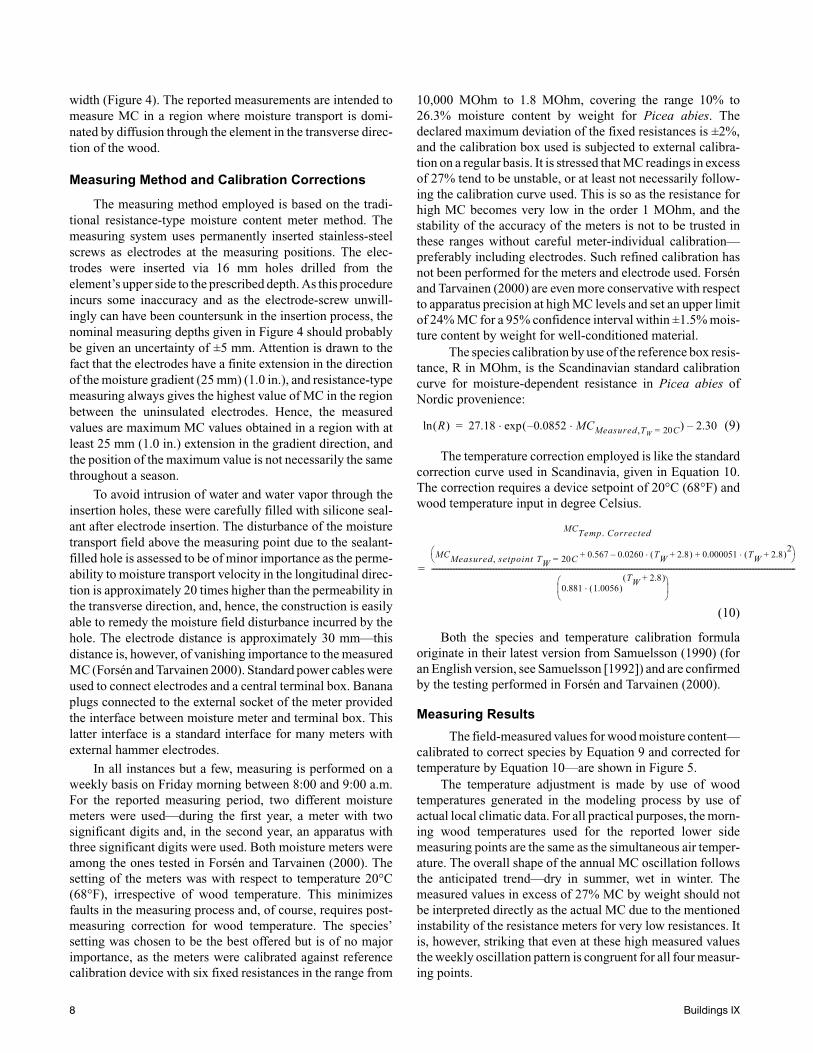
From Figure 5 it is observed that the measuring point withthe highest winter value (position 12) has the lowest summerreadings, whereas the measuring point with the lowest wintervalue (position 2) has the highest summer value. This indicatesthat the electrodes in the different points lie in slightly differ-ent distances from the exposed lower element surface. This isso as the measuring position closer to the exposed surface willexperience larger annual MC amplitude compared to positionscloser to the element center where the amplitude is smallest.
MODELING PROCEDURE
General Settings
The roof over the stable was modeled with the computermodel presented previously. The model makes hourly calcu-lations of the roof, which is exposed to the outdoor climate.On top of the roof is a black asphalt roof membrane, which isassumed to be vapor tight. The roof has a 22° slope facingwest. The computer model makes a detailed calculation of theroof temperature given a solar absorptance of the roofmembrane of 0.93 and a longwave emissivity of 0.90. Theconvective heat transfer coefficient was calculated as a func-tion of the outdoor wind speed. The underside of the roof wasexposed to the same air temperature and humidity as that ofthe outside air, i.e., it was assumed that the livestock did notaffect the climate in the open stable. The heat transfer coef-ficient of the lower surface of the roof was modeled as aconstant 25 W/(m²·K) (4.4 Btu/[h·ft2·°F]), and the vaportransfer coefficient was 6.3·10-8 kg/(Pa·m2·s) (1090 perm).
The solid wood of the roof was represented by 35 controlvolumes of thickness, from 1 to 15 mm (0.04 in. to 0.60 in.).The control volumes were distributed such that they corre-sponded with the locations of the moisture sensors in the roof.Due to a lack of material data for liquid moisture transport, andbecause the conditions in the stable roof were mainly in thehygroscopic region, liquid moisture transport was not consid-ered explicitly in this analysis. However, the enhanced watervapor permeability at high relative humidity can be seen assome liquid coupled effects of the water, which is absorbed inthe wood, and the enhanced vapor permeability was a part ofthe analysis.
The calculations were carried out with consideration oflatent heat of phase change of moisture, which, even forchanges of moisture content in the hygroscopic region,involves some small thermal effects.
Two calculation series were carried out for the roof inves-tigated:
1. The first series was run for the roof exposed to the designreference year for Denmark. The purpose was to test theeffect of using the different variations of the sorption modelin the transient heat and moisture calculation tool. Theresults for the last of ten consecutive years with identicalexposure were used for analysis, i.e., after quasi-steadyconditions were attained. The initial condition was an evendistribution of a moisture content of 17.5 weight-%.
Four variations of sorption models were analyzed in thestudy:
• With temperature-dependent sorption curves andhysteresis.
• With temperature-dependent sorption curves with-out hysteresis. The average between the adsortionand desorption curves was used.
• Without temperature-dependent sorption curves butwith hysteresis. The sorption curve for 20°C (68°F)was used.
• Without temperature-dependent sorption curves andwithout hysteresis.
2. The second series was run with actual weather data for theyears 2002-2003 for a weather station 20 km (12 miles)from the position of the case study object. The weather datawere provided by the Danish Meteorological Institute andcomprised hourly values for outdoor air temperature, dewpoint, solar radiation, wind speed, and cloud index. Thepurpose of this series was to compare against measuredmoisture contents from the actual roof for the same twoyears and to draw some conclusions on the moisture perfor-mance of this kind of solid wood construction. The initialmoisture content was 20 weight-% as this was measured bythe moisture sensors for the beginning. Only the new sorp-tion model with temperature-dependent sorption curvesand hysteresis was used for this calculation.
Figure 5 Experimentally measured MC values at the fourinstrumented lower positions of the roof of thecase study construction (Figure 4); all measuredvalues from the weekly measuring scheme areshown except measurements where values inexcess of 40% by weight are truncated by thechosen scale of the diagram.
Buildings IX 9
MODELING RESULTS AND DISCUSSION
Analysis of Sorption Models
Results are presented for the moisture content, relativehumidity, and trajectories followed in the sorption diagram—both the conventional two-dimensional sorption diagram(RH-MC) and in the three-dimensional sorption space (T-RH-MC). The calculations have been carried out with hourly timesteps. However, in order to avoid the scatter of hourly varia-tions, the results are presented in Figures 6 and 7 as daily meanvalues.
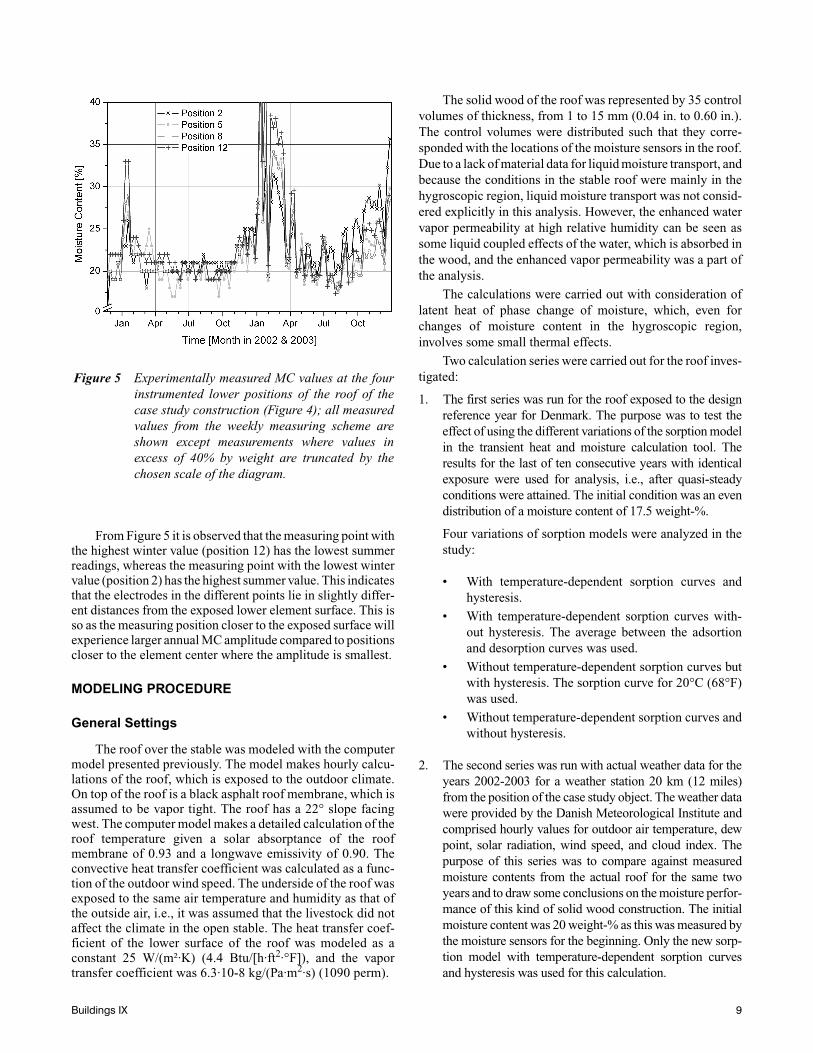
Figure 6 shows the moisture content during the tenth yearof calculation for the top 25 mm (1 in.) of the roof just belowthe asphalt roof membrane and for the bottom 10 mm (0.4 in.)exposed to the exterior climate. The moisture contents in thetop are the dashed lines, which are relatively constant around14 weight-% moisture. That the moisture content does notvary much can be explained by the tight asphalt roofing feltthat comes directly over this part of the wood and the ratherlarge thickness (around 100 mm, 4 in.) of wood that separatesthis layer from the open surface below. The result is more orless the same for all four sorption models, albeit with a smalltendency that the results for the models with temperature-dependent sorption have slightly lower values.
The moisture contents in the bottom of the roof are shownwith the solid lines. They show substantial seasonal variation,which is quite natural, as the climate is drier in summer and theopen bottom of the roof allows moisture to escape in summerwhile it is easily adsorbed in winter. In this case, the moisturecontent tends to be higher by almost 2 weight-% in winter
when the temperature-dependent sorption model is used. Ineither case, there seems to be only a small influence whenhysteresis is considered, and then the results with the hyster-esis model tend to have the highest moisture contents.
Generally, the moisture content in the top of the roof isdrier than in the bottom. A probable reason is the solar heatingof the top of the roof, which would cause a lower relativehumidity and thereby a lower moisture content in the warm toppart of the roof.
Though the maximum values of moisture content exhibitsubstantial variation with sorption model employed, the effecton the mean moisture content throughout the whole crosssection is less pronounced. In broad terms, the effect of includ-ing temperature-dependent sorption is a 10% increase of theannual amplitude of the moisture content fluctuation whencompared with the models assuming isothermal sorption.Likewise, the effect of including hysteresis in the modelsreduces the annual amplitude in mean moisture content by10%.
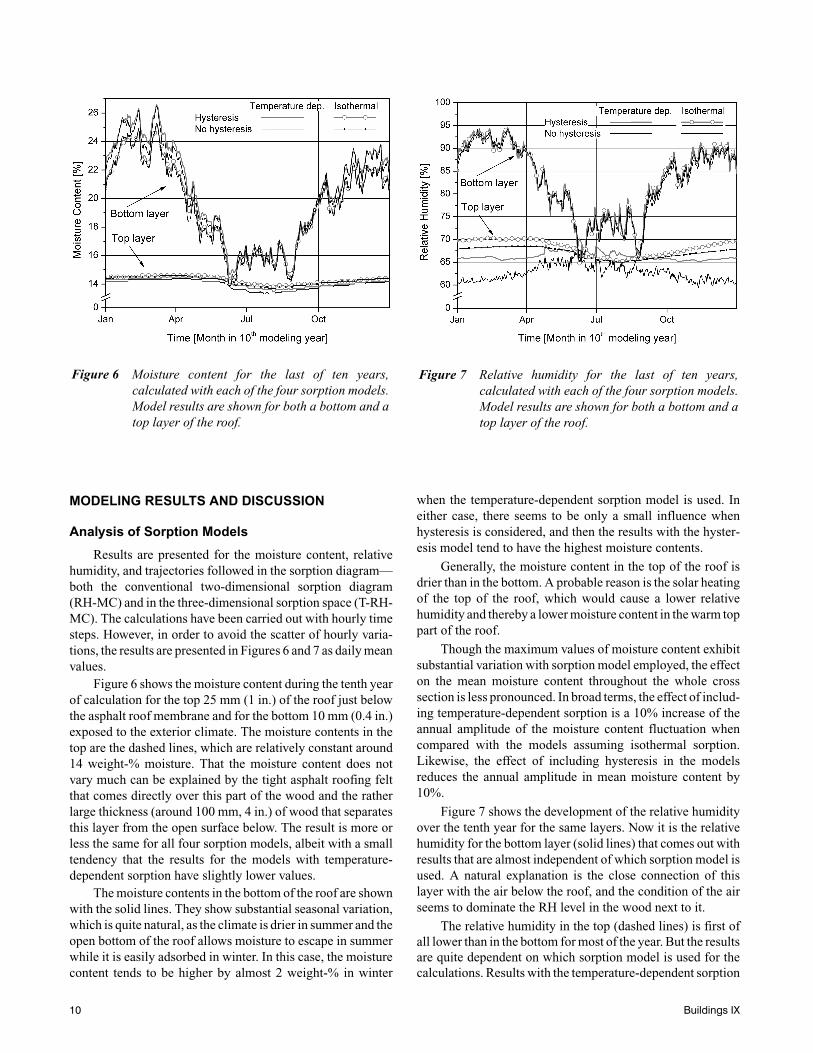
Figure 7 shows the development of the relative humidityover the tenth year for the same layers. Now it is the relativehumidity for the bottom layer (solid lines) that comes out withresults that are almost independent of which sorption model isused. A natural explanation is the close connection of thislayer with the air below the roof, and the condition of the airseems to dominate the RH level in the wood next to it.
The relative humidity in the top (dashed lines) is first ofall lower than in the bottom for most of the year. But the resultsare quite dependent on which sorption model is used for thecalculations. Results with the temperature-dependent sorption
Figure 6 Moisture content for the last of ten years,calculated with each of the four sorption models.Model results are shown for both a bottom and atop layer of the roof.
Figure 7 Relative humidity for the last of ten years,calculated with each of the four sorption models.Model results are shown for both a bottom and atop layer of the roof.
10 Buildings IX
model are lower than the results from using the 20°C (68°F)sorption isotherm. And the results calculated with the hyster-esis model are higher than those for the model that uses anaverage sorption curve between adsorption and desorption.Differences are up to 10% RH and largest in winter.
Recognizing that the relative humidity in the top layer isprimarily governed by the moisture content of the wood, as thelayer is encapsulated between the vapor-tight asphaltmembrane and the 100 mm (4 in.) solid wood below, a heuris-tic interpretation of the observations can be made along thefollowing lines. The top layer MC by weight increases in theorder of 1% from summer to winter, practically irrespective ofsorption model (Figure 6). The relative humidity for the twoisothermal sorption models is close during the summer.However, the model with hysteresis generates higher woodrelative humidity than the model without hysteresis duringwinter. This is a direct consequence of the modeling assump-tion: an equal change in moisture content in either of the twomodels ∆MCNo Hys = ∆MCHys corresponds to different changesin relative humidity ∆RHNo Hys < ∆RHHys. The same simpleinterpretation cannot be made between the two temperature-dependent sorption models. However, in a comparisonbetween the temperature-dependent models and the isother-mal models, it is obvious that the increase in MC during winteris overridden by the increase in moisture capacity for lowtemperatures for the temperature-dependent models. Thus, analmost constant relative humidity is seen for the temperature-dependent model with hysteresis, and a decrease in wood rela-tive humidity from summer to winter is seen in the tempera-ture-dependent model without hysteresis.
A sensitivity analysis was carried out to investigate theimportance of the moisture content in the wood of the surfacecoefficients for heat and vapor transfer beneath the roof. Thevalues were still kept constant but either at twice or half thevalues mentioned in the section, “Modeling Procedure,General Settings.” The effect was a change in moisture contentof around 0.2% by weight for the wood layers near the bottomsurface, while it was hardly noticeable for the layers below theroof membrane. Thus, the convective heat and mass transfercoefficients have only minor importance on the moisturecondition of the wood.
Likewise, it was attempted to see the result of neglectingthe solar and longwave radiation exchanges at the top surface.Without solar gain, the moisture content of the wood justbelow the roof membrane increased by about 10% by weight,while the effect was very small for the layers near the lowersurface (around 0.25% by weight). If the longwave sky radi-ation was also cut off (still with no solar radiation), the roofsurface experienced no undercooling compared to the ambi-ent, and this resulted in an increase in moisture content byabout 8% by weight just below the roof membrane comparedto the situation with both solar gain and longwave radiation. Soclearly the overheating by the sun and undercooling by skyradiation has an effect on the moisture buildup or removalbelow the roof membrane.
With knowledge of the daily average values of relativehumidity and moisture content, it is possible to plot the (RH,
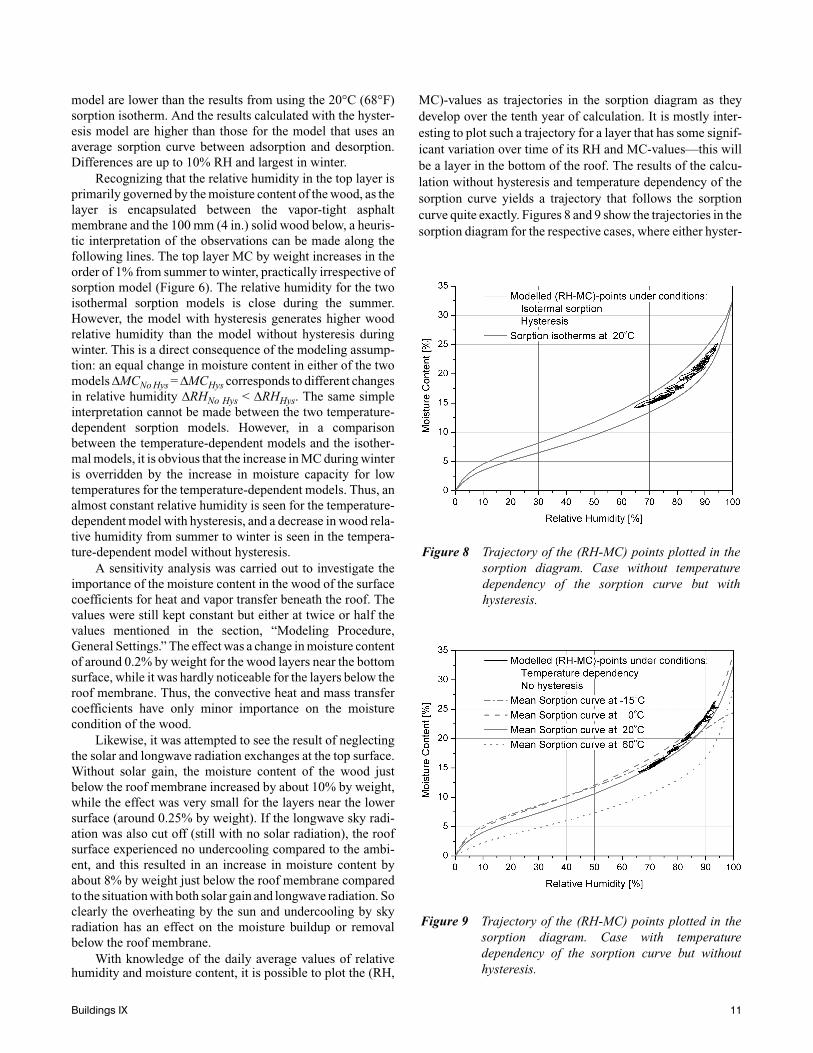
MC)-values as trajectories in the sorption diagram as theydevelop over the tenth year of calculation. It is mostly inter-esting to plot such a trajectory for a layer that has some signif-icant variation over time of its RH and MC-values—this willbe a layer in the bottom of the roof. The results of the calcu-lation without hysteresis and temperature dependency of thesorption curve yields a trajectory that follows the sorptioncurve quite exactly. Figures 8 and 9 show the trajectories in thesorption diagram for the respective cases, where either hyster-
Figure 8 Trajectory of the (RH-MC) points plotted in thesorption diagram. Case without temperaturedependency of the sorption curve but withhysteresis.
Figure 9 Trajectory of the (RH-MC) points plotted in thesorption diagram. Case with temperaturedependency of the sorption curve but withouthysteresis.
Buildings IX 11
esis or temperature dependency of the sorption curve havebeen taken into account in the model.
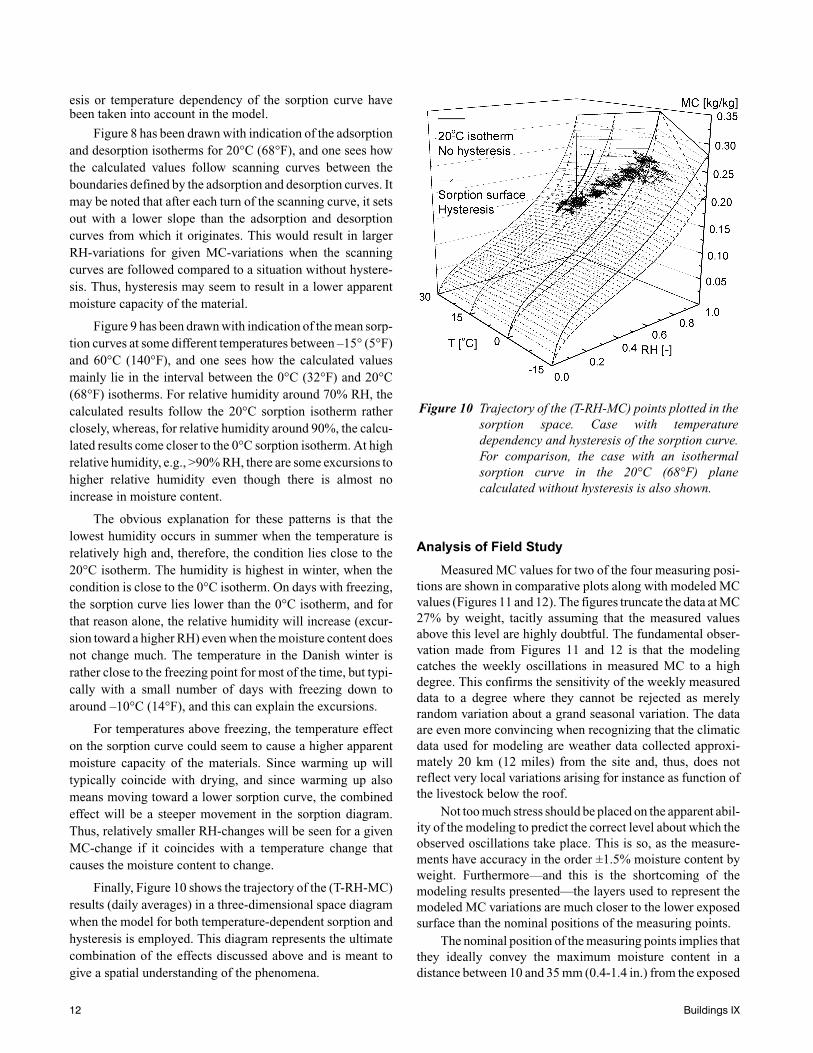
Figure 8 has been drawn with indication of the adsorptionand desorption isotherms for 20°C (68°F), and one sees howthe calculated values follow scanning curves between theboundaries defined by the adsorption and desorption curves. Itmay be noted that after each turn of the scanning curve, it setsout with a lower slope than the adsorption and desorptioncurves from which it originates. This would result in largerRH-variations for given MC-variations when the scanningcurves are followed compared to a situation without hystere-sis. Thus, hysteresis may seem to result in a lower apparentmoisture capacity of the material.
Figure 9 has been drawn with indication of the mean sorp-tion curves at some different temperatures between –15° (5°F)and 60°C (140°F), and one sees how the calculated valuesmainly lie in the interval between the 0°C (32°F) and 20°C(68°F) isotherms. For relative humidity around 70% RH, thecalculated results follow the 20°C sorption isotherm ratherclosely, whereas, for relative humidity around 90%, the calcu-lated results come closer to the 0°C sorption isotherm. At highrelative humidity, e.g., >90% RH, there are some excursions tohigher relative humidity even though there is almost noincrease in moisture content.
The obvious explanation for these patterns is that thelowest humidity occurs in summer when the temperature isrelatively high and, therefore, the condition lies close to the20°C isotherm. The humidity is highest in winter, when thecondition is close to the 0°C isotherm. On days with freezing,the sorption curve lies lower than the 0°C isotherm, and forthat reason alone, the relative humidity will increase (excur-sion toward a higher RH) even when the moisture content doesnot change much. The temperature in the Danish winter israther close to the freezing point for most of the time, but typi-cally with a small number of days with freezing down toaround –10°C (14°F), and this can explain the excursions.
For temperatures above freezing, the temperature effecton the sorption curve could seem to cause a higher apparentmoisture capacity of the materials. Since warming up willtypically coincide with drying, and since warming up alsomeans moving toward a lower sorption curve, the combinedeffect will be a steeper movement in the sorption diagram.Thus, relatively smaller RH-changes will be seen for a givenMC-change if it coincides with a temperature change thatcauses the moisture content to change.
Finally, Figure 10 shows the trajectory of the (T-RH-MC)results (daily averages) in a three-dimensional space diagramwhen the model for both temperature-dependent sorption andhysteresis is employed. This diagram represents the ultimatecombination of the effects discussed above and is meant togive a spatial understanding of the phenomena.
Analysis of Field Study
Measured MC values for two of the four measuring posi-tions are shown in comparative plots along with modeled MCvalues (Figures 11 and 12). The figures truncate the data at MC27% by weight, tacitly assuming that the measured valuesabove this level are highly doubtful. The fundamental obser-vation made from Figures 11 and 12 is that the modelingcatches the weekly oscillations in measured MC to a highdegree. This confirms the sensitivity of the weekly measureddata to a degree where they cannot be rejected as merelyrandom variation about a grand seasonal variation. The dataare even more convincing when recognizing that the climaticdata used for modeling are weather data collected approxi-mately 20 km (12 miles) from the site and, thus, does notreflect very local variations arising for instance as function ofthe livestock below the roof.
Not too much stress should be placed on the apparent abil-ity of the modeling to predict the correct level about which theobserved oscillations take place. This is so, as the measure-ments have accuracy in the order ±1.5% moisture content byweight. Furthermore—and this is the shortcoming of themodeling results presented—the layers used to represent themodeled MC variations are much closer to the lower exposedsurface than the nominal positions of the measuring points.
The nominal position of the measuring points implies thatthey ideally convey the maximum moisture content in adistance between 10 and 35 mm (0.4-1.4 in.) from the exposed
Figure 10 Trajectory of the (T-RH-MC) points plotted in thesorption space. Case with temperaturedependency and hysteresis of the sorption curve.For comparison, the case with an isothermalsorption curve in the 20°C (68°F) planecalculated without hysteresis is also shown.
12 Buildings IX
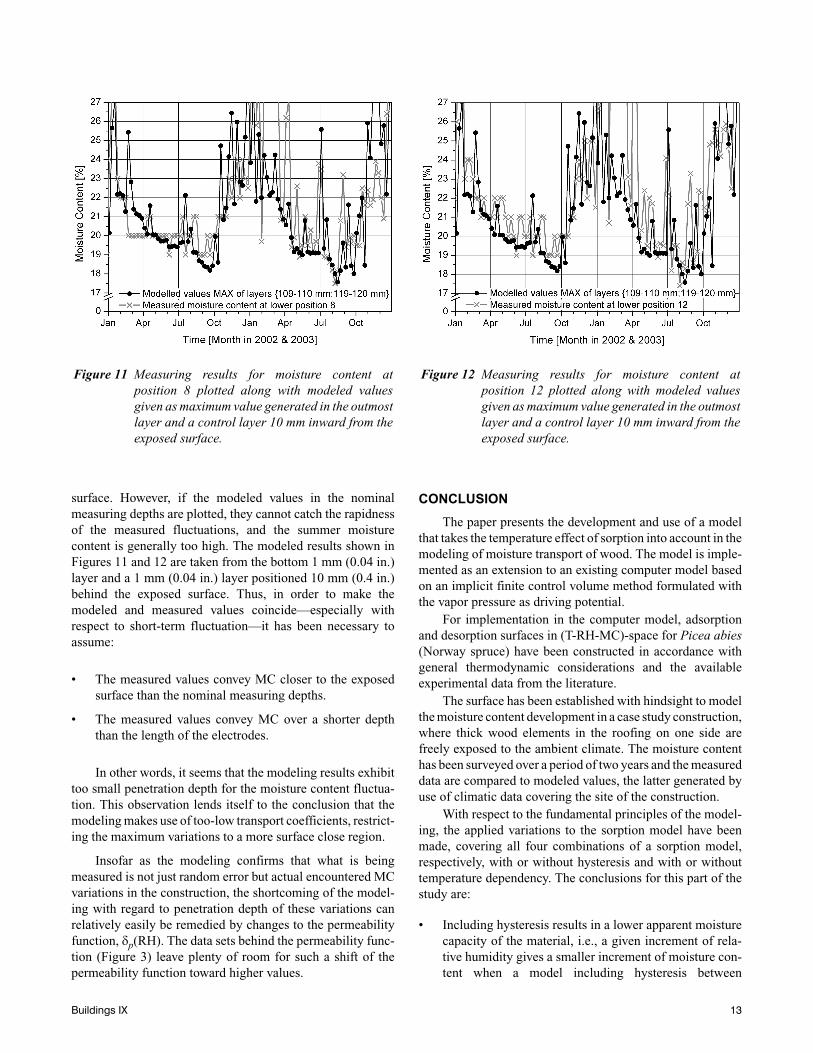
surface. However, if the modeled values in the nominalmeasuring depths are plotted, they cannot catch the rapidnessof the measured fluctuations, and the summer moisturecontent is generally too high. The modeled results shown inFigures 11 and 12 are taken from the bottom 1 mm (0.04 in.)layer and a 1 mm (0.04 in.) layer positioned 10 mm (0.4 in.)behind the exposed surface. Thus, in order to make themodeled and measured values coincide—especially withrespect to short-term fluctuation—it has been necessary toassume:
• The measured values convey MC closer to the exposedsurface than the nominal measuring depths.
• The measured values convey MC over a shorter depththan the length of the electrodes.
In other words, it seems that the modeling results exhibittoo small penetration depth for the moisture content fluctua-tion. This observation lends itself to the conclusion that themodeling makes use of too-low transport coefficients, restrict-ing the maximum variations to a more surface close region.
Insofar as the modeling confirms that what is beingmeasured is not just random error but actual encountered MCvariations in the construction, the shortcoming of the model-ing with regard to penetration depth of these variations canrelatively easily be remedied by changes to the permeabilityfunction, δp(RH). The data sets behind the permeability func-tion (Figure 3) leave plenty of room for such a shift of thepermeability function toward higher values.
CONCLUSION
The paper presents the development and use of a modelthat takes the temperature effect of sorption into account in themodeling of moisture transport of wood. The model is imple-mented as an extension to an existing computer model basedon an implicit finite control volume method formulated withthe vapor pressure as driving potential.
For implementation in the computer model, adsorptionand desorption surfaces in (T-RH-MC)-space for Picea abies(Norway spruce) have been constructed in accordance withgeneral thermodynamic considerations and the availableexperimental data from the literature.
The surface has been established with hindsight to modelthe moisture content development in a case study construction,where thick wood elements in the roofing on one side arefreely exposed to the ambient climate. The moisture contenthas been surveyed over a period of two years and the measureddata are compared to modeled values, the latter generated byuse of climatic data covering the site of the construction.
With respect to the fundamental principles of the model-ing, the applied variations to the sorption model have beenmade, covering all four combinations of a sorption model,respectively, with or without hysteresis and with or withouttemperature dependency. The conclusions for this part of thestudy are:
• Including hysteresis results in a lower apparent moisturecapacity of the material, i.e., a given increment of rela-tive humidity gives a smaller increment of moisture con-tent when a model including hysteresis between
Figure 11 Measuring results for moisture content atposition 8 plotted along with modeled valuesgiven as maximum value generated in the outmostlayer and a control layer 10 mm inward from theexposed surface.
Figure 12 Measuring results for moisture content atposition 12 plotted along with modeled valuesgiven as maximum value generated in the outmostlayer and a control layer 10 mm inward from theexposed surface.
Buildings IX 13
adsorption and desorption is compared to a model usinga mean value of the adsorption and desorption branchesto express the sorption characteristic.
• For temperatures above freezing, the temperature effecton the sorption curve causes a higher apparent moisturecapacity of the material, i.e., a given increment of rela-tive humidity gives a larger increment of moisture con-tent when a model including temperature-dependentsorption is compared to a model using an isothermalsorption characteristic. This observation is to a highdegree governed by the fact that periods with high val-ues of ambient relative humidity coincide with periodswith low ambient temperatures, where temperature-dependent equilibrium moisture content has the highestvalues. Correspondingly, low values of ambient relativehumidity are met in periods with high ambient tempera-ture, where the equilibrium moisture content is lower.
When applying the new modeling principle in a specificcase—the solid wood construction used as an example in thispaper—the effect on the yearly amplitude of the mean mois-ture content is as follows: the amplitude of moisture contentbecomes 10% smaller when including hysteresis in the model-ing; the amplitude of moisture content becomes 10% largerwhen including temperature dependency in the modeling.However, for cases with other climate histories, and especiallyin the case of smaller dimensions in the direction of the mois-ture gradient, these reported effects might be larger.
With respect to the comparison of how the measured andmodeled moisture content develop in the case study construc-tion, the following two conclusions are drawn:
• The modeling strongly supports that the measured fluc-tuations of moisture content are real moisture fluctua-tions encountered in the construction as a fair degree ofcongruence between modeled and measured values isobserved.
• The modeled values exhibit a smaller penetration depthfor short-term moisture content fluctuations than themeasured values. This deviation of the modeling may beexplained by the water vapor permeability values usedand can be proposed remedied by increasing the valuesof the water vapor permeability function. Such a changeto this empirically established function can easily bejustified by the available data.
ACKNOWLEDGMENTS
The establishment of a sorption surface was made possi-ble through a literature study financed by the Danish ResearchCouncils through the research project, “Modelling the effectsof moisture and load history on the mechanical properties ofwood” (grant no. 991363). The same project has financed theanalysis of the measured data for the purpose of this paper. C.O. Clorius, when employed at the Danish Technological Insti-tute, Wood Technology, undertook the field-measuring project
as part of a Nordic Industrial Fund project for enhancing thedocumentation for solid wood building elements. The Instituteis thanked for making the results available for academicresearch, and special thanks are given to stable master Chris-tian Vingaard Christensen at the Centre for Living CulturalHeritage at the Danish Agricultural Museum, Gammel Estrup,for volunteering and meticulously carrying on weekly measur-ing of moisture content in the roof of the instrumented stableconstruction.
REFERENCES
Ahlgren, L. 1972. Moisture fixation in porous building mate-rials. Division of Building Technology, Lund Institute ofTechnology, Report 36.Lund, Sweden.
Andersen, A. Helbo, and C. Rode. 2002. MATCH—Mois-ture and Temperature Calculations for Constructions ofHygroscopical Materials. (www.match-box.dk). Bygge-og Miljøteknik A/S, Vedbæk, Denmark, Ed. 2002 V. 1.6.
Arfvidsson, J. 1999. A new algorithm to calculate the iso-thermal moisture penetration for periodically varyingrelative humidity at the boundary. Nordic Journal ofBuilding Physics, Vol 2.
Bingye, H., and S. Avramidis. 2003. Wood sorption fractalityin the hygroscopic range. Part II, New Model Develop-ment and Validation. Wood and Fiber Science35(4):601-608.
Clorius, C.O., and J. Ljørring. 2003. Fluctuations of mois-ture content in glued solid wood elements at outdoorcovered climate conditions. Danish Technological Insti-tute, Wood Technology. (http://solidwood.teknolo-gisk.dk/).
Clorius, C.O., and M.U. Pedersen. 2003. Long-term mois-ture equilibrium for wood in nordic climates – A cata-logue for picea abies exposed to the climatologicalstandard normal at 15 positions. Technical University ofDenmark, Technical Report BYG*DTU SR-03-15.
Clorius, C.O. 2003. Modelling moisture induced deforma-tions in glulam structure. Proceedings of 16th NordicSeminar on Computational Mechanics. Trondheim, Nor-way.
Cudinov, B.S., M.D. Andreev, V.I. Stephanov, and A.V.Finkel’štejn. 1978a. Die Hygroskopizität des Holzes beiTemperaturen under 0ºC, Teil 1: Sorption und Faserstät-tigungspunkt. Holtztechnologie 19(1):91-94.
Cudinov, B.S., M.D. Andreev, V.I. Stephanov, and A.V.Finkel’štejn. 1978b. Die Hygroskopizität des Holzes beiTemperaturen under 0ºC, Teil 2: Der Zustand derhygroskopichen Feuchtigkeit und die Gleichgewichts-feuchte. Holtztechnologie 19(3):174-151.
Drewes, H. 1985. Ausgleichsfeucten von Holzwerkstoffenfür das Bauwesen. Holz als Roh- und Werkstoff 43:97-103.
Eurocode 5. 2001. DS/ENV 1995-1-1, Design of timberstructures—Part 1.1: General rules and rules for build-ings.
14 Buildings IX
Forest Products Society. 1999. Wood Handbook, Wood as anEngineering material. ISBN 1-892529-02-5. USA.
Forsén, H., and V. Tarvainen. 2000. Accuracy and function-ality of hand held wood moisture content meters. Tech-nical Research Centre of Finland. VTT Publications420. Finland.
Goossens, E. 2003. Moisture transfer properties of coatedgypsum, Doctoral thesis. Faculty of Architecture, Build-ing and Planning. Eindhoven University of Technology,The Netherlands.
Fynholm, P., and C. Clorius. 2002. Water vapour permeabil-ity of solid wood elements, Danish Technological Insti-tute, Wood Technology—Træteknik.
Hansen, K.K. 1986. Sorption Isoterms—A catalogue. Tech-nical University of Denmark, Department of Civil Engi-neering, Building Materials Laboratory. Technicalreport 162/86.
Hedenblad, G. 1996. Materialedata för fukttransport-beräkninger. Byggforskningsrådet, Fuktsäkerhet i byg-gnader, T19:1996. Stockholm, Sweden. (in Swedish).
Hedlin, C.P. 1967. Sorption isotherms of twelve woods atsubfreezing temperatures. Forest Products Journal17(12):43-48.
Håkansson, H. 1998. Retarded sorption in wood, Ph.D.-dis-sertation. Lund University—Sweden, Department ofBuilding Science. Report TABK-98/1012.
Karagiozis, A.N. 2001. Impact of air leakage on the thermaland moisture performance of the building envelope. AirBarriers III: Air Barriers Solutions for Buildings inNorth American Climates, Conference. WashingtonD.C.
Kelsey, K.E. 1956. The sorption of water vapour by wood.Australian Journal of Applied Science 8(1):42-54.
Kollmann, F.F.P., and W.A. Côté. 1968. Principles of WoodScience and Technology. Part I, Solid Wood. Springer-Verlag.
Krabbenhøft, K. 2003. Moisture transport in wood—A studyof Physical-Mathematical Models and their NumericalImplementation, Ph.D.-dissertation. Technical Univer-sity of Denmark, Department of Civil Engineering.
Nielsen, L.F. 1989. Moisture sorption in porous materials—A rational fit procedure. Festschrift Rupert.
Springenschmid: Baustoffe-Forschung, Anwendung,Bewärung, pp. 293-299. Baustoff Institut, TechnicheUniversität München of Civil Engineering.
Pedersen, C. Rode. 1990a. Combined heat and moisturetransfer in building constructions, Ph.D. thesis. ThermalInsulation Laboratory, Technical University of Den-mark.
Pedersen, C. Rode. 1990b. Transient calculations of moisturemigration using a simplified description of hysteresis inthe sorption isotherm. Proceedings of the 2nd symposionon Building Physics in the Nordic Countries. TechnicalUniversity of Norway, Trondheim, Norway.
Peuhkuri, R. 2003. Moisture dynamics in building enve-lopes, Ph.D. thesis. Department of Civil Engineering,Technical University of Denmark.
Samuelsson, A. 1990. Resistanskurvor för elektriska fuk-tvortsmätare. (In Swedish) Swedish Institute for WoodTechnology Research, Report L 9006029.
Samuelsson, A. 1992. Calibration curves for resistance-typemoisture meters. Proceedings of 3rd IUFRO Interna-tional Wood Drying Conference, Vienna, pp. 405-408.
Sellevold, E.J., F. Radjy, P. Hoffmeyer, and L. Bach. 1975.Low temperature internal friction and dynamic modulusfor beech wood. Wood and Fiber 7(3):162-169.
Skaar, C. 1988. Wood-water relations. Springer-Verlag. Stamm, A.J., and W. K. Loughborough. 1935. Thermody-
namics of swelling of wood. J Phys Chem 39:121-132. Stamm, A.J. 1964. Wood and Cellulose Science. The Ronald
Press Company. Strømdahl, K. 2000. Water sorption in wood and plant fibres,
Ph.D.-dissertation, Technical University of Denmark,Department of Civil Engineering, Series R-78.
Tveit, A. 1966. Measurements of moisture sorption andmoisture permeability of porous materials. NorwegianBuilding Research Institute, Rapport 45. NBI, Oslo.
Venkateswaran, A. 1970. Sorption of aqueous and nonaque-ous media by wood and cellulose. Chenical Reviews70(6):619-637.
Wadsö, L. 1993. Studies of water vapour transport and sorp-tion in wood, Doctoral Dissertation, Report TVBM-1013. Building Materials, Lund University.
Buildings IX 15