Embed Size (px)
Citation preview

PROCEEDINGS, 43rd Workshop on Geothermal Reservoir Engineering
Stanford University, Stanford, California, February 12-14, 2018
SGP-TR-213
1
Modeling of Geothermal Power Generation from Abandoned Oil Wells Using In-situ
combustion Technology
Xiaoming TIAN1,2, Changwei LIU1 and Kewen LI1
1China University of Geosciences (Beijing)
2China University of Petroleum(Beijing)
Keywords: Geothermal Power Generation; Abandoned Oil Wells; In-situ combustion
ABSTRACT
There is a great amount of oil still resided in abandoned oil reservoirs because of technology and economic limitations. The residual oil
saturation is usually over 30% in many abandoned oil reservoirs. This paper investigated the feasibility of producing both oil and
geothermal energies from these abandoned oil formations using the in-situ sub-combustion technology by air injection. This method can
also help ease the serious pollution problems caused by leakage of residual oil. The temperature in oil reservoirs by air injection with in-
situ combustion could reach about 350℃. Through water injection after in-situ combustion, high temperature and high-pressure steam
can be produced for electricity generation. A closed loop double pipe heat exchanger system was adopted in order to recover the
geothermal energy from the oil wells. The model describing the heat transfer from bottom to wellhead was proposed and the mathematical
equations were developed to assess the economic benefit and feasibility. The proposed model was compared against other models in order
to evaluate the reliability and accuracy. The model results show that the insulation of extraction well with good thermal resistance property
is essential to obtain high outlet temperature. The proper water injection velocity and inlet temperature should be utilized to extract
geothermal heat for specific condition. Comparing with other geothermal recovery methods, the proposed approach with advanced in-situ
combustion could recover both the abandoned oil and geothermal energies more efficiently. The computation scenarios in this study
demonstrate that the outlet temperature and corresponding generated electricity increase remarkably after combustion front reaching the
area near the heat exchanger during in-situ combustion. Furthermore, it will shorten the payback time and keep relatively high economic
benefits at the same time when applying advanced in-situ combustion by air injection.
1. INTRODUCTION
Nowadays, the oil industry is in a period of rapid development. However, more and more people start to worry about its sustainability.
Due to technical reasons and other accidental causes, a lot of oil and gas wells have been abandoned. According to statistic data in 2005,
the total number of effective wells in China is 164076, the abandoned one is 76881, and the scrap rate is up to 32% (Li et al., 2008). The
average recovery ratio of the primary and secondary oil recovery is just 20%-35%. The average recovery ratio of reservoir is less likely
to exceed 50%, even though the technology keeps developing and updating.
Figure 1: The proportion of effective and abandoned wells in 2005
Most field experiments of geothermal projects in China show that the outlet fluid temperature is about 100oC (Wei et al., 2009; Kong et
al., 2014), which cannot generate sufficient heat for further commercial power plant using, not to mention recovering upfront investment
of retrofitting abandoned wells and construction of power plant. Workover techniques of abandoned well include “technology of clearing
asphalt, resin and wax in compressed pump pipe of oil and gas wells” and “technology of recovering and improving the function of oil
wells and pressurized wells”. With these techniques, the cost of workover is about one tenth of drilling a new well, even the maximum
expense is less than one seventh of it (Zheng et al., 2008; Kant, 2010). Therefore, if most abandoned wells were fully redeveloped and
utilized, a large amount of expense of operation could be cut down, and it will also bring economic benefits and strategic significance.
Tian et al.
2
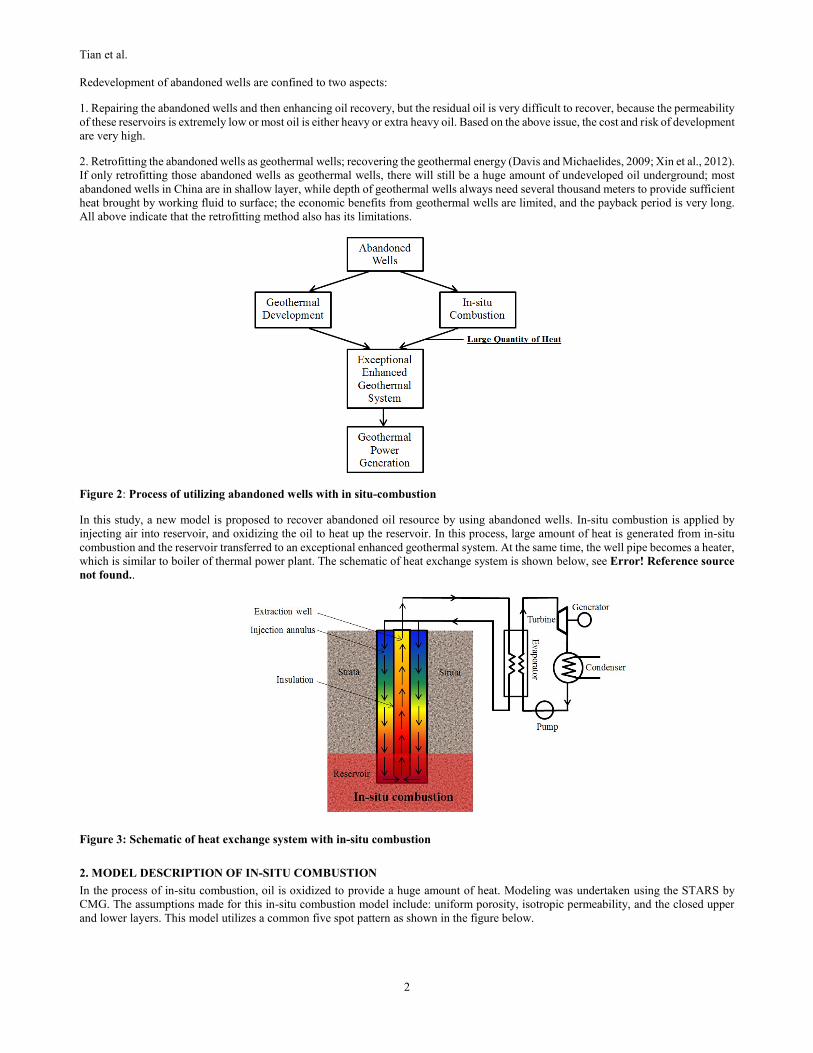
Redevelopment of abandoned wells are confined to two aspects:
1. Repairing the abandoned wells and then enhancing oil recovery, but the residual oil is very difficult to recover, because the permeability
of these reservoirs is extremely low or most oil is either heavy or extra heavy oil. Based on the above issue, the cost and risk of development
are very high.
2. Retrofitting the abandoned wells as geothermal wells; recovering the geothermal energy (Davis and Michaelides, 2009; Xin et al., 2012).
If only retrofitting those abandoned wells as geothermal wells, there will still be a huge amount of undeveloped oil underground; most
abandoned wells in China are in shallow layer, while depth of geothermal wells always need several thousand meters to provide sufficient
heat brought by working fluid to surface; the economic benefits from geothermal wells are limited, and the payback period is very long.
All above indicate that the retrofitting method also has its limitations.
Figure 2: Process of utilizing abandoned wells with in situ-combustion
In this study, a new model is proposed to recover abandoned oil resource by using abandoned wells. In-situ combustion is applied by
injecting air into reservoir, and oxidizing the oil to heat up the reservoir. In this process, large amount of heat is generated from in-situ
combustion and the reservoir transferred to an exceptional enhanced geothermal system. At the same time, the well pipe becomes a heater,
which is similar to boiler of thermal power plant. The schematic of heat exchange system is shown below, see Error! Reference source
not found..
Figure 3: Schematic of heat exchange system with in-situ combustion
2. MODEL DESCRIPTION OF IN-SITU COMBUSTION
In the process of in-situ combustion, oil is oxidized to provide a huge amount of heat. Modeling was undertaken using the STARS by
CMG. The assumptions made for this in-situ combustion model include: uniform porosity, isotropic permeability, and the closed upper
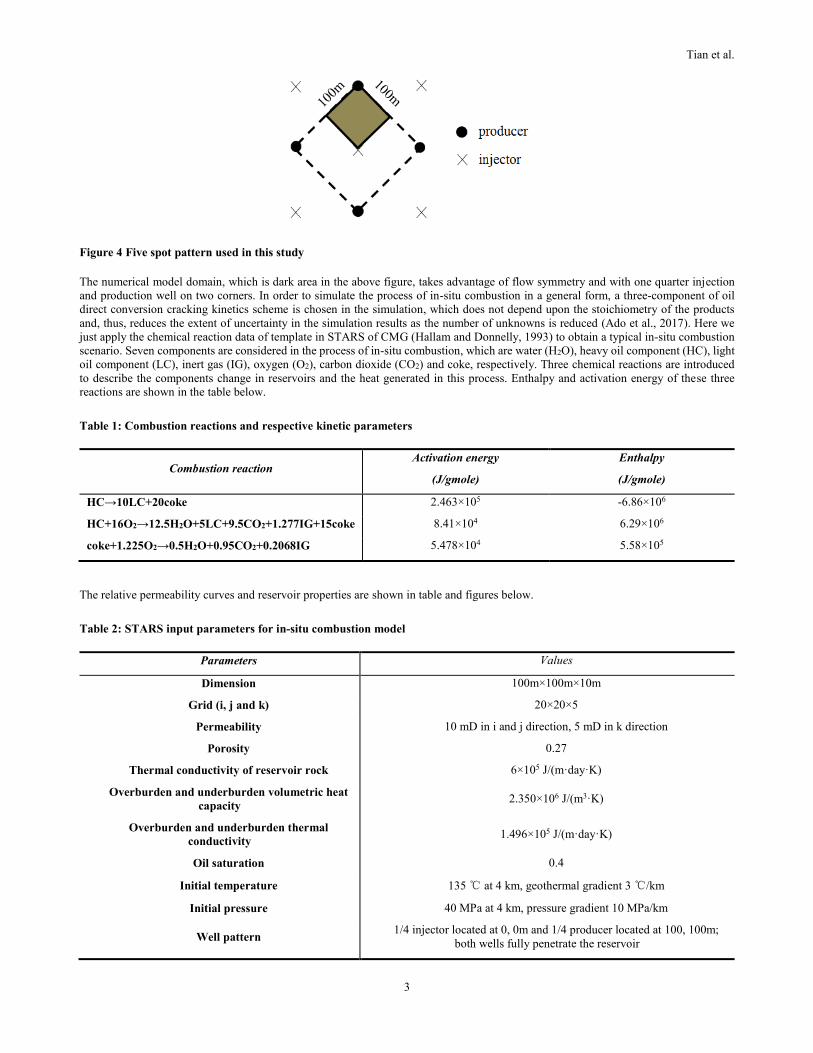
and lower layers. This model utilizes a common five spot pattern as shown in the figure below.
Tian et al.
3
Figure 4 Five spot pattern used in this study
The numerical model domain, which is dark area in the above figure, takes advantage of flow symmetry and with one quarter injection
and production well on two corners. In order to simulate the process of in-situ combustion in a general form, a three-component of oil
direct conversion cracking kinetics scheme is chosen in the simulation, which does not depend upon the stoichiometry of the products
and, thus, reduces the extent of uncertainty in the simulation results as the number of unknowns is reduced (Ado et al., 2017). Here we
just apply the chemical reaction data of template in STARS of CMG (Hallam and Donnelly, 1993) to obtain a typical in-situ combustion
scenario. Seven components are considered in the process of in-situ combustion, which are water (H2O), heavy oil component (HC), light
oil component (LC), inert gas (IG), oxygen (O2), carbon dioxide (CO2) and coke, respectively. Three chemical reactions are introduced
to describe the components change in reservoirs and the heat generated in this process. Enthalpy and activation energy of these three
reactions are shown in the table below.
Table 1: Combustion reactions and respective kinetic parameters
Combustion reaction Activation energy
(J/gmole)
Enthalpy
(J/gmole)
HC→10LC+20coke 2.463×10⁵ -6.86×10⁶
HC+16O2→12.5H2O+5LC+9.5CO2+1.277IG+15coke 8.41×10⁴ 6.29×10⁶
coke+1.225O2→0.5H2O+0.95CO2+0.2068IG 5.478×10⁴ 5.58×10⁵
The relative permeability curves and reservoir properties are shown in table and figures below.
Table 2: STARS input parameters for in-situ combustion model
Parameters Values
Dimension 100m×100m×10m
Grid (i, j and k) 20×20×5
Permeability 10 mD in i and j direction, 5 mD in k direction
Porosity 0.27
Thermal conductivity of reservoir rock 6×10⁵ J/(m·day·K)
Overburden and underburden volumetric heat
capacity 2.350×10⁶ J/(m3·K)
Overburden and underburden thermal
conductivity 1.496×10⁵ J/(m·day·K)
Oil saturation 0.4
Initial temperature 135 ℃ at 4 km, geothermal gradient 3 ℃/km
Initial pressure 40 MPa at 4 km, pressure gradient 10 MPa/km
Well pattern 1/4 injector located at 0, 0m and 1/4 producer located at 100, 100m;
both wells fully penetrate the reservoir

Tian et al.
4
Air injection and oil production 5000 m3/day and 5 m3/day for both 1/4 wells
Figure 5: Relative permeability curves. Water-oil curves (the left figure) and liquid-gas curves (the right figure)
3. MODEL DESCRIPTION OF GEOTHERMAL WELL
As can be seen from Error! Reference source not found., the abandoned well can be retrofitted as geothermal well by coating the inner
tubing with insulation and sealing the bottom of the well. Water is used as working fluid and injected through annulus space (Kujawa et
al., 2006). When water flows downward along the annulus, it is heated by surrounding rocks and reservoir where there is large amount of
heat generated by in-situ combustion. The heated water is then extracted to surface. This is actually a concentric tube heat exchanger and
the working fluid does not directly have contact with surrounding rocks. The geothermal gradient is generally about 0.03 K/m (Wang et
al., 2003; Yuan et al., 2006; Zhang, 2016; Yuan, 2009; Xiong and Zhang, 1988). This model utilizes a concentric tube heat exchanger that
is designed to retrofit an abandoned well with a typical casing outer diameter of 19.6 cm (7 5/8 inches) and an inner diameter of 15 cm.
The inner diameter of extraction well is 4 cm. The thickness of insulation is 2 cm. The well depth is 4000m and the thickness of reservoir
is 10m. The whole reservoir is fully penetrated by well. This system is modeled with the finite element modeling software COMSOL
Multiphysics.
3.1 Governing equations
Here a two-dimensional axisymmetric cylindrical model is applied to describe this whole system. Heat exchange takes place between
working fluid and rocks simultaneously (Kujawa et al., 2006; Tao, 1988), see Error! Reference source not found..
Figure 6: Dimensions of concentric pipe heat exchanger model
The time dependent governing equation corresponds to convection-diffusion equation, which contain additional contributions of heat flux
and no other heat source (Bird et al., 2007). The heat flux describes the heat transfer from rock to injection annulus and from injection
annulus to extraction well. Therefore, the equation may be expressed as follows:
0.0
0.2
0.4
0.6
0.8
1.0
0 0.2 0.4 0.6 0.8 1
Krw
, kro
w
Sw
krw
krow
0.0
0.2
0.4
0.6
0.8
1.0
0 0.2 0.4 0.6 0.8 1
Krg
, kro
g
Sl
krg
krog

Tian et al.
5
ρ𝐶𝑝𝜕𝑇
𝜕𝑡+ ρ𝐶𝑝 �⃗⃗� ∙ ∇𝑇 + ∇𝑞 = 0 (1)
where ρ is the density (kg/m3), Cp is the specific heat capacity at constant pressure (J/(kg·K)), T is the absolute temperature (K), �⃗⃗� is the
velocity vector (m/s) and 𝑞 is the heat flux by conduction (W/m2), which can be described by using Fourier’s three dimensional diffusion
law.
𝑞 = −𝑘∇𝑇 (2)
where k is thermal conductivity (W/(m·K)). Some parameters used in numerical simulation are presented in Error! Reference source
not found..
Table 3: The parameters used in numerical simulation of concentric tube heat exchanger
Properties Heat capacity
(J/kg·K)
Thermal conductivity
(W/(m·K))
Density
(kg/m3)
Casing 450 60 7850
Insulation 1010 0.025 1.225
Rock 1000 2 2200
For water, the value of heat capacity, density and thermal conductivity are dependent on temperature and have already built in COMSOL
materials database, which are expressed by the formulas as follow:
𝐶𝑝_𝑤𝑎𝑡𝑒𝑟 = 12010.1 − 80.4 × 𝑇 + 0.3 × 𝑇2 − 5.4 × 10⁻⁴ × 𝑇3 + 3.6 × 10⁻⁷ × 𝑇−4 (3)
𝜌_𝑤𝑎𝑡𝑒𝑟 = 838.5 + 1.4 × 𝑇 − 0.003 × 𝑇2 + 3.7 × 10⁻⁷ × 𝑇3 (4)
𝑘_𝑤𝑎𝑡𝑒𝑟 = −0.9 + 0.009 × 𝑇 − 1.610−5 × 𝑇2 + 8.010−9 × 𝑇3 (5)
3.2 Initial conditions
The velocity and initial temperature of injected water are uniform along the well, which are 0.03 m/s and 30 oC, respectively. Note that
the velocity of water in extraction well should be a corresponding value in order to keep a constant mass flow rate. The surface temperature
is 15 oC. The initial temperature of rocks is given by:
𝑇𝑅,0(𝑧) = 𝑇𝑠𝑟𝑓 + G ∙ 𝑧 (6)
where TR,0 is initial rock temperature (K), Tsrf is temperature at surface (K), G is geothermal gradient (K/m) and z is depth of rock (m).
3.3 Boundary conditions
It can be proved that at a certain distance from this exchanger to rock, the temperature is constant and equal to initial geothermal
temperature. The value of distance is chosen as 100 m and will be explained later in this paper. Therefore, the boundary condition of this
whole system including rock is given by:
𝑇𝑅,𝑏|𝑟=𝑅𝑧=𝑍
= 𝑇𝑅,0(𝑧) (7)
where TR,b is rock temperature at constant temperature boundary (K), R and Z are distance at constant temperature boundary in r and z
direction (m).
However, if in-situ combustion is applied in the reservoir, the boundary condition at the depth of reservoir corresponds to the temperature
influenced by in-situ combustion. The boundary condition at the depth of reservoir is given by:
𝑇𝑅,𝑏|𝑟=𝑅= 𝑇𝑖𝑐(𝑧, 𝑡) (8)
where Tic is the temperature of reservoir with in-situ combustion and it is the function of depth z and time t. Note that the distance of
constant temperature boundary is still R. This is reasonable because the influence of in-situ combustion on heat exchanger is dominant
considering the whole region of oil field, while the decrease of reservoir temperature and heat extraction caused by geothermal well is
limited.

Tian et al.
6
4. RESULTS
A two-dimensional axisymmetric cylindrical geothermic model is applied to simulate the temperature distribution of geothermal well
system as well as surrounding rock system. In order to obtain more accurate temperature data, these two systems are coupled by using
COMSOL Multiphysics simulator.
4.1 Validation and comparison of models
The proposed model was compared and validated with the results from Bu et al. and Templeton et al. The assumptions used by Bu et al.
include neglecting the variation of tube wall temperature of injection annulus and extraction well and Dittus-Boelter relation in convection
model. These assumptions decrease the accuracy of temperature distribution in this system. On the one hand, the temperature transfer is
sensitive to the properties of extraction well and insulation. On the other hand, Dittus-Boelter relation is not suitable for large temperature
difference part, especially for the part near to the top of well, and this relation is also not suitable for annular injection well (Dittus and
Boelter, 1985). For the model used by Templeton et al. the whole simulating domain does not consider the rock below the heat exchanger.
Furthermore, both studies neglect the changes of thermal properties of water, which are the functions of temperature.
In order to achieve a good basis for comparison, the applied parameters in proposed model are identical to these two papers. To be more
specific, the inner diameter of extraction and injection well are 10 cm and 30 cm. The thickness of insulation and casing are 1 cm and 2
cm. The thermal conductivity of rock and insulation are 2.1 W/(m·K) and 0.027 W/(m·K). The density and heat capacity of rock are 2730
kg/m3 and 1098 J/kg/K. The velocity of injected water and geothermal gradient are 0.03 m/s and 0.045 K/m.
Error! Reference source not found. demonstrates the outlet temperatures calculated by these three models in ten years.
Figure 7: Verifacation of the results calculated by Bu et al. and Templeton et al. with the results of proposed model at the same
conditions
As can be seen from the above figure, the temperature calculated by Bu et al. is obviously from 26% to 44% higher than the results of
Templeton et al. and proposed model at the same conditions in this study. This overestimation is because of the assumption used in Bu et
al. model as mentioned above. The results of Templeton et al. and proposed model in this study have the same trend as the increase of
operation time. However, neglecting the rock below the heat exchanger makes the temperature of Templeton et al. is slightly smaller than
the results of the proposed model in this study.
Error! Reference source not found. shows the temperature profile of injection annulus and extraction well with 0.03 m/s injection
velocity after two months operation.
80
90
100
110
120
130
140
150
0 2 4 6 8 10 12
Ou
tle
t te
mp
era
ture
, oC
Time, Years
Templeton et al. Bu et al. This study

Tian et al.
7
Figure 8: Comparison of temperature profile between the proposed model in this paper and the model of Bu et al.
The variation of fluid temperature curves of this study show there is a slight decrease of temperature near the top of the injection annulus.
The reason is that the temperature of injected water is 30 oC and higher than the surface temperature 15 oC. This will make injected water
lose some heat in this specific region. However, we cannot find such phenomenon in the results of Bu et al. This overestimation also
reduces the accuracy of simulation results of Bu et al.
4.2 Analysis of heat transfer characteristics
The parameters applied in calculation are presented in Error! Reference source not found., Error! Reference source not found., Error!
Reference source not found. and Error! Reference source not found.. The temperature distribution in rock and heat exchanger with
in-situ combustion are then shown in the figure below:
Figure 9: Temperature distribution of heat exchanger after one year operation(the left figure). Temperature distribution of rock
after 50 years operation (the right figure)
As can be seen from the above figures, there is the temperature drawdown near the heat exchanger. The high temperature zone is
pronounced at the depth of in-situ combustion reservoir (4000m). The isothermal contours show that the initial geothermal temperature is
not affected by heat exchanger when the radius is larger than 80 meters even after 50 years operation. This can help to explain why the
distance 100 m from heat exchanger to rock in r-direction and 500 m in z-direction have been chosen as rock boundary in proposed model.
4.3 Heat production analysis
Considering the high upfront investments of the setting of geothermal power plant and retrofitting of abandoned well, the outlet
temperatures of conventional geothermal well project may be not high enough to generate large amount of electric energy and recover the
upfront costs rapidly. In order to obtain more heat from reservoir, in-situ combustion is applied to supply the heat extraction from heat
exchanger. A three dimensional model of reservoir with in-situ combustion is simulated by using STARS simulator in CMG. The modeling
0
20
40
60
80
100
120
140
160
0 1000 2000 3000 4000
Wa
ter
tem
pe
ratu
re,o
C
Well depth, m
T_in of this study
T_out of this study
T_in of Bu et al.
T_out of Bu et al.

Tian et al.
8
grid numbers are 20, 20 and 5 in i, j and k direction, respectively. For 50 years of operation, the temperature distributions of the 6th year
and the 11th year in the reservoir are shown in the figure below. The unit of reservoir temperature is Celsius degree.
Figure 10: Temperature distribution of the reservoir applying in-situ combustion
The temperature near the production well (block 18, 20, 3) and average temperature of the whole reservoir is shown in the figure below:
Figure 11: Average temperature of the reservoir and temperature near the heat exchanger wellbore
As can be seen in the above figures, when the combustion front approaches to production well (heat exchanger), the temperature around
the wellbore increases sharply and then reaches a peak about 350 oC. With the continuous injection of air, the temperature will decrease
and has a long decline stage. This means there is a huge amount heat generated in reservoir when applying in-situ combustion. For the
rocks near the wellbore, the heat can be extracted by heat exchanger from those rocks is considerable, especially when it reaches its peak.
After applying the temperature data of block (18, 20, 3) into proposed heat exchanger model, the outlet temperature is strongly enhanced
by combustion reservoir. The temperature curves are shown in below:
80
130
180
230
280
330
380
0 10 20 30 40 50
Te
mp
era
ture
, oC
Time, Years
temperature of block 18, 20, 3
average temperature of reservoir

Tian et al.
9
Figure 12: The effect of in-situ combustion on performance
Note that there is a bump up of outlet temperature when the combustion front reaches the wellbore. The highest outlet temperature of
extraction well is about 150 oC. An enhancement effect is pronounced when geothermal heat is compensated by in-situ combustion. The
corresponding temperature profiles of injection annulus and extraction well is shown in the figure below:
Figure 13: The temperature profiles of different operation time with in-situ combustion
The temperature bump up is also shown in the temperature profiles at the depth of reservoir (4000m). As can be seen from the above
figure, when the combustion front does not reach the wellbore (smaller than 10 years), the temperature of injection annulus and extraction
well at the depth of reservoir (4000m) is nearly the same. However, after the combustion front reaching the wellbore (larger than 10 years),
the temperature of extraction well is significantly higher than that of injection annulus. This indicates that in-situ combustion remarkably
enhance the temperature of water in extraction well.
The power provided by heat exchanger can be simply given by (Cheng et al., 2014):
P = M(𝑇𝑜𝑢𝑡 − 𝑇𝑖𝑛)𝐶𝑝𝜂𝑟𝑖𝜂𝑚𝜂𝑔/1000 (9)
where P is the actual generated power (kW), M is the mass flow rate (kg/s), Tout is the outlet temperature of extraction well (K), Tin is the
intlet temperature of injection annulus (K), Cp is specific heat capacity of water (J/(kg·K)), ηri is the relative internal efficiency of steam
turbine (0.8), ηm is the mechanical efficiency of steam turbine (0.97), ηg is the generator efficiency (0.98) (Cheng et al., 2014).
80
100
120
140
160
180
0 10 20 30 40 50
Ou
tle
t te
mp
era
ture
, oC
Time, years
without in-situ combustion
with in-situ combustion
0
50
100
150
200
250
0 500 1000 1500 2000 2500 3000 3500 4000
Wa
ter
tem
pe
ratu
re,
oC
Well depth, m
T_in after 1 year
T_out after 1 year
T_in after 5 years
T_out after 5 years
T_in after 10 years
T_out after 10 years
T_in after 15 years
T_out after 15 years
T_in after 25 years
T_out after 25 years
T_in after 50 years
T_out after 50 years
Tian et al.
10
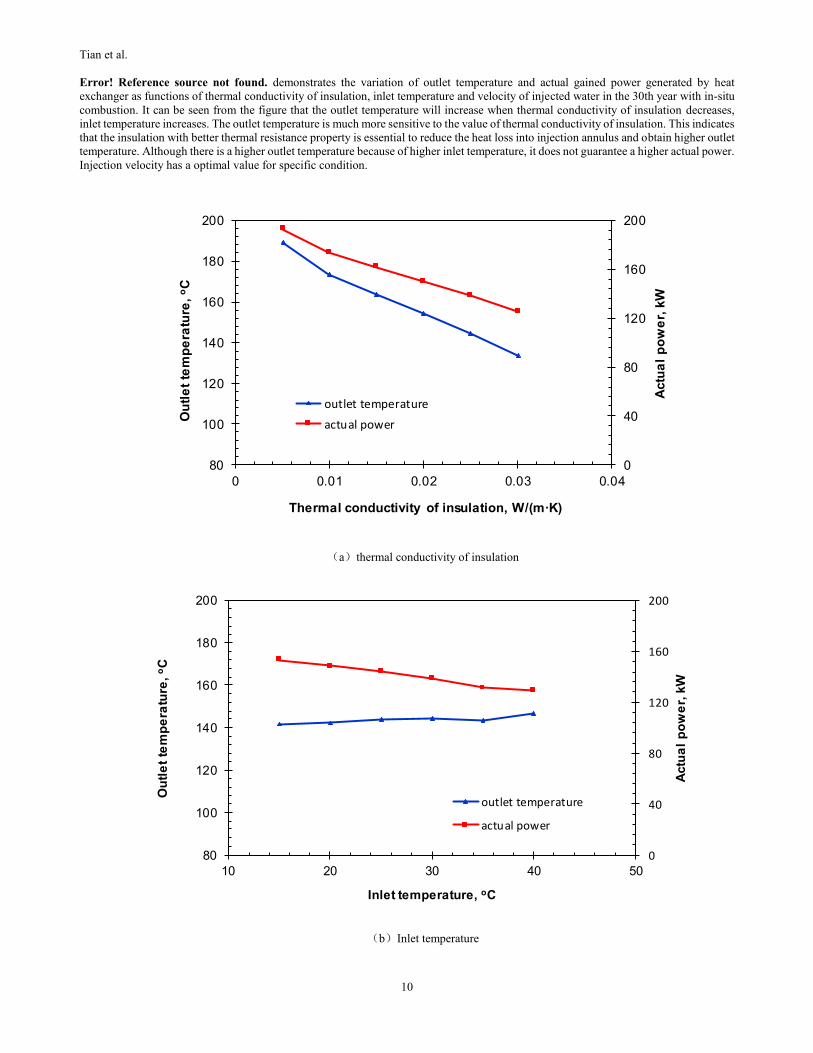
Error! Reference source not found. demonstrates the variation of outlet temperature and actual gained power generated by heat
exchanger as functions of thermal conductivity of insulation, inlet temperature and velocity of injected water in the 30th year with in-situ
combustion. It can be seen from the figure that the outlet temperature will increase when thermal conductivity of insulation decreases,
inlet temperature increases. The outlet temperature is much more sensitive to the value of thermal conductivity of insulation. This indicates
that the insulation with better thermal resistance property is essential to reduce the heat loss into injection annulus and obtain higher outlet
temperature. Although there is a higher outlet temperature because of higher inlet temperature, it does not guarantee a higher actual power.
Injection velocity has a optimal value for specific condition.
(a)thermal conductivity of insulation
(b)Inlet temperature
0
40
80
120
160
200
80
100
120
140
160
180
200
0 0.01 0.02 0.03 0.04
Actu
al
po
we
r, k
W
Ou
tle
t te
mp
era
ture
, oC
Thermal conductivity of insulation, W/(m·K)
outlet temperature
actual power
0
40
80
120
160
200
80
100
120
140
160
180
200
10 20 30 40 50
Actu
al
po
we
r, k
W
Ou
tle
t te
mp
era
ture
, oC
Inlet temperature, oC
outlet temperature
actual power

Tian et al.
11
(c)Velocity of injected water
Figure 14: The variation of outlet temperature and actual power of heat exchanger on different parameters
Considering the temperature near the heat exchanger wellbore in the early stage (about 10 years in Error! Reference source not found.
and Error! Reference source not found.) is still not enhanced significantly, we may apply in-situ combustion in advanced for avoiding
this low-temperature stage in order to recover the upfront costs rapidly. This means that the on-site retrofitting of abandoned well is
executed only when the temperature of bottom hole increases dramatically.
Figure 15: The effect of advanced in-situ combustion on performance
As can be seen from the above figure, if heat exchanger starts to operate after the combustion front approaches it, the outlet temperature
will be enhanced significantly at the very early time and then decrease slowly. In order to find out how much energy is extracted by heat
exchanger; the corresponding electricity data have been calculated and shown in the figure below:
0
50
100
150
200
80
100
120
140
160
180
200
0 0.02 0.04 0.06 0.08 0.1 0.12
Actu
al
po
we
r, k
W
Ou
tle
t te
mp
era
ture
, oC
Velocity of injected water, m/s
outlet temperature
actual power
80
100
120
140
160
180
0 10 20 30 40 50
Ou
tle
t te
mp
era
ture
, oC
Time, years
without in-situ combustion
with in-situ combustion
advanced in-situ combustion

Tian et al.
12
Figure 16: Cumulative electricity generated by geothermal power plant
These curves demonstrate that the total electricity generated by geothermal power plant with the compensation of in-situ combustion is
much more than that without in-situ combustion. Furthermore, the advanced in-situ combustion can make this advantage more
pronounced.
4.4 Economical appraisal
In order to figure out the duration of payback time of upfront investment and cumulative net cash flow after 50 years operation, an
economical appraisal has been made in this study based on geothermal development engineering and management engineering, the
requirements of economic appraisal methods and parameters promulgated by China National Development and Reform Commission, the
current fiscal and taxation system and price system of China and the current status of geothermal energy development.
For single heat exchanger, assume conservative values of $1 million of each retrofitting cost of abandoned well (Zhang, 2011) and $0.045
per kW·h of cost of generating electricity. Based on the data given by GeoElec project of Europe (M. Serdjuk et al., 2013), the costs per
installed kW come to about $18976 (€16000) including the investment used for drilling (power peak is 159.2 kW at the 13th year in these
scenarios). For retrofitting well without the drilling investment, the costs per installed kW conservatively come to about $6000.
Geothermal project planning including design, consulting and so on can take up to approximately 10% of the overall capital costs (M.
Serdjuk et al., 2013). According to average industrial electricity price $0.15 per kW·h, the injected air compression annual cost per well
is $0.11 million (for 20000 m3/day). The average electricity sale price of connecting to State Grid Corporation of China is $0.075 per
kW·h. The management expense is 1% of annual sales. The total sales tax rate and additional duty rate is 18.7% of the annual sales.
Corporate income tax rate is 33%. For 50 years operation, the cumulative net cash flow (NCF) curves are shown in the figure below:
0
10
20
30
40
50
60
0 10 20 30 40 50
Cu
mu
lati
ve
ele
ctr
ic e
ne
rgy, 10
6kW
·h
Time, years
without in-situ combustion
with in-situ combustion
advanced in-situ combustion

Tian et al.
13
Figure 17: Cumulative net cash flow curves for geothermal power plant
As can be seen from the above figure, the scenario with advanced in-situ combustion has the shortest payback time and the largest final
cumulative NCF, which are about 2.5 years and $54.6 million, respectively. The final cumulative NCF of the scenarios combining in-situ
combustion are much higher than that without in-situ combustion. Although the scenario with simultaneous in-situ combustion also has
relatively high final cumulative NCF, its payback time does not shorten that much compared with the scenario with advanced combustion.
Therefore, the geothermal project with advanced in-situ combustion is recommended.
5. CONCLUSIONS
The following conclusions may be drawn from the present study:
1. An efficient and economical model describing the retrofitted abandoned wells with in-situ combustion for geothermal energy recovery
combined has been demonstrated. This model is validated and compared with two numerical models proposed by Bu et al. and Templeton
et al.
2. Several parameters affecting the system performance have been verified using the proposed model. The insulation with good thermal
resistance property can significantly enhance the outlet temperature by reducing the heat loss from extraction well, which is helpful for
extracting more heat from the formation. Although the higher inlet temperature can lead a relatively higher outlet temperature, it does not
provide a higher actual power. The reason is that lower temperature water provides a larger temperature difference between heat exchanger
and rock. Generally, the injection velocity has an optimal value for specific condition, which is 0.03 m/s in proposed scenario. Too large
or too small values of injection velocity will decrease the efficiency of heat transfer from rock to heat exchanger.
3. In-situ combustion of oil reservoir is applied to enhance the actual power generated by heat exchanger and shorten the payback time of
upfront costs rapidly. This can not only help ease the serious pollution problems caused by leakage of residual oil in abandoned oil well
and make the use of residual oil, but also make a lot of economic benefits. The scenarios used in this study demonstrate that with the help
of in-situ combustion, the outlet temperature and corresponding generated electricity increase remarkably after combustion front reaching
the area near the heat exchanger.
4. According to economical appraisal, it will shorten the payback time and keep relatively high economic benefits if applying advanced
in-situ combustion, which are 2.5 years and $54.6 million in proposed scenario, respectively. This study may give some enlightenments
for abandoned wells reutilization in some oilfield areas where thermal recovery techniques were used.
REFERENCES
Kant, A.: Oilfield abandonment and soil restoration in the Netherlands, experience for the future, paper 126956 presented at the SPE
International Conference on Health,safety and Environment in Oil and Gas Exploration and Production (Rio de Janeiro, Brazil,
2010).
-5
5
15
25
35
45
55
0 5 10 15 20 25 30 35 40 45 50
Cu
mu
lati
ve
ne
t ca
sh s
low
, m
illi
on
do
lla
rs
Time, Years
without in-situ combustion
with in-situ combustion
advanced in-situ combustion
-4
-3
-2
-1
0
1
2
3
4
5
6
0 1 2 3 4 5 6 7 8 9 10

Tian et al.
14
Davis, A. P., and Michaelides, E. E.: Geothermal Power Production from Abandoned Oil Wells, Energy, 34, (2009), 866-872.
Dittus F.W., and Boelter, L.M.K.: Heat transfer in automobile radiators of the tubular type, Heat Mass Transfer, 12, (1985), 3-22.
http://www.hbddrn.com/news/hynews/direfadian/7229.html (accessed December 27, 2017).
Templeton, J.D., Ghoreishi-Madiseh, S.A., Hassani, F., and Al-Khawaja, M.J.: Abandoned petroleum wells as sustainable sources of
geothermal energy, Energy, 70, (2014), 366-373.
Li, J.M., Wang, H.Y., and Zhao, Q.: Potential and Prospects on New Energy Sources in China, Natural Gas Industry, 28, (2008), 149-
153.
Kong, Y. L, Pang, Z. H., Shao, H. B., et al.: Recent Studies on Hydrothermal Systems in China: a review, Geothermal Energy, 2(1),
(2014), 19.
Kujawa, T., Nowak, W., and Stachel, A.A.: Utilization of existing deep geological wells for acquisitions of geothermal energy, Energy,
31, (2006), 650-664.
Zheng, L., Yuan, J., Liang, H., and Li, K.: Energy from Abandoned Oil and Gas Reservoirs, paper SPE115055 presented at 2008 SPE
Asia Pacific Oil & Gas Conference and Exhibition (Perth, Australia, 2008).
Serdjuk, M. P., Dumas, L., Angelino, et al.: Geothermal Investment Guide, available at http://www.geoelec.eu/wp-
content/uploads/2013/11/Geothermal-Investment-guide.pdf (accessed December 27, 2017).
Ado, M.R., Greaves, M., and Rigby, S.P.: Dynamic Simulation of the Toe-to-Heel Air Injection Heavy Oil Recovery Process, Energy &
Fuels, 31, (2017), 1276-1284.
Zhang, Q.H.: The Abandoned Well can be Recycled. China Petrochem, 16, (2011), 26-27.
Bird, R.B., Stewart, W.E., and Lightfoot, E.N.: Transport Phenomena, 2nd ed., John Wiley and Sons, 2007.
Hallam, R.J., and Donnelly, J.K..: Pressure-Up Blowdown Combustion: A Channeled Reservoir Recovery Process, paper SPE18071 of
SPE Advanced Technology Series (1993).
Xin, S.L., Liang, H.B., Hu B., and Li, K.W.: Electrical Power Generation from Low Temperature Co-Produced Geothermal Resources at
Huabei Oilfield, presented at Thirty-Seventh Workshop on Geothermal Reservoir Engineering (Stanford University, Stanford,
California, January 30 – February 1, 2012).
Cheng, W.L., Li, T. T., Nian, Y.L., et al.: Evaluation of Working Fluids for Geothermal Power Generation from Abandoned Oil Wells,
Applied Energy, 118, (2014), 238–245.
Tao, W.Q.: Numerical Heat Transfer, Xi'an Jiaotong University Press, (1988).
Wang L.S., Li C., Liu S.W., et al.: Geotemperature Gradient Distribution of Kuqa Foreland Basin, North of Tarim, China, Chinese Journal
of Geophysics, 46(3), (2003), 403-406.
Wei, Y.Z., Wang, F.Q., and Ren B.Y.: Drainage and Production by Using Geothermal in Huabei Oil Region, Oil Drilling & Production
Technology, 31, (2009), 93-99.
Bu, X., Ma, W., and H. Li: Geothermal Energy Production Utilizing Abandoned Oil and Gas Wells, Renewable Energy, 41, (2012), 80-
85.
Xiong, L.P., and Zhang, J.M.: Relationship between Geothermal Gradient and the Relief of Basement Rock in North China Plain, Chinese
Journal of Physics, 31(2), (1988), 146-155.
Yuan, Y., Mi L.J., Zhang G.C., et al.: Some Remarks about Geothermal Gradient of Sedimentary Basins, Geological Review, 55(4),
(2009), 531-535.
YuanY.S., Ma Y. S., Hu S.B., et al.: Present-day Geothermal Characteristics in South China, Chinese Journal of Geophysics, 49(4) (2006),
1118-1126.
Zhang F.Y.: Geothermal Gradient and Heat Flow Characteristics of Nanyang Basin, Ground Water, 38(4), (2016), 121-122.