Embed Size (px)
Citation preview

Modeling of gas-driven magmatic overturn: Tracking ofphenocryst dispersal and gathering during magma mixing
Philipp Ruprecht and George W. BergantzDepartment of Earth and Space Science, University of Washington, Box 351310, Seattle, Washington 98195, USA([email protected]; [email protected])
Josef DufekDepartment of Earth and Planetary Science, University of California, Berkeley, 307 McCone Hall, Berkeley, California94720, USA ([email protected])
[1] We present a combined multiphase numerical and crystal-tracking approach that provides a frameworkto investigate the transport and zoning of crystals associated with a gas-driven mixing event. Mixing incompositionally intermediate to silicic magmatic systems is often initiated by gas exsolution in therecharging magma, causing a density inversion and subsequent overturn. The overturn is simulated for arange of bubble volume fractions ebubbles and therefore indirectly for a range of Reynolds numbers Re. Allsimulations show chaotic flow dynamics with fast overturn timescales of minutes to hours. The large-scalemixing is inefficient during a single overturn, resulting in a continuously stratified system with respect tobubble volume fraction. The crystal-tracking algorithm provides us with information on the small scales,i.e., 10 cm. On this length scale we observe gathering of different crystals during the overturn that typicallyranges on the order of tens of meters. Thus, a complex crystal population may arise within a singleoverturn. This gathering and dispersal of crystals is strongest and most uniform for high Re. For low Re,crystal populations are characterized by less gathering of crystals that originated from distal portions of themagma body. During the overturn the crystals pass through environments of changing chemical potential.We apply the Damkohler number Da, which compares the crystallization or dissolution to the advectiontimescale. Results show an asymmetry between crystallization and dissolution. Crystallization times aretoo slow during gas-driven overturn to record transient changes in chemical potential. Crystals most likelyonly record their initial as well as their final chemical environment. In contrast, dissolution and advectionrates are of similar order, suggesting potential dissolution during the overturn. On the basis of the resultsfor gas-driven overturn we expect that slower physical mixing processes may be continuously recorded inthe zonation pattern of the crystal phases as long as the changes in chemical potential produce crystalgrowth.
Components: 11,860 words, 9 figures, 2 tables.
Keywords: magma dynamics; magma mixing; gas-driven overturn; crystal tracking; crystal zonation.
Index Terms: 3618 Mineralogy and Petrology: Magma chamber processes (1036); 3620 Mineralogy and Petrology: Mineraland crystal chemistry (1042); 8439 Volcanology: Physics and chemistry of magma bodies.
Received 6 March 2008; Revised 4 June 2008; Accepted 11 June 2008; Published 24 July 2008.
Ruprecht, P., G. W. Bergantz, and J. Dufek (2008), Modeling of gas-driven magmatic overturn: Tracking of phenocrystdispersal and gathering during magma mixing, Geochem. Geophys. Geosyst., 9, Q07017, doi:10.1029/2008GC002022.
G3G3GeochemistryGeophysics
GeosystemsPublished by AGU and the Geochemical Society
AN ELECTRONIC JOURNAL OF THE EARTH SCIENCES
GeochemistryGeophysics
Geosystems
Article
Volume 9, Number 7
24 July 2008
Q07017, doi:10.1029/2008GC002022
ISSN: 1525-2027
ClickHere
for
FullArticle
Copyright 2008 by the American Geophysical Union 1 of 20
1. Introduction
[2] The chemical and textural characteristics ofcrystals [Singer et al., 1995, Zellmer et al., 2003;Ginibre et al., 2004; Humphreys et al., 2006;Morgan et al., 2007; Davidson et al., 2007;Ruprecht and Worner, 2007] suggest complexmagmatic histories for many volcanic centers[Davidson and Tepley, 1997; Bachmann et al.,2002; Vazquez and Reid, 2004]. Such case studieshave shown that this heterogeneity in the crystalsemerges from the in situ mixing of magmaticadditions in the shallow crust [Knesel et al.,1999; Tepley et al., 2000; Couch et al., 2001;Coombs and Gardner, 2004] and/or during erup-tion [Cioni et al., 1995].
[3] A quantitative understanding of the emergenceof crystal-scale heterogeneity has still to be devel-oped. The chemical and textural informationrecorded in a crystal is a competition between therate at which the crystal travels through regions ofdistinct chemical potential, and the rate at whichthe crystal can respond to those changes throughcrystallization or dissolution.Wallace and Bergantz[2005] have developed a method to identify groupsof crystals that have shared some commonresidence history. However, their approach didnot allow one to connect specific rates and pathsof crystal transport with the rates at which crystalscan respond to changes. Our objective is toexemplify the styles and scales of crystal dispersaland gathering to understand the controls andconsequences of magma chamber dynamics asexpressed in the crystal cargo.
[4] All physical processes that promote efficientlarge-scale mixing require advective mass flux,which is a mechanism for both stretching (whichreduces diffusive length scales) and redistribution.Gravitational instabilities provide one of the pri-mary mechanisms for mixing in systems withunstable stratification arising from thermal, com-positional, or phase segregation driven buoyancy[Jellinek et al., 1999]. One example is Rayleigh-Taylor instabilities such as dripping dense crystallayers [Marsh, 1988; Bergantz and Ni, 1999],superposition of silicic and/or cold magma overmafic and/or hot magma [Oldenburg et al., 1989;Snyder and Tait, 1996; Folch and Martı, 1998;Snyder, 2000; Bergantz and Breidenthal, 2001;Couch et al., 2001] or the injection of replenishingmagma [Jellinek et al., 1999; Jellinek and Kerr,1999; Phillips and Woods, 2001; Longo et al.,2006].
[5] All these models resolve some features of thelarge-scale or averaged behavior of the mixingprocess such as the bulk changes of temperatureor redistribution of a gas bubble fraction. Multi-phase continuum models can calculate mass andenergy fluxes, and this is an essential first step inilluminating how distinct regions of temperature orcomposition of a magma system emerge, mix anddecay. However, the progressive, transient paths ofindividual crystals and the local conditions that arerecorded on the crystal-scale cannot be resolvedwith these methods alone. The emergence andevolution of different crystal populations can onlybe deduced by combining ‘‘smart crystals,’’ whichare Lagrangian tracers, with the temporally chang-ing conditions for the magma chamber. Thesetracers are like flight recorders in the way theycan probe for information at the crystal scale, andare also fully coupled physically to the flow, and sothey are not simple passive tracers. This approachhas been used extensively in engineering problems[e.g., Derksen, 2003], in which particles aredynamically responding to the local body andsurface forces, and are not just tracers followingthe motion.
[6] Our aim is to investigate how much diversity inindividual crystal zoning and crystal populationscan arise from a simple kinematic template: onecycle of overturn associated with degassing from avesiculated mafic magma that has intruded into amore silicic layer. To do this we examine thetrajectory of neighboring crystal pairs after a cycleof overturn and how their transport producesregions of homogeneity and heterogeneity in acrystal population. Mixing associated with volatileexsolution from a recharging magma has beensuggested as a potentially important process[Eichelberger, 1980]. The physical nature of suchgas-driven mixing and overturn has been investi-gated with analog [Phillips and Woods, 2001],analytical [Bergantz and Breidenthal, 2001], andnumerical techniques [Longo et al., 2006].
2. Physical Model of Magma Mixingand Crystal Tracking
[7] Our objective is to explore the transport andzoning of crystals in a single episode of magmachamber overturn. Our numerical model describesthe compositional mixing/hybridization caused bya gas-rich magma underlying a bubble-freemagma, a condition suggested to arise in nature
GeochemistryGeophysicsGeosystems G3G3 ruprecht et al.: modeling of gas-driven magmatic overturn 10.1029/2008GC002022
2 of 20

[e.g., Eichelberger, 1980; Pallister et al., 1992;Nakamura, 1995]. This is a useful end-member formagma chamber overturn because it is likely oneof the fastest, naturally occurring instabilities withrespect to instability growth and overturn comple-tion due to the large density variations between thegas bubbles and the magma. In our simulations webegin with a fixed bubble volume fraction in thebubble-bearing magma which is intrinsically un-stable. Hence we do not attempt to model thecomplex and poorly understood paths to progres-sive vesiculation. Natural recharge events willlikely have a range of mass flux and exsolvedbubble-volume fraction. Our aim is not to modelany particular recharge event but to explore thedynamics associated with a geologically reason-able, but end-member set of conditions.
[8] All simulations were performed under isother-mal conditions because we assume that the time-scale of advection of enthalpy by the overturningprocess is much faster than any other heat transferprocess. Thus, we ignore processes such as sec-ondary nucleation and additional gas exsolution.We simplify the natural system by assuming anidentical solid and liquid composition for thebubble-free and the bubble-bearing magmas. Thus,viscosity variations arising from temperature andcompositional dependence, phase transitions andbubble coalescence are ignored. In our modelviscosity differences only emerge from the varying
content in bubbles. In natural systems these vis-cosity variations may alter the kinematic templatesignificantly and further studies including thosecomplexities will be necessary. However, to beable to assess the individual effects of viscosityand initial density contrast we need to considerthese effects separately to make progress in under-standing the dynamics of magma-magma interac-tion on the bulk and the crystal scale. Thus, wehave focused on a simple but geologically signif-icant end-member.
[9] To resolve the complex multiphase character ofnatural magmas, we have divided the system intotwo parts each of which resolves different scales.The first and largest scale is calculated with amultiphase finite-volume approach [Patankar,1980; Gidaspow, 1994] for a carrier phase (silicatemelt plus ‘‘background’’ crystals) and a dispersedphase (bubbles). We assume that the ‘‘back-ground’’ crystals are passively advected by themelt [Aref, 1990], thus treating the carrier phaseas a virtual single phase whose properties can becalculated using mixture theory [Burgisser et al.,2005]. We subsequently refer to this melt andcrystal mixture as the magma phase. For sufficientlysmall crystal volume fractions, melt and magmaviscosities are of similar order of magnitude(Table 1). Hence, the crystals have little effect onthe kinematic template established by the fluidmotion. We employ a form of the MFIX [Syamlalet al., 1993] multiphase fluid code that we havemodified for magma conditions. Dufek andBergantz [2005, 2007] used a similar approach toinvestigate flow dynamics in a magmatic conduitand in a pyroclastic flow. The simulation tracks thevolume fractions of the silicate melt-crystal mixtureand the gas bubbles in a magmatic system that is200 m wide and 100 m high. Different aspect ratioswere not considered here. Varying aspect ratios canhave a significant effect on the mixing dynamics,which is discussed as part of the overall mixingdynamics below. The width of the model waschosen to ensure that the boundaries are not affect-ing the flow and the width is greater than severalwavelengths of the examined Rayleigh-Taylor typeinstabilities that dominate the most active period ofthe flow.
[10] For all multiphase fluid dynamics simulationsthe initial conditions are a 60 m thick bubble-freemagma overlying a 40 m thick bubble-bearingmagma. The physical properties are given in Table 1.Six simulations were performed, where the onlydifference was the bubble volume fraction, ebubbles
Table 1. Physical Properties and Model ParametersUsed in the Simulations
Description Parameter Value
Magma viscosity mmagma 104 Pa sa
Particle density rparticle 2800 kg m!3
Melt density rmelt 2400 kg m!3
Bubble density rbubbles 600 kg m!3b
Bubble-bearinglayer thickness
h 40 m
Bubble diameter fbubbles 10!3 mParticle diameter fparticle 10!3 mBubble volume fraction ebubbles 0.02, 0.05,
0.1, 0.2, 0.3, 0.4Critical bubblevolume fraction
ecp 0.5
Cell resolution(vertical and horizontal)
0.4 m
aResembles most intermediate to silicic melts [Scaillet et al., 1998].
Following equation (3) and a volume balance between crystals andmelt, we can calculate the effective melt viscosities. For commoncrystal volume fractions of 0 to 0.25 in arc magmas the effective meltviscosity remains of the same order and ranges from 7.4 to10" 104 Pa s.
bSimilar bubble density taken as for Pinatubo dacite [Gerlach et al.,
1996].
GeochemistryGeophysicsGeosystems G3G3 ruprecht et al.: modeling of gas-driven magmatic overturn 10.1029/2008GC002022ruprecht et al.: modeling of gas-driven magmatic overturn 10.1029/2008GC002022
3 of 20

of, the lower bubble-rich layer. The lowest bubblevolume fraction was 0.02 and the highest was 0.4.
[11] The boundaries of the system are subject tono-slip for the bottom and top wall and free-slipconditions for the sidewalls. Thus, the velocitiesfor all phases approach zero on the horizontalboundaries, while the velocity gradients approachzero on the sidewalls:
vbottom # vtop # 0; $1%
dv
dx
! "
east
# dv
dx
! "
west
# 0: $2%
These conditions are appropriate for a magmasystem that is sill-like andmay continuehorizontally.
[12] Bubbles are modeled as rigid spheres implyingthat bubble surface tension exceeds viscousstresses from fluid motion. Analog conduit experi-ments performed by Namiki and Manga [2006]demonstrated that even under conditions of highmagmatic viscosity and high shear rates, likevolcanic conduits during an eruption, bubblesmaintain their spherical shape.
[13] The within-phase bubble viscosity mbubbles,which is the drag of the bubbles by the otherbubbles, is modeled using the relationship by[Beckermann and Viskanta, 1993]
mbubbles # mmagma 1! ebubblesecp
! "!2:5ecp; $3%
where ecp is the closed packing bubble volumefraction and mmagma the dynamic magma viscosity.
[14] Once the dynamics of the overturn have beensolved (as shown in Figure 1), the so-called smartcrystals, or crystal recorders are imbedded in theflow.1 In this step 20,000 crystals are randomlyseeded throughout the magma system and theirprogress is tracked. The motion of the particles iscalculated using the particle motion model ofBurgisser et al. [2005]. The Bassinet-Boussinesq-Oseen (BBO) equation describes the force-balancefor spherical particles [Maxey and Riley, 1983]. Formost applications only the drag and body forces areof importance [Burgisser et al., 2005]. In this casethe horizontal and vertical component of the accel-
eration for each crystal can be calculated from thelocal melt velocity field, respectively, by
dvidt
# f
tvui ! vi$ %
2rp2rp & rf
!
; $4a%
dvidt
# f
tvui ! vi$ %
2rp2rp & rf
!
& g2rp ! 2rf2rp & rf
!
; $4b%
where vi and ui are the crystal and melt phasevelocities, respectively, and g, rp and rf are theacceleration due to gravity, crystal density and meltdensity, respectively. The magma velocity from themultiphase fluid model is used to approximate themelt phase velocity. As noted earlier, for suffi-ciently small crystal volume fractions this approx-imation is valid, because crystal-crystal interactionis limited [Burgisser et al., 2005]. FollowingBurgisser et al. [2005] the drag coefficient f andthe particle response time tv are defined as
f # 1& 0:15Re0:687p & 0:0175
1& 42500Re!1:16p
# $ ; $5%
tv #rp ! rf
# $
f2
18m; $6%
with ReP, f and m being the particle Reynoldsnumber, particle diameter and the dynamic magmaviscosity, respectively.
[15] The particle Reynolds number ReP, whichdescribes the kinematics of the flow regime of amelt around a particle, is given as
Rep #UTfu
; $7%
where UT is a reference velocity taken here as theterminal fall velocity is and u is the kinematicmagma viscosity.
[16] We only track one size of crystals (1 mm) inour tracer calculations. In a scaling study onigneous processes Burgisser et al. [2005] showedthat for conditions in a magma chamber with highmelt viscosity and small particle size, the crystalresponse time is much shorter than the timescale offluid motion. Hence, crystals closely follow thefluid flow. The particle response time, despite itsquadratic dependence on crystal size (equation (6)),is on the order of nanoseconds. Thus, a single
1Auxiliary materials are available in the HTML. doi:10.1029/2008GC002022.
GeochemistryGeophysicsGeosystems G3G3 ruprecht et al.: modeling of gas-driven magmatic overturn 10.1029/2008GC002022
4 of 20

crystal size is sufficient to track any crystal pathsduring the overturn.
[17] Equations (4) through (7) provide the frame-work to determine the trajectory of each crystalwithin the developing flow. The velocity field ofthe melt at the position of the crystal is interpo-lated on the basis of the calculated velocity valuesat the control volume interfaces. In the presentmodel 20,000 Lagrangian particles distributedrandomly over the entire magma chamber werefollowed for the simulation with ebubbles = 0.1 andebubbles = 0.3, respectively (Figure 1). Crystalmotions are calculated until the major overturnhas ceased and the average crystal velocities areless than 0.08 mm s!1.
3. Results: Overall Mixing Dynamics
[18] Given our initial conditions where there is adensity gradient that is opposite to the pressure
gradient, a Rayleigh-Taylor (R-T) instability forms.The governing parameters describing the evolutionof an R-T instability are the Atwood number A[Ramaprabhu and Andrews, 2004], and the viscos-ity ratio ml/mu of the lower layer ml and the upperlayer mu, respectively [Ramberg, 1981, Table 2].The viscosity ratio is required because the Rey-nolds numbers are not high enough to ensure thatthe motion is fully turbulent with a loss of memoryof initial conditions. Hence, the flow is not self-similar. The Atwood number describes the dimen-sionless density ratio of the two layers where
A # ru ! rl$ %ru & rl$ % ; $8%
and ru and rl refer to the density of the upper andlower layers, respectively. Much work has focusedon systems with large values of A [e.g., Youngs,1984]. In contrast, a more recent study by Linden
Figure 1. Different stages in the overturn of a lower, bubble-rich layer for an initial ebubbles = 0.1. Colors indicate
ebubbles. White and black Lagrangian crystals refer to initially bound to the bubble-rich and bubble-poor layers,respectively. Symbols are bigger than the crystal diameter of 1 mm. Initial conditions are a 60 m thick bubble-poorlayer overlying a 40 m bubble-bearing layer. East and west boundaries are free-slip, while top and bottom boundariesare nonslip. Physical properties are given in Table 1. The transient overturn is showing different generations ofplumes rising through the chamber until '1000 s. The simulation is terminated after 3225 s. A stable stratified systemhas developed, and average crystal velocities are smaller than 0.08 mm s!1. Auxiliary material Animations 1 and 2show the entire simulation. Animation 1 omits displaying the ‘‘smart’’ crystals to improve the visibility of thedynamics in the multiphase simulation.
GeochemistryGeophysicsGeosystems G3G3 ruprecht et al.: modeling of gas-driven magmatic overturn 10.1029/2008GC002022
5 of 20

and Redondo [1991] employed an experimentalapproach to investigate a Rayleigh-Taylor instabil-ity in a system with low values of A, which aresimilar to values of A found in shallow magmaticsystems. In our study A ranges from 2 " 10!3 to1.8 " 10!1.
[19] Following Chandrasekhar [1961] and given Aand the average kinematic viscosity of the system uwe can predict the characteristic wavelength lm ofthe main plumes generated from the R-T instabilityusing
lm # 4pu2
gA
! "1=3
; $9%
u # mmelt & ebubblesmbubbles & 1! ebubbles$ %mmelt$ %rmelt & ebubblesrbubbles & 1! ebubbles$ %rmelt$ % : $10%
[20] The energy and timescale of the overturningmotion is directly related to ebubbles. Hence weconsidered six different bubble volume fractionsranging from 0.02 to 0.40. The observed timescalesdecrease for increasing ebubbles with the exceptionof the simulation with the largest bubble volumefraction. In the case of ebubbles = 0.4 the timescale isincreasing, because the initial instability containsso much potential energy that the system over-shoots. The viscosity is not capable of damping theoverturn significantly and after the main overturnhas ceased small waves are traveling through thesystem, keeping the average crystal velocitiesabove our termination criterion for the simulation.The wavelength also has a minimum for ebubblesbetween 0.2 and 0.3 after which the kinematicviscosity increases dramatically. Therefore, thecharacteristic wavelength of the overturning mo-tion increases again for large-bubble volume frac-tions. The maximum system-wide Reynoldsnumber (Re) for each simulation varies from 15
to 364, respectively (Table 2). It is calculated onthe basis of the velocity approximation vinstability forparticle-laden blobs [Nitsche and Batchelor, 1997]and the diameter L of the largest plume that crossesa plane at 45 m height [Nitsche and Batchelor,1997]:
Re # vinstabilityL
umagma; $11%
vinstability #rinstability ! rmagma
# $
gL2
3mmagma
mmagma & minstability
mmagma &3
2minstability
;
$12%
where rinstability and minstability are the mean densityand viscosity of the particle-laden blobs. Here, weconsider the bubbles as a separate dispersed phaseof the magma, while crystals and melt arecombined together as the virtual single phase.Although differing by up to one order of magnitudefor the lowest bubble volume fractions from theexpected values presented in the previous section,Re numbers still fall into the regime of transitionalflow: not fully turbulent but unsteady. Allthe simulations produced a fast overturn: less than3 hours (Table 2), with a complex dynamictemplate composed of an incomplete spectrum ofeddy sizes in this transitional flow regime.
[21] Changing the aspect ratio or the volume ofbubble-bearing magma has an immediate effect onthe Reynolds number of the system, thus affectingthe overturn timescale. Increasing the height of themagma system would increase the transient over-turn timescale.
[22] Figure 1 shows a typical simulation through-out a cycle of overturn. Youngs [1984] describedthe mixing process in the fully turbulent regime bythree evolutionary stages. Although turbulent con-
Table 2. Atwood Number A, Density Ratio, Viscosity Ratio, Reynolds Number Re, Overturn Timescale, andWavelength
ebubbles A rl/ru ml/mu Rea Reb toverturnc (hours) lmd (m)
0.02 0.008 0.985 1.001 92 15 2.13 77.90.05 0.019 0.963 1.007 146 52 1.60 57.70.10 0.039 0.925 1.032 206 104 1.13 46.50.20 0.081 0.850 1.179 291 364 0.83 39.20.30 0.127 0.775 1.643 356 344 0.80 39.50.40 0.176 0.700 3.591 412 355 0.99 52.6
aPredicted values after Linden and Redondo [1991].
bObserved Re number for simulation, calculated from Nitsche and Batchelor [1997].
cTime until average velocity of ‘‘smart’’ crystals is smaller than 0.08 mm/s.
dPredicted wavelengths after Linden and Redondo [1991].
GeochemistryGeophysicsGeosystems G3G3 ruprecht et al.: modeling of gas-driven magmatic overturn 10.1029/2008GC002022
6 of 20

ditions are not likely to occur in silicic magmaticsystems, the same growth stages could be recog-nized. A complete video of this simulation can befound in the electronic supplementary data. Initially,the instability grows exponentially until thecharacteristic wavelength lm emerges. Results forpredicted lm ranging from 39.2 m and 77.9 m(Table 2) are in good agreement with our initialcondition requiring the generation of multipleplumes in the 200 m wide system. Observed wave-lengths are of similar order. This length scaledominates the second evolutionary stage, in whichthose plumes rise undisturbed to about lm/2. Sub-sequently, the plume head grows in width byentrainment and the associated vortical circulationinfluences the neighboring plumes causing theirinternal structure to become increasingly morecomplex. In addition, local Kelvin-Helmholtzinstabilities develop along the interface of therising plume. These instabilities generate eddiesbetween the upward moving lighter melt-bubblemixture and the downward moving magma. Allthese interactions temporally and spatially causestretching and translation.
[23] Once the bubble-rich plumes reach the top,they spread out and create a layer of bubble-richmagma. While the main plumes move upwardthrough the system, a second wave of smallerplumes with a range of length scales emerges fromthe remaining bottom layer. Plume generationcontinues until the initial bubble-rich layer atthe bottom is consumed. Similar behavior wasdescribed by Bergantz and Ni [1999].
[24] The process of convective overturn creates agradually stratified magma chamber overlying bub-ble free magma. The first wave of plumes producesthe largest eddies and is most efficient in mixing inmagma of the overlying bubble-free layer. Theyentrain and deform large volumes of the overlyingmagma that get stretched and redistributed bysubsequent smaller plumes. This stirring associatedwith stretching and redistribution leads to localhomogeneity in the progress toward a gradualvertical stratification. Finally, this gradual stratifiedlayer becomes increasingly concentrated in bubblesat the top, while the bubbles continue to riseseparately or in small bubble trains. We do notobserve an increase in bubble volume fractionwithin the top layer beyond its initial volumefraction. As mention earlier, our model ignoresbubble coalescence, which results in a maximumrise speed of the bubbles equal to the terminal risevelocity of 10!1mm/s for the 1 mm large bubbles.This limits the vertical accumulation of bubblesover the short timescale of this transient overturn.
[25] Figure 2 represents the temporal evolutionshown in Figure 1 in a more compact form. Onecan recognize the temporal evolution from insta-bility growth, the subsequent dynamic mixing byoverturn, to the final stratification. The two end-member simulations are shown in Figure 2. In thesmall Re case (ebubbles = 0.02) multiple pulses ofplume generation are shown within the time seriesof horizontally averaged ebubbles. In the high Recase (ebubbles = 0.4) several plume generationevents are also present, but occur at a higher
Figure 2. Horizontally averaged bubble volume fraction evolution as a function of time. The overturn ischaracterized by three stages: a buildup of the instability, the transient and chaotic upward transport of the bubble-bearing magma, and the damping of the overturning motion that creates a stratified magmatic system. (a) Low Renumber case for bubble volume fraction of 0.02. The transient mixing dynamics occur on a timescale of 103 s.(b) High Re number case for bubble volume fraction of 0.4. The transient mixing dynamics occur on a timescale of102 s. Note the different time axes for the two time series. Auxiliary material Animation 1 shows how Figure 2 isgenerated from Figure 1.
GeochemistryGeophysicsGeosystems G3G3 ruprecht et al.: modeling of gas-driven magmatic overturn 10.1029/2008GC002022
7 of 20

frequency and are therefore not as well defined bythe horizontal averaging used in Figure 2. Addi-tionally, for small bulk Re numbers (i.e., smallbubble volume fractions) the zone of stratificationis smaller than for large Re numbers (Figure 2). Inthe high Re case more of the bubble free magma isdragged into the vortices of the plumes, thus moreefficiently mixed into the bubbles-bearing magma.Bergantz and Ni [1999] presented similar results onthe sedimentation of dripping crystal-bearingplumes in viscous fluids. It was confirmed thatfor high-viscosity fluids (low Re) the mixing effi-ciency was much smaller than for low-viscosityfluids (high Re).
[26] The overturning process produces mixing ofthe bubble-free and the bubble-bearing layers.Several approaches have been used to quantifythe efficiency of the mixing, such as variousstatistical measures of the progressive change ofthe concentration field during the mixing process[Oldenburg et al., 1989], changes in the interfacelength [Ottino, 1990] and the change in potentialenergy of the system [Linden and Redondo, 1991].We adopt a slightly modified version of this latterapproach [Jellinek et al., 1999]. The mixing effi-ciency, E, is an expression for the vertical stratifi-cation, or gradient, of a mixed quantity at the endof overturn [Linden and Redondo, 1991]:
E #Pf ! Pmin
% &
Pmax ! Pmin$ % ; $13%
Pf #Z
H
0
g rmelt ! r z$ %$ %zdz; $14%
where Pf is the integrated potential energy of thestratified system. Pmin and Pmax correspond to nomixing where the two layers exchange positionwithout mixing, and complete mixing, where themixture composition is the same everywhere.Mixing efficiency is generally low for this fixedvolume system, resulting in a stratified system. Thesimulation with the highest bubble volume fractionreaches a mixing efficiency of 0.45. Low mixingefficiencies for the magmas imply an equally lowmixing efficiency for crystals that are dispersed inthe flow, since for a fast overturn process and smallcrystal diameters, crystals will have a Stokesnumber [Burgisser et al., 2005] much less thanunity and so simply follow the flow. However,
since there is some mixing present, it is of intereston which length scales the crystal gathering anddispersal is observed.
4. Linking the Dynamics of CrystalGathering and Dispersal to GeologicalObservations
[27] Crystal gathering and dispersal is a function ofthe strain associated with the redistribution andstretching during the mixing process [Kellogg andTurcotte, 1990]. During strain accumulation for a2-dimensional system a circle with radius a0 isdeformed into an ellipse with a long and a shortaxis of length ai, where i refers to the two perpen-dicular directions. Similarly to a circle, we cancompare the distance between two points that areinitially separated by the distance a0. In mantlemixing studies [Kellogg and Turcotte, 1990;Ferrachat and Ricard, 1998; Coltice and Schmalzl,2006] the change of ai with respect to a0 for thesetwo points has been used to investigate the mantleflow dynamics. The change of ai is commonlyexpressed as the Lyapunov exponent si:
si # limt!1a0!0
1
tln
aia0
! "
: $15%
A system is chaotic and mixing is efficient on thelocal scale if one Lyapunov exponent is positive[Ferrachat and Ricard, 1998]. In contrast, Lyapu-nov exponents equal to zero indicate regularmixing.
[28] The tracked crystals in the simulations aretracers of individual particles and act owing totheir low Stokes numbers simultaneously as tracersof small volumes of magma. Thus, we can use theadvected crystals to estimate the strain ai/a0 and theLyapunov exponent by choosing particle pairs forwhich a0 is sufficiently small. By calculating thedistance a0 between all '2.0 " 108 crystal-crystalpairs ((n(n ! 1))/2 for n = 20,000 crystals) for theirinitial location, we can select those crystal-crystalpairs that are closer to each other than an arbitrarilychosen cutoff distance. We call this cutoff distancethe Maximum Crystal-Crystal Distance (MCCD)(Figure 3). Following equation (15) the MCCDneeds to be as small as possible to determine s forthe local scale. Hence, the limiting factor is statis-tical significance for the number of pairs that fallwithin this distance.
GeochemistryGeophysicsGeosystems G3G3 ruprecht et al.: modeling of gas-driven magmatic overturn 10.1029/2008GC002022
8 of 20
[29] The selection criterion for the statistical anal-ysis of a crystal-crystal pair therefore is
a0 ( MCCD: $16%
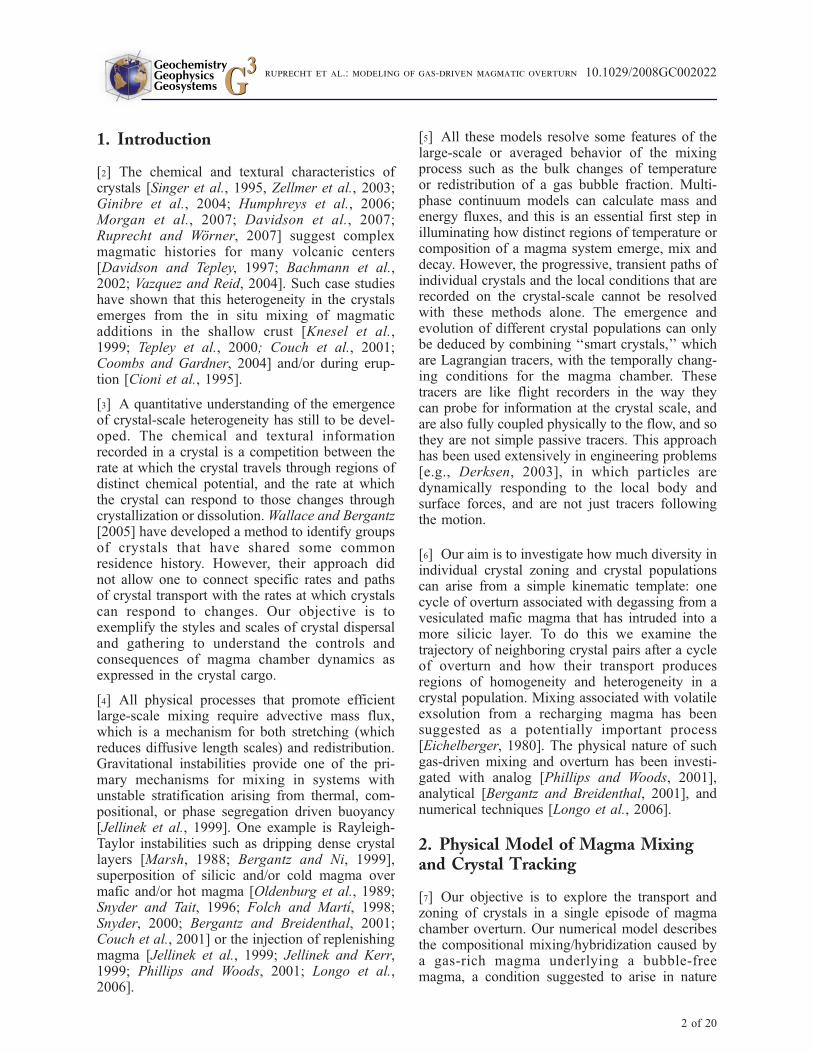
[30] Figure 4 shows the time series of the Lyapu-nov exponent for the simulations with varyingbubble-volume fraction and for a MCCD of 2 m.For the gas-driven overturn with variable bubble-volume fraction the Lyapunov exponents are pos-itive, but several orders of magnitude smaller thans for mantle mixing studies [Coltice and Schmalzl,2006], which may be as high as 105. Values for sin Figure 4 are only minimum estimates, becauseour calculations ignore the possibility of folding.The vorticity that the crystal pair experiences needsto be considered for an exact calculation of themaximum Lyapunov exponent [Wolf et al., 1985].We ignore this effect, because the tracking offolding is computationally expensive and becausewe argue below that a modified version of theLyapunov exponent is a better measure to charac-terize the mixing dynamics of gas-driven overturn.
[31] On the basis of the estimates for Re we knowthat gas-driven overturn is chaotic for the presentedrange in bubble-volume fractions. However,Figure 4 shows that smax asymptotically approacheszero with time, which indicates regular mixing.This disagreement stems from the fact thattransient flows have a finite strain ai/a0. Oncethe potential energy of the initial instability is
dissipated ai remains constant, thus si intrinsicallyhas to approach zero asymptotically. Even so, thecalculated Re at peak strain rates yields a chaoticmixing regime. While for statistically steady buttime-dependent flows, as observed in mantledynamics, a Lyapunov exponent can be calculatedfollowing equation (15), transient flows, whichdominate crustal magma processes, cannotbe characterized very well with the conventionalLyapunov exponent. Therefore, we favor estimatingthe strain over the use of the Lyapunov exponent in
Figure 3. Technique for investigating crystal dispersal and gathering. For each ‘‘smart crystal’’ the distance to allother crystals was calculated and only crystal pairs closer to each other than the Maximum Crystal-Crystal Distance(MCCD) were chosen for the prior-after overturn comparison. The inset represents a subset of crystal locations afterthe overturn. The circles around each crystal represent the 2 m and 5 m MCCD, respectively. In this example, theparticle pairs falling in the dark gray and light gray areas are chosen for a comparison of their location prior to andafter the overturn for the 2 m and 5 m case. Thus, only a subset of the n(n ! 1)/2 crystal pairs are used for theanalysis. We select those pairs for the entire volume as well as 20 m thick layers.
Figure 4. Time series for the maximum Lyapunovexponent s for a0 = 2 m. A positive s indicates chaoticmixing during the transient gas-driven overturn. Oncethat transient signal decays, s also asymptoticallyapproaches zero. For further discussion, see text.
GeochemistryGeophysicsGeosystems G3G3 ruprecht et al.: modeling of gas-driven magmatic overturn 10.1029/2008GC002022
9 of 20

the gas-driven overturn to characterize the dynamicbehavior.
[32] The strain for adjacent particles enables us toconnect the process of gas-driven overturn directlyto petrologic observations. Petrological analysis istypically based on small-sized samples, and oneobjective is to understand how compositional andtextural heterogeneity at that scale reflects a dis-tinct set of dynamic processes at much largerscales. Thus, one must resolve crystal pathsthrough all scales of the flow. By comparingadjacent crystals on the basis of their spacing priorto the onset of a dynamic process such as mixing,and their final spacing after the process has fin-ished, we can estimate the average dispersal andgathering for a given crystal-crystal pair, which isequal to the local strain. This in turn gives anestimate of the volume that is sampled in a singlethin section during a single overturn. While com-monly the strain is calculated on the basis ofinitially adjacent particles, we calculated the strainfrom crystal pairs that are close to each otherAFTER the overturn event. Thus, we can use thesimulations to understand natural examples, inwhich we can only image the final stage. Asdiscussed in section 2, we define the end of thetransient signal as the time when the averagecrystal motion has fallen below 0.08 mm s!1.Therefore, the accumulated strain that we comparefor the different simulations is defined as
strain # a0afinal
; $17%
afinal ( MCCD: $18%
Note the different selection criterion compared toequation (16) that is commonly used to calculatethe Lyapunov exponent. This strain calculated fromthe crystal-crystal pairs is a measure for thegathering strength of the flow and compares theoriginal volume that is tapped during the mixing.For a0/afinal equal to one no differential movementbetween the crystals has occurred, while a valuelarger than one indicates gathering of the crystalsfrom a larger volume.
[33] Ideally, the MCCD should be 3 cm, the scaleof a thin section. However, given 20,000 randomlydistributed tracer crystals over the entire systemrestricts this approach to larger MCCDs, to ensurestatistical significance. A MCCD of 10 cm reducesthe population size to '1 " 104 crystal-crystalpairs. We have chosen seven different MCCDs
with 0.1 m, 0.2 m, 0.5 m, 1 m, 2 m, 5 m, and 10m, respectively. The population size for the largestMCCD (10 m) increases to '6 " 106 crystal-crystal pairs.
[34] To evaluate crystal transport over the entiresystem, we plot the strain accumulation for allcrystal-crystal pairs that meet the selection criterionfor a specific simulation in a cumulative frequencydistribution (CFD) (Figure 5). We choose themedian of the CFD to be the measure of theaverage strain accumulation for all crystal-crystalpairs in that simulation. The larger the median ofthe CFD, the larger is the volume of crystalgathering. Additionally, we choose the slope, cal-culated between the first and third quartile of theCFD, as a measure for the homogeneity of thegathering for all particle-pairs. A large slope indi-cates a homogeneous behavior for the crystal-crystal pairs. In this case, different crystal-crystalpairs are gathered over a large and continuousrange of length scales. In contrast, a large slopeindicates that most crystal-crystal pairs are gath-ered from a volume with similar length-scale. Onlya very minor proportion of crystal-crystal pairs isgathered either from a very small or from a verylarge length scales.
[35] To exemplify the process described above, weapply these concepts of strain accumulation andcrystal-crystal pair homogeneity to four cases ofour simulation runs, thus combining the informa-tion from the bulk multiphase model and thecrystal-tracking algorithm (Figure 5). The runswith a bubble volume fraction of 0.1 and 0.3correspond to the low and high Re numbers inour simulations, respectively. In Figure 5 we com-pare these runs for a small (0.1 m), and anintermediate (1 m) MCCD, respectively. LargerMCCDs have limited value for the connection ofmodeling data with thin section scale observations.In all four cases over 95% of the crystal-crystalpairs have a a0/afinal greater than one. For theaverage particle (median) this gathering rangevaries over one log unit from 101.5 to 102.5 of theirfinal distance. Thus, most crystals with a afinal (MCCD are between 30 to 300 times further apartof each other before the mixing.
[36] Comparing the CFDs in Figure 5 for the lowand the high Re case in more detail reveals aweaker strain accumulation for low Re. This be-havior is observed for large and small MCCDs.The difference in the median of the CFD betweenhigh and low Re case for both MCCDs is '0.15log units, respectively. Additionally, the strain
GeochemistryGeophysicsGeosystems G3G3 ruprecht et al.: modeling of gas-driven magmatic overturn 10.1029/2008GC002022
10 of 20

accumulation increases, for a smaller MCCD. Be-sides the shift to larger medians for small MCCDs,we also observe a decrease in the slope of theCFDs. For small MCCD the distribution gets verybroad, indicating that the crystals experience verydifferent gathering length scales. The largest het-erogeneity in gathering length scales occurs for lowRe and small MCCD.
[37] We have also analyzed these crystal-crystalpairs of the two different simulations (ebubbles =0.1; ebubbles = 0.3) for varying horizontal behaviorof particles for the smallest MCCD (0.1 m) case(Figure 6). The crystal-crystal pairs are divided intofive horizontal layers of 20 m each. Not all layersare shown; instead Figure 6 shows an envelope thatis composed of the CFDs of all five horizontallayers. As expected, the range of gathering dis-played by this envelope varies around the averagevalue for the entire crystal population. For the lowRe case this range is much larger ('0.6 log units)than the range observed in the high Re case ('0.2log units). This discrepancy stems mainly from theinitially bottom layer in the low Re case, whichshows a significantly smaller length scale in gath-ering. Thus, while the kinematic behavior for the
uppermost 80 m is very uniform with fairly smallscatter around the average value, the lowermostbubble-bearing magma shows a different kinematicbehavior. The lowermost 20 m stay more coherentover the course of the overturn then the rest of themagma and are less vigorously mixed.
[38] While the results for 20,000 randomly distrib-uted ‘‘smart’’ crystals show an unambiguous trendof heterogeneous behavior on the bulk and thecrystal scale, they were only applied to two ofthe six simulated ebubbles. The remaining simula-tions with different ebubbles are also analyzed for therelative crystal-crystal pair motion. However, wehave reduced the number of tracked crystals to n =5000, hence minimizing computational time.
[39] These simulations decrease the number ofcrystal-crystal pairs that can be analyzed by afactor of '1/42 ((n(n ! 1))/2 = 1.25 " 107). Thisrequires an increase in the MCCD to the meterscale. In fact, for an MCCD of 1 m we generateonly '3 " 103 crystal-crystal pairs for the statis-tical analysis. For an MCCD of 10 m we have morethan one order of magnitude less crystal-crystalpairs available ('4 " 105) compared to the simu-
Figure 5. Cumulative Frequency Distribution (CFD) curves for populations of particle pairs within thresholdproximity after the mixing event. High and low Re cases refer to ebubbles = 0.3 and ebubbles = 0.01, respectively.
GeochemistryGeophysicsGeosystems G3G3 ruprecht et al.: modeling of gas-driven magmatic overturn 10.1029/2008GC002022
11 of 20

lations with 20,000 crystals. Thus, for these lowerresolution simulations we do not reach a lengthscale that is similar to the length scale of a thinsection. However, in light of the high-resolutionsimulations with 20,000 ‘‘smart’’ crystals, theseadditional simulations expand our understandingfor the simulations with the lowest and highest Renumbers, respectively.
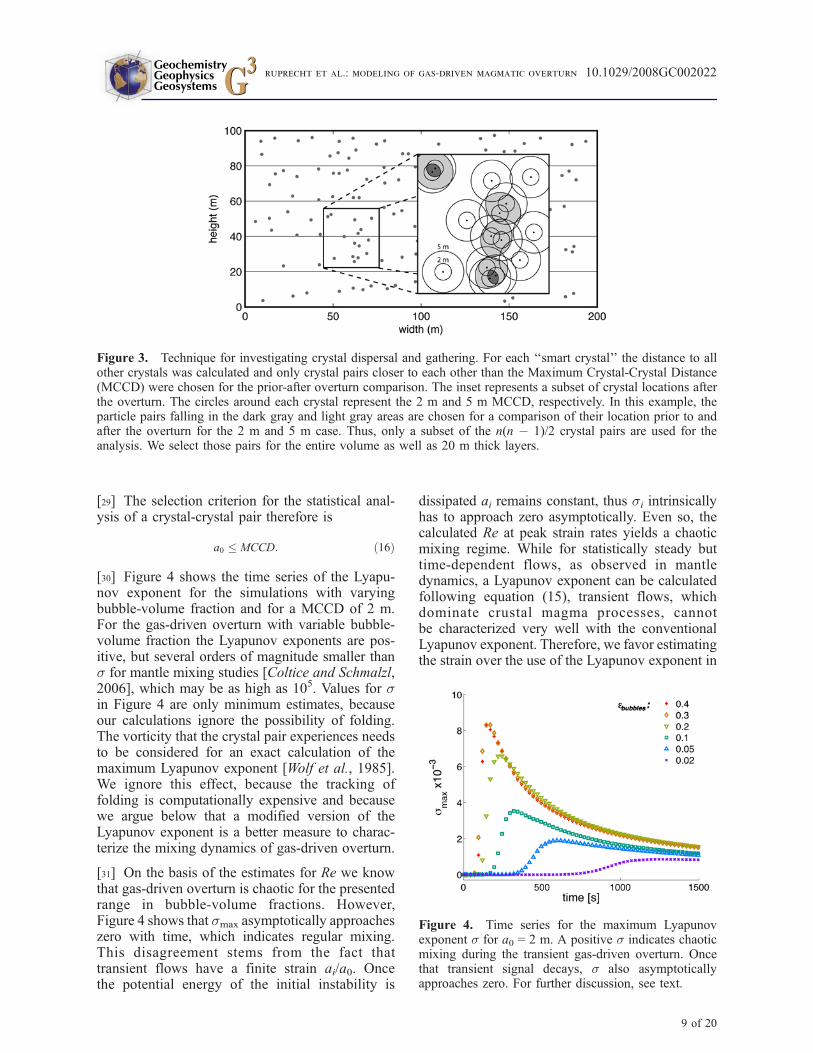
[40] Instead of presenting the results from theadditional simulations with 5000 ‘‘smart’’ crystalsin separate cumulative frequency diagrams, wesummarize all simulations by their strain accumu-lation and their particle population homogeneity(Figure 7). At high Re mixing events are charac-terized by smaller particle population heterogeneityand stronger strain accumulation. Comparing thelarge MCCD (10 m) with the small MCCD (0.1 m)of crystal gathering as a function of changing Renumber reveals a shift from small variations instrain accumulation and large changes in particlepopulation homogeneity to mainly strain accumu-lation dominated behavior. The simulations with5000 ‘‘smart’’ crystals follow the trend of the high-resolution simulations. They also support that sim-ulations with large ebubbles (0.2, 0.3, and 0.4) arevery similar to each other. This is in good agree-ment with the observed Re numbers (Table 2) thatidentify a very similar mixing behavior on the bulkscale. The simulations with low ebubbles are morevariable in their strain accumulation and particlepopulation homogeneity.
[41] Figure 7 also enables us to assess the statisticalrobustness for the small MCCD cases. The results
from the high-resolution simulations with 20,000‘‘smart’’ crystals have very similar values for thestrain accumulation and the particle populationhomogeneity as the simulations with 5000 ‘‘smart’’crystals. The smallest chosen MCCD (1 m) for thesmaller number of ‘‘smart’’ crystals starts to di-verge from the results of the high-resolution sim-ulations. Thus, any smaller MCCD would not bestatistically robust.
5. Discussion
5.1. Length Scale of Crystal Gathering inThin Section
[42] The results from the coupled multiphase-par-ticle tracking simulations show that in a singleoverturn, most crystals that end up in the samesmall-scale volume are gathered over tens ofmeters during one overturn. A significant propor-tion ('20%) of the crystal cargo may have origi-nated from a distance of 100 m or more from eachother. Therefore, a single mixing event is capableof juxtaposing crystals that originated from spatiallydistinct regions of the chamber, and with completelydifferent histories (compositional zoning, textures,etc.). Thus, heterogeneous populations with chem-ical variations and kinked crystal size distributionsare common [Morgan et al., 2007].
[43] Our methodology is also applicable to aclosed-system, in which heat transfer occursthrough the walls. Singer et al. [1995] employedthe dynamic template of quasi-steady overturn as
Figure 6. Cumulative Frequency Distribution (CFD) curves for high-resolution simulations with 20,000 ‘‘smart’’particles. The low Re case (ebubbles = 0.10) on the left is compared with the high Re case (ebubbles = 0.30) on the right.The black line represents the CFD for the entire population; the blue dashed line is the opposite case for comparison.The gray field outlines the variability of CFDs for different horizontal regions in the simulation. The low Re case iscomposed of much more variability; in particular, the lowermost layer (red outline) shows smaller amounts of strainaccumulation.
GeochemistryGeophysicsGeosystems G3G3 ruprecht et al.: modeling of gas-driven magmatic overturn 10.1029/2008GC002022
12 of 20
proposed by Marsh [1988, 1989]. Our simulationswith the lowest bubble-volume fraction might bean appropriate proxy for this case. For ebubbles of0.05 and 0.10, density differences between the twolayers are 3.7% and 7.5%, respectively. The dy-namic viscosity varies by 0.7% and 3.2%, respec-tively (Table 2). These are reasonable for thesluggish closed-system processes. Even at theselow bubble volume fractions, chaotic mixing dom-inates and we expect the crystal cargo to beheterogeneous. This chaotic behavior limits theextent of repeated zoning patterns in crystals ex-periencing cyclical magma overturn in a closedsystem.
5.2. Damkohler Numbers for CrystalGrowth and Dissolution
[44] Crystals that are transferred to a differentchemical environment by convective motion mayreact to those changes in chemical potential bydissolution or crystallization. However, the recordof this transport may be incompletely preserved in
the crystals. How much of this data is recorded is acompetition between the reaction and transporttimescales. For example, at the fastest transportrates, during the ascent in a conduit, it has beenshown that the crystal recorder is too slow torecord the transient changes [Kerr, 1995]. Tounderstand fully the interplay between crystal re-sponse time and transport time requires a kineticmodel for crystal nucleation, crystal growth and/orresorption. Our knowledge of nucleation, crystalli-zation and resorption under magmatic conditions islimited [Hersum and Marsh, 2007]. Severalauthors [Dowty, 1980; Cashman, 1990; Larsen,2005] have compiled existing experimental dataon nucleation and growth kinetics and data oncrystal growth inferred from crystal zoning studies.These compilations include results from simplebinary systems, e.g., growth kinetics in the systemof albite-anorthite solid solution, as well as frommulticomponent systems resembling closer naturalmagma compositions. Larsen [2005] reports arange for crystal growth rates G from 10!1 mms!1 to 10!11 mm s!1. The largest growth rates have
Figure 7. All population CFDs are represented with their median and a slope calculated using the first and thirdquartile. ebubbles: 0.02 (yellow), 0.05 (cyan), 0.10 (magenta), 0.20 (green), 0.30 (blue), 0.40 (red). MCCD: 10 m(circles), 5 m (diamonds), 2 m (squares), 1 m (circles), 0.5 m (diamonds), 0.2 m (squares), 0.1 m (circles). Graysymbols are runs with 20,000 particles, where ebubbles: 0.10 (dark), 0.30 (light). All other CFDs were calculated for5000 ‘‘smart’’ particles.
GeochemistryGeophysicsGeosystems G3G3 ruprecht et al.: modeling of gas-driven magmatic overturn 10.1029/2008GC002022
13 of 20

only been observed in very simplified systems.Therefore, we focus furthermore on the growthrates G for multicomponent compositions thatrange from 10!6 mm s!1 to 10!11 mm s!1.
[45] Recent results from decompression experi-ments on the 1991 Pinatubo dacite [Hammer andRutherford, 2002], on a synthetic composition ofthe 1996 andesitic Montserrat dome [Couch et al.,2003], and on a synthetic haplogranitic composi-tion [Couch, 2003] suggest maximum plagioclasegrowth rates G on the order of 10!6 mm s!1.Crystallization decompression-induced degassingis viewed as one of the fastest crystallizationmechanisms. Therefore, these growth rates consti-tute a lower time limit on noticeable plagioclasegrowth.
[46] The competition between the reaction time-scale treact, i.e., crystallization or dissolution, andthe transport timescale tad, i.e., advection, can becompared by defining a Damkohler number Da,
Da # tadtreact
; $19a%
Da # toverturntreact
; $19b%
tad #H
gA
! "1=2
; $20%
toverturn # timescale obtained from multiphase simulations;
$21%
treact #d
G; $22%
where tad is the theoretically derived advectiontimescale by Linden and Redondo [1991] andtoverturn is the numerically derived advection time-scale obtained from the overall duration of each ofour simulations (Table 2). This timescale toverturn isthe total time of instability growth, overturn anddamping after the overturn has ceased. Thetheoretical advection timescale tad is a measurefor the time it takes for the mixing region to extendthroughout the fluid. The reaction timescale treact isestimated by the growth rate G and a resolvablelength scale d of crystal overgrowth (d = 1 mm)using an electron microprobe [Ginibre et al.,2002]. For Da ) 1 the advective transport ismuch faster than significant crystal growth.
[47] On the basis of the growth rate G in naturalsystems and the theoretically derived advectiontimescale tad we calculate Da ) 1 (Figure 8a).The Da number ranges over one order of magni-tude for a given crystal growth rate. The lowestestimates of crystal growth rates (G = 10!11 mm s!1)that are inferred from crystal zoning studies resultin Da < 10!6. Decompression and degassing-induced crystallization as assumed for our multi-phase simulations shows Da < 10!1. Even for themost sluggish case with the largest advectiontimescale and the fastest growth rates we find thetad)treact (Da * 0.04).
[48] Considering toverturn as advection timescalecauses Da numbers to be significantly larger(Figure 8b). Let us only focus on the case forcrystal growth rates induced from decompressionexperiments (G = 10!6 mm s!1), since theseconditions are most reflective of our multiphasesimulations for gas-driven overturn. If we choosetoverturn as defined earlier, the time until averagecrystal motions has slowed down to 0.08 mm s!1,we consistently observe Da > 1. However, thisadvection timescale is a maximum timescale byincluding the initial growth of the instability, thetransient overturn, and the final waning of themixing process. A better measure for the advectiontimescale is the transient overturn itself, since thisis the time when extreme variations in chemicalpotential exist. The duration of the transient stageof the overturn is on the order of 102 to 103 s(Figure 2). This advection timescale is still morethan one order of magnitude larger than tad obtainedfrom linear theory. The resulting Da number rangesfrom 10!1 to 1 for large and small ebubbles, respec-tively. Thus, under this assumption the advectionand the reaction timescale are of similar order forsmall density differences (i.e., A * 0) between thebubble-free and the bubble-bearing magma.
[49] In summary, we find that for magma overturndue to large density differences (i.e., ebubbles + 0.2)existing crystals record only their initial and finaldisequilibrium environment. They may not recordthe short-lived extremes in intensive variables thatdrive mixing or overturn. Once the transient over-turn has ceased, bubbles and crystal may settle totheir neutral buoyancy level. During the settlingcrystals may record the change in chemical poten-tial associated with the observed stratification. Fora natural system, in which bubble-rich andesiterecharge mixes with a more evolved magma,crystals would potentially be normally zoned.
GeochemistryGeophysicsGeosystems G3G3 ruprecht et al.: modeling of gas-driven magmatic overturn 10.1029/2008GC002022
14 of 20

[50] For very sluggish system with small densitydifferences crystal growth and magma mixing areof similar order of magnitude. In this case crystalgrowth is not negligible during the overturningprocess.
[51] In contrast to crystal growth, crystal dissolu-tion may, even for large ebubbles, more faithfullykeep pace during the transient part of the gas-driven overturn (Figure 9). Dissolution rates GDis
for natural melt compositions based on experimen-tal data [Donaldson, 1985; Zhang et al., 1989] anddissolution models [Liang, 2000, 2003] are on theorder of 10!4 to 10!6 mm s!1. Thus, analogous tothe discussion about crystal growth during gas-driven overturn we calculate Da + 1.
[52] The effects on the Da number caused byprocesses that may slow down the dissolutionprocess can only be discussed qualitatively. Param-eters that influence the dissolution rate are thedissolution mechanism, melt viscosity and meltcomposition [Shaw, 2006]. In particular, the disso-lution mechanism, which is a competition between
interface-controlled and diffusion-controlleddissolution, has strong effects on the dissolutionkinetics. While interface-controlled growth maycomplicate the dissolution kinetics [Shaw, 2006],it has been reported that for highly viscousmelts dissolution is generally diffusion-controlled[Jackson and Mills, 1997]. Therefore, we willfocus our discussion on diffusion-controlled disso-lution. A complete discussion on dissolution ratesand dissolution mechanisms can be found in thereview by Edwards and Russell [1996] as well asin the paper by Shaw [2006].
[53] Diffusion-controlled dissolution results in atime-dependent dissolution rate [Zhang et al.,1989] and the progress of a dissolution front ddiscan be estimated by [Liang, 2000, 2003]:
ddis # 2aD1t$ %1=2 ; $23%
where a and D1 are the dimensionless diffusionparameter and the diffusion coefficient of compo-nent 1 in the liquid, respectively. Dissolutioncalculations are generally performed for a =
Figure 8. Damkohler number Da for crystal growth plotted versus bubble volume fraction (ebubbles). For Da ) 1advection is faster than crystal growth. (a) Da numbers using the theoretical advection timescale after Linden andRedondo [1991] compared to two different growth rates G of 10!6 mm s!1(D) and 10!11 mm s!1(O), respectively.(b) Da numbers for the numerically derived advection timescale and reaction timescale from decompressionexperiments. The advection timescale presented in Table 2 (X) combines the initiation of the instability, the overturn,and the damping after overturn until average crystal movement has decreased below 0.08 mm s!1. Considering onlythe transient overturn (+) reduces the Da numbers by an order of magnitude. (D) as in Figure 8a.
GeochemistryGeophysicsGeosystems G3G3 ruprecht et al.: modeling of gas-driven magmatic overturn 10.1029/2008GC002022
15 of 20

!0.4 [Liang, 2003] and D1 between 10!11 m2 s!1
and 10!14 m2 s!1 (D1 taken from Watson [1994]).
[54] A more detailed examination of the diffusionprocesses [Zhang et al., 1989, Liang, 2003] showsthat the dominating dissolution rates are close tothe lower limit (GDis = 10!6 mm s!1) of thereported range. The dissolution rate limitingparameters are the diffusion coefficient for thecomponents of the crystal and the nonlinear be-havior of equation (23) (ddis ' t1/2). FollowingLiang [2003] the dissolution process is limited bythe slowest diffusing component in a multicompo-nent system, thus small diffusion coefficients (D1 =10!14 m2 s!1) have the largest impact on thedissolution kinetics. Additionally, considering thedissolution rate over time we observe the highestdissolution rates only in the first few seconds ofdissolution. This short time interval is insufficientto significantly dissolve the crystal. Within 102 sthe overall dissolution rate falls off by a factor of
101.5. Thus, the effective dissolution rate for pro-cesses on the order of 102 s to 103 s, which weinvestigate in our multiphase simulations, is prob-ably on the order of 10!5 mm s!1 to 10!6 mm s!1
and Da * 1 (Figure 9).
[55] These results for the Da number indicate thatcrystal resorption will be limited to the crystaledges; anhedral to subhedral crystal textures willdominate the crystal cargo. These results are ingood agreement with results on convective crystaldissolution by Kerr [1995] for convective motionin a magmatic dyke. Complete dissolution ofcrystals is unlikely. Instead, partial dissolution willoccur because of the similar order of magnitude foradvection and dissolution.
5.3. Crystallization and Dissolution DuringTemperature-Driven Convection
[56] While gas-driven convection is characterizedby a tight competition between advection and
Figure 9. Damkohler number Da for crystal dissolution plotted versus bubble volume fraction (ebubbles). For Da > 1,crystal dissolution is taking place during magmatic overturn. The preferred region of Da numbers (solid lines) is *1for all ebubbles, indicating a tight competition between dissolution and advection. It is calculated for advectiontimescale obtained from the transient overturn stage and dissolution rates GDis from 10!5 mm s!1 to 10!6 mm s!1.Minimum estimates (dashed lines) for Da are based on slow dissolution rates (10!6 mm s!1) and as well as tad.Maximum estimates (dashed-dotted lines) for Da are calculated for the fastest dissolution (10!4 mm s!1) and theoverturn timescale from Table 2.
GeochemistryGeophysicsGeosystems G3G3 ruprecht et al.: modeling of gas-driven magmatic overturn 10.1029/2008GC002022
16 of 20

crystal reaction rates, advection timescales fortemperature-driven convection are much slower.This causes crystal reaction rates to be orders ofmagnitude faster than advection rates. Our modelfor gas-driven convection assumes an instanta-neous density inversion, which causes fast convec-tion even for small ebubbles and Da close to 1.Temperature-driven convection typically assumes aRayleigh-Benard convection cell [Marsh, 1988].There may be heating from below due to under-plating magma, but generally the magma system isgoverned by the conductive cooling through theroof and the sidewalls.
[57] Adopting the dynamic template of Marsh[1988] for temperature-driven convection resultsin large Da numbers between 101 and 106. Anadvective timescale tad of several years can beestimated for this dynamic template using equation(18) of Marsh [1988]:
U # K
HNu2; $24%
tad # H
U; $25%
where U, K, and Nu are the velocity, thermaldiffusivity and the Nusselt number, respectively(For common rock material: K = 10!6 m2 s!1). TheNusselt number relates the total heat transfer Qtotal
through the roof and the sidewalls to the heattransfer for conduction Qcond alone:
Nu # Qtotal
Qcond: $26%
Following Marsh [1988] we assume a maximumNu = 2, since the roof and sidewalls may beinsulated by a solidification front that growsinward toward the center of the magma chamber.The reaction timescale is the same as in equation(22) and varies for the range of observed growthrates in natural systems. As previously notedthe fastest growth rates are typically observedin decompression experiments [Hammer andRutherford, 2002; Couch et al., 2003].
[58] Thus, the sluggish overturn due to temperaturegradients is accompanied by slow growth ratesbetween 10!8 mm s!1 and 10!11 mm s!1 [Singeret al., 1995; Davidson and Tepley, 1997]. The slowremoval of heat through the walls may reduce theeffective undercooling that drives crystallizationand subsequently crystallization itself is sloweddown as well. Nonetheless, even for these slow
growth rates we observe Da , 1. Thus, crystalli-zation kinetics is fast enough to record variouschemical conditions that may persist in the slug-gish behaving magma chamber.
[59] While there is sufficient time for the crystal torecord changes in chemical potential during purelytemperature-related effects, there is also potentiallyenough time for complete crystal dissolution. Fol-lowing the diffusion-controlled dissolution modelof equation (23) we estimate a complete dissolutionwithin days for millimeter-sized crystals. Thiswould suggest that temperature-driven convectioncould completely erase the crystal record. Howev-er, to answer ultimately the question if dissolutionis complete under such conditions we have toconsider the simultaneous change in chemicalpotential. Extensive phenocryst dissolution willdrive the system quickly to smaller degrees ofundersaturation. Therefore, we expect that not thecomplete crystal is dissolved. Instead, small anhe-dral crystals may survive and record a strongdissolution surface between the remaining coreand a significantly different newly growing mantleor rim as seen typically in arc magmas [e.g.,Ruprecht and Worner, 2007].
[60] Eruption triggering recharge events may sub-sequently gather chemically distinct crystal popu-lations and without extensive modification of thecrystal cargo transport this crystal assemblage tothe surface [Spera, 1984; Trial et al., 1992].
6. Conclusion
[61] Crystal-chemical and textural data from igne-ous systems reveal complex open-system behaviorand internal circulation [e.g., Singer et al., 1995;Zellmer et al., 2003; Ginibre et al., 2004]. Ourresults from a simple overturn model with viscos-ities applicable to intermediate and silicic systems[Scaillet et al., 1998] show that this heterogeneitycan even arise from a single overturning event.Multiple overturn events can lead to repeatedgathering and dispersal of crystals and can obscurethe apparent signature of crystals spatially residingtogether in a thin section (2.7 cm). Crystal-isotope-stratigraphy [Davidson and Tepley, 1997; Davidsonet al., 2007] has shown that arc magmas frequentlygather crystals from isotopically very distinct envi-ronments. Gas-driven overturn is a very efficientprocess to facilitate the juxtaposition of crystalwith distinct isotopic signature. On the basis ofour calculations such a population of crystals isgathered over meters to tens of meters within a
GeochemistryGeophysicsGeosystems G3G3 ruprecht et al.: modeling of gas-driven magmatic overturn 10.1029/2008GC002022
17 of 20

single overturn. Therefore, the common path of apair of crystals is probably very limited as has alsobeen observed by Wallace and Bergantz [2005].Systems with small density variations between thetwo mixing magmas have the largest potential forsignificant common path lengths between crystal-crystal pairs. However, even for those small Recases we find this behavior only for a minorproportions of all crystal pairs.
[62] The common result from our multiphase mix-ing simulations (Figures 1 and 2) is not a homo-geneous, but rather a stratified magma body with amaximum in ebubbles on top and a continuousdecrease in ebubbles toward the bottom. Gradientsare inevitable during a single overturn and mixingof the two instantaneously superimposed magmasis inefficient. This is due to the chaotic, notturbulent, flow regime for compositionally inter-mediate magmas. These heterogeneous environ-ments of temperature and chemical gradients canpersist over timescales much longer than the gath-ering timescale for gas-driven overturn, which ison the order of minutes to hours. These results areconsistent with other fluid dynamic studies thatpredict final stratification in case of an instanta-neous R-T instability [Linden and Redondo, 1991,Jellinek et al., 1999]. We do not observe homoge-neity neither on the bulk nor on the crystal scale.Crystals follow closely the fluid flow during gas-driven overturn. Therefore, the stratification inbubble-volume fraction after the overturn reflectsalso a stratification of crystal-origin. Crystals ini-tially dispersed in the bubble-bearing magma aremixed into the bubble-free magma with similarproportions as is the bubble-bearing magma. Amodel that includes bubble coalescence may pro-duce larger extents of differential movement be-tween melt, crystals and bubbles of the rechargingmagma. However, the nonlinear processes of bub-ble coalescence, additional gas exsolution andsecondary nucleation probably further increasethe complex assembly of different crystal popula-tions during the overturn.
[63] Considering the competition of crystal reac-tion rates with the advection rates during theoverturn, we find that gas-driven advection istypically faster than crystal growth but of similarorder in case of crystal dissolution. Thus, thecrystals will not be able to record the actual mixingprocess with all its extremes in chemical potential.Da numbers less than 1 for crystal growth suggestthat they will record only the stages prior-to, andfollowing, the mixing event. In cases where disso-
lution is the response to the changes in chemicalpotential older stages of crystal growth may beerased. These conditions may vary from crystal tocrystal and eventually may be sampled on thelength scale of a thin section. Basically, any mixingwill create a complex crystal population mixtureeven though the cause may be a simple low Reoverturn. We investigated the most simplified sys-tem possible. Assuming mixing of chemically and/or physically different magma batches would con-stitute a much more complex initial condition.Such complex starting scenarios must inheritablyincrease even further complexity observed withinthe crystal population.
[64] For overturning processes that invoke longertimescales such as temperature-driven overturn thecrystal cargo may record even more complex infor-mation, since crystallization rates, and thereforeresponse through crystal growth to the changingenvironment may be faster than physical mixingrates [Singer et al., 1995]. The resulting zonationrecord is likely to be more comprehensive and mayinclude transient physical mixing processes.
Acknowledgments
[65] This work was supported by NSF grants EAR-0440391and EAR-0711551 to G.W.B. and a Chevron Graduate SupportScholarship to P. R. We thank Jon Davidson and Yan Liang forvery helpful and constructive comments on an earlier versionof the manuscript.
References
Aref, H. (1990), Chaotic advection of fluid particles, Philos.Trans. R. Soc. London, Ser. A, 333, 273–288, doi:10.1098/rsta.1990.0161.
Bachmann, O., M. A. Dungan, and P. W. Lipman (2002), TheFish Canyon magma body, San Juan volcanic field, Color-ado: Rejuvenation and eruption of an upper-crustal batholith,J. Petrol., 43, 1469–1503, doi:10.1093/petrology/43.8.1469.
Beckermann, C., and R. Viskanta (1993), Mathematical mod-eling of transport phenomena during alloy solidification,Appl. Mech. Rev., 46, 1–27.
Bergantz, G. W., and R. E. Breidenthal (2001), Non-stationaryentrainment and tunneling eruptions: A dynamic link be-tween eruption processes and magma mixing, Geophys.Res. Lett., 28, 3075–3078, doi:10.1029/2001GL013304.
Bergantz, G. W., and J. Ni (1999), A numerical study of sedi-mentation by dripping instabilities in viscous fluids, Int. J.Multiphase Flow, 25, 307 –320, doi:10.1016/S0301-9322(98)00050-0.
Burgisser, A., G. W. Bergantz, and R. E. Breidenthal (2005),Addressing complexity in laboratory experiments: The scal-ing of dilute multiphase flows in magmatic systemsJ. Volca-nol. Geotherm. Res., 141, 245 – 265, doi:10.1016/j.jvolgeores.2004.11.001.
Cashman, K. V. (1990), Textural constraints on the kinetics ofcrystallization of igneous rocks, in Modern Methods of
GeochemistryGeophysicsGeosystems G3G3 ruprecht et al.: modeling of gas-driven magmatic overturn 10.1029/2008GC002022
18 of 20

Igneous Petrology, Understanding Magmatic Processes, Rev.Mineral., vol. 24, edited by J. Nicholls and J. K. Russell,pp. 259–314, Mineral. Soc. of Am., Washington, D. C.
Chandrasekhar, S. (1961), Hydrodynamic and HydromagneticStability, 654 pp., Oxford Univ. Press, London.
Cioni, R., L. Civetta, P. Marianelli, N. Metrich, R. Santacroce,and A. Sbrana (1995), Compositional layering and syn-erup-tive mixing of a periodically refilled shallow magma cham-ber: The AD 79 Plinian eruption of Vesuvius, J. Petrol., 36,739–776.
Coltice, N., and J. Schmalzl (2006), Mixing times in the man-tle of the early Earth derived from 2-D and 3-D numericalsimulations of convection, Geophys. Res. Lett., 33, L23304,doi:10.1029/2006GL027707.
Coombs, M. L., and J. E. Gardner (2004), Reaction rim growthin silicic melts: Implications for magma mixing, Am. Miner-al., 89, 748–759.
Couch, S. (2003), Experimental investigation of crystallizationkinetics in a haplogranite system, Am. Mineral., 88, 1471–1485.
Couch, S., R. S. J. Sparks, and M. R. Carroll (2001), Mineraldisequilibrium in lavas explained by convective self-mixingin open magma chambers, Nature, 411, 1037–1039,doi:10.1038/35082540.
Couch, S., R. S. J. Sparks, and M. R. Carroll (2003), Thekinetics of degassing-induced crystallization at SoufriereHills Volcano, Montserrat, J. Petrol., 44, 1477–1502,doi:10.1093/petrology/44.8.1477.
Davidson, J. P., and F. J. Tepley, III (1997), Recharge in vol-canic systems: Evidence from isotope profiles of pheno-c rys t s , Sc ience , 275 , 826 – 829 , do i :10 .1126 /science.275.5301.826.
Davidson, J. P., D. J. Morgan, B. L. A. Charlier, R. Harlou, andJ. Hora (2007), Tracing magmatic processes and timescalesthrough mineral-scale isotopic data, Annu. Rev. Earth Planet.Sci., 35, 273–311, doi:10.1146/annurev.earth.35.031306.140211.
Derksen, J. J. (2003), Numerical simulation of solids suspen-sion in a stirred tank, AIChE J., 49, 2700–2714,doi:10.1002/aic.690491104.
Donaldson, C. H. (1985), The rates of dissolution of olivine,plagioclase, and quartz in a basalt melt, Mineral. Mag., 49,683–693, doi:10.1180/minmag.1985.049.354.07.
Dowty, E. (1980), Crystal growth and nucleation theory andthe numerical simulation of igneous crystallization, inPhysics of Magmatic Processes, edited by R. B. Hargraves,pp. 420–485, Princeton Univ. Press, Princeton, N. J.
Dufek, J., and G. W. Bergantz (2005), Transient two-dimensional dynamics in the upper conduit of a rhyoliticeruption: A comparison of closure models for the granularstress, J. Volcanol. Geotherm. Res., 143, 113–132,doi:10.1016/j.jvolgeores.2004.09.013.
Dufek, J., and G. W. Bergantz (2007), Dynamics and depositsgenerated by the Kos Plateau Tuff eruption: Controls of basalparticle loss on pyroclastic flow transport, Geochem. Geo-phys. Geosyst., 8, Q12007, doi:10.1029/2007GC001741.
Edwards, B. R., and J. K. Russell (1996), A review and ana-lysis of silicate mineral dissolution experiments in naturalsilicate melts, Chem. Geol., 130, 233–245, doi:10.1016/0009-2541(96)00025-3.
Eichelberger, J. C. (1980), Vesiculation of mafic magma dur-ing replenishment of silicic magma reservoirs, Nature, 288,446–450, doi:10.1038/288446a0.
Ferrachat, S., and Y. Ricard (1998), Regular vs. chaotic mantlemixing, Earth Planet. Sci. Lett., 155, 75–86, doi:10.1016/S0012-821X(97)00200-8.
Folch, A., and J.Martı (1998), The generation of overpressure infelsic magma chambers by replenishment, Earth Planet. Sci.Lett., 163, 301–314, doi:10.1016/S0012-821X(98)00196-4.
Gerlach, T. M., H. R. Westrich, and R. B. Symonds (1996),Preeruption vapor in magma of the climactic Mount Pinatuboeruption: Source of the giant stratospheric sulfur dioxidecloud, in Fire and Mud: Eruptions and Lahars of Mount Pi-natubo, Philippines, edited by C. G. Newhall and R. S.Punongbayan, pp. 415–433, Washington Univ. Press, Seattle.
Gidaspow, D. (1994),Multiphase Flow and Fluidization: Con-tinuum and Kinetic Theory Descriptions, 467 pp., Academic,Boston, Mass.
Ginibre, C., A. Kronz, and G. Worner (2002), High-resolutionquantitative imaging of plagioclase composition usingaccumulated backscattered electron images: New constraintson oscillatory zoning, Contrib. Mineral. Petrol., 142, 436–448.
Ginibre, C., G. Worner, and A. Kronz (2004), Structure anddynamics of the Laacher See magma chamber (Eifel, Ger-many) from major and trace element zoning in Sanidine: Acathodoluminescence and electron microprobe study, J. Pet-rol., 45, 2197–2223, doi:10.1093/petrology/egh053.
Hammer, J., and M. J. Rutherford (2002), An experimentalstudy of the kinetics of decompression-induced crystalliza-tion in silicic melt, J. Geophys. Res., 107(B1), 2021,doi:10.1029/2001JB000281.
Hersum, T., and B. Marsh (2007), Igneous textures: On thekinetics behind the words, Elements, 3, 247 – 252,doi:10.2113/gselements.3.4.247.
Humphreys, M. C. S., J. D. Blundy, and R. S. J. Sparks (2006),Magma evolution and open-system processes at ShiveluchVolcano: Insights from phenocryst zoning, J. Petrol., 47,2303–2334, doi:10.1093/petrology/egl045.
Jackson, M. J., and B. Mills (1997), Dissolution of quartz invitrified ceramic materials, J. Mater. Sci., 32, 5295–5304,doi:10.1023/A:1018610710222.
Jellinek, A. M., and R. C. Kerr (1999), Mixing and composi-tional stratification produced by natural convection: 2. Ap-plications to the differentiation of basaltic and silicic magmachambers and komatiite lava flows, J. Geophys. Res., 104,7203–7218, doi:10.1029/1998JB900117.
Jellinek, A. M., R. C. Kerr, and R. W. Griffiths (1999), Mixingand compositional stratification produced by natural convec-tion: 1. Experiments and their application to Earth’s core andmantle, J. Geophys. Res., 104, 7183–7201, doi:10.1029/1998JB900116.
Kellogg, L. H., and D. L. Turcotte (1990), Mixing and thedistribution of heterogeneities in a chaotically convectingmantle, J. Geophys. Res., 95, 421–432, doi:10.1029/JB095iB01p00421.
Kerr, R. C. (1995), Convective crystal dissolution, Contrib.Mineral. Petrol., 121, 237–246, doi:10.1007/BF02688239.
Knesel, K. M., J. P. Davidson, and W. A. Duffield (1999),Evolution of silicic magma through assimilation and subse-quent recharge: Evidence from Sr isotopes in sanidine phe-nocrysts, Taylor Creek Rhyolite, NM, J. Petrol., 40, 773–786, doi:10.1093/petrology/40.5.773.
Larsen, J. F. (2005), Experimental study of plagioclase rimgrowth around anorthite seed crystals in rhyodacitic melt,Am. Mineral., 90, 417–427, doi:10.2138/am.2005.1456.
Liang, Y. (2000), Dissolution in molten silicates: Effects ofsolid motion, Geochim. Cosmochim. Acta, 64, 1617–1627,doi:10.1016/S0016-7037(00)00331-8.
Liang, Y. (2003), Kinetics of crystal-melt reaction in partiallymolten silicates: 1. Grain scale processes, Geochem. Geo-phys. Geosyst., 4(5), 1045, doi:10.1029/2002GC000375.
GeochemistryGeophysicsGeosystems G3G3 ruprecht et al.: modeling of gas-driven magmatic overturn 10.1029/2008GC002022
19 of 20

Linden, P. F., and J. M. Redondo (1991), Molecular mixing inRayleigh-Taylor instability. Part I: Global mixing, Phys.Fluids A, 3, 1269–1277, doi:10.1063/1.858055.
Longo, A., M. Vassalli, P. Papale, and M. Barsanti (2006),Numerical simulation of convection and mixing in magmachambers replenished with CO2-rich magma, Geophys. Res.Lett., 33, L21305, doi:10.1029/2006GL027760.
Marsh, B. D. (1988), Crystal capture, sorting, and retention inconvecting magma, Geol. Soc. Am. Bull., 100, 1720–1737,doi:10.1130/0016-7606(1988)100<1720:CCSARI>2.3.-CO;2.
Marsh, B. D. (1989), On convective style and vigor in sheet-like magma chambers, J. Petrol., 30, 479–530.
Maxey, M. R., and J. J. Riley (1983), Equation of motion for asmall rigid sphere in a nonuniform flow, Phys. Fluids, 26,883–889, doi:10.1063/1.864230.
Morgan, D. J., D. A. Jerram, D. G. Chertkoff, J. P. Davidson,D. G. Pearson, A. Kronz, and G. M. Nowell (2007), Com-bining CSD and isotopic microanalysis: Magma supply andmixing processes at Stromboli Volcano, Aeolian Islands,Italy, Earth Planet. Sci. Lett., 260, 419–431, doi:10.1016/j.epsl.2007.05.037.
Nakamura, M. (1995), Continuous mixing of crystal mush andreplenished magma in the ongoing Unzen eruption, Geology,23, 807–810, doi:10.1130/0091-7613(1995)023<0807:CMOCMA>2.3.CO;2.
Namiki, A., and M. Manga (2006), Influence of decompres-sion rate on the expansion velocity and expansion style ofbubbly fluids, J. Geophys. Res., 111, B11208, doi:10.1029/2005JB004132.
Nitsche, J. M., and G. K. Batchelor (1997), Break-up of afalling drop containing dispersed particles, J. Fluid Mech.,340, 161–175, doi:10.1017/S0022112097005223.
Oldenburg, C. M., F. J. Spera, D. A. Yuen, and G. Sewell(1989), Dynamic mixing in magma bodies: Theory, simula-tions and implications, J. Geophys. Res., 94, 9215–9236,doi:10.1029/JB094iB07p09215.
Ottino, J. M. (1990), Mixing, chaotic advection, and turbu-lence, Annu. Rev. Fluid Mech., 22, 207–253, doi:10.1146/annurev.fl.22.010190.001231.
Pallister, J. S., R. P. Hoblitt, and A. G. Reyer (1992), A basalttrigger for the 1991 eruption of Pinatubo volcano?, Nature,356, 426–428, doi:10.1038/356426a0.
Patankar, S. V. (1980), Numerical Heat Transfer and FluidFlow, 210 pp., Hemisphere, Washington, D. C.
Phillips, J. C., and A. W. Woods (2001), Bubble plumes gen-erated during recharge of basaltic magma reservoirs, EarthPlanet. Sci. Lett., 186, 297–309, doi:10.1016/S0012-821X(01)00221-7.
Ramaprabhu, P., and M. J. Andrews (2004), Experimental in-vestigation of Rayleigh-Taylor mixing at small Atwoodnumbers, J. Fluid Mech., 502, 233–271, doi:10.1017/S0022112003007419.
Ramberg, H. (1981), Gravity, Deformation, and the Earth’sCrust, in Theory, Experiments and Geological Application,452 pp., Academic, London.
Ruprecht, P., and G. Worner (2007), Variable regimes in mag-ma systems documented in plagioclase zoning patterns: ElMisti stratovolcano and Andahua monogenetic cones, J. Vol-
canol. Geotherm. Res., 165, 142–162, doi:10.1016/j.jvol-geores.2007.06.002.
Scaillet, B., F. Holtz, and M. Pichavant (1998), Phase equili-brium constraints on the viscosity of silicic magmas: 1. Vol-canic-plutonic comparison, J. Geophys. Res., 103, 27,257–27,266, doi:10.1029/98JB02469.
Shaw, C. S. J. (2006), Effects of melt viscosity and silicaactivity on the rate and mechanism of quartz dissolution inmelts of the CMAS and CAS systems, Contrib. Mineral.Petrol., 151, 665–680, doi:10.1007/s00410-006-0086-3.
Singer, B. S., M. A. Dungan, and G. D. Layne (1995), Texturesand Sr, Ba, Mg, Fe, K, and Ti compositional profiles involcanic plagioclase: Clues to the dynamics of calc-alkalinemagma chambers, Am. Mineral., 80, 776–798.
Snyder, D. (2000), Thermal effects of the intrusion of basalticmagma into a more silicic magma chamber and implicationsfor eruption triggering, Earth Planet. Sci. Lett., 175, 257–273, doi:10.1016/S0012-821X(99)00301-5.
Snyder, D., and S. Tait (1996), Magma mixing by convectiveentrainment, Nature, 379, 529–531, doi:10.1038/379529a0.
Spera, F. J. (1984), Some numerical experiments on the with-drawal of magma from crustal reservoirs, J. Geophys. Res.,89, 8222–8236, doi:10.1029/JB089iB10p08222.
Syamlal, M., W. Rogers, and T. J. O’Brien (1993), MFIXDocumentation: Theory Guide, Tech. Note DOE/METC-94/1004, 49 pp., U.S. Dep. of Energy, Morgantown, W. Va.
Tepley, F. J., III, J. P. Davidson, R. I. Tilling, and J. G. Arth(2000), Magma mixing, recharge and eruption historiesrecorded in plagioclase phenocrysts from El ChichonVolcano, Mexico, J. Petrol., 41, 1397–1411, doi:10.1093/petrology/41.9.1397.
Trial, A. F., F. J. Spera, J. Greer, and D. A. Yuen (1992),Simulations of magma withdrawal from compositionallyzoned bodies, J. Geophys. Res., 97, 6713 – 6733,doi:10.1029/91JB03130.
Vazquez, J. A., and M. R. Reid (2004), Probing the accumula-tion history of the voluminous Toba Magma, Science, 305,991–994, doi:10.1126/science.1096994.
Wallace, G. S., and G. W. Bergantz (2005), Reconcilingheterogeneity in crystal zoning data: An application ofshared characteristic diagrams at Chaos Crags, LassenVolcanic Center, California, Contrib. Mineral. Petrol., 149,98–112, doi:10.1007/s00410-004-0639-2.
Watson, E. B. (1994), Diffusion in volatile-bearing magmas, inVolatiles in Magmas, Rev. Mineral. Geochem., vol. 30,edited by M. R. Carroll and J. R. Holloway, pp. 372–411,Mineral. Soc. of Am., Washington, D. C.
Wolf, A., J. B. Swift, H. L. Swinney, and J. A. Vastano (1985),Determining Lyapunov exponents from a time series, Phys.D, 16, 285–317, doi:10.1016/0167-2789(85)90011-9.
Youngs, D. L. (1984), Numerical simulation of turbulentmixing by Rayleigh-Taylor instability, Phys. D, 12, 32–44,doi:10.1016/0167-2789(84)90512-8.
Zellmer, G. F., R. S. J. Sparks, C. J. Hawkesworth, andM. Wiedenbeck (2003), Magma emplacement and remobili-zation timescales beneath Montserrat: Insights from Sr andBa zonation in plagioclase phenocrysts, J. Petrol., 44, 1413–1431, doi:10.1093/petrology/44.8.1413.
Zhang, Y., D. Walker, and C. E. Lesher (1989), Diffusivecrystal dissolution, Contrib. Mineral. Petrol., 102, 492–513, doi:10.1007/BF00371090.
GeochemistryGeophysicsGeosystems G3G3 ruprecht et al.: modeling of gas-driven magmatic overturn 10.1029/2008GC002022
20 of 20