Embed Size (px)
Citation preview

Modeling of durability of polyelectrolyte membrane of O2/H2 fuel cell
Vadim V. Atrazhev1,2 and Sergei F. Burlatsky3 1 Russian Academy of Science, Institute of Biochemical Physics, Kosygin str. 4, 119334, Moscow, Russia 2 Science for Technology LLC, Leninskiy pr-t 95, 119313, Moscow, Russia 3 United Technologies Research Center, 411 Silver Lane, East Hartford, CT 06108, USA
Keywords: fuel cell; polyelectrolyte membrane
1. Introduction
In this paper, we discuss critical aspects of the mechanisms and features of polymer proton exchange membrane (PEM) degradation in low-temperature H2/O2 fuel cell. The low-temperature fuel cell with PEM is a major candidate to replace internal combustion engine in vehicles. The membrane is a critical component of the fuel cell that conducts protons while preventing the flow of electrons through it. Additionally, the membrane separates the fuel and the oxidant streams. Membrane degradation continues to present challenges for PEM fuel cells to meet the required lifetimes in transportation applications. This is especially the case when the operating conditions favor higher temperatures and lower RH to reduce the fuel cell system balance of plant cost, weight, and volume. Under these conditions, the chemical attack of the membrane by oxidizing radicals is highly accelerated [1,2]. High durability of the PEM, often 5–20 khr, is required for many applications. Understanding of degradation mechanisms and accurate lifetime predictions are critical for the commercial viability of these applications because such long times are not usually available to assure the lifetime of the cell-stack design before fielding significant numbers of commercial units. Both chemical and mechanical factor are important for degradation of perfluorosulfonic acid (PFSA)-based polymer membranes (e.g., Nafion). Chemical degradation involves two major steps: radical generation and radical attack that is likely to proceed at the linear polymer backbone [3,4]. This attack is enhanced if the backbone is not completely fluorinated, particularly if it contains a carboxylic end-group. As first discussed in [3] the polymer backbone proceeds to degrade by the following general mechanism
HFCOOHROHCOFR
HFCOFROHCFROHCFR
OHCOCFROHCOOHCFR
+−→+−+−→−→•+−
++−→•+−
2
22
2222
(1)
In this paper, we focused on chemical mechanism of OH radical generation and their distribution in operational fuel cell. According to the current concept, free radicals are generated from hydrogen and oxygen crossover gases at the surface of Pt particles that precipitated in the membrane. We explicitly calculate Pt precipitation rate and electrochemical potential distribution in the membrane that controls it. Based on radical generation rate and Pt distribution we calculate degradation rate of the membrane taking advantage of simple kinetics equations. However, the chemical details of membrane attack by radicals and mechanical degradation are out of the scope of this paper. The paper is organized as follows. The model of Pt precipitation in the membrane is presented in section 2. The chemical aspects of free OH radicals generation in the membrane are discussed in section 3.1. The macroscopic model of the membrane degradation is presented in section 3.2. Conclusion from the modeling results are presented in section 4.
2. Pt precipitation in membrane
The chemical degradation of PEM in fuel cell is catalyzed by Pt particles precipitated in the membrane during operation. Pt is a commonly used catalyst in the fuel cell electrodes. Instability of Pt at high potentials is greater and is aggravated by potential cycling [5]. The Pt ions dissolved at the cathode, diffuse through the membrane towards the anode and precipitate in the membrane forming narrow band of Pt particles. The location of the Pt band in the membrane is governed by potential of Pt particles in the membrane. This potential is controlled by relatively small crossover diffusion flux of oxygen from the cathode side and hydrogen from the anode side. The crossover gases react at Pt particles surface. Competition of oxygen reduction reaction (ORR) and hydrogen oxidation reaction (HOR) governs the local potential of Pt particles in the membrane [6]. This potential is high near the cathode and low near anode. It abruptly drops in specific point X0 in the membrane bulk. The Pt ions dissolved in the membrane are reduced to Pt atoms in vicinity of X0 and then are agglomerated into Pt particles that form Pt band [7]. Pt electrochemically dissolves in the cathode by reaction
−++ +→ ePtPt 2 (2)
The Pt ions diffuse into the membrane driven by the concentration gradient. Hydrogen crossover from the anode reduces Pt ions forming Pt atoms by reaction
Materials and processes for energy: communicating current research and technological developments (A. Méndez-Vilas, Ed.)____________________________________________________________________________________________________
©FORMATEX 2013 495

+++ +→+ HPtHPt 22
(3)
The Pt atoms diffuse and agglomerate to form Pt particles, Ptn, to minimize their high surface energy.
1+→+ nn PtPtPt (4)
Pt ions also precipitate electrochemically at low potentials on the Pt particles through reaction (5a). Subsequent precipitation would increase the Pt particle potential and stop precipitation. The Pt particle potential is also increased by reduction of oxygen crosser by reaction (5b). However, the potential of platinum particles is simultaneously decreased by H2 crossover oxidation through reaction (5c) that supports further Pt precipitation.
+++
++ →+ 1nn PtPtPt (5a)
OHPtHOPt nn 24
2 24 +→++ +++ (5b)
++
+++ +→+ HPtHPt nn 2121
(5c)
The flux of Pt ions, hydrogen and oxygen crossover gases towards Pt particle surface increases with Pt particle size. The dynamics of platinum precipitation and growth is governed by the local potential and size of the Pt particles that is calculated in the next section.
2.1 Potential of Pt particles in membrane
Potential of Pt particles in the membrane is governed by kinetics of oxygen reduction reaction (ORR) and hydrogen oxidation reaction (HOR) at the surface of Pt particles in the membrane. Equilibrium mixed potential resulting from parallel reactions of oxidation and reduction is well understood. For typical relatively slow reactions, the equilibrium mixed potential value lies between the equilibrium potential of ORR and HOR. At the cathode, the equilibrium mixed potential is equal to open circuit cathode potential (~980 mV) and abruptly drop to approximately 500 mV at membrane/cathode interface as shown by the red line in Fig. 1. In the membrane bulk, the equilibrium mixed potential weakly changes and is equal to approximately 300 mV at membrane/anode interface. Then it abruptly drops at close proximity to the anode to open circuit anode potential (~0 mV). Since the equilibrium mixed potential is much lower than the equilibrium potential of reaction (2) (1.188 V) the Pt band would form at the cathode/membrane interface. That contradicts to experimental observations from [8,9], where Pt band was observed in the membrane bulk closer to the cathode/membrane interface. Moreover, Liu and Zuckerbrod in [10] experimentally discovered unexpected behavior of the potential of catalyst microelectrode probe inserted into membrane that was incorporated into H2/O2 fuel cell. As expected, the measured potential of the probe is close to equilibrium potential of ORR (1.23 V) near cathode and close to equilibrium potential of HOR (0 V) near anode. However, the potential undergoes abrupt change in the membrane bulk, as shown in Fig. 1. The location of the potential abrupt change is denoted as X0.
Fig. 1 Experimentally measured [10] potential of Pt probe in PEM as a function of normalized coordinate across membrane (dots). Model prediction and equilibrium mixed potential are shown in the plot by lines.
Unexpected dependence of the particle potential on coordinate across the membrane is caused by the local transport limitations near the particle [6]. The Pt particle potential is governed by the balance of the currents of ORR, jORR, and HOR, jHOR, at the particle surface
( ) ( ) 0),(),(
22=Φ+Φ xCixCi OORRHHOR
(6)
Here CH2 and CO2 are hydrogen and oxygen concentrations at the surface of Pt particle, Φ is Pt particle potential and x is dimensionless coordinate across membrane. The rate of heterogeneous electrochemical reaction depends on the local concentration of reagents at the surface of the catalyst and local potential of the catalyst through Butler-Volmer equation
( ) ( ) ( ) ( )
Φ−Φ−−−
Φ−Φ=ΦnRT
F
nRT
FCjCj
00
0
1expexp,
αα (7)
0
200
400
600
800
1000
0 0.2 0.4 0.6 0.8 1
Normalized coordinate across membrane
Pote
ntia
l vs.
ano
de, m
V
ModelexperimentEquilibtium mixed potential
Materials and processes for energy: communicating current research and technological developments (A. Méndez-Vilas, Ed.)____________________________________________________________________________________________________
©FORMATEX 2013496
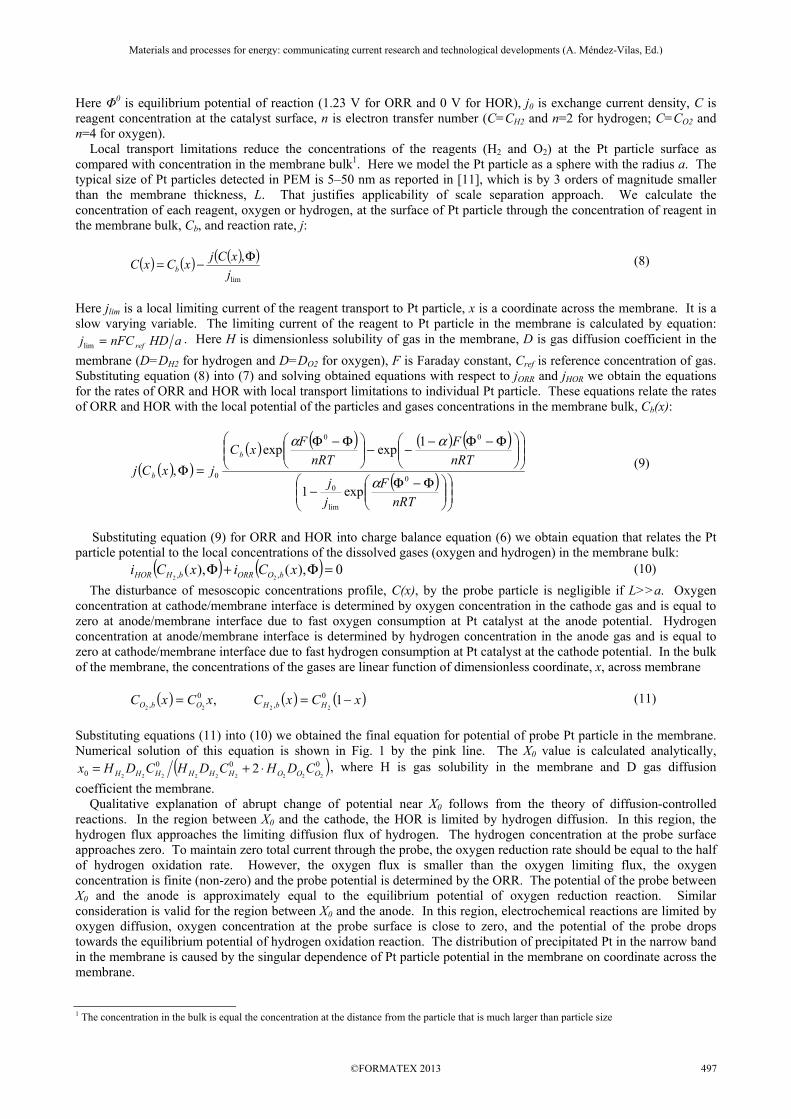
Here Φ0 is equilibrium potential of reaction (1.23 V for ORR and 0 V for HOR), j0 is exchange current density, C is reagent concentration at the catalyst surface, n is electron transfer number (C=CH2 and n=2 for hydrogen; C=CO2 and n=4 for oxygen). Local transport limitations reduce the concentrations of the reagents (H2 and O2) at the Pt particle surface as compared with concentration in the membrane bulk1. Here we model the Pt particle as a sphere with the radius a. The typical size of Pt particles detected in PEM is 5–50 nm as reported in [11], which is by 3 orders of magnitude smaller than the membrane thickness, L. That justifies applicability of scale separation approach. We calculate the concentration of each reagent, oxygen or hydrogen, at the surface of Pt particle through the concentration of reagent in the membrane bulk, Cb, and reaction rate, j:
( ) ( ) ( )( )
lim
,
j
xCjxCxC b
Φ−= (8)
Here jlim is a local limiting current of the reagent transport to Pt particle, x is a coordinate across the membrane. It is a slow varying variable. The limiting current of the reagent to Pt particle in the membrane is calculated by equation:
aHDnFCj ref=lim. Here H is dimensionless solubility of gas in the membrane, D is gas diffusion coefficient in the
membrane (D=DH2 for hydrogen and D=DO2 for oxygen), F is Faraday constant, Cref is reference concentration of gas. Substituting equation (8) into (7) and solving obtained equations with respect to jORR and jHOR we obtain the equations for the rates of ORR and HOR with local transport limitations to individual Pt particle. These equations relate the rates of ORR and HOR with the local potential of the particles and gases concentrations in the membrane bulk, Cb(x):
( )( )( ) ( ) ( ) ( )
( )
Φ−Φ−
Φ−Φ−−−
Φ−Φ
=Φ
nRT
F
j
j
nRT
F
nRT
FxC
jxCjb
b 0
lim
0
00
0
exp1
1expexp
,α
αα (9)
Substituting equation (9) for ORR and HOR into charge balance equation (6) we obtain equation that relates the Pt particle potential to the local concentrations of the dissolved gases (oxygen and hydrogen) in the membrane bulk:
( ) ( ) 0),(),( ,, 22
=Φ+Φ xCixCi bOORRbHHOR (10)
The disturbance of mesoscopic concentrations profile, C(x), by the probe particle is negligible if L>>a. Oxygen concentration at cathode/membrane interface is determined by oxygen concentration in the cathode gas and is equal to zero at anode/membrane interface due to fast oxygen consumption at Pt catalyst at the anode potential. Hydrogen concentration at anode/membrane interface is determined by hydrogen concentration in the anode gas and is equal to zero at cathode/membrane interface due to fast hydrogen consumption at Pt catalyst at the cathode potential. In the bulk of the membrane, the concentrations of the gases are linear function of dimensionless coordinate, x, across membrane
( ) ( ) ( )xCxCxCxC HbHObO −== 1 , 0,
0, 2222
(11)
Substituting equations (11) into (10) we obtained the final equation for potential of probe Pt particle in the membrane. Numerical solution of this equation is shown in Fig. 1 by the pink line. The X0 value is calculated analytically,
( )0000 222222222
2 OOOHHHHHH CDHCDHCDHx ⋅+= , where H is gas solubility in the membrane and D gas diffusion
coefficient the membrane. Qualitative explanation of abrupt change of potential near X0 follows from the theory of diffusion-controlled reactions. In the region between X0 and the cathode, the HOR is limited by hydrogen diffusion. In this region, the hydrogen flux approaches the limiting diffusion flux of hydrogen. The hydrogen concentration at the probe surface approaches zero. To maintain zero total current through the probe, the oxygen reduction rate should be equal to the half of hydrogen oxidation rate. However, the oxygen flux is smaller than the oxygen limiting flux, the oxygen concentration is finite (non-zero) and the probe potential is determined by the ORR. The potential of the probe between X0 and the anode is approximately equal to the equilibrium potential of oxygen reduction reaction. Similar consideration is valid for the region between X0 and the anode. In this region, electrochemical reactions are limited by oxygen diffusion, oxygen concentration at the probe surface is close to zero, and the potential of the probe drops towards the equilibrium potential of hydrogen oxidation reaction. The distribution of precipitated Pt in the narrow band in the membrane is caused by the singular dependence of Pt particle potential in the membrane on coordinate across the membrane.
1 The concentration in the bulk is equal the concentration at the distance from the particle that is much larger than particle size
Materials and processes for energy: communicating current research and technological developments (A. Méndez-Vilas, Ed.)____________________________________________________________________________________________________
©FORMATEX 2013 497
2.2 The model of Pt precipitation in membrane
At the nucleation stage, the size of Pt nuclei is small and electrochemical reactions are suppressed. Electrochemical reactions are not energetically favorable on a small Pt particle, containing just a few Pt atoms, because transfer of one electron leads to high charge density on the Pt particle. During this stage, the platinum ions from the cathode react with hydrogen forming atomic Pt, as indicated by equation (3). Atomic Pt agglomerates making Pt particles, as indicated by equation (4). At this stage, the hydrogen concentration in the membrane is much higher than the Pt particle concentration. Therefore, reaction (3) dominates reaction (5a). Reaction (3) is very fast (diffusion controlled). Therefore, most Pt ions are reduced by hydrogen on the cathode side of the membrane and only a very small fraction can migrate to the anode. The aggregation process of the small Pt particles through reaction (4) is also fast with diffusion-controlled rate constant, scmaDK PtPtagg
3121016 −≈≈ π . To calculate the final concentration of Pt nucleus at
the end of nucleation stage we utilized the theory of diffusion-controlled agglomeration [12]. According to [12], the total concentration of Pt particles in the membrane at nucleation stage is
( ) ( )aggPtPt tntn τtanh0= (12)
Here
aggoPt KJn 2= ,
aggagg JK2=τ and 131310 −−≈ scmJ . Here, 31310 −≈ cmnoPt is characteristic Pt particle
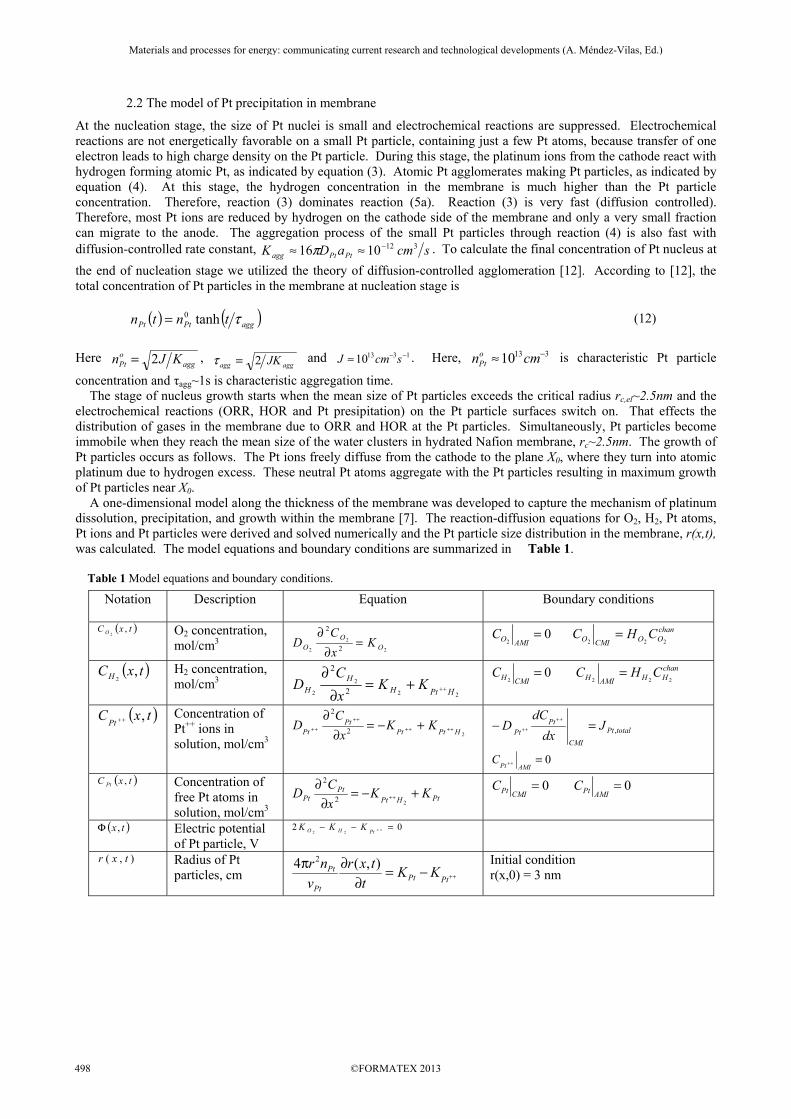
concentration and τagg~1s is characteristic aggregation time. The stage of nucleus growth starts when the mean size of Pt particles exceeds the critical radius rc,el~2.5nm and the electrochemical reactions (ORR, HOR and Pt presipitation) on the Pt particle surfaces switch on. That effects the distribution of gases in the membrane due to ORR and HOR at the Pt particles. Simultaneously, Pt particles become immobile when they reach the mean size of the water clusters in hydrated Nafion membrane, rc~2.5nm. The growth of Pt particles occurs as follows. The Pt ions freely diffuse from the cathode to the plane X0, where they turn into atomic platinum due to hydrogen excess. These neutral Pt atoms aggregate with the Pt particles resulting in maximum growth of Pt particles near X0. A one-dimensional model along the thickness of the membrane was developed to capture the mechanism of platinum dissolution, precipitation, and growth within the membrane [7]. The reaction-diffusion equations for O2, H2, Pt atoms, Pt ions and Pt particles were derived and solved numerically and the Pt particle size distribution in the membrane, r(x,t), was calculated. The model equations and boundary conditions are summarized in Table 1. Table 1 Model equations and boundary conditions.
Notation Description Equation Boundary conditions
O2 concentration, mol/cm3
H2 concentration, mol/cm3
Concentration of Pt++ ions in solution, mol/cm3
Concentration of free Pt atoms in solution, mol/cm3
Electric potential of Pt particle, V
Radius of Pt particles, cm
Initial condition r(x,0) = 3 nm
( )txC O ,2
2
2
2 2
2
OO
O Kx
CD =
∂∂ 0
2=
AMIOC chanOOCMIO CHC
222=
( )txCH ,2
22
2
2 2
2
HPtHH
H KKx
CD +++=
∂∂ 0
2=
CMIHC chanHHAMIH CHC
222=
( )txCPt
,++
22
2
HPtPtPt
PtKK
x
CD ++++
++
++ +−=∂
∂totalPt
CMI
PtPt
Jdx
dCD ,=−
++
++
0=++AMIPt
C
( )txC Pt ,
PtHPtPt
Pt KKx
CD +−=
∂∂
++22
2 0=CMIPtC 0=
AMIPtC
( )tx ,Φ 0222
=−− ++PtHO KKK
),( txr
++−=∂
∂πPtPt
Pt
Pt KKt
txr
v
nr ),(4 2
Materials and processes for energy: communicating current research and technological developments (A. Méndez-Vilas, Ed.)____________________________________________________________________________________________________
©FORMATEX 2013498
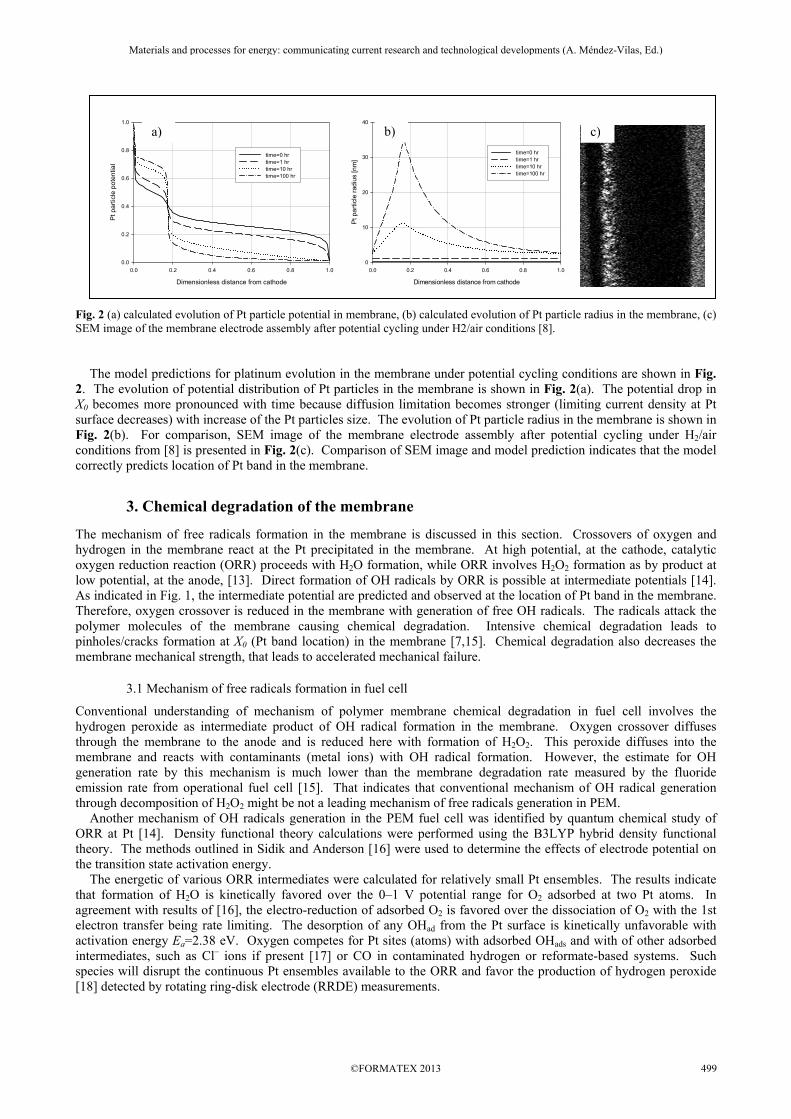
Fig. 2 (a) calculated evolution of Pt particle potential in membrane, (b) calculated evolution of Pt particle radius in the membrane, (c) SEM image of the membrane electrode assembly after potential cycling under H2/air conditions [8]. The model predictions for platinum evolution in the membrane under potential cycling conditions are shown in Fig. 2. The evolution of potential distribution of Pt particles in the membrane is shown in Fig. 2(a). The potential drop in X0 becomes more pronounced with time because diffusion limitation becomes stronger (limiting current density at Pt surface decreases) with increase of the Pt particles size. The evolution of Pt particle radius in the membrane is shown in Fig. 2(b). For comparison, SEM image of the membrane electrode assembly after potential cycling under H2/air conditions from [8] is presented in Fig. 2(c). Comparison of SEM image and model prediction indicates that the model correctly predicts location of Pt band in the membrane.
3. Chemical degradation of the membrane
The mechanism of free radicals formation in the membrane is discussed in this section. Crossovers of oxygen and hydrogen in the membrane react at the Pt precipitated in the membrane. At high potential, at the cathode, catalytic oxygen reduction reaction (ORR) proceeds with H2O formation, while ORR involves H2O2 formation as by product at low potential, at the anode, [13]. Direct formation of OH radicals by ORR is possible at intermediate potentials [14]. As indicated in Fig. 1, the intermediate potential are predicted and observed at the location of Pt band in the membrane. Therefore, oxygen crossover is reduced in the membrane with generation of free OH radicals. The radicals attack the polymer molecules of the membrane causing chemical degradation. Intensive chemical degradation leads to pinholes/cracks formation at X0 (Pt band location) in the membrane [7,15]. Chemical degradation also decreases the membrane mechanical strength, that leads to accelerated mechanical failure.
3.1 Mechanism of free radicals formation in fuel cell
Conventional understanding of mechanism of polymer membrane chemical degradation in fuel cell involves the hydrogen peroxide as intermediate product of OH radical formation in the membrane. Oxygen crossover diffuses through the membrane to the anode and is reduced here with formation of H2O2. This peroxide diffuses into the membrane and reacts with contaminants (metal ions) with OH radical formation. However, the estimate for OH generation rate by this mechanism is much lower than the membrane degradation rate measured by the fluoride emission rate from operational fuel cell [15]. That indicates that conventional mechanism of OH radical generation through decomposition of H2O2 might be not a leading mechanism of free radicals generation in PEM. Another mechanism of OH radicals generation in the PEM fuel cell was identified by quantum chemical study of ORR at Pt [14]. Density functional theory calculations were performed using the B3LYP hybrid density functional theory. The methods outlined in Sidik and Anderson [16] were used to determine the effects of electrode potential on the transition state activation energy. The energetic of various ORR intermediates were calculated for relatively small Pt ensembles. The results indicate that formation of H2O is kinetically favored over the 0–1 V potential range for O2 adsorbed at two Pt atoms. In agreement with results of [16], the electro-reduction of adsorbed O2 is favored over the dissociation of O2 with the 1st electron transfer being rate limiting. The desorption of any OHad from the Pt surface is kinetically unfavorable with activation energy Ea=2.38 eV. Oxygen competes for Pt sites (atoms) with adsorbed OHads and with of other adsorbed intermediates, such as Cl– ions if present [17] or CO in contaminated hydrogen or reformate-based systems. Such species will disrupt the continuous Pt ensembles available to the ORR and favor the production of hydrogen peroxide [18] detected by rotating ring-disk electrode (RRDE) measurements.
Dimensionless distance from cathode
0.0 0.2 0.4 0.6 0.8 1.0
Pt p
artic
le p
oten
tial
0.0
0.2
0.4
0.6
0.8
1.0
time=0 hrtime=1 hr time=10 hr time=100 hr
Dimensionless distance from cathode
0.0 0.2 0.4 0.6 0.8 1.0
Pt p
artic
le ra
dius
[nm
]
0
10
20
30
40
time=0 hr time=1 hrtime=10 hrtime=100 hr
a) b) c)
Materials and processes for energy: communicating current research and technological developments (A. Méndez-Vilas, Ed.)____________________________________________________________________________________________________
©FORMATEX 2013 499
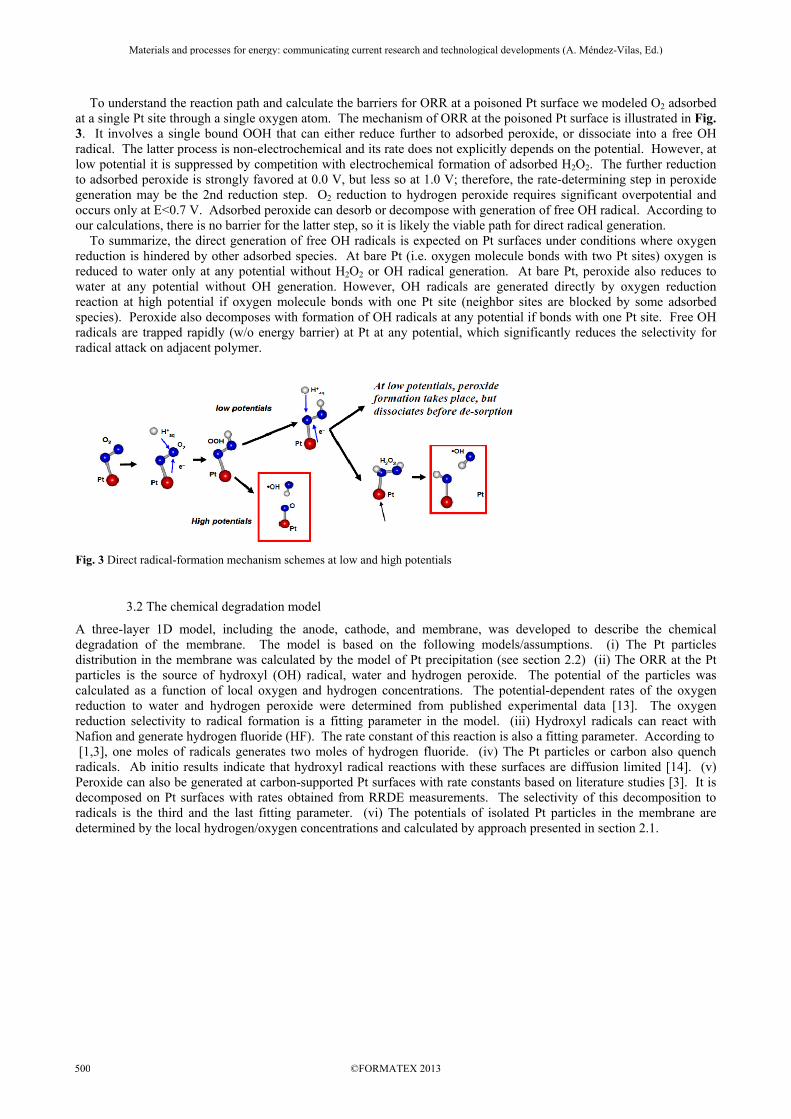
To understand the reaction path and calculate the barriers for ORR at a poisoned Pt surface we modeled O2 adsorbed at a single Pt site through a single oxygen atom. The mechanism of ORR at the poisoned Pt surface is illustrated in Fig. 3. It involves a single bound OOH that can either reduce further to adsorbed peroxide, or dissociate into a free OH radical. The latter process is non-electrochemical and its rate does not explicitly depends on the potential. However, at low potential it is suppressed by competition with electrochemical formation of adsorbed H2O2. The further reduction to adsorbed peroxide is strongly favored at 0.0 V, but less so at 1.0 V; therefore, the rate-determining step in peroxide generation may be the 2nd reduction step. O2 reduction to hydrogen peroxide requires significant overpotential and occurs only at E<0.7 V. Adsorbed peroxide can desorb or decompose with generation of free OH radical. According to our calculations, there is no barrier for the latter step, so it is likely the viable path for direct radical generation. To summarize, the direct generation of free OH radicals is expected on Pt surfaces under conditions where oxygen reduction is hindered by other adsorbed species. At bare Pt (i.e. oxygen molecule bonds with two Pt sites) oxygen is reduced to water only at any potential without H2O2 or OH radical generation. At bare Pt, peroxide also reduces to water at any potential without OH generation. However, OH radicals are generated directly by oxygen reduction reaction at high potential if oxygen molecule bonds with one Pt site (neighbor sites are blocked by some adsorbed species). Peroxide also decomposes with formation of OH radicals at any potential if bonds with one Pt site. Free OH radicals are trapped rapidly (w/o energy barrier) at Pt at any potential, which significantly reduces the selectivity for radical attack on adjacent polymer.
Fig. 3 Direct radical-formation mechanism schemes at low and high potentials
3.2 The chemical degradation model
A three-layer 1D model, including the anode, cathode, and membrane, was developed to describe the chemical degradation of the membrane. The model is based on the following models/assumptions. (i) The Pt particles distribution in the membrane was calculated by the model of Pt precipitation (see section 2.2) (ii) The ORR at the Pt particles is the source of hydroxyl (OH) radical, water and hydrogen peroxide. The potential of the particles was calculated as a function of local oxygen and hydrogen concentrations. The potential-dependent rates of the oxygen reduction to water and hydrogen peroxide were determined from published experimental data [13]. The oxygen reduction selectivity to radical formation is a fitting parameter in the model. (iii) Hydroxyl radicals can react with Nafion and generate hydrogen fluoride (HF). The rate constant of this reaction is also a fitting parameter. According to [1,3], one moles of radicals generates two moles of hydrogen fluoride. (iv) The Pt particles or carbon also quench radicals. Ab initio results indicate that hydroxyl radical reactions with these surfaces are diffusion limited [14]. (v) Peroxide can also be generated at carbon-supported Pt surfaces with rate constants based on literature studies [3]. It is decomposed on Pt surfaces with rates obtained from RRDE measurements. The selectivity of this decomposition to radicals is the third and the last fitting parameter. (vi) The potentials of isolated Pt particles in the membrane are determined by the local hydrogen/oxygen concentrations and calculated by approach presented in section 2.1.
Materials and processes for energy: communicating current research and technological developments (A. Méndez-Vilas, Ed.)____________________________________________________________________________________________________
©FORMATEX 2013500

Fig. 4 (a) The model prediction for Pt particles size, potential and OH radical concentration as a function of normalized coordinate across the membrane, (b) SEM image of the membrane electrode assembly after potential cycling under H2/air conditions [8], (c) SEM image of degraded membrane after potential cycling in H2/air conditions. The conservation reaction-diffusion equations for the six species (O2, H2, H2O, H2O2, OH, HF), distributed in the membrane through-plane spatial dimension, are solved for the three layers of the MEA to estimate the FER. The model calibration was performed through experimental data on FER from fuel cell measured by ion chromatography in anode and cathode gas condensate [1]. The model prediction for Pt particles size, potential and OH radical concentration as a function of normalized coordinate across membrane are shown in Fig. 4(a). The SEM images of Pt precipitated in the membrane (Fig. 4(b)) and degraded membrane (Fig. 4(c)) after potential cycling in H2/air conditions are also presented in the same figure for comparison with model prediction. The OH radicals are distributed in the membrane in narrow band near X0=0.2 in H2/air conditions, as is observed in SEM image and predicted by the model. Maximum of OH radical concentration coincides with maximum of Pt particle distribution (maximal particle size) in the membrane. Hydrogen peroxide decomposition rate was calculated to understand the hydrogen peroxide mechanism contribution to membrane degradation. According to [1], no Fenton reagents (contaminating metal ions) were detected in either the condensate water samples or in the electron microprobe analysis. Therefore, we assume that the Pt particles throughout the membrane thickness provide the only catalyst for radical generation in the membrane. The simulations were performed for various membrane thicknesses to observe the corresponding magnitude of FERs, using the measured H2O2 decomposition rate as the input. The results are shown in Fig. 5. The average H2O2 concentration in the membrane varied in the interval from 100 to 200 ppm. To reconcile these low concentration with experimentally observed FER levels, one would have to assume unrealistically high rates of peroxide decomposition that are by 3 orders of magnitude higher than measured even if unrealistically high 100% yield of peroxide to radicals is assumed. That implies that peroxide decomposition might be not the leading mechanism for free radicals generation in PEM.
Fig. 5 FER vs. peroxide decomposition rate and membrane thickness assuming that the peroxide (indirect) mechanism only is responsible for radical generation.
The model predicts dependence of FER on key factors that impact membrane degradation: amount of platinum, membrane thickness, the hydration level of the membrane, the concentration of the crossover reactants, and the temperature. Unexpected dependences of FER on Pt particles size and membrane thickness are predicted by the model, as shown in Fig. 6. For low Pt loading in the membrane (small spacing between particles) dependences of FER on the Pt particle size and the membrane thickness have a maximum. That is due to twofold role of Pt in the membrane. On the one hand, the Pt particles are sources for free OH radicals in the membrane. On the other hand, the Pt particles are sinks for OH radicals due to diffusion-controlled quenching of the radicals at Pt surface. Competition of these two processes results in non-monotonic dependence of membrane degradation rate on Pt loading. The low loading of small Pt particles in membrane causes fast degradation of the membrane. In contrast, the high loading of large Pt particles in the membrane mitigates membrane from chemical degradation, as was reported in [9,19].
FER
, μm
ol/c
m2 h
r
Peroxide decomposition rate, cm/s
RRDE experiment data
Interval of measured FER
FER
, μm
ol/c
m2 h
r
Peroxide decomposition rate, cm/s
RRDE experiment data
Interval of measured FER
0
10
20
30
40
50
0 0.2 0.4 0.6 0.8 1Normalized position in membrane
Pt p
artic
le ra
dius
[nm
]
0.E+00
5.E-11
OH
radi
cals
co
ncen
tratio
n [m
oll/c
m^3
]
Pt particle size [nm]
Pt particle potential [V]
C_OH [mol/cm3]
0
0.2
0.4
0.6
0.8
1Po
tent
ial o
f Pt p
artic
le [V
]a) b) c)
Materials and processes for energy: communicating current research and technological developments (A. Méndez-Vilas, Ed.)____________________________________________________________________________________________________
©FORMATEX 2013 501
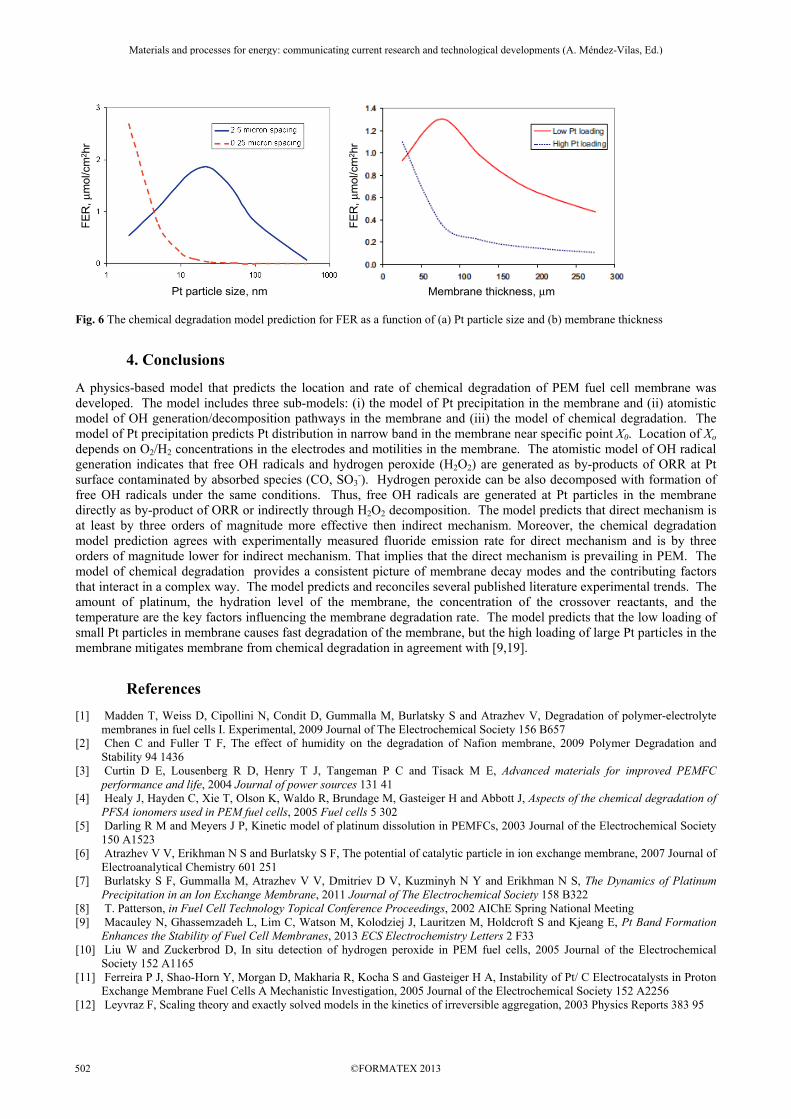
Fig. 6 The chemical degradation model prediction for FER as a function of (a) Pt particle size and (b) membrane thickness
4. Conclusions
A physics-based model that predicts the location and rate of chemical degradation of PEM fuel cell membrane was developed. The model includes three sub-models: (i) the model of Pt precipitation in the membrane and (ii) atomistic model of OH generation/decomposition pathways in the membrane and (iii) the model of chemical degradation. The model of Pt precipitation predicts Pt distribution in narrow band in the membrane near specific point X0. Location of Xo depends on O2/H2 concentrations in the electrodes and motilities in the membrane. The atomistic model of OH radical generation indicates that free OH radicals and hydrogen peroxide (H2O2) are generated as by-products of ORR at Pt surface contaminated by absorbed species (CO, SO3
-). Hydrogen peroxide can be also decomposed with formation of free OH radicals under the same conditions. Thus, free OH radicals are generated at Pt particles in the membrane directly as by-product of ORR or indirectly through H2O2 decomposition. The model predicts that direct mechanism is at least by three orders of magnitude more effective then indirect mechanism. Moreover, the chemical degradation model prediction agrees with experimentally measured fluoride emission rate for direct mechanism and is by three orders of magnitude lower for indirect mechanism. That implies that the direct mechanism is prevailing in PEM. The model of chemical degradation provides a consistent picture of membrane decay modes and the contributing factors that interact in a complex way. The model predicts and reconciles several published literature experimental trends. The amount of platinum, the hydration level of the membrane, the concentration of the crossover reactants, and the temperature are the key factors influencing the membrane degradation rate. The model predicts that the low loading of small Pt particles in membrane causes fast degradation of the membrane, but the high loading of large Pt particles in the membrane mitigates membrane from chemical degradation in agreement with [9,19].
References
[1] Madden T, Weiss D, Cipollini N, Condit D, Gummalla M, Burlatsky S and Atrazhev V, Degradation of polymer-electrolyte membranes in fuel cells I. Experimental, 2009 Journal of The Electrochemical Society 156 B657
[2] Chen C and Fuller T F, The effect of humidity on the degradation of Nafion membrane, 2009 Polymer Degradation and Stability 94 1436
[3] Curtin D E, Lousenberg R D, Henry T J, Tangeman P C and Tisack M E, Advanced materials for improved PEMFC performance and life, 2004 Journal of power sources 131 41
[4] Healy J, Hayden C, Xie T, Olson K, Waldo R, Brundage M, Gasteiger H and Abbott J, Aspects of the chemical degradation of PFSA ionomers used in PEM fuel cells, 2005 Fuel cells 5 302
[5] Darling R M and Meyers J P, Kinetic model of platinum dissolution in PEMFCs, 2003 Journal of the Electrochemical Society 150 A1523
[6] Atrazhev V V, Erikhman N S and Burlatsky S F, The potential of catalytic particle in ion exchange membrane, 2007 Journal of Electroanalytical Chemistry 601 251
[7] Burlatsky S F, Gummalla M, Atrazhev V V, Dmitriev D V, Kuzminyh N Y and Erikhman N S, The Dynamics of Platinum Precipitation in an Ion Exchange Membrane, 2011 Journal of The Electrochemical Society 158 B322
[8] T. Patterson, in Fuel Cell Technology Topical Conference Proceedings, 2002 AIChE Spring National Meeting [9] Macauley N, Ghassemzadeh L, Lim C, Watson M, Kolodziej J, Lauritzen M, Holdcroft S and Kjeang E, Pt Band Formation
Enhances the Stability of Fuel Cell Membranes, 2013 ECS Electrochemistry Letters 2 F33 [10] Liu W and Zuckerbrod D, In situ detection of hydrogen peroxide in PEM fuel cells, 2005 Journal of the Electrochemical
Society 152 A1165 [11] Ferreira P J, Shao-Horn Y, Morgan D, Makharia R, Kocha S and Gasteiger H A, Instability of Pt/ C Electrocatalysts in Proton
Exchange Membrane Fuel Cells A Mechanistic Investigation, 2005 Journal of the Electrochemical Society 152 A2256 [12] Leyvraz F, Scaling theory and exactly solved models in the kinetics of irreversible aggregation, 2003 Physics Reports 383 95
FER
, μm
ol/c
m2 h
r
FER
, μm
ol/c
m2 h
r
Pt particle size, nm Membrane thickness, μm
FER
, μm
ol/c
m2 h
r
FER
, μm
ol/c
m2 h
r
Pt particle size, nm Membrane thickness, μm
Materials and processes for energy: communicating current research and technological developments (A. Méndez-Vilas, Ed.)____________________________________________________________________________________________________
©FORMATEX 2013502

[13] Paulus U A, Schmidt T J, Gasteiger H A and Behm R J, Oxygen reduction on a high-surface area Pt/Vulcan carbon catalyst: a thin-film rotating ring-disk electrode study, 2001 Journal of Electroanalytical Chemistry 495 134
[14] Atrazhev V, Timokhina E, Burlatsky S F, Sultanov V, Madden T and Gummalla M, Direct Mechanism of OH Radicals Formation in PEM Fuel Cells, 2008 ECS Transactions 6 69
[15] Gummalla M, Atrazhev V V, Condit D, Cipollini N, Madden T, Kuzminyh N Y, Weiss D and Burlatsky S F, Degradation of polymer-electrolyte membranes in fuel cells II. Theoretical model, 2010 Journal of The Electrochemical Society 157 B1542
[16] Sidik R A and Anderson A B, Density functional theory study of O2 electroreduction when bonded to a Pt dual site, 2002 Journal of Electroanalytical Chemistry 528 69
[17] Li N and Lipkowski J, Chronocoulometric studies of chloride adsorption at the Pt (111) electrode surface, 2000 Journal of Electroanalytical Chemistry 491 95
[18] Schmidt T J, Paulus U A, Gasteiger H A and Behm R J, The oxygen reduction reaction on a Pt/carbon fuel cell catalyst in the presence of chloride anions, 2001 Journal of Electroanalytical Chemistry 508 41
[19] Burlatsky S F, Hertzberg J B, Cipollini N E and Jarvi T D, Extended catalyzed layer for minimizing cross-over oxygen and consuming peroxide, 2009
Materials and processes for energy: communicating current research and technological developments (A. Méndez-Vilas, Ed.)____________________________________________________________________________________________________
©FORMATEX 2013 503