Embed Size (px)
Citation preview
- 1 -
MODELING OF CORROSION IN RC STRUCTURES UNDER VARIABLE CHLORIDE ENVIRONMENT BASED ON THERMODYNAMIC
ELECTRO-CHEMICAL APPROACH
Raja Rizwan HUSSAIN,1 Tetsuya ISHIDA2 1 PhD Candidate, Department of Civil Engineering, University of Tokyo, Japan
2 Assoc. Professor, Department of Civil Engineering, University of Tokyo, Japan
ABSTRACT: RC structures exposed to aggressive environments such as chloride attack suffer from accelerated corrosion of rebars. Corrosion is an electrochemical thermodynamic phenomenon influenced by several parameters and some of them are being overlooked in the past research works. The purpose of this paper is therefore, to model and verify the corrosion of reinforcement throughout the life of concrete structures by incorporating realistic electro-chemical thermodynamic models and actual field condition experimentation. The modeling task has been incorporated by the use of concrete durability model ‘DuCOM’ developed by our research group as a computational platform on which the chloride induced corrosion based reinforced concrete performance and quality at early age and throughout the life of concrete structure is examined in both space and time domains.
KEYWORDS: Corrosion, chloride, concrete, modeling, thermodynamic electro-chemistry.
1. INTRODUCTION The Corrosion of steel reinforcement in concrete is of great concern in the view of safety and durability of reinforced concrete structures. Concrete is subjected to various environmental loadings throughout its service life span as shown in Figure 1. The premature deterioration of reinforced concrete member has become a major concern in many countries throughout the world.
Figure 1. Environmental Loadings on Concrete
Since steel corrosion is an electrochemical process, its rate is influenced by several factors such as amount of oxygen, chloride, carbon-dioxide, ambient
temperature etc, and corrosion of steel may vary from one place to another due to the difference in seasons and environmental conditions. Therefore, it is necessary to conduct in-depth investigations in order to further understand the mechanisms of corrosion in concrete. 2. OBJECTIVES The main objective of this paper is to investigate the severe environmental conditions especially emphasizing on the effect of chloride and temperature (Figure 2) on corrosion of reinforcing steel in concrete both by experimentation and modeling approach by clarifying the mechanisms involved1therein.1This1eletrochemical1thermodyna--mic phenomenon is influenced by several factors and some of them are being overlooked in the past research works and have difference of opinion. Also it was found that the experimental data for the
- 2 -
combined effect of chloride and temperature on corrosion of reinforcement especially in the higher range is limited (Nishida et al., 2005). For this purpose corrosion potential vs. chloride and temperature profiles are obtained experimentally. For the sake of further accuracy and precision gravimetric corrosion mass loss and consequent corrosion rate is also obtained by modeling and successively verified by experimentation.
Figure 2. Coupled Effect of Chloride and Temperature on Corrosion.
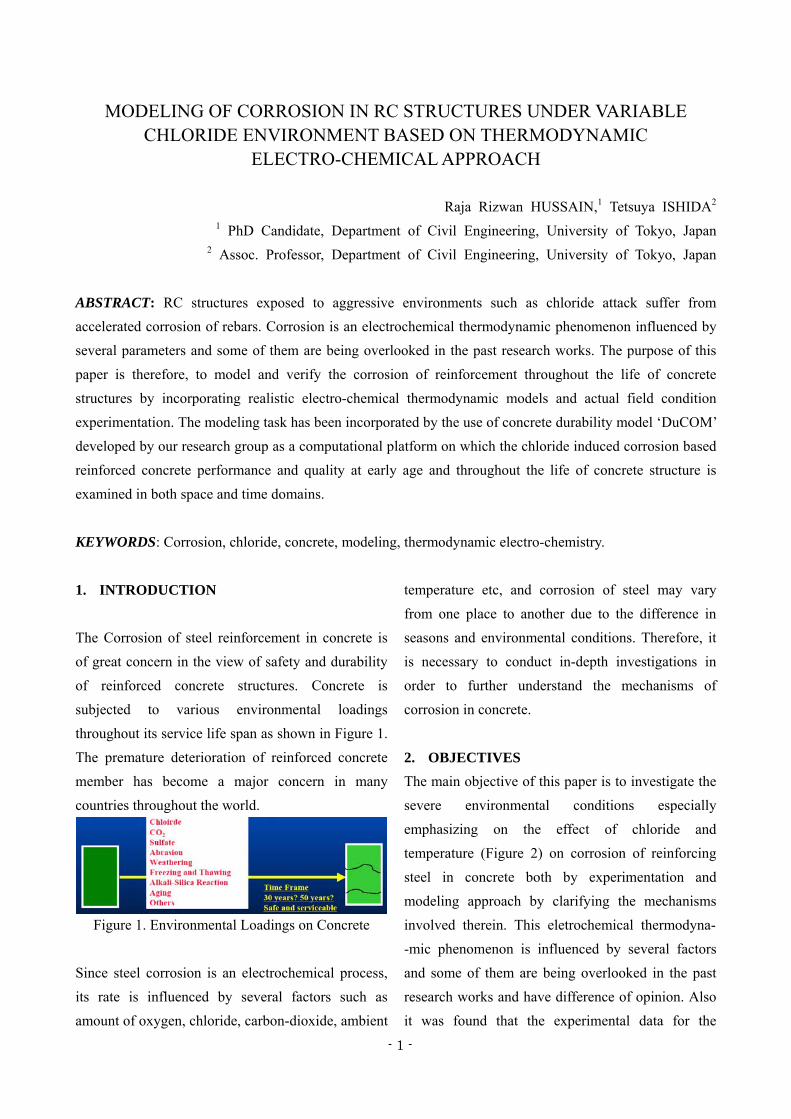
3. METHODOLOGY (DuCOM) The methodology adopted in this research is based on DuCOM, a 3D finite element model developed by our research group as a general framework for corrosion assessment and numerical analysis of RC structures subjected to severe environmental conditions. A general frame work of mass and ion equilibrium equations and an electro-chemical reaction model of corrosion in reinforced concrete has been presented by Ishida, T. (1999a). Thus the influential parameters on the theorem of corrosion process for the severe environmental effects are determined experimentally and simulated in numerical terms for the enhancement of existing model in this research. The reliability of this model is verified through comparison of simulation with experiment results. The constituent material models employed in DuCOM are formulated based on micro-mechanical phenomena such as hydration, moisture, transport and cementitious microstructure formation. Their strong interrelationships are taken into account by real time sharing of material characteristic variables across each sub-system. The development of multi-scale micro pore structures at early age is
obtained based on the average degree of cement hydration in the mixture. The non-linearity in corrosion process and severe environmental effects along with various connected sub-models (Figure 3) to acquire the parameters necessary for the computation of corrosion are taken into account automatically in the unified framework of the program.
Figure 3. Unified Framework of DuCOM
START
Hydration Model Computes Temperature, hydration level of each constituent etc.
Out put
Out put
Out put
Out put
Out put
Out put
Out put
Out put
(input: size, shape, mix proportions, initial, and boundary conditions)
Microstructure model Computes Bi-model porosity, distribution, interlayer porosity
Porosity pressure computation Pore pressures, RH and moisture distribution
Chloride transport and equilibrium Dissolved and bound chloride concentration
Carbon dioxide transport Gas and dissolved CO2 concentration
Dissolved oxygen transport Gas and dissolved oxygen concentration
Calcium leaching model Calcium transport and equilibrium
CORROSION MODEL Corrosion rate & corrosion potential, Cl, O2, CO2, Temp. etc.
Ion equilibrium model pH in pore water concentration of ion
Conservation laws satisfied? YES: Increment time continue
NO: Next iteration
Out put
- 3 -
4. NUMERICAL MODELING 4.1 Governing Laws and Equations The corrosion model in the DuCOM system was firstly adopted from Ishida, T., 1999, Maekawa & Ishida, 2003. In the model a general scheme of micro-cell corrosion is introduced based on thermodynamic electro-chemistry. Initially, electric potential of corrosion cell is obtained from the ambient temperature, pH in pore solution and partial pressure of oxide, which are calculated by other subroutines in the system. The half-cell potential can be expressed with the Nernst Equation (1). Fe(s) Fe2+(aq) + e(Pt) EFe = EFe
Θ + (RT/zFe F)lnhFe2+
O2(g) + 2H2O(l) + 4e(Pt) = 4OH-(aq) E02 = E02
Θ + ((RT/z02 F)ln(P02/PΘ)-0.06pH (1) Where EFe: standard cell potential of Fe, anode (V,SHE), E02: standard cell potential of O2, cathode (V, SHE), EFe
Θ: standard cell potential of Fe at 25°C (=-0.44V), E02
Θ: standard cell potential of O2 at 25°C (=0.40V), zFe: the number of charge of Fe (=2) z02: the number of charge of O2 (=2) PΘ: atmospheric pressure For physical explanation of the corrosion reaction in relation to the above equations, refer to Figure 4. Figure 4. Physical Electro-Chemical Mechanism of Steel Reinforcement Corrosion in Concrete.
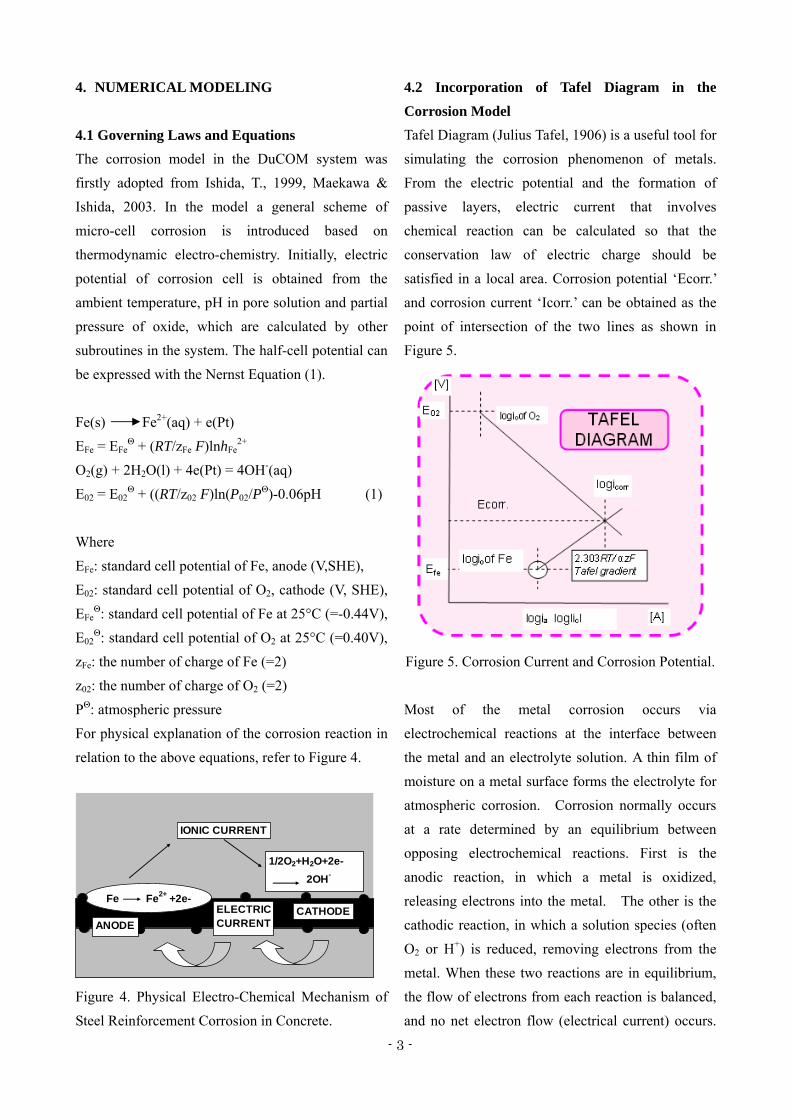
4.2 Incorporation of Tafel Diagram in the Corrosion Model Tafel Diagram (Julius Tafel, 1906) is a useful tool for simulating the corrosion phenomenon of metals. From the electric potential and the formation of passive layers, electric current that involves chemical reaction can be calculated so that the conservation law of electric charge should be satisfied in a local area. Corrosion potential ‘Ecorr.’ and corrosion current ‘Icorr.’ can be obtained as the point of intersection of the two lines as shown in Figure 5.
Figure 5. Corrosion Current and Corrosion Potential. Most of the metal corrosion occurs via electrochemical reactions at the interface between the metal and an electrolyte solution. A thin film of moisture on a metal surface forms the electrolyte for atmospheric corrosion. Corrosion normally occurs at a rate determined by an equilibrium between opposing electrochemical reactions. First is the anodic reaction, in which a metal is oxidized, releasing electrons into the metal. The other is the cathodic reaction, in which a solution species (often O2 or H+) is reduced, removing electrons from the metal. When these two reactions are in equilibrium, the flow of electrons from each reaction is balanced, and no net electron flow (electrical current) occurs.
IONIC CURRENT
Fe Fe2+ +2e-ELECTRICCURRENT
CATHODEANODE
1/2O2+H2O+2e- 2OH-
- 4 -
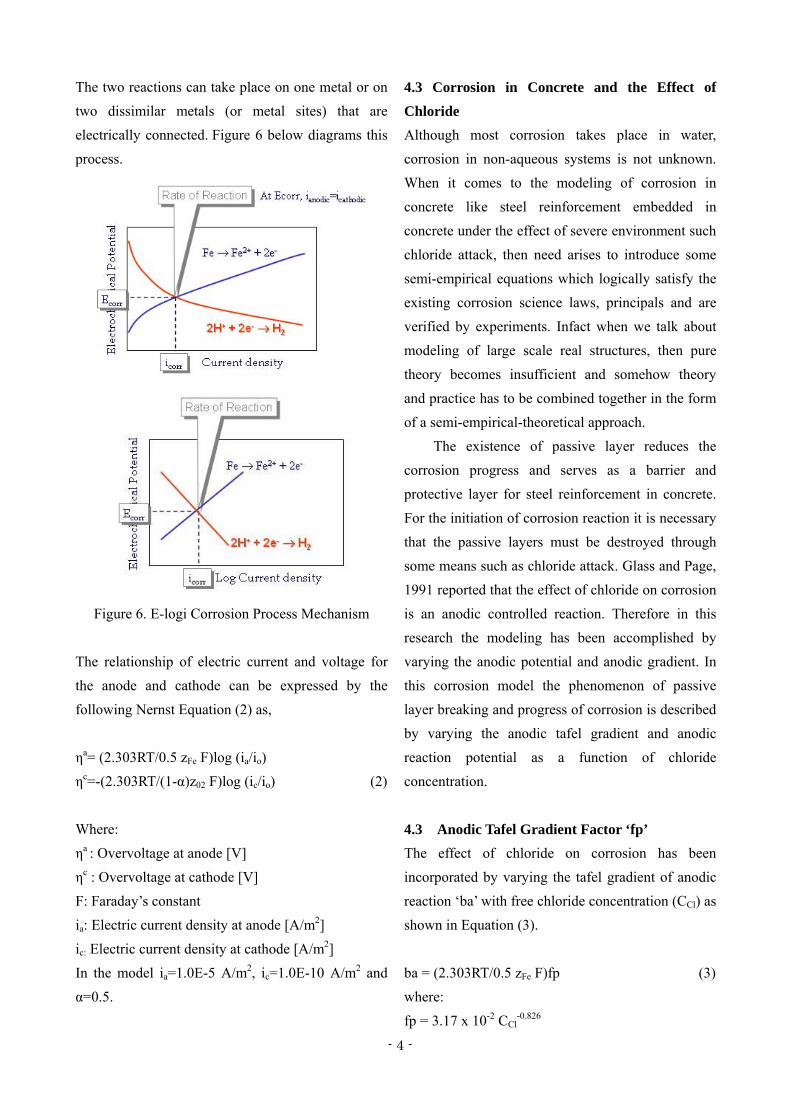
The two reactions can take place on one metal or on two dissimilar metals (or metal sites) that are electrically connected. Figure 6 below diagrams this process.
Figure 6. E-logi Corrosion Process Mechanism
The relationship of electric current and voltage for the anode and cathode can be expressed by the following Nernst Equation (2) as, ηa= (2.303RT/0.5 zFe F)log (ia/io) ηc=-(2.303RT/(1-α)z02 F)log (ic/io) (2) Where: ηa : Overvoltage at anode [V] ηc : Overvoltage at cathode [V] F: Faraday’s constant ia: Electric current density at anode [A/m2] ic: Electric current density at cathode [A/m2] In the model ia=1.0E-5 A/m2, ic=1.0E-10 A/m2 and α=0.5.
4.3 Corrosion in Concrete and the Effect of Chloride Although most corrosion takes place in water, corrosion in non-aqueous systems is not unknown. When it comes to the modeling of corrosion in concrete like steel reinforcement embedded in concrete under the effect of severe environment such chloride attack, then need arises to introduce some semi-empirical equations which logically satisfy the existing corrosion science laws, principals and are verified by experiments. Infact when we talk about modeling of large scale real structures, then pure theory becomes insufficient and somehow theory and practice has to be combined together in the form of a semi-empirical-theoretical approach. The existence of passive layer reduces the corrosion progress and serves as a barrier and protective layer for steel reinforcement in concrete. For the initiation of corrosion reaction it is necessary that the passive layers must be destroyed through some means such as chloride attack. Glass and Page, 1991 reported that the effect of chloride on corrosion is an anodic controlled reaction. Therefore in this research the modeling has been accomplished by varying the anodic potential and anodic gradient. In this corrosion model the phenomenon of passive layer breaking and progress of corrosion is described by varying the anodic tafel gradient and anodic reaction potential as a function of chloride concentration.
4.3 Anodic Tafel Gradient Factor ‘fp’ The effect of chloride on corrosion has been incorporated by varying the tafel gradient of anodic reaction ‘ba’ with free chloride concentration (CCl) as shown in Equation (3). ba = (2.303RT/0.5 zFe F)fp (3) where: fp = 3.17 x 10⁻² CCl
-0.826

- 5 -
For further explanation of the above equation please refer to Figure 7.
Figure 7. Potential and Current Increment by Cl Migration and Breakdown of Passive Layer. In the model this semi-empirical-theoretical factor ‘fp’ accounts for the change in anodic gradient. When the chloride concentration is zero, the factor ‘fp’ becomes infinity and the rebar is considered to be in perfect passive condition represented by a 90° perpendicular anodic line of the tafel diagram as shown in the Figure 7. As the chloride concentration increase, the passive layer starts breaking simulated by decrease in ‘fp’ resulting in the fall of anodic gradient moving the point of intersection of anode and cathode lines towards the more negative corrosion potential and increase in corrosion current until the threshold chloride value is reached and the passive layer is completely destroyed. When chloride ions exist in the system, the passive region which has been occupied by Fe3O4 until this time will disappear. Also the protective region of Fe2O3 will divide into two portions. The lower layer is truly passive but the upper one is somewhat unstable due to the localized destruction and pitting (West 1986). It has been reported from the past researchers that as chlorides increase around reinforcement, current density of corrosion becomes larger due to the breakdown of passive film (Broomfield 1997). At the threshold
chloride value, the passive layer is completely destroyed, thus the factor ‘fp’ becomes 1.0 and the gradient of anodic reaction in the tafel diagram becomes equal to the actual tafel gradient as given by Nernst equation already explained above. In the light of past research works (B. H oh (2004), BS 8110:1997, ACI Code 222R-96, Norweigian Codes, Evertte and Treadaway, 1983) the threshold chloride value has been fixed as 0.4% total chlorides by mass of cement. Since the model is based on the amount of free chloride existing in the pore water, conversion of free Cl to bound Cl and vice versa is done using chloride equilibrium Equation 4 given by Ishida and Lan Anh, 2005. (4) Where: Cf: Free chloride concentration expressed as % mass of binder. Cb: Bound chloride concentration expressed as % mass of binder.
4.4 Anodic Potential Factor ‘FCl’ Based on the fact that the chloride induced corrosion reaction is anodic controlled in nature (Glass and Page, 1991), a semi-empirical factor FCl is introduced in order to initiate anodic potential variation as a function of chloride content as shown in Equation 5. EFe = EFe
Θ+((RT/zFe F)lnhFe2+) FCl (5)
Where, FCl= 1+3x10⁻³ln(104CCl+1)+(1.2CCl/(CCl+1)) This factor ‘FCl’ shifts the anodic curve diagonally downwards with the increase in the chloride content, thus moving the point of intersection of cathode and anode polarization curves towards the more negative potential and higher corrosion current direction.
1
11.8; 4.0
fb
f
CC
Cαβ
α β
=+
= =

- 6 -
Consider Figure 8 for further illustration of the working of ‘FCl’.
Figure 8. Illustration of Semi-Empirical Function‘FCl’ In the absence of chloride the factor FCl is equal to one and the anodic potential is equal to the original anodic potential of the tafel diagram given by the Nernst equation as already explained above. As the chloride attack becomes active, the factor FCl starts increasing more than 1.0 with the increase in chloride concentration in a non linear path as shown in the Figure 9.
11.11.21.31.41.51.6
0.00 0.50 1.00 1.50 2.00 2.50 3.00Total Cl (% by mass of binder)
Fact
or 'F
Cl'
Figure 9. Anodic Potential Factor ‘FCl’
The cathodic gradient ‘bc’ varies according to the nature of chemical reaction and the availability of oxygen near the surface of steel bar embedded in concrete. The corrosion model under discussion can limit the amount of corrosion due to the unavailability of enough amount of oxygen. But, the
most common case in practical field is that the real structures hardly encounter conditions in which the concrete is completely submerged under water for very long duration enough to initiate oxygen controlled (cathodic dependent) corrosion reaction (M. Raupach, 1996). Therefore, in this study for the corrosion reaction of steel in chloride contaminated concrete, ‘bc’ has been semi-empirically determined as bc = 0.1405 by sensitivity analysis and has been incorporated in the corrosion model considering a free flow of oxygen. Lastly, using the Faraday’s Law, electric current of corrosion is converted to the rate of steel reinforcement corrosion. In this research the model is enhanced from the previous research (Ishida and Hussain, 2005) by combining potential and tafel slope models to execute at the same time (Figure 10) as both the tafel anodic slope and potential are influenced by chloride migration.
Figure 10. Coupling of ‘fp’ & ‘FCl’ in the model
4.5 Effective Corrosion Current Reduction Factor ‘Afr’ for Saturated Area of concrete Corrosion is an electrochemical phenomenon which requires electrolyte for the occurrence of corrosion reaction. Therefore, it is necessary to calculate the effective corrosion current in the system with reference to saturated area of concrete only as shown
- 7 -
in Equation (6). Icorreff.= Icorr. Afr,
Afr=(φcpScp+φglSgl)*(1.0-αVfVf) (6)
Where;
φcp : Capillary zone porosity Scp : Saturation of capillary zone pores
φgl : Gel zone porosity Sgl : Saturation of gel zone pores Vf : Volume of fine aggregate αVf : % fine aggregate present in the vicinity of rebar.
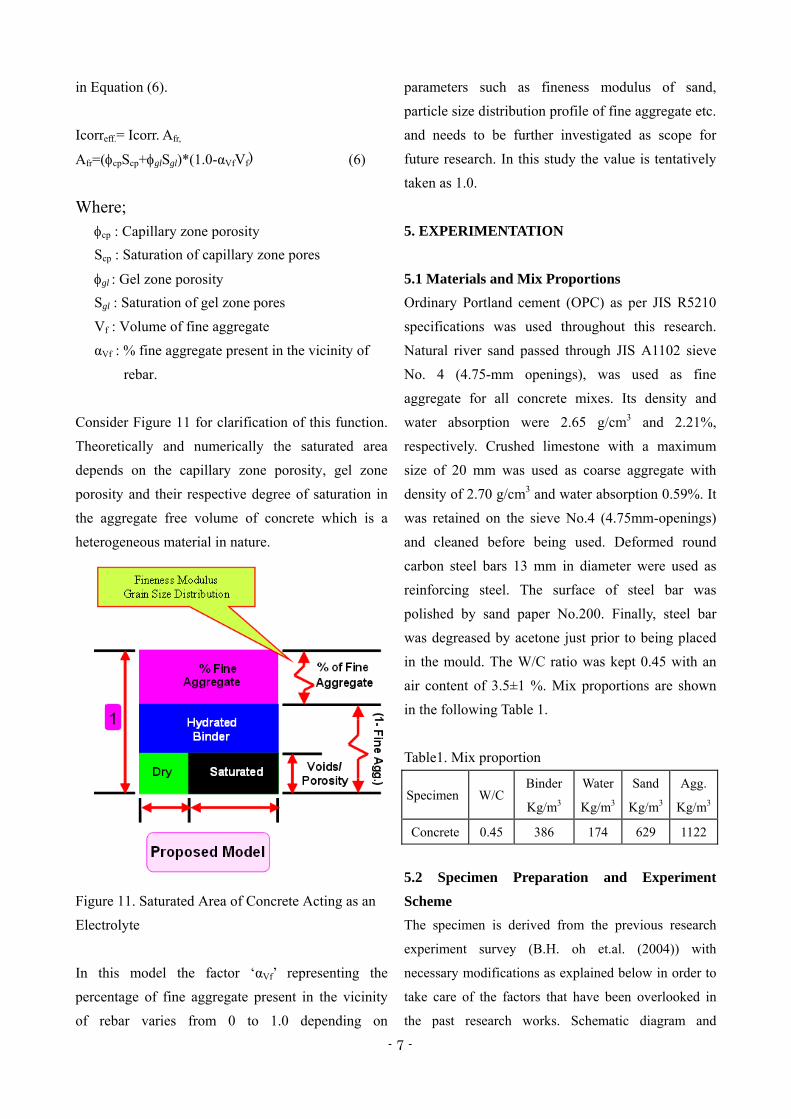
Consider Figure 11 for clarification of this function. Theoretically and numerically the saturated area depends on the capillary zone porosity, gel zone porosity and their respective degree of saturation in the aggregate free volume of concrete which is a heterogeneous material in nature.
Figure 11. Saturated Area of Concrete Acting as an Electrolyte In this model the factor ‘αVf’ representing the percentage of fine aggregate present in the vicinity of rebar varies from 0 to 1.0 depending on
parameters such as fineness modulus of sand, particle size distribution profile of fine aggregate etc. and needs to be further investigated as scope for future research. In this study the value is tentatively taken as 1.0.
5. EXPERIMENTATION 5.1 Materials and Mix Proportions Ordinary Portland cement (OPC) as per JIS R5210 specifications was used throughout this research. Natural river sand passed through JIS A1102 sieve No. 4 (4.75-mm openings), was used as fine aggregate for all concrete mixes. Its density and water absorption were 2.65 g/cm3 and 2.21%, respectively. Crushed limestone with a maximum size of 20 mm was used as coarse aggregate with density of 2.70 g/cm3 and water absorption 0.59%. It was retained on the sieve No.4 (4.75mm-openings) and cleaned before being used. Deformed round carbon steel bars 13 mm in diameter were used as reinforcing steel. The surface of steel bar was polished by sand paper No.200. Finally, steel bar was degreased by acetone just prior to being placed in the mould. The W/C ratio was kept 0.45 with an air content of 3.5±1 %. Mix proportions are shown in the following Table 1. Table1. Mix proportion
5.2 Specimen Preparation and Experiment Scheme The specimen is derived from the previous research
experiment survey (B.H. oh et.al. (2004)) with
necessary modifications as explained below in order to
take care of the factors that have been overlooked in
the past research works. Schematic diagram and
Specimen W/CBinder
Kg/m3
Water
Kg/m3
Sand
Kg/m3
Agg.
Kg/m3
Concrete 0.45 386 174 629 1122
- 8 -
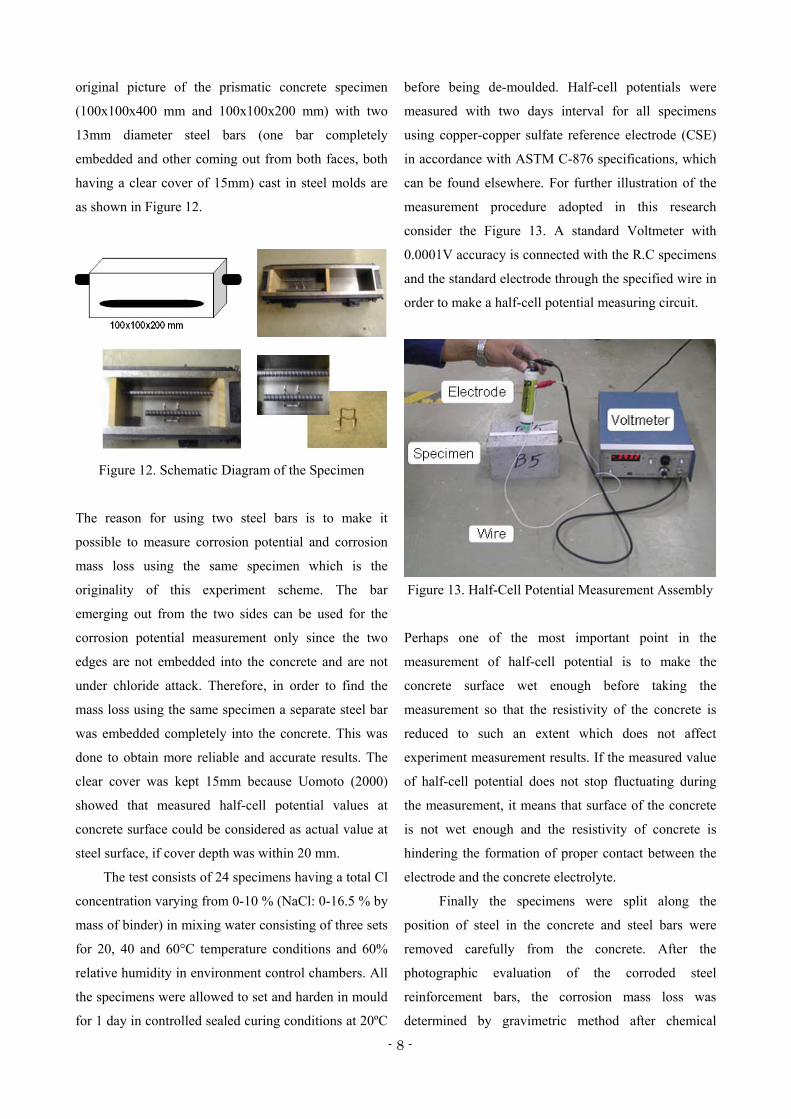
original picture of the prismatic concrete specimen
(100x100x400 mm and 100x100x200 mm) with two
13mm diameter steel bars (one bar completely
embedded and other coming out from both faces, both
having a clear cover of 15mm) cast in steel molds are
as shown in Figure 12.
Figure 12. Schematic Diagram of the Specimen
The reason for using two steel bars is to make it
possible to measure corrosion potential and corrosion
mass loss using the same specimen which is the
originality of this experiment scheme. The bar
emerging out from the two sides can be used for the
corrosion potential measurement only since the two
edges are not embedded into the concrete and are not
under chloride attack. Therefore, in order to find the
mass loss using the same specimen a separate steel bar
was embedded completely into the concrete. This was
done to obtain more reliable and accurate results. The
clear cover was kept 15mm because Uomoto (2000)
showed that measured half-cell potential values at
concrete surface could be considered as actual value at
steel surface, if cover depth was within 20 mm.
The test consists of 24 specimens having a total Cl
concentration varying from 0-10 % (NaCl: 0-16.5 % by
mass of binder) in mixing water consisting of three sets
for 20, 40 and 60°C temperature conditions and 60%
relative humidity in environment control chambers. All
the specimens were allowed to set and harden in mould
for 1 day in controlled sealed curing conditions at 20ºC
before being de-moulded. Half-cell potentials were
measured with two days interval for all specimens
using copper-copper sulfate reference electrode (CSE)
in accordance with ASTM C-876 specifications, which
can be found elsewhere. For further illustration of the
measurement procedure adopted in this research
consider the Figure 13. A standard Voltmeter with
0.0001V accuracy is connected with the R.C specimens
and the standard electrode through the specified wire in
order to make a half-cell potential measuring circuit.
Figure 13. Half-Cell Potential Measurement Assembly
Perhaps one of the most important point in the
measurement of half-cell potential is to make the
concrete surface wet enough before taking the
measurement so that the resistivity of the concrete is
reduced to such an extent which does not affect
experiment measurement results. If the measured value
of half-cell potential does not stop fluctuating during
the measurement, it means that surface of the concrete
is not wet enough and the resistivity of concrete is
hindering the formation of proper contact between the
electrode and the concrete electrolyte.
Finally the specimens were split along the
position of steel in the concrete and steel bars were
removed carefully from the concrete. After the
photographic evaluation of the corroded steel
reinforcement bars, the corrosion mass loss was
determined by gravimetric method after chemical
- 9 -
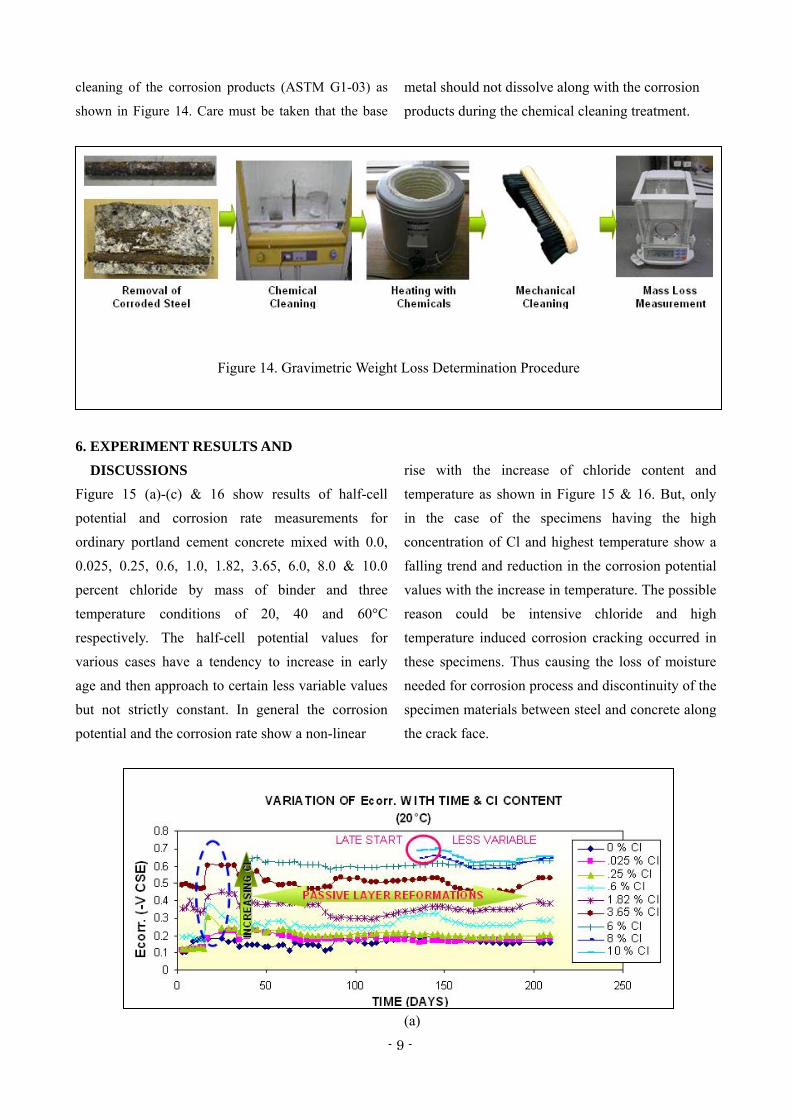
cleaning of the corrosion products (ASTM G1-03) as
shown in Figure 14. Care must be taken that the base
metal should not dissolve along with the corrosion
products during the chemical cleaning treatment.
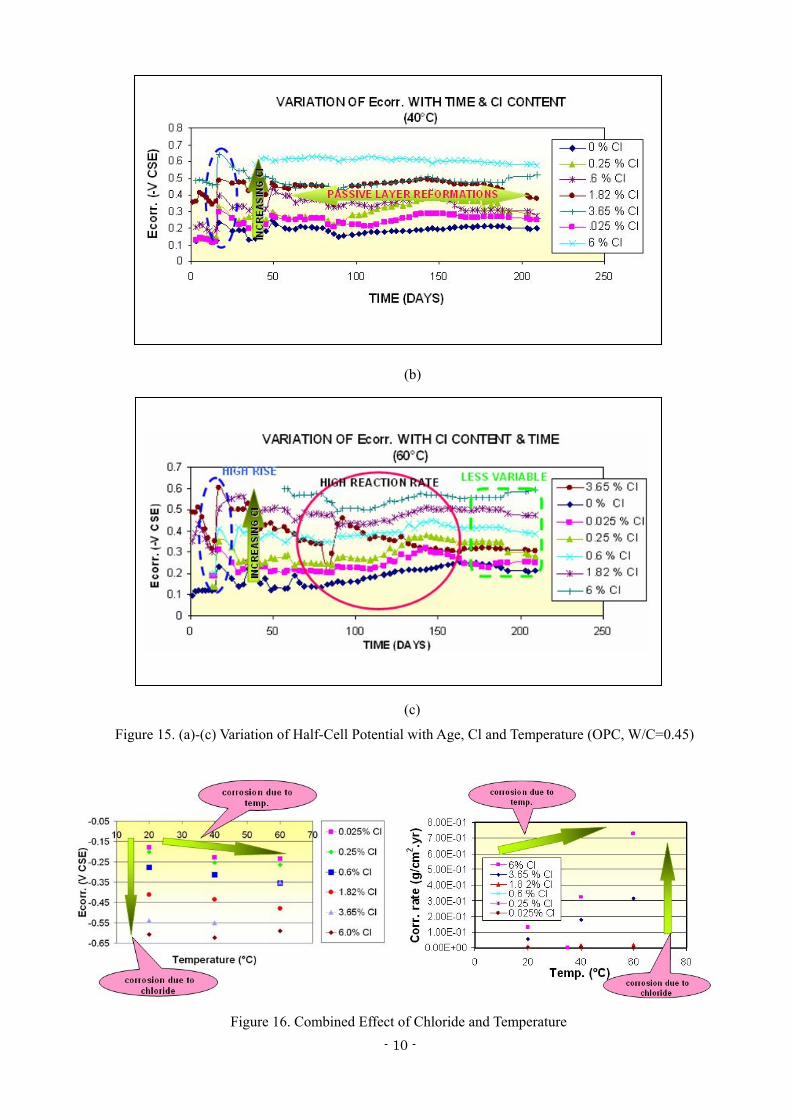
6. EXPERIMENT RESULTS AND DISCUSSIONS Figure 15 (a)-(c) & 16 show results of half-cell potential and corrosion rate measurements for ordinary portland cement concrete mixed with 0.0, 0.025, 0.25, 0.6, 1.0, 1.82, 3.65, 6.0, 8.0 & 10.0 percent chloride by mass of binder and three temperature conditions of 20, 40 and 60°C respectively. The half-cell potential values for various cases have a tendency to increase in early age and then approach to certain less variable values but not strictly constant. In general the corrosion potential and the corrosion rate show a non-linear
metal should not dissolve along with the corrosion products during the chemical cleaning treatment. age and then approach to certain less variable values but not strictly constant. In general the corrosion potential and the corrosion rate of rebar corrosion in concrete show non-linear increase with the increase rise with the increase of chloride content and temperature as shown in Figure 15 & 16. But, only in the case of the specimens having the high concentration of Cl and highest temperature show a falling trend and reduction in the corrosion potential values with the increase in temperature. The possible reason could be intensive chloride and high temperature induced corrosion cracking occurred in these specimens. Thus causing the loss of moisture needed for corrosion process and discontinuity of the specimen materials between steel and concrete along the crack face.
(a)
Figure 14. Gravimetric Weight Loss Determination Procedure
- 10 -
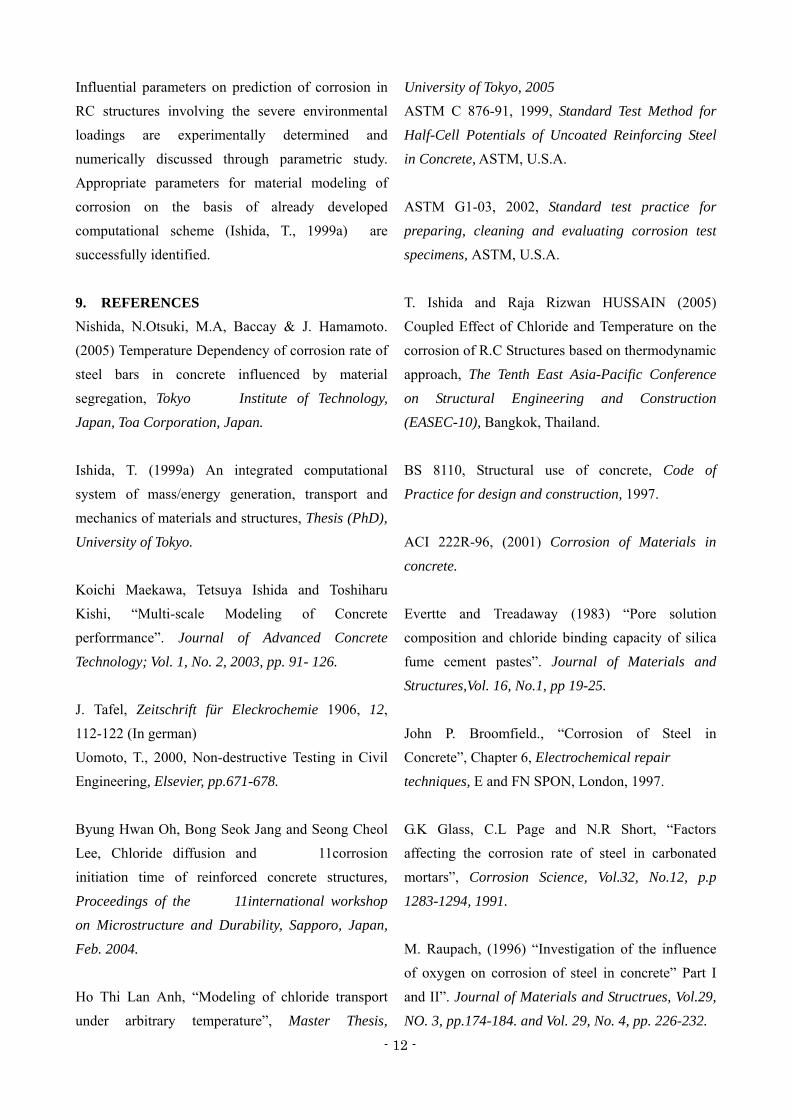
(b)
(b)
(b)
(c)
Figure 15. (a)-(c) Variation of Half-Cell Potential with Age, Cl and Temperature (OPC, W/C=0.45)
Figure 16. Combined Effect of Chloride and Temperature

- 11 -
7. Verification of Corrosion Potential and Corrosion Rate Model The corrosion model of DuCOM shows good agreement with the experiment results as shown in Figure 17 & 18 for the effect of chloride on corrosion of steel reinforcement embedded in concrete for both corrosion potential and corrosion current. Thus providing evidence for the efficiency and accuracy of the model. The model though simple but predicts well taking into account influential parameters involved in the process of corrosion in R.C structures. Modeling and verification for the effect of temperature is in the pipeline and will be published soon. According to ASTM standard C-876, the reinforcement steel bar in concrete is prone to be under the attack of corrosion if the half-cell potential value is below -0.2 Volts. Above that value the steel is in satisfactorily safe condition. The same criterion is also verified by the corrosion model under discussion. In case of chloride induced corrosion, the initiation of corrosion takes place at the threshold value which is mostly considered to be around 0.4% total chlorides by mass of binder and the model under discussion gives a corrosion potential of -0.21 Volts at this value which is just below the value of corrosion potential specified by standards for the detection of initiation of corrosion. Therefore, the corrosion model of DuCOM is also verified by the ASTM Standards in addition to the experimental verification provided in this paper. Hence it can be said that the corrosion model predicts the amount of corrosion both quantitatively and qualitatively with enough accuracy and satisfies the experimental criteria as well as the present scientific theories and standard specifications related to the corrosion of steel reinforcement in concrete structures. The corrosion model gives the value of corrosion potential ‘Ecorr.’ in SHE (Standard Hydrogen Electrode) or NHE (Normal Hydrogen
Electrode) units. Therefore, in order to compare it with experiment results which are in CSE (Copper-Copper Sulfate Electrode) units, it is necessary to use the standard conversion factor as shown below:
CSE (V) = SHE (V) +0.316 V
-0.8
-0.7
-0.6
-0.5
-0.4
-0.3
-0.2
-0.1
0
0 1 2 3 4 5 6 7
Free Cl (% mass of binder)
Ecor
r. ( V
CSE
)
Experiment ResultsModel Analysis
Figure 17. Cl Vs Corrosion Potential Profile (T=20°C, W/C=0.45)
0.0E+005.0E-021.0E-011.5E-012.0E-012.5E-013.0E-013.5E-014.0E-014.5E-015.0E-01
0 1 2 3 4 5 6 7 8Free Cl (% by mass of cement)
Cor
rosi
on R
ate
(g/c
m2 .y
r)
Experiment Results
Model Analysis
Figure 18. Cl Vs Corrosion Current Profile (T=20°C, W/C=0.45)
8. CONCLUSIONS The model being in close agreement with the experiment results predicts the corrosion rate and potential with good accuracy and precision. Corrosion in R.C structures increase in a non uniform manner with the severe environmental loadings even at high chloride concentrations in high temperature range. It has been found from the experiment results that the gradient of corrosion profile with temperature becomes significantly steep with the increase in chloride concentration.
- 12 -
Influential parameters on prediction of corrosion in RC structures involving the severe environmental loadings are experimentally determined and numerically discussed through parametric study. Appropriate parameters for material modeling of corrosion on the basis of already developed computational scheme (Ishida, T., 1999a) are successfully identified.
9. REFERENCES Nishida, N.Otsuki, M.A, Baccay & J. Hamamoto. (2005) Temperature Dependency of corrosion rate of steel bars in concrete influenced by material segregation, Tokyo Institute of Technology,
Japan, Toa Corporation, Japan. Ishida, T. (1999a) An integrated computational system of mass/energy generation, transport and mechanics of materials and structures, Thesis (PhD),
University of Tokyo. Koichi Maekawa, Tetsuya Ishida and Toshiharu Kishi, “Multi-scale Modeling of Concrete perforrmance”. Journal of Advanced Concrete
Technology; Vol. 1, No. 2, 2003, pp. 91- 126. J. Tafel, Zeitschrift für Eleckrochemie 1906, 12, 112-122 (In german) Uomoto, T., 2000, Non-destructive Testing in Civil Engineering, Elsevier, pp.671-678. Byung Hwan Oh, Bong Seok Jang and Seong Cheol Lee, Chloride diffusion and 11corrosion initiation time of reinforced concrete structures,
Proceedings of the 11international workshop on Microstructure and Durability, Sapporo, Japan, Feb. 2004. Ho Thi Lan Anh, “Modeling of chloride transport under arbitrary temperature”, Master Thesis,
University of Tokyo, 2005 ASTM C 876-91, 1999, Standard Test Method for
Half-Cell Potentials of Uncoated Reinforcing Steel in Concrete, ASTM, U.S.A. ASTM G1-03, 2002, Standard test practice for
preparing, cleaning and evaluating corrosion test specimens, ASTM, U.S.A. T. Ishida and Raja Rizwan HUSSAIN (2005) Coupled Effect of Chloride and Temperature on the corrosion of R.C Structures based on thermodynamic approach, The Tenth East Asia-Pacific Conference
on Structural Engineering and Construction (EASEC-10), Bangkok, Thailand.
BS 8110, Structural use of concrete, Code of Practice for design and construction, 1997. ACI 222R-96, (2001) Corrosion of Materials in
concrete. Evertte and Treadaway (1983) “Pore solution composition and chloride binding capacity of silica fume cement pastes”. Journal of Materials and
Structures,Vol. 16, No.1, pp 19-25. John P. Broomfield., “Corrosion of Steel in Concrete”, Chapter 6, Electrochemical repair techniques, E and FN SPON, London, 1997. G.K Glass, C.L Page and N.R Short, “Factors affecting the corrosion rate of steel in carbonated mortars”, Corrosion Science, Vol.32, No.12, p.p
1283-1294, 1991.
M. Raupach, (1996) “Investigation of the influence of oxygen on corrosion of steel in concrete” Part I and II”. Journal of Materials and Structrues, Vol.29,
NO. 3, pp.174-184. and Vol. 29, No. 4, pp. 226-232.