Embed Size (px)
Citation preview

Modeling Internet-Scale Policies for Cleaning up Malware
Steven Hofmeyr
Berkeley Lab
Tyler Moore
Harvard University
Stephanie Forrest
University of New Mexico
Benjamin Edwards
University of New Mexico
George Stelle
University of New Mexico
Abstract
An emerging consensus among policy makers isthat interventions undertaken by Internet ServiceProviders are the best way to counter the rising inci-dence of malware. However, assessing the suitabilityof countermeasures at this scale is hard. In thispaper, we use an agent-based model, called ASIM,to investigate the impact of policy interventionsat the Autonomous System level of the Internet.For instance, we �nd that coordinated interventionby the 0.2%-biggest ASes is more e�ective thanuncoordinated e�orts adopted by 30% of all ASes.Furthermore, countermeasures that block malicioustransit tra�c appear more e�ective than ones thatblock outgoing tra�c. The model allows us to quan-tify and compare positive externalities created bydi�erent countermeasures. Our results give an initialindication of the types and levels of intervention thatare most cost-e�ective at large scale.
1 Introduction
Many Internet-connected computers are infected withmalicious software, or malware. Malware can harmthe infected computer user directly, for example, byinstalling a keystroke logger to collect con�dentialinformation surreptitiously. It can also place themachine into a botnet consisting of thousands oreven millions of computers that carry out attacks ofthe operator's choosing, such as sending email spamor launching denial-of-service attacks. Infected ma-chines can also become vectors for further malwarespread, as in the case of Con�cker, which initiatesattacks from infected machines to recruit new com-puters to the botnet [28].In economic terms, malware imposes negative ex-
ternalities by harming innocent third parties [3]. Neg-
ative externalities are a form of market failure, whichsuggests that there will be an oversupply of the re-source (in this case, malware) in equilibrium. Policymakers are interested in correcting this market fail-ure to reduce the social cost of malware. Althoughmany stakeholders could potentially help control thespread of malware, the emerging consensus is thatInternet Service Providers (ISPs) are best positionedto intervene [24, 2, 33].
It is less clear, however, what kind of interventionis most appropriate. The possibilities range from sim-ply notifying infected customers to actively quaran-tining them until the malware has been demonstra-bly removed. It is di�cult to gauge the impact ofpolicies and ISP-level interventions until they havebeen tried, and it is expensive (both �nancially andin terms of political capital) to adopt industry-widepolicies. Consequently, it is important to get it rightthe �rst time.
One way to address this issue is through model-ing. In this paper we model potential interventionstrategies for controlling malware and compare theirlikely impact. We use an agent-based model calledASIM [17], which represents the Internet at the au-tonomous system (AS) level, the level at which policyinterventions are being actively considered. ASIM in-corporates tra�c, which is key to understanding thespread of malware, geography, which is key to inves-tigating country-level e�ects, and economics, whichis is key to understanding the cost and bene�ts ofinterventions.
Through a series of experiments we study severalquestions, reporting some �ndings that are unsurpris-ing and others that are counterintuitive. For exam-ple, our experiments show, as we would expect, thata few of the largest ISPs acting in concert are moree�ective than a randomly chosen subset of all ASes
To appear in the 10th Workshop on the Economics of InformationSecurity (WEIS), June 14-15, 2011, Fairfax, VA.Last edited April 7, 2011

intervening unilaterally. However, the numbers in-volved are more surprising: Intervention by the top0.2% of ASes is more e�ective than intervention by30% of ASes chosen at random. Our results also sug-gest that when only the largest ASes intervene, itis better to simply �lter out malicious tra�c (espe-cially transit tra�c) than to attempt to remediateend-user infections. We also explore brie�y the im-pact of interventions on the growth of the network,and demonstrate that policies that are bene�cial inthe short term could be harmful in the long-term.For example, the collateral damage caused by black-listing malicious tra�c sources promotes those ASesthat pro�t from receiving more malicious tra�c.
The remainder of the paper is structured as follows.We review in greater detail the policy interventionscurrently under consideration worldwide in Section 2.In Section 3, we explain how ASIM works and howthe cybersecurity interventions are implemented. InSection 4 we describe how we empirically validatedASIM, and Section 5 reports experimental results.We discuss related work in Section 6 and the �ndingsand limitations in Section 7. Finally, we conclude inSection 8.
2 Policy Interventions
There are several reasons why ISPs are a promis-ing point of intervention. First, ISPs are the gate-keeper to the Internet for many computers andthus in a unique position to inspect tra�c to andfrom their customers. Infections are often detectedremotely by scanning for outgoing connections toknown command-and-control servers used by botnetoperators [21]. In this scenario, only the ISP can linkan IP address to customer details, a crucial step ifcustomers are to be noti�ed and assisted.
A second reason is that ample opportunity existsfor reducing the prevalence of malware by enlist-ing the help of ISPs. Using several years' worth ofdata on computers sending spam (a natural proxyfor botnet activity), van Eeten et al. [33] found thatmost compromised computers were customers of le-gitimate ISPs, and that infection rates vary dramat-ically across ISPs and countries. Their evidence sug-gests that di�erences in security countermeasures,not merely target selection by attackers, can a�ectinfection rates at ISPs.
However, incentives for ISPs to implement secu-rity countermeasures are weak. As mentioned above,much of the harm caused by malware is externalized,but the cost of intervention would fall largely on the
ISP. Although the infected host is often unharmed bymalware, the ISP is de�nitely not directly harmed.However, the cost of noti�cation and cleanup canbe substantial. According to an OECD study, onemedium-sized ISP reported that it spent 1�2 % ofits total revenue handling security-related supportcalls [32]. Thus, there is a strong disincentive forISPs to notify infected customers and also pay forany resulting support calls.
Despite weak incentives, ISPs in many countrieshave begun exploring a variety of remedial interven-tions, either with government cooperation or to pre-empt the imposition of more burdensome regulatoryrequirements. Interventions by ISPs usually do notinclude the detection of malware, only remediationonce malware is detected. For noti�cations of misbe-having or compromised customers, ISPs rely on thirdparties, such as the operators of email blacklists, bot-net trackers, other ISPs and security companies,
Once a threat is identi�ed, most ISPs choose todo nothing, waiting until the abuse team has timeto act or for additional warnings about the customerto accrue. However, some ISPs have begun to no-tify customers. In the US, Comcast automaticallynoti�es customers of infections with a browser pop-up that links to instructions for removing the mal-ware [10]. The customers are responsible for com-pleting the clean-up process, and it is inevitable thatnot all malware will be removed successfully evenafter noti�cation. As a further step, Comcast haspartnered with Symantec to o�er remediation by askilled technician for $100. A similar approach is be-ing rolled out by Australian ISPs [6].
A more aggressive step is to place infected comput-ers into �quarantine.� Once in quarantine, users arerequired to download and install anti-virus softwareand malware removal tools. They leave the quar-antine only after the security software is installedand the computer passes a network-based scan formalware. Quarantine is considerably more expen-sive than the noti�cation-only approaches, and thethe ISPs that use them do so only for a minorityof a�ected customers. Recently, the Dutch ISPs an-nounced a signed agreement to notify and quarantinea�ected customers [13].
Both ISPs and policy makers have realized thattackling widespread infection can be made more ef-fective if ISPs coordinate their interventions. Inboth the Dutch and Australian case, many ISPs havejoined together in common action, prodded by theirgovernments. This collective action is designed in
2

part to allay the fear that customers might switchproviders rather than �x the underlying problem.
Some countries are weighing more active interven-tion. If the cost of customer support is really thegreatest impediment to ISP action, then the Ger-man government's decision to establish and subsidizea nationwide call center could really help [18]. Un-der this plan, ISPs will identify infected customersand pass along the information to the call center.Clayton describes a proposal under considerationby Luxembourg to subsidize the cost of voluntarycleanup whenever a customer has been noti�ed of in-fection [9]. Instead of such �carrot�-based incentives,�sticks� could also be tried. Anderson et al. rec-ommended that the European Commission introduce�xed penalties for ISPs that do not expeditiouslycomply with noti�cations of compromised machinespresent on their networks [2].
Finally, policy makers could coordinate their de-fenses by aggregating noti�cations of infection. A sur-vey of Dutch ISPs revealed that they notify or quar-antine only about 10% of infected customers [31] eventhough they claim to notify all customers known tobe infected. This occurs because their individual listsof infections are incomplete. Data incompleteness isa widespread problem in information security [23], as�rms often jealously guard their incident informationas trade secrets. To combat this trend, the AustralianInternet Security Initiative now aggregates data oncompromised machines into a single feed and passesit along to Australian ISPs [6].
3 Model Description
ASIM [17] is an agent-based model of Internet growthat the Autonomous System (AS) level. ASes roughlycorrespond to ISPs. While there are di�erences be-tween ASes and ISPs (e.g., a single ISP can use sev-eral AS numbers), more extensive and reliable data isavailable describing ASes than ISPs. This eases em-pirical validation and explains why most of the liter-ature has studied Internet topology at the AS level.We summarize the important features of ASIM here,highlighting di�erences between the original imple-mentation and the version used in this paper.
ASIM is based on highly simpli�ed implementa-tions of four key features of ASes: network structure,tra�c �ow, geography, and economics. These fea-tures are su�cient to enable ASIM to generate net-works with topologies, dynamics, and spatial distri-butions similar to those of the Internet. There areconceptual similarities between ASIM and some ear-
lier Internet models such as HOT [8, 7], althoughmany of the details are di�erent. For example, ASIMadds explicit economic considerations and accountsdirectly for population density.
ASIM attempts to reproduce large-scale featuresof the AS level of the Internet by modeling localizedand well-understood network interactions. Insteadof simply reproducing a macroscopic pattern usingstatistical �tting or phenomenological models, ASIMspeci�es a set of primitive components (the agents)and interaction rules that mimic the architecture ofthe real system. The model is run as a simulation,and macroscopic behaviors (e.g., degree distribution)are observed and compared to real-world data. Theobjective is to provide a parsimonious explanation ofhow a system works by hypothesizing a small set ofsimple but relevant mechanisms.
In ASIM each AS is an economic agent, which man-ages tra�c over a geographically extended network(referred to as a sub-network to distinguish it fromthe network of ASes) and pro�ts from the tra�c that�ows through its network. We assume a network userpopulation distributed over a two-dimensional gridof locations. Tra�c is generated between source anddestination with a probability that is a function of thepopulation pro�le. The model is initialized with oneagent that spans one grid location. At each time stepa new agent is added to a single location. As timeprogresses, each agent may extend its sub-networkto other locations, so that the sub-networks reach alarger fraction of the population. This creates moretra�c, which generates pro�t, which is then rein-vested into further network expansion. In addition,agents link to each other, potentially routing tra�cbetween sub-networks other than their own. A nec-essary, but not su�cient, condition for two agents tobe connected is that they overlap in at least one loca-tion. Through positive feedback, the network growsuntil it covers the entire population.
For this paper, we have reimplemented ASIM inorder to make it run e�ciently in parallel.1 In theprocess, we have simpli�ed the model, without re-ducing the accuracy with which the model simulatesAS-like networks. The major changes are describedbelow.
3.1 Simplifying the Original ASIM
In the original model described in Holme et al. [17],a variable number of agents could be added everytime step, su�cient to maintain the correct average
1Code available at http://ftg.lbl.gov/projects/asim.
3

degree. In the new model, we simply add one agentper iteration, regardless. This follows realistic ob-served growth curves where the number of new agentsgrows at an almost perfectly linear rate. In our anal-ysis of the real world data, we �nd that about 5.5new ASes are added per day, so in our simulation,one time step is the equivalent of approximately 4.4hours. Each new agent is added to a single, alreadyoccupied location2, chosen at random (weighted ac-cording to population).Instead of a packet-switched model, we use the
gravity model [16]. For the gravity model, the tra�c�ow T between a pair of agents A and B is
T (A,B) =pop(A)pop(B)
d(A,B)2
where, pop(A) is the population served by A, pop(X)is the population served by B, and d(A,B) is theshortest path distance on the AS graph from A toB. Once we have determined the �ow between A andB, we propagate it across the graph on the shortestpath and every agent along that path gets its countof tra�c increased accordingly. If there are multipleshortest paths, we randomly choose one. This traf-�c �ow computation is performed for every pair ofagents.The tra�c model is run every 16 time steps, cor-
responding to every three days of simulation time.Computing paths and carrying out tra�c �ow is ex-pensive and most paths do not change signi�cantlyin the short term. We �nd experimentally that run-ning the tra�c model every 16 time steps providesa good balance between computational overhead andmaintaining accuracy. Note that there is no notionof capacity, as there was in the original model.There are two major di�erences in the modeling of
geography. First, we disregard geographic distance,i.e. the cost of expanding to a new location is con-stant, regardless of where an agent expands to. Bycontrast, in the original model, the greater the dis-tance from an agent's existing locations to a new lo-cation, the higher the cost of expansion. Second, inthe new ASIM, an agent expands to a randomly cho-sen location, weighted by populace, regardless of howmany other agents exist at that location. This dif-fers from the original model, where the location cho-sen was the one with the highest shared3 populationwithin reach.
2Except for the very �rst agent, of course.3The population of the location, divided by the number of
agents with presence at that location.
The mechanism for earning revenue in the new im-plementation is very similar to the original model. Inthe original model, an agent earns money for everypacket it transits. In the new ASIM, we do not have apacket-switched model, and so an agent simply earnsmoney every iteration proportional to the volume oftra�c that it transits in either direction.
It does not cost an agent to link, unlike in the origi-nal model. There are two circumstances in which newlinks are added. First, when a new agent is placed ata location, it is linked to an agent that is chosen uni-formly at random from those already at that location.This ensures the graph remains connected. Second,as in the original model, a number of links is addedon every iteration, su�cient to maintain the desiredaverage degree. In this case, when a link is added, thesource is chosen uniformly at random from all agents,and the destination is chosen by �rst choosing an oc-cupied location (weighted according to population),and then selecting uniformly at random one of theagents at that location. If the source does not existat that location, it expands to that location. Thisensures that agents can only link if they share a lo-cation, as in the original model.
3.2 Adding Cybersecurity to ASIM
We use ASIM to compare the e�ectiveness of di�er-ent policy interventions that counter the proliferationof malware infections. For simplicity, we assume thatevery AS can implement interventions, i.e. we do notfocus on ISPs alone. We de�ne insecurity by assign-ing a wickedness rate to each AS: the fraction of ma-chines that are infected with malware. Depending onits size, each AS has a corresponding wickedness level:the absolute number of infected machines. Sometimeswe will simply refer to wickedness as an abbreviationof wickedness level. We de�ne the wickedness rate wi
for each AS i according to the exponential distribu-tion:
wi = min(−w ln(1− ri)), 0.5)
where ri is a value selected uniformly at random fromthe interval [0, 1], and w is the average wickedness. InSection 4 we explain why this distribution is a rea-sonable match to observed empirical measurementsof wickedness.
In ASIM, the wicked tra�c that �ows from a sourceAS A to a destination AS B is directly proportional tothe wickedness level at A. We de�ne the wicked tra�c
rate at B as the fraction of all tra�c destined for endusers at B that is wicked. Hence we do not counttransit tra�c when measuring wickedness, although
4

wicked tra�c is passed through the network. We areonly interested in the impact of wicked tra�c on endusers, and so are only concerned with the volume oftra�c that reaches the destination.We model �ve types of interventions that can be
undertaken by each AS:
1. Do nothing: This is the baseline where the ASmakes no active intervention.
2. Reduce egress wickedness: This captures arange of AS interventions that remediate cus-tomer infections. The percentage reduction ofwicked egress tra�c depends on the aggressive-ness of the intervention�automated noti�ca-tions are less successful than quarantine, etc.
3. Reduce ingress wickedness: An AS can de-ploy �lters that drop some portion of incomingwicked tra�c. The proportion dropped dependson the e�ectiveness of wicked tra�c detection,the capacity of �ltering on the routers, and otherfactors. Ingress �ltering can be applied to bothend-user tra�c and transit tra�c.
4. Reduce egress and ingress wickedness: AnAS can deploy methods 2 and 3 simultaneously.
5. Blacklist wicked tra�c sources: An AS candrop all tra�c originating from known wickedsources, typically dropping all tra�c that comesfrom another AS that is known to have highinfection rates. Hence there is collateral dam-age because legitimate as well as wicked traf-�c is dropped. We model this by having anAS drop all tra�c (both wicked and legitimate)from other ASes with su�ciently high wicked-ness rates. We also model the notion of an ASbeing too big to block, i.e. an AS will only black-list smaller ASes because blacklisting large ASesis expected to result in an excessive loss of legit-imate tra�c.
Another intervention under consideration by policymakers is increased data sharing, where an AS learnsabout infections from an amalgamation of sources.We do not treat data sharing as a separate interven-tion in the model; rather, we can observe the e�ect ofincreased data sharing by increasing the e�ectivenessof ingress and egress interventions.Separately, we model which ASes choose to inter-
vene as follows:
1. Unilateral: Some ASes choose to intervene uni-laterally, and there is no coordination betweenASes or regulatory pressure on a particular sub-set of ASes to intervene. We implement this by
randomly selecting a subset of ASes to adopt in-tervention strategies.
2. Large ASes act in concert: A selection oflarge ASes together adopt one of the AS-levelinterventions. There are several variations onthis:
(a) Global coordination: All the largest ASesadopt one of the AS-level interventions.
(b) Country-speci�c coordination: All of thelargest ASes in one country adopt one ofthe AS-level interventions. We implementthis in the model by randomly selecting afraction of the largest ASes to apply inter-ventions.
(c) Small AS inclusion: Smaller ASes alsoadopt the interventions.
4 Validating the Model
The original ASIM [17] was validated on real worlddata and shown to be a close match on a numberof metrics. That work dates from 2006, so we havecollected more recent data to perform more exten-sive validation of the new ASIM. First, we gathereddata on the real topology of the AS graph using thestandard method of inferring links from BGP dumps,which we collected from the RouteViews4 and RIPE5
databases. These data were used to validate ASIMon 12 di�erent graph-based metrics; the results aretoo extensive to include in this paper.6
Second, we gathered data on the distributions oflocations among ASes in the real world by matchinggeoip information from MaxMind7 with the IP pre-�xes of ASes collected from the BGP dumps. We usedthis data to con�rm that the characteristics of the ge-ographical distribution of agents in ASIM correspondclosely with the real Internet. We also used Max-Mind to gather population data for cities matchedto locations inferred from the geoip data. We couldthus con�rm that the characteristics of the popula-tion distribution in ASIM closely follow that in thereal world.Obtaining data to validate the cybersecurity ex-
tensions to ASIM is a more challenging task. Reli-able data are di�cult to �nd for the most importantquantity: the distribution of wickedness rates overthe ASes. Perhaps the best data comes from a study
4www.routeviews.org5www.ripe.net6Data and tools available at http://ftg.lbl.gov/
projects/asim.7www.maxmind.com
5
by Van Eeten et al. [31] of botnet activity at DutchISPs. The authors aggregate data on IP addresses ob-served to be sending email spam, participating in theCon�cker botnet, or appearing in the logs of intru-sion detection systems for suspected attack behavior.They found that between 2% and 7% of the customersof the nine largest Dutch ISPs were infected and ex-hibiting botnet activity.
Van Eeten et al. also collected similar data onglobal Internet activity, �nding that Dutch ISPs ex-perience slightly lower than average rates, with theworst-performing countries experiencing a rate sev-eral times higher than that of of the Dutch ISPs.However, the authors do not report rates for othercountries, because some countries make more exten-sive use of DHCP than the Netherlands, which couldlead to overestimates. To incorporate the potentialfor higher rates, for our experiments we selected anaverage wickedness rate w = 0.1, slightly higher thanthe highest Dutch ISP value.
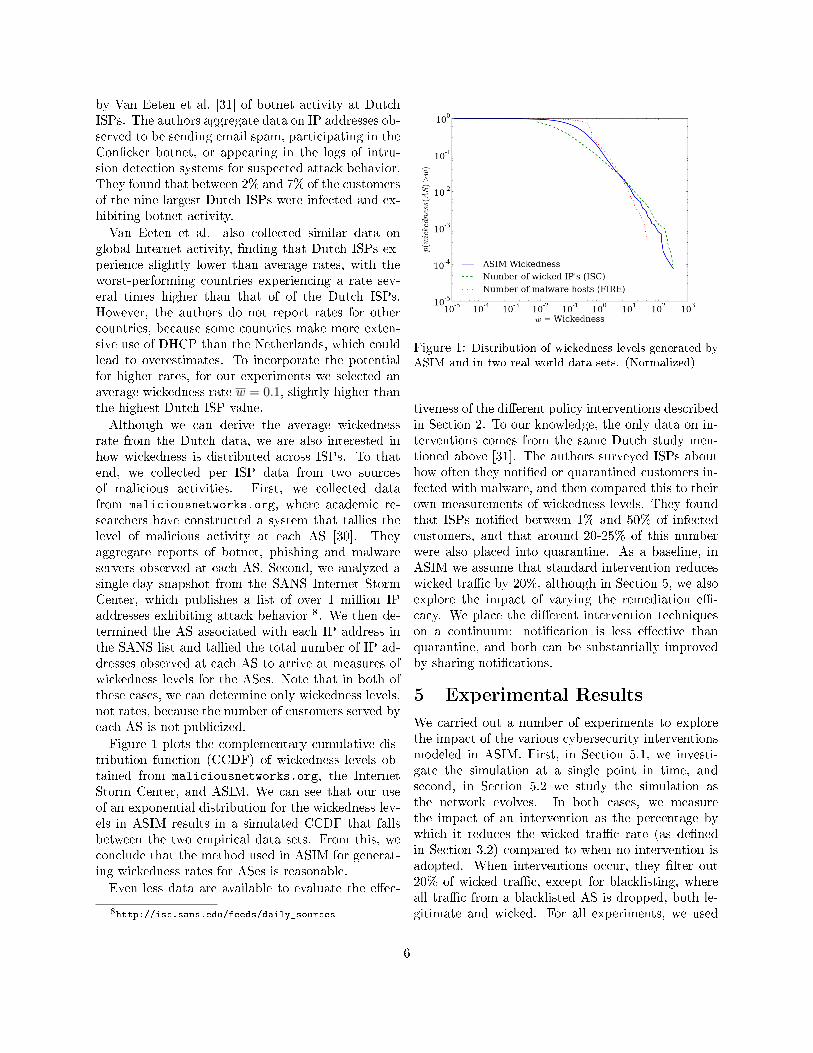
Although we can derive the average wickednessrate from the Dutch data, we are also interested inhow wickedness is distributed across ISPs. To thatend, we collected per ISP data from two sourcesof malicious activities. First, we collected datafrom maliciousnetworks.org, where academic re-searchers have constructed a system that tallies thelevel of malicious activity at each AS [30]. Theyaggregate reports of botnet, phishing and malwareservers observed at each AS. Second, we analyzed asingle-day snapshot from the SANS Internet StormCenter, which publishes a list of over 1 million IPaddresses exhibiting attack behavior 8. We then de-termined the AS associated with each IP address inthe SANS list and tallied the total number of IP ad-dresses observed at each AS to arrive at measures ofwickedness levels for the ASes. Note that in both ofthese cases, we can determine only wickedness levels,not rates, because the number of customers served byeach AS is not publicized.
Figure 1 plots the complementary cumulative dis-tribution function (CCDF) of wickedness levels ob-tained from maliciousnetworks.org, the InternetStorm Center, and ASIM. We can see that our useof an exponential distribution for the wickedness lev-els in ASIM results in a simulated CCDF that fallsbetween the two empirical data sets. From this, weconclude that the method used in ASIM for generat-ing wickedness rates for ASes is reasonable.
Even less data are available to evaluate the e�ec-
8http://isc.sans.edu/feeds/daily_sources
Figure 1: Distribution of wickedness levels generated byASIM and in two real world data sets. (Normalized)
tiveness of the di�erent policy interventions describedin Section 2. To our knowledge, the only data on in-terventions comes from the same Dutch study men-tioned above [31]. The authors surveyed ISPs abouthow often they noti�ed or quarantined customers in-fected with malware, and then compared this to theirown measurements of wickedness levels. They foundthat ISPs noti�ed between 1% and 50% of infectedcustomers, and that around 20-25% of this numberwere also placed into quarantine. As a baseline, inASIM we assume that standard intervention reduceswicked tra�c by 20%, although in Section 5, we alsoexplore the impact of varying the remediation e�-cacy. We place the di�erent intervention techniqueson a continuum: noti�cation is less e�ective thanquarantine, and both can be substantially improvedby sharing noti�cations.
5 Experimental Results
We carried out a number of experiments to explorethe impact of the various cybersecurity interventionsmodeled in ASIM. First, in Section 5.1, we investi-gate the simulation at a single point in time, andsecond, in Section 5.2 we study the simulation asthe network evolves. In both cases, we measurethe impact of an intervention as the percentage bywhich it reduces the wicked tra�c rate (as de�nedin Section 3.2) compared to when no intervention isadopted. When interventions occur, they �lter out20% of wicked tra�c, except for blacklisting, whereall tra�c from a blacklisted AS is dropped, both le-gitimate and wicked. For all experiments, we used
6

Figure 2: The change over time of the complementary cu-mulative distribution (CCDF) for the average path lengthbetween every pair of ASes in the real Internet.
the default parameter settings for ASIM V0.3.9
5.1 Impact at a Single Instant
For our study of the e�ect of interventions at a sin-gle point in time, we used ASIM to grow a network of10 000 ASes, and used that network as the basis for allexperiments. For each intervention, we started withthe same 10 000 AS network, set the parameters ap-propriately, and ran ASIM for a single time step. Thetra�c component of ASIM always updates at the endof a run, so this yields a single update of the tra�cpatterns, changed according to the intervention, andalways starting from the same state.We used 10 000 ASes, rather than the current ap-
proximately 34 000 in the real Internet,10 to reducethe running time of the simulation. This should haveno substantive impact on the experimental results be-cause the key characteristics of the AS-level graphdo not change signi�cantly as the network grows, ei-ther in our simulations or in reality. For example,Figure 2 shows that the distribution of average pathlengths has remained roughly unchanged over the lastdecade, even as the number of ASes has grown morethan threefold.We �rst examine how applying interventions to dif-
ferent ASes can a�ect wicked tra�c levels. Figure 3shows how wicked tra�c decreases when only the 20largest ASes (as measured by degree) adopt interven-tions, as compared to a random selection of between
9av_degree = 4.2, extent_cost = 1.5, base_income = 5,
pop_distr_exp = -1, wickedness = 0.1.10As of May 2010.
Figure 3: Impact of interventions on wicked tra�c rate.�20 largest� is the e�ect when the 20 largest ASes inter-vene; �random x%� is the e�ect when x percent of all ASesintervene.
10-30% of all ASes. This illustrates the case whereinterventions are coordinated at the largest ISPs to ahands-o� approach where ISPs decide for themselveswhether or not to adopt countermeasures. The graphclearly demonstrates that targeting the largest ASesis a superior strategy, given that targeting just the20 largest ASes (0.2% of the total) reduces tra�c bymore than applying interventions to even 3 000 ran-domly selected ASes.
It is not particularly surprising that targeting thelargest ASes is the most e�ective strategy, given thestructure of the AS graph. In our simulations, thelargest ASes route up to six orders of magnitude moretra�c than the smallest. Nonetheless, the results re-inforce the argument that remediation policies canbe more successful by focusing on a small group ofthe largest ASes, unless a majority of all ASes can bepersuaded to unilaterally respond.
What is more striking is the comparison betweeningress and egress �ltering. Filtering ingress tra�cdestined for end users only (i.e. not �ltering transittra�c) is about as e�ective as �ltering egress traf-�c (around 10% when the largest ASes intervene).Ingress �ltering of both end-user and transit tra�cat the largest ASes, by contrast, reduces wicked traf-�c by a factor of 2.7 over egress alone. This is amore surprising �nding, as it suggests that �lteringincoming wicked tra�c is more e�ective than stop-ping outgoing tra�c. When ASes act unilaterally,the di�erence is not as large (a factor of 1.8) becausethe smaller ASes transit less tra�c.
7

Figure 4: Impact of interventions on wicked tra�c rateon those ASes that intervene, and those that do not. �20largest� is the e�ect when the 20 largest ASes intervene;�random x%� is the e�ect when x percent of all ASesintervene.
Most policy interventions under discussion havefocused on ISPs' remediating customer infections,which is akin to egress �ltering. While this doesreduce wicked tra�c levels, our results suggest thatresources might be put to better use by �ltering in-coming and transit tra�c for wickedness.
Figure 4 compares the decrease in wicked tra�c atASes that implement the interventions to the reduc-tion at ASes that do not adopt any interventions. Thebene�ts for non-intervening ASes represent a way tomeasure the positive externalities of security inter-ventions in the network. As expected, �ltering egresstra�c creates substantial positive externalities, withnon-intervening ASes experiencing similar reductionsin wicked tra�c rates as intervening ASes. This e�ectholds for both the largest ASes and a random selec-tion of ASes. By contrast, �ltering ingress tra�c haspositive externalities only if wicked transit tra�c isblocked. In this case, the greatest bene�ts accrue tothe intervening ASes. This indicates that when �lter-ing ingress tra�c, the incentives for adopting coun-termeasures are more aligned, and there should beless fear of free-riding.
Furthermore, the positive externalities of ingress�ltering (including transit tra�c) can vary greatlydepending on which ASes intervene. The bene�ts tonon-intervening ASes are more than twice as largewhen the largest ASes intervene rather than whenASes unilaterally intervene at random. This is be-cause large ASes attract more transit tra�c, and so
Figure 5: E�ect of the intervention of a fraction of thelargest ASes.
their �ltering has a greater impact.Even if having the largest ASes implement an inter-
vention is the preferred strategy for reducing wickedtra�c on the Internet, it may not be possible to en-list the support of all ASes. For example, even if alllarge US-based ISPs adopted ingress and egress �lter-ing, operators in other countries might choose not toparticipate. To investigate the impact of incompleteadoption, Figure 5 explores how varying the propor-tion of large ASes that participate in the interventiona�ects the reduction of malicious tra�c.Although wicked tra�c falls as more ASes partici-
pate, the e�ect is non-linear. For example, the di�er-ences between 80% and 100% of ASes intervening arenot great (from 27% to 30% wicked tra�c reduction,an 11% change), whereas the di�erences between 60%and 80% are much greater (from 21% to 27%, a 29%change). This suggests that country-level interven-tions are much more likely to be e�ective if they in-clude the majority of large ASes. For example, if theall the largest ISPs based in the US were to intervene,that would constitute at least 75% of all large ASes.In all the experiments reported previously, the
ingress and egress �ltering e�ectiveness was set at20%. However, some interventions are likely tobe more e�ective than others. Noti�cation-basedschemes will �lter less egress wicked tra�c than activequarantine, and increased data sharing could raisethe success rate of both ingress and egress �ltering.It is very di�cult to get reliable information on thee�cacy of these di�erent approaches. Instead, in Fig-ure 6 we explore how di�erent combinations of valuesfor the success rates of ingress and egress �ltering af-
8

Figure 6: How the wicked tra�c rate falls when varyingthe success rate of ingress and egress �ltering. The scaleindicates on the right the reduction in wicked tra�c, from0 to 40%.
fect the wicked tra�c rates. Ingress �ltering is consis-tently more e�ective at reducing overall wickedness.For instance, ingress �ltering 35% of wicked tra�cand no egress tra�c reduces the wicked tra�c rateby the same amount as 20% ingress and 40% egress�ltering.
We also study the more aggressive intervention ofcompletely blocking all tra�c originating from black-listed ASes with unacceptably high wicked tra�crates. Blacklisting results in a trade-o� between re-ducing wicked tra�c and collateral damage caused byblocking innocent tra�c. We consider only the casewhere interventions are carried out by the 20 largestASes (those of degree ≥ 170), because, as seen pre-viously, interventions are most successful when thelargest ASes act in concert.
There are two choices to make when applyingblacklisting: �rst, the selection of the level of wicked-ness above which ASes are blacklisted, and second,the selection of whether to not blacklist larger ASes.We explore three levels of AS size: blacklisting allASes above the wickedness level, or those of degree< 170, or those of degree < 10. For each choice ofAS size, we select levels of wickedness that result inlosses of legitimate (good) tra�c of 2%, 5%, 10% and15%.
Figure 7 shows that the best strategy when ap-plying blacklisting depends very much on the levelof legitimate tra�c loss we are willing to tolerate.For very low losses (2%) the strategies have similarresults. For more moderate losses (5%), we should
Figure 7: Trade-o� between reducing wicked tra�c andlosing legitimate tra�c when blacklisting.
blacklist all but the 20 largest ASes. Beyond that, itis more e�ective to blacklist all ASes. However, wesee diminishing returns as the level of acceptable lossincreases. For example, when blacklisting all ASes,a 50% increase in acceptable loss, from 10% to 15%,only reduces the wicked tra�c by an additional 23%.In fact, increasing the level of acceptable loss does
not always reduce wicked tra�c. As can be seen inFigure 8, the largest reduction of wicked tra�c hap-pens around a wickedness level of 0.08. Furthermore,there is a range over which the wicked tra�c reduc-tion changes little; thus, the best choice of wickednesslevel would probably be around 0.12 for this example;anything lower increases the loss of legitimate tra�cwith no bene�cial wicked tra�c reduction.
5.2 Impact on Network Growth
The e�ect of malicious activity on the growth of theAS network is a complex issue, one that we do nothave the space to investigate in depth in this paper.As an illustration of some of the potential for model-ing chronic attacks in ASIM, we brie�y consider howthe cost of intervention in�uences network growth.Blacklisting is the simplest intervention to incorpo-rate into the economics of ASIM, because ASes earnmoney according to how much tra�c they route.Blacklisting reduces the amount of tra�c (both le-gitimate and wicked) seen by ASes and hence shouldchange the evolution of the network.We carried out experiments where the 20 largest
ASes intervene to blacklist all tra�c originating fromASes of degree less than 170. We set the wickednesslevel for blacklisting to be 0.18, which results in mod-
9

Figure 8: The reduction in wicked tra�c and the lossof legitimate (good) tra�c when blacklisting all ASes ofdegree < 170.
erate legitimate tra�c loss. At this level, accordingto Figure 7, the best strategy is to blacklist all su�-ciently wicked ASes of degree less than 170.
Figure 9 shows how wicked tra�c and lost legiti-mate tra�c change as the network evolves from 5 000to 13 000 ASes. The wicked tra�c increases slightly(by about 9%) and the lost legitimate tra�c decreasessigni�cantly (by about 66%). To understand why thishappens, consider two classes of ASes: those thatlose incoming tra�c due to blacklisting (class A) andthose that do not (class B). In ASIM, every AS de-pends on tra�c for revenue, and so ASes in class Awill earn less and hence grow more slowly than ASesin class B. The ASes in class A will have reducedlevels of wicked tra�c and increased levels of lost le-gitimate tra�c compared to those in class B. Thus,as ASes in class B grow more than those in class A,the overall level of wicked tra�c will increase, andthe overall level of legitimate tra�c lost will decrease.This is exactly what we see in Figure 9.
Although blacklisting tends to promote ASes thatreceive more wicked tra�c, the rate at which wickedtra�c increases is much slower than the rate at whichlost legitimate tra�c decreases. Hence, blacklistingcould still be considered a viable strategy for reducingoverall wickedness, at least in the short term. Per-suading individual ASes to voluntarily adopt black-listing, however, would be hard. Mandatory partici-pation would likely be necessary.
Figure 9: Change wicked tra�c and loss of legitimatetra�c over time as the network grows from 5 000 to 13 000ASes. The wicked tra�c rate is the percentage of alltra�c that is wicked.
6 Related Work
Few studies have modeled the costs and bene�ts of in-tervention to prevent the spread of malware across anetwork. LeLarge [19, 20] used an agent-based modelto investigate the economics of interventions thatcounter the spread of malware. However, LeLarge'smodel is much more abstract than ASIM: agents ex-ist on a random network, over which there is a proba-bilistic spread of infections. Agents can choose eitherto secure themselves (at a cost) or to remain unse-cured and risk loss. There is no notion of geogra-phy or tra�c. Varian [34] proposed a game-theoreticmodel to understand how security impacts the deci-sions of other rational actors, but without consider-ing network topology or how infections may spread.Subsequently, a number of authors [26, 5] have pro-posed models of computer-infection spread that com-bine game theory with network topology. These mod-els focus on optimal strategies to combat a binarystate of infection.
By contrast, a number of models have been de-veloped to explore the spread of malware, such ascomputer worms [14]. Compartmental models of dis-ease spread (whether biological or electronic) are at-tractive methods for investigating the progress of epi-demics [4]. For example, Ajelli et al. describe thespread of a botnet using such a model [1]. Other workincorporates additional factors into di�erential equa-tion models, such as locations based on time zone [12]and peer-to-peer protocols [29]. These approaches fo-
10

cus on the spread of a single type of malware, suchas a particular worm or botnet. By contrast, our ap-proach is to model all malware in a generic way, in-corporating both the economics of interventions, andthe way interventions a�ect the spread of malicioustra�c on the Internet topology at the AS level.
A major di�erence between agent-based models,such as ASIM, and di�erential equation models, suchas those described above, is that the latter assumethat populations are `well-mixed'; consequently theydo not capture the e�ect of skewed network topolo-gies. Various extensions, such as percolation methodsand generating functions [25], have been proposed asa method for overcoming this limitation, spawning agreat deal of interest in epidemics on network topolo-gies [15]. Other extensions include using packet-leveldata generated by computer network tra�c simula-tors [35]. In addition to investigating the spread ofmalware across network topologies, mitigation strate-gies such as quarantining malicious hosts [22, 27, 11]have been investigated. However, to the best of ourknowledge, there are no studies that use these mod-els to investigate intervention policies at the ISP orInternet-level.
7 Discussion
ASIM simpli�es many aspects of routing on the realInternet. For example, tra�c in ASIM always followsthe shortest path, whereas real tra�c is also in�u-enced by agreements between ASes, following variousconventions such as the �valley free� rule. In ASIMASes earn money from all tra�c they route, whereasin reality ASes earn money from their customers andpay their own upstream providers. But we found inpreliminary investigations that these added complexi-ties do not improve the accuracy of the model, at leastin terms of measures such as average path length, de-gree distribution, etc. More detailed modeling is atopic for future research and may lead to have impli-cations for the study of policy interventions.
Other model enhancements would allow us to studymore carefully the impact of interventions on the eco-nomics of network growth. We have presented a sim-ple initial approach, using blacklisting, but in futurewe intend to explore other aspects, such as the costof carrying out various interventions. Blacklisting issimple in that packets from a particular source aredropped, whereas �ltering only wicked tra�c wouldlikely be much more expensive, requiring a sophis-ticated intrusion detection system (IDS). Because ofthe performance requirements, it may be infeasible to
�lter tra�c using an IDS at the level of the powerfulrouters used in the largest ASes. In this case, black-listing and improving end-user security may be theonly reasonable options.
In our experiments with network growth, we keptthe level of wickedness, or compromised hosts, con-stant. This is clearly unrealistic as the number ofcompromised hosts changes over time as some arecleaned up and others infected. Furthermore, we ex-pect that the amount of wicked tra�c reaching end-users will also in�uence infection rates. It is di�cultto �nd good data on how these rates change over time,and so it will be di�cult to validate a model that cap-tures these aspects. One topic for future research is tomodel dynamic wickedness levels, perhaps followingan epidemiological model where there is some rate ofrecovery from infection, and some rate of reinfection,which is to some degree dependent on wicked tra�c�ow.
8 Conclusions
The results of our experiments using ASIM indicatethat when �ltering wicked tra�c, the best targets forintervention are a small group of the largest ASes.Speci�cally, we �nd that intervention by the top 0.2%of ASes (in terms of size) is more e�ective than in-tervention by a randomly chosen subset of 30% of allASes. However, we show that this e�cacy rapidlydrops o� if less than three quarters of that top 0.2%intervene. This is an issue of importance if not all thelargest ASes fall within the same regulatory domain,such as a nation-state.
Our experiments also illustrate the relative e�ec-tiveness of �ltering ingress and egress tra�c. Weshow that �ltering ingress tra�c (including transit)is more than twice as e�ective as �ltering egress traf-�c alone. Unsurprisingly, the e�ect of �ltering is feltmost strongly by those actively �ltering the data, al-though positive externalities can be seen if outgoingor transit tra�c is �ltered. In our model, �lteringegress tra�c is also a proxy for end-user remediation,which suggests that the current focus on cleaning upISP customers is not the most e�ective strategy.
In the case of blacklisting, we show that the choiceof which ASes should be exempt from blacklistingdepends on how much legitimate tra�c loss we arewilling to tolerate. If moderate levels of legitimatetra�c loss are acceptable, then large ASes should beexempt; however, if higher levels of tra�c loss areacceptable all ASes should be eligible for blacklisting.The threshold for which ASes are blacklisted does not
11

relate linearly to the reduction in the wicked tra�crate. This is likely due to attrition of good tra�c,raising the fraction of wicked tra�c seen.Our investigations of the impact of interventions
on the evolution of the network are brief and are lim-ited to modeling the e�ect of blacklisting tra�c ongrowth. We show that blacklisting tra�c results in agradual increase in wicked tra�c, and a more rapidreduction in the loss of legitimate tra�c. Althoughthis is bene�cial in the short term, in the long-termthose ASes that pro�t most from wicked tra�c willprosper at the expense of more secure ASes, and soglobal e�ectiveness will decline.We believe that the results reported in this pa-
per are a good proof-of-concept demonstration of howagent-based modeling can be useful to policy makerswhen considering di�erent interventions. We hopein future that our approach will provide additionalinteresting results and tools to help policy makersdetermine the best way to respond to the growingmalware threat.
9 Acknowledgments
The authors gratefully acknowledge the support ofDOE grant DE-AC02-05CH11231. Stephanie For-rest acknowledges partial support of DARPA (P-1070-113237), NSF (EF1038682,SHF0905236), andAFOSR (Fa9550-07-1-0532).
References
[1] M. Ajelli, R. Lo Cigno, and A. Montresor. Mod-eling botnets and epidemic malware. In Communi-cations (ICC), 2010 IEEE International Conferenceon, pages 1 �5, May 2010.
[2] R. Anderson, R. Böhme, R. Clayton, and T. Moore.Security economics and European policy. In M. E.Johnson, editor, Managing Information Risk and theEconomics of Security, pages 55�80. Springer, 2008.
[3] R. Anderson and T. Moore. The economics of infor-mation security. Science, 314(5799):610�613, Octo-ber 2006.
[4] R. M. Anderson and R. M. May. Infectious Diseasesof Humans Dynamics and Control. Oxford Univer-sity Press, 1992.
[5] J. Aspnes, N. Rustagi, and J. Saia. Worm versusalert: who wins in a battle for control of a large-scale network? In Proceedings of the 11th inter-national conference on Principles of distributed sys-tems, OPODIS'07, pages 443�456. Springer-Verlag,2007.
[6] I. I. Association. Internet service providers voluntarycode of practice for industry self-regulation in thearea of cyber security, 2010. http://iia.net.au/
images/resources/pdf/iiacybersecuritycode_
implementation_dec2010.pdf.[7] H. Chang, S. Jamin, and W. Willinger. Internet
connectivity at the AS-level: an optimization-drivenmodeling approach. In MoMeTools '03: Proceedingsof the ACM SIGCOMM workshop on Models, meth-ods and tools for reproducible network research, pages33�46, New York, NY, USA, 2003. ACM.
[8] H. Chang, S. Jamin, and W. Willinger. To peer ornot to peer: Modeling the evolution of the Internet'sAS-level topology. In Proc. IEEE INFOCOM, 2006.
[9] R. Clayton. Might governments clean up malware?In Workshop on the Economics of Information Se-curity, 2010. http://weis2010.econinfosec.org/
papers/session4/weis2010_clayton.pdf.[10] Comcast. Comcast.net security � constant guard.
http://security.comcast.net/constantguard/.[11] S. E. Coull and B. K. Szymanski. A reputation-
based system for the quarantine of random scanningworms, 2005.
[12] D. Dagon, C. Zou, and W. Lee. Modeling botnetpropagation using time zones. In In Proceedings ofthe 13 th Network and Distributed System SecuritySymposium NDSS, 2006.
[13] G. Evron. Dutch isps sign anti-botnet treaty. DarkReading, Sept. 2009. http://www.darkreading.com/blog/archives/2009/09/dutch_isps_sign.html.
[14] S. Fei, L. Zhaowen, and M. Yan. A survey of inter-net worm propagation models. In Broadband Net-work Multimedia Technology, 2009. IC-BNMT '09.2nd IEEE International Conference on, pages 453�457, Oct. 2009.
[15] A. Ganesh, L. Massoulié, and D. Towsley. Thee�ect of network topology on the spread of epidemics.In in IEEE INFOCOM, pages 1455�1466, 2005.
[16] K. E. Haynes and A. Fotheringham. Gravity andSpatial Interaction Models. Sage-Publications, 1984.
[17] P. Holme, J. Karlin, and S. Forrest. An integratedmodel of tra�c, geography and economy in the in-ternet. ACM SIGCOMM Computer CommunicationReview, 38(3):7�15, 2008.
[18] S. Karge. The german anti-botnet initiative.In OECD Workshop on the role of Internetintermediaries in advancing public policy objec-tives, 2010. http://www.oecd.org/dataoecd/42/
50/45509383.pdf.[19] M. Lelarge. Economics of malware: epidemic risks
model, network externalities and incentives. InProceedings of the 47th annual Allerton conferenceon Communication, control, and computing, pages1353�1360, 2009.
[20] M. Lelarge and J. Bolot. Economic incentives to in-crease security in the internet: The case for insur-ance. In INFOCOM 2009, IEEE, pages 1494 �1502,Apr. 2009.
[21] N. Mody, M. O'Reirdan, S. Masiello, and J. Ze-
12

bek. Messaging Anti-Abuse Working Groupcommon best practices for mitigating large scalebot infections in residential networks, 2009.http://www.maawg.org/system/files/news/
MAAWG_Bot_Mitigation_BP_2009-07.pdf.[22] D. Moore, C. Shannon, G. Voelker, and S. Savage.
Internet quarantine: requirements for containingself-propagating code. In INFOCOM 2003. Twenty-Second Annual Joint Conference of the IEEE Com-puter and Communications. IEEE Societies, vol-ume 3, pages 1901 � 1910 vol.3, Mar. 2003.
[23] T. Moore and R. Clayton. The consequence of non-cooperation in the �ght against phishing. In Anti-Phishing Working Group eCrime Researchers Sum-mit (APWG eCrime), pages 1�14, 2008.
[24] T. Moore, R. Clayton, and R. Anderson. The eco-nomics of online crime. Journal of Economic Per-spectives, 23(3):3�20, 2009.
[25] M. E. J. Newman. Spread of epidemic disease onnetworks. Phys. Rev. E, 66(1), Jul 2002.
[26] J. Omic, A. Orda, and P. Van Mieghem. Protectingagainst network infections: A game theoretic per-spective. In INFOCOM 2009, IEEE, pages 1485 �1493, Apr. 2009.
[27] F. Palmieri and U. Fiore. Containing large-scaleworm spreading in the internet by cooperative dis-tribution of tra�c �ltering policies. Computers &Security, 27(1-2):48 � 62, 2008.
[28] P. Porras, H. Saidi, and V. Yegneswaran. An analysisof con�cker's logic and rendezvous points. Technicalreport, SRI International, 2009. http://mtc.sri.
com/Conficker/.[29] J. Schafer, K. Malinka, and P. Hanacek. Malware
spreading models in peer-to-peer networks. In Se-curity Technology, 2008. ICCST 2008. 42nd AnnualIEEE International Carnahan Conference on, pages339 �345, Oct. 2008.
[30] B. Stone-Gross, A. Moser, C. Kruegel, E. Kirda, andK. Almeroth. FIRE: FInding Rogue nEtworks. InProceedings of the Annual Computer Security Appli-cations Conference (ACSAC), Honolulu, HI, Decem-ber 2009.
[31] M. van Eeten, H. Asghari, J. M. Bauer, andS. Tabatabaie. Internet service providers and botnetmitigation: A fact-�nding study on the Dutchmarket. Technical report, Netherlands Ministryof Economic A�airs, Agriculture and Innovation,The Hague, 2011. http://rijksoverheid.nl/
ministeries/eleni/documenten-en-publicaties/
rapporten/2011/01/13/
internet-service-providers-and-botnet-mitigation.
html.[32] M. van Eeten and J. M. Bauer. Economics of mal-
ware: security decisions, incentives and externali-ties. Technical report, OECD STI Working paper2008/1, 2008. http://www.oecd.org/dataoecd/53/
17/40722462.pdf.[33] M. van Eeten, J. M. Bauer, H. Asghari, and
S. Tabatabaie. The role of internet service providersin botnet mitigation: An empirical analysis basedon spam data. Technical report, OECD STI Work-ing Paper 2010/5, 2010. http://www.oecd.org/
officialdocuments/publicdisplaydocumentpdf/
?cote=dsti/doc(2010)5&docLanguage=En.[34] H. R. Varian. System reliability and free riding.
In Economics of Information Security, pages 1�15.Kluwer Academic Publishers, 2004.
[35] S. Wei, J. Mirkovic, and M. Swany. Distributed wormsimulation with a realistic internet model. In Princi-ples of Advanced and Distributed Simulation, 2005.PADS 2005. Workshop on, pages 71 � 79, June 2005.
13