Embed Size (px)
Citation preview
Modeling Hydra Behavior Using Methods
Founded in Behavior-Based Robotics
MALIN AKTIUS
Department of Applied Mechanics
Division of Vehicle Safety
CHALMERS UNIVERSITY OF TECHNOLOGY
Göteborg, Sweden 2007
Master’s Thesis 2007:17

MASTER’S THESIS 2007:17
MODELING HYDRA BEHAVIOR USINGMETHODS FOUNDED IN BEHAVIOR-BASED
ROBOTICS
MALIN AKTIUS
Department of Applied MechanicsDivision of Vehicle Safety
CHALMERS UNIVERSITY OF TECHNOLOGYGöteborg, Sweden 2007
Modeling Hydra Behavior Using Methods Founded in Behavior-Based RoboticsMALIN AKTIUSMaster’s Thesis in Engineering Mechatronics
c© MALIN AKTIUS, 2007
Master’s Thesis 2007:17ISSN 1652-8557Department of Applied MechanicsDivision of Vehicle SafetyChalmers University of TechnologySE-41296 GöteborgSwedenTel. +46-(0)31 772 1000
Chalmers ReproserviceGöteborg, Sweden 2007

Till Ann och Lennart

Modeling Hydra Behavior Using Methods Founded in Behavior-Based RoboticsMaster’s Thesis in Engineering MechatronicsMALIN AKTIUSDepartment of Applied MechanicsDivision of Vehicle SafetyChalmers University of Technology
AbstractIn this thesis work methods from the field of behavior-based robotics are used to modelthe behavior of a biological organism. The cnidarian Hydra was selected as the modelorganism for this project, and the colony-style architecture was chosen as the method tobe used for organizing the constituent behaviors of Hydra into an overall behavior. Theindividual behaviors were generated and organized in a simulated animal. Validation ofthe individual behaviors were carried out with respect to quantitative data available frompreviously conducted experiments on the animal. In the case of the overall behavior,which emerged from the organization of the individual behaviors using the colony-stylearchitecture, only a qualitative comparison was feasible. Tests conducted on the modeledHydra suggests that the colony-style architecture can be used to model behavior propertieslike latency, activation threshold, habituation, and duration of the individual behaviors ofHydra. Simulations of the overall behavior of the animal show that the spatial movementpatterns of Hydra in the absence of external stimuli, as well as the effect of starvation onits contraction frequency, agrees with results from experiments conducted on the physicalanimal.
Keywords: behavior-based modeling, Hydra, colony-style architecture, evolutionary al-gorithms, recurrent neural networks.
i

Acknowledgments
First, I would like to thank my supervisor and examiner, Dr. Mats Nordahl. You taking onthis thesis project enabled me to absorb in the fascinating field of behavior-based roboticsduring the final semester of my MSc studies. I am thankful for your good advice.
I am also deeply grateful to Carl-Henrik Fant, Johanna Hector, Mikael Carlsson, andMarkus Kvist. Without your support during the past semester, I would not have been ableto complete this thesis. Thank you.
Finally, thank you Fredrik for standing beside me during this time.
Malin AktiusGöteborg, 2007
iii

Table of Contents
1 Introduction 11.1 Objectives . . . . . . . . . . . . . . . . . . . . . . . . . . . . . . . . . . 31.2 Related work . . . . . . . . . . . . . . . . . . . . . . . . . . . . . . . . 31.3 Outline . . . . . . . . . . . . . . . . . . . . . . . . . . . . . . . . . . . 4
2 Notation 5
3 Animal behavior 73.1 Sensory system and motivational state . . . . . . . . . . . . . . . . . . . 83.2 Patterns of movement . . . . . . . . . . . . . . . . . . . . . . . . . . . . 9
3.2.1 Reflexes . . . . . . . . . . . . . . . . . . . . . . . . . . . . . . . 93.2.2 Fixed action patterns . . . . . . . . . . . . . . . . . . . . . . . . 103.2.3 Orientation of movement . . . . . . . . . . . . . . . . . . . . . . 10
4 Behavior-based robotics 134.1 Generation of robot behaviors . . . . . . . . . . . . . . . . . . . . . . . 134.2 Organization of robot behaviors . . . . . . . . . . . . . . . . . . . . . . 14
5 Hydra 155.1 Hydra as a model organism . . . . . . . . . . . . . . . . . . . . . . . . . 15
5.1.1 Physiology . . . . . . . . . . . . . . . . . . . . . . . . . . . . . 165.1.2 Sensory cells . . . . . . . . . . . . . . . . . . . . . . . . . . . . 175.1.3 Behavior repertoire . . . . . . . . . . . . . . . . . . . . . . . . . 175.1.4 Behavior coordination . . . . . . . . . . . . . . . . . . . . . . . 18
v
vi Table of Contents
6 Models and methods 216.1 The simulated system . . . . . . . . . . . . . . . . . . . . . . . . . . . . 21
6.1.1 Movement patterns . . . . . . . . . . . . . . . . . . . . . . . . . 22
6.1.2 Exteroceptive sensory system . . . . . . . . . . . . . . . . . . . 23
6.1.3 Proprioceptive sensory system . . . . . . . . . . . . . . . . . . . 23
6.1.4 Motivational state . . . . . . . . . . . . . . . . . . . . . . . . . . 24
6.1.5 Environment . . . . . . . . . . . . . . . . . . . . . . . . . . . . 24
6.1.6 Model parameters . . . . . . . . . . . . . . . . . . . . . . . . . . 25
6.2 Behavioral organizer . . . . . . . . . . . . . . . . . . . . . . . . . . . . 25
6.2.1 Applicability clause . . . . . . . . . . . . . . . . . . . . . . . . 26
6.2.2 Transfer function . . . . . . . . . . . . . . . . . . . . . . . . . . 26
6.3 Constituent behaviors . . . . . . . . . . . . . . . . . . . . . . . . . . . . 26
7 Results and discussion 297.1 Generation of behaviors . . . . . . . . . . . . . . . . . . . . . . . . . . . 29
7.1.1 B1: Spontaneous actions . . . . . . . . . . . . . . . . . . . . . . 30
7.1.2 B2: Respond to mechanical stimulus . . . . . . . . . . . . . . . . 31
7.1.3 B3: Respond to light stimulus . . . . . . . . . . . . . . . . . . . 37
7.1.4 B4: Feeding . . . . . . . . . . . . . . . . . . . . . . . . . . . . . 38
7.2 Generation of behavioral organizer . . . . . . . . . . . . . . . . . . . . . 40
7.2.1 Experiment A: Spontaneous locomotion patterns . . . . . . . . . 40
7.2.2 Experiment B: Effect of starvation on contraction frequency . . . 40
8 Summary and conclusions 45
Bibliography 47
A Evolutionary algorithms 53A.1 Encoding scheme . . . . . . . . . . . . . . . . . . . . . . . . . . . . . . 53
A.2 Fitness function . . . . . . . . . . . . . . . . . . . . . . . . . . . . . . . 54
A.3 Selection . . . . . . . . . . . . . . . . . . . . . . . . . . . . . . . . . . 54
A.4 Crossover . . . . . . . . . . . . . . . . . . . . . . . . . . . . . . . . . . 55
A.5 Mutations . . . . . . . . . . . . . . . . . . . . . . . . . . . . . . . . . . 55
A.6 Elitism . . . . . . . . . . . . . . . . . . . . . . . . . . . . . . . . . . . . 55

Table of Contents vii
B Recurrent neural networks 57B.1 Network equations . . . . . . . . . . . . . . . . . . . . . . . . . . . . . 57B.2 Learning algorithms . . . . . . . . . . . . . . . . . . . . . . . . . . . . . 59

Chapter 1Introduction
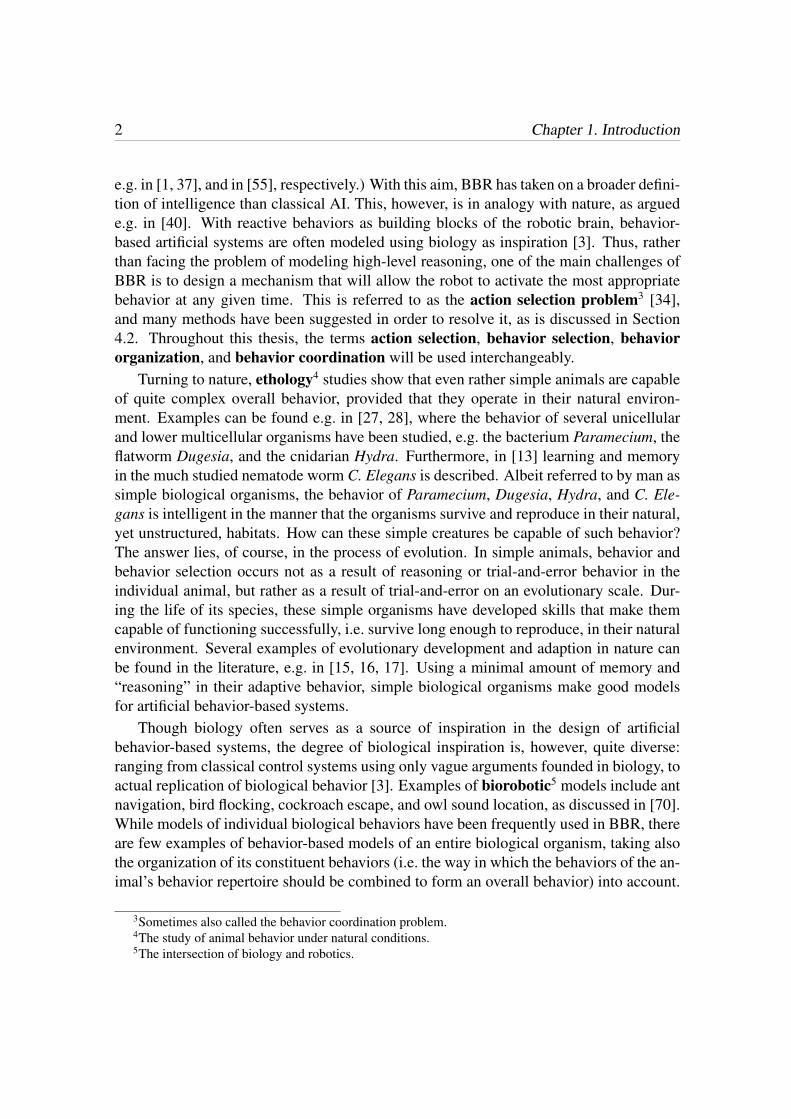
During the past decades autonomous robots have undergone rapid development, and itis expected that such robots will play an increasingly important role in our society in thefuture [4, 5, 57]. Lawn mower robots, vacuum cleaning robots, and various entertainmentrobots reached the market several years ago, while robots designed for domestic assis-tance, service, and surveillance are under development. Examples of various autonomousrobots, and their application areas, can be found in [4, 5, 58]. Autonomous robots areexpected to operate in unstructured environments, i.e. environments that change in anunpredictable way. For such robots traditional control strategies defined a priori are ofteninsufficient, since the robot must be able to perceive and adapt to changes in its environ-ment in order to function successfully.
There are many different approaches to the problem of generating brains1 for au-tonomous robots. In classical artificial intelligence (AI) the flow of information is ar-ranged in a sequential way: the robot uses information acquired through its sensors tobuild a world model, based on which it reasons about the effect of various actions. Asa last step, the robot then decides upon an action, which is executed. This sense-plan-act approach of classical AI requires implementation of high-level reasoning, somethingthat turned out to be difficult, as pointed out e.g. in [9, 67]. Thus, while classical AI hasbeen successfully applied in various fields, e.g. pattern recognition, its goal of generatingintelligent artificial agents has not (yet) been reached [67].
An alternative to the classical AI approach to machine intelligence, behavior-basedrobotics (BBR) was introduced in the mid 1980s, by R. Brooks and others. See e.g. [8]for one of the pioneering works in BBR. In contrast with classical AI, behavior-basedrobotic brains are designed using a parallel, decentralized architecture. In BBR the aim isto organize simple, often reactive behaviors2 in such a way to make the robot functionadequately in an unstructured environment. (Introductions to BBR and AI can be found
1Sometimes also referred to as control systems.2Direct coupling between sensors and actuators.
1
2 Chapter 1. Introduction
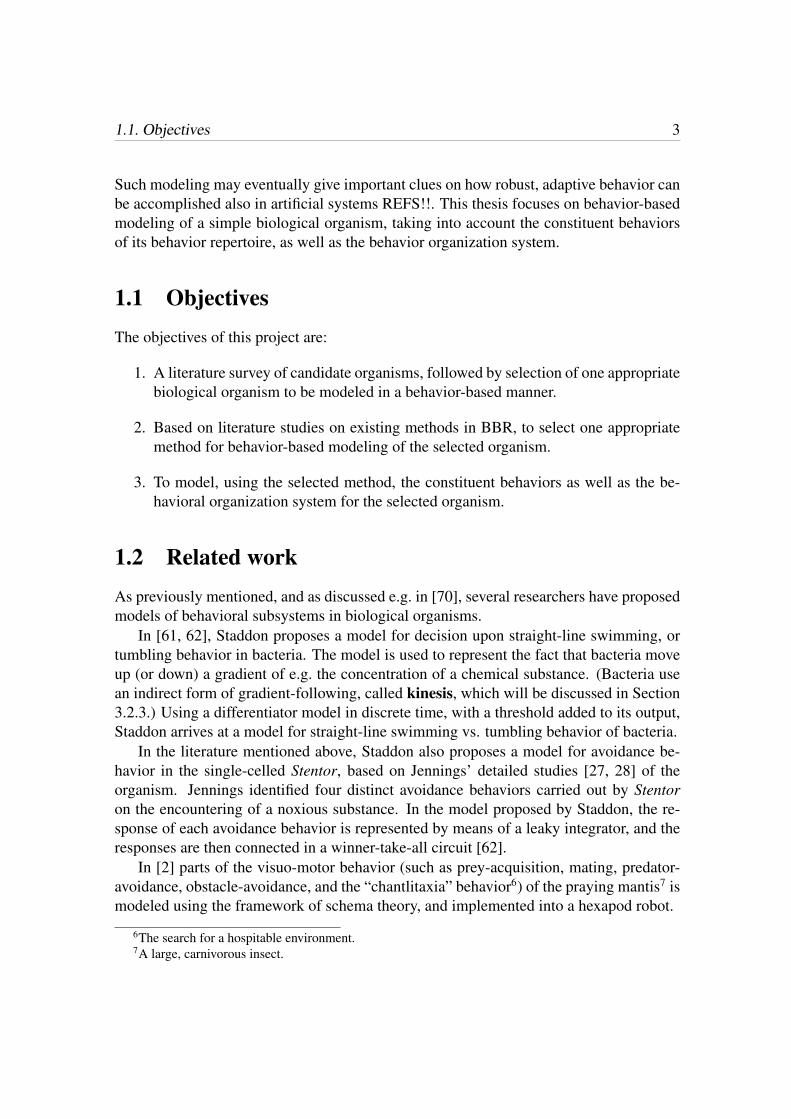
e.g. in [1, 37], and in [55], respectively.) With this aim, BBR has taken on a broader defini-tion of intelligence than classical AI. This, however, is in analogy with nature, as arguede.g. in [40]. With reactive behaviors as building blocks of the robotic brain, behavior-based artificial systems are often modeled using biology as inspiration [3]. Thus, ratherthan facing the problem of modeling high-level reasoning, one of the main challenges ofBBR is to design a mechanism that will allow the robot to activate the most appropriatebehavior at any given time. This is referred to as the action selection problem3 [34],and many methods have been suggested in order to resolve it, as is discussed in Section4.2. Throughout this thesis, the terms action selection, behavior selection, behaviororganization, and behavior coordination will be used interchangeably.
Turning to nature, ethology4 studies show that even rather simple animals are capableof quite complex overall behavior, provided that they operate in their natural environ-ment. Examples can be found e.g. in [27, 28], where the behavior of several unicellularand lower multicellular organisms have been studied, e.g. the bacterium Paramecium, theflatworm Dugesia, and the cnidarian Hydra. Furthermore, in [13] learning and memoryin the much studied nematode worm C. Elegans is described. Albeit referred to by man assimple biological organisms, the behavior of Paramecium, Dugesia, Hydra, and C. Ele-gans is intelligent in the manner that the organisms survive and reproduce in their natural,yet unstructured, habitats. How can these simple creatures be capable of such behavior?The answer lies, of course, in the process of evolution. In simple animals, behavior andbehavior selection occurs not as a result of reasoning or trial-and-error behavior in theindividual animal, but rather as a result of trial-and-error on an evolutionary scale. Dur-ing the life of its species, these simple organisms have developed skills that make themcapable of functioning successfully, i.e. survive long enough to reproduce, in their naturalenvironment. Several examples of evolutionary development and adaption in nature canbe found in the literature, e.g. in [15, 16, 17]. Using a minimal amount of memory and“reasoning” in their adaptive behavior, simple biological organisms make good modelsfor artificial behavior-based systems.
Though biology often serves as a source of inspiration in the design of artificialbehavior-based systems, the degree of biological inspiration is, however, quite diverse:ranging from classical control systems using only vague arguments founded in biology, toactual replication of biological behavior [3]. Examples of biorobotic5 models include antnavigation, bird flocking, cockroach escape, and owl sound location, as discussed in [70].While models of individual biological behaviors have been frequently used in BBR, thereare few examples of behavior-based models of an entire biological organism, taking alsothe organization of its constituent behaviors (i.e. the way in which the behaviors of the an-imal’s behavior repertoire should be combined to form an overall behavior) into account.
3Sometimes also called the behavior coordination problem.4The study of animal behavior under natural conditions.5The intersection of biology and robotics.
1.1. Objectives 3
Such modeling may eventually give important clues on how robust, adaptive behavior canbe accomplished also in artificial systems REFS!!. This thesis focuses on behavior-basedmodeling of a simple biological organism, taking into account the constituent behaviorsof its behavior repertoire, as well as the behavior organization system.
1.1 ObjectivesThe objectives of this project are:
1. A literature survey of candidate organisms, followed by selection of one appropriatebiological organism to be modeled in a behavior-based manner.
2. Based on literature studies on existing methods in BBR, to select one appropriatemethod for behavior-based modeling of the selected organism.
3. To model, using the selected method, the constituent behaviors as well as the be-havioral organization system for the selected organism.
1.2 Related workAs previously mentioned, and as discussed e.g. in [70], several researchers have proposedmodels of behavioral subsystems in biological organisms.
In [61, 62], Staddon proposes a model for decision upon straight-line swimming, ortumbling behavior in bacteria. The model is used to represent the fact that bacteria moveup (or down) a gradient of e.g. the concentration of a chemical substance. (Bacteria usean indirect form of gradient-following, called kinesis, which will be discussed in Section3.2.3.) Using a differentiator model in discrete time, with a threshold added to its output,Staddon arrives at a model for straight-line swimming vs. tumbling behavior of bacteria.
In the literature mentioned above, Staddon also proposes a model for avoidance be-havior in the single-celled Stentor, based on Jennings’ detailed studies [27, 28] of theorganism. Jennings identified four distinct avoidance behaviors carried out by Stentoron the encountering of a noxious substance. In the model proposed by Staddon, the re-sponse of each avoidance behavior is represented by means of a leaky integrator, and theresponses are then connected in a winner-take-all circuit [62].
In [2] parts of the visuo-motor behavior (such as prey-acquisition, mating, predator-avoidance, obstacle-avoidance, and the “chantlitaxia” behavior6) of the praying mantis7 ismodeled using the framework of schema theory, and implemented into a hexapod robot.
6The search for a hospitable environment.7A large, carnivorous insect.
4 Chapter 1. Introduction
1.3 OutlineFollowing the introduction in this chapter, this thesis is arranged in the following manner:
Chapter 2: In this chapter, an overview of recurring abbreviations and notations usedthroughout this thesis is presented.
Chapter 3-4: These chapters introduce relevant theory for this project, aiming at puttingthe problem into context. Chapter 3 provides a background to animal behavior,whereas Chapter 4 introduces the framework of behavior-based robotics.
Chapter 5: This chapter presents the model organism of choice for this thesis, and con-cludes with a description of that organism from a behavioral point of view.
Chapter 6: Here, the models and methods used in this project are described.
Chapter 7: This chapter presents and discusses the resulting behavioral model in termsof the tests conducted, and the results obtained from these experiments.
Chapter 8: This final chapter presents the conclusions drawn, and recommendations forfuture work.
Appendix A-B: Appendices A and B present a brief introduction to evolutionary algo-rithms and recurrent neural networks, respectively.
Chapter 2Notation
This chapter provides a list of recurring abbreviations, as well as notations used through-out this thesis. In general, technical terms are typeset in bold on their first occurence.Names of biological organisms are typeset in italics.
Abbreviations
AC Applicability clauseAI Artificial intelligenceANN Artificial neural networkBBR Behavior-based roboticsCNS Central nervous systemCP Contraction pulseCSA Colony-style architectureEA Evolutionary algorithmER Evolutionary roboticsES Evolution strategiesESS Evolutionary stable strategyFAP Fixed action patternFFNN Feed forward neural networkFSM Finite state machineGA Genetic algorithmGP Genetic programmingGSH GlutathioneISI Inter-stimulus intervalLP Locomotion pulseRMSE Root mean squared errorRNN Recurrent neural networkTF Transfer function
5
6 Chapter 2. Notation
Upper-case letters
B BehaviorE(λ) Exponential distribution with expected value 1/λM Motivational state variableR Stochastic variable representing rateT ThresholdU(a, b) Uniform distribution on [a, b]
Lower-case letters
b Bias termm Mutation operatorp Probabilityw Weight parameter
Greek letters
µ Expected valueτ Time constant
Subscripts
beh Behaviorc Chemicalcon Contractionext Extensionf Foot, Feedingh Hungerl Lightloc Locomotionm Mechanical
Chapter 3Animal behavior
The aim of this work is to model, using the framework of BBR, the overall behavior of asimple biological organism. The following two chapters introduce the relevant theory forthat approach. In this chapter, some remarks concerning modeling animal behavior willfirst be given, aimed at putting the problem into context. The chapter then continues witha brief introduction to animal behavior. In the next chapter, an introduction to the relevanttheory from BBR for this thesis project will be given.
First, it should be noted that modeling behavior in biological organisms (in any butthe simplest cases) concerns modeling a system which is far from completely understood.When modeling biological behavior, not only physical laws apply, but also physiologicalconditions, internal drives, and environmental context [72]. Also complicating the issue isthe interaction between success and survival at the individual and species levels. Hence,inevitably a number of questions arise regarding the purpose and aim of the modeling task.In e.g. [18, 35, 65], behavioral modeling is discussed in more detail. See also e.g. [21] fora more general introduction to the modeling of biological systems. In addition, B. Webbhas addressed the question of modeling biological behavior by defining seven dimensionson which models of biological behavior can differ [70]. While a thorough discussionon aspects of biological behavioral models is beyond the scope of this text, it should bementioned that a behavioral model of a biological organism may aim at describing theorganism on one or more out of several levels. In [1], it is argued that the field of BBRcan gain from the study of at least three such levels, namely neuroscience1, psychology2,and ethology (see Chapter 1), as described below.
Neuroscience: This level concerns the neural processes underlying behavior, e.g. neuralnetwork properties such as synaptic transmission. See e.g. [30, 44] for the modelingof neural processes.
1The study of the nervous system.2The study of mind and behavior.
7
8 Chapter 3. Animal behavior
Psychology: Here, behavior is modeled from a functional aspect, using mental functionssuch as memory, emotions, and cognitive processes as the bases of behavior. Often,knowledge of the human mind is used also for animal behavior. Different schools ofpsychology include behaviorism, ecological psychology, and cognitive psychol-ogy. See e.g. [1] for a general description of psychological models used in BBR.Introductions to behaviorism, ecological psychology, and cognitive psychology canbe found in [69], [19], and [20, 26], respectively.
Ethology: Like psychology, ethology uses a functional approach to model behavior.However, ethology focuses on the biological aspect, i.e. the anatomical and physio-logical properties of the animal, rather than the psychological. Also, it stresses theimportance of natural environmental context, i.e. that the behavioral system not onlyincludes the animal, but also the environment in which it lives. See e.g. [36, 39, 60].
In addition to the disciplines mentioned above, an evolutionary approach is also com-monly used in biological modeling. This approach includes fields like sociobiology andevolutionary psychology, where evolutionary advantages of social behaviors and mindfunctions, respectively, are considered. In evolutionary behavioral models, only those be-haviors that are beneficial for a population, in the sense that no alternative behavior ismore advantageous, survive on an evolutionary time scale. This argument was formalizedby Maynard Smith [38], and is termed evolutionary stable strategy (ESS).3 For moreinformation on evolutionary biological modeling, see e.g. [38].
Different disciplines, as the ones just mentioned, of behavioral study contribute tobehavioral modeling in different ways. This work, aiming at a behavior-based model of asimple biological organism, will solely concern the ethology level. In Section 3.2 below,the functional breakdowns of animal behavior, according to ethology, will be discussed.
3.1 Sensory system and motivational stateThe sensory system of an organism can be divided into exteroceptive sensors, and pro-prioceptive sensors [4]. Exteroceptive sensors are used to gather information from theexternal environment in which an organism is situated, while proprioceptive sensors mon-itor the internal state of the organism.
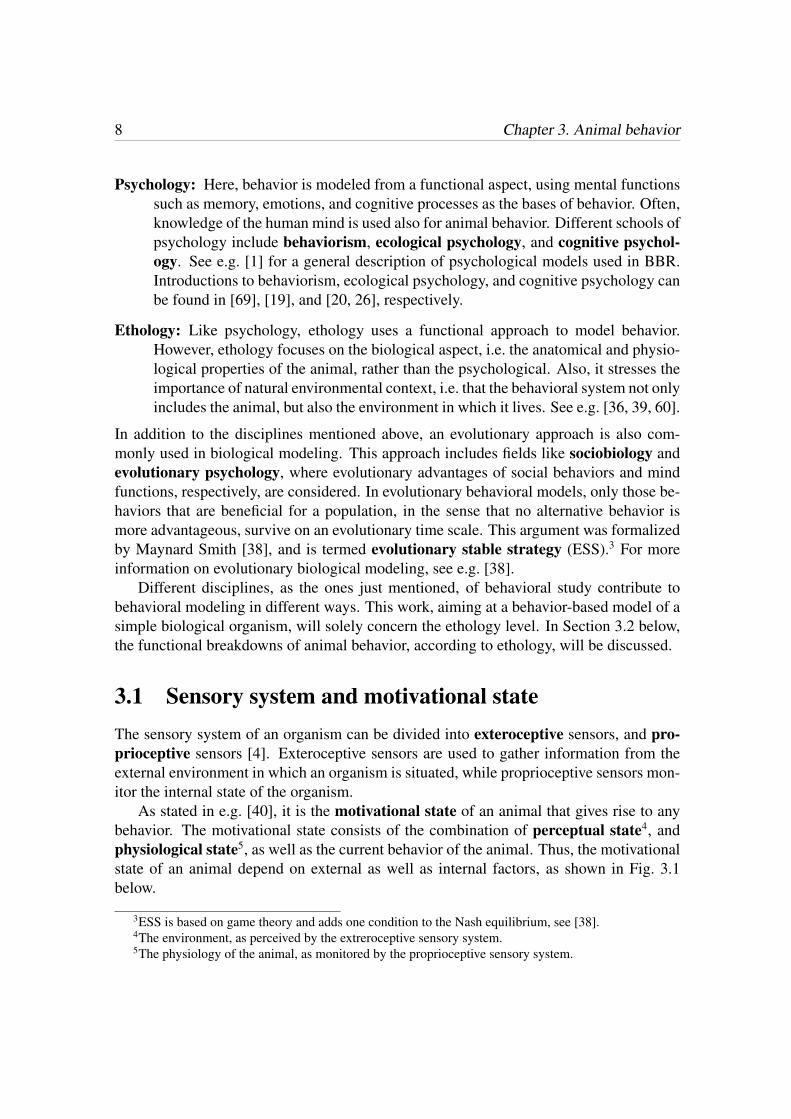
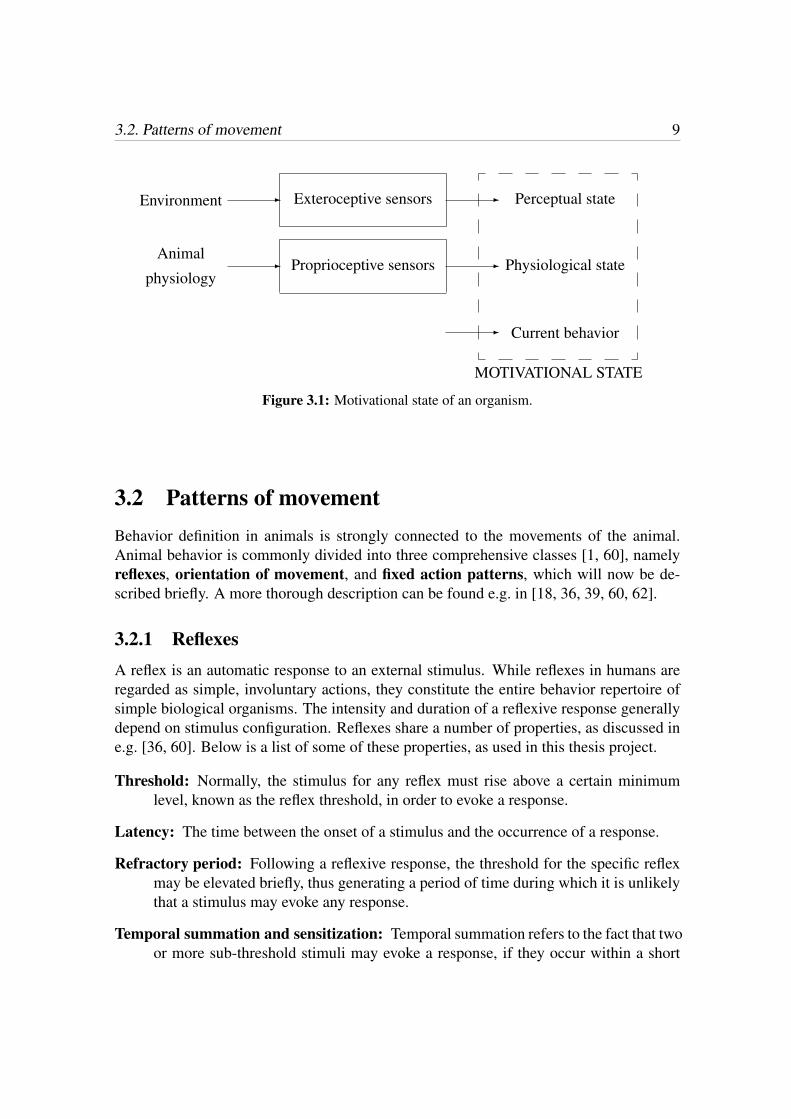
As stated in e.g. [40], it is the motivational state of an animal that gives rise to anybehavior. The motivational state consists of the combination of perceptual state4, andphysiological state5, as well as the current behavior of the animal. Thus, the motivationalstate of an animal depend on external as well as internal factors, as shown in Fig. 3.1below.
3ESS is based on game theory and adds one condition to the Nash equilibrium, see [38].4The environment, as perceived by the extreroceptive sensory system.5The physiology of the animal, as monitored by the proprioceptive sensory system.
3.2. Patterns of movement 9
-
-
Exteroceptive sensors
Proprioceptive sensors
-
-
-
Environment
Animal
physiology
Perceptual state
Physiological state
Current behavior
MOTIVATIONAL STATE
Figure 3.1: Motivational state of an organism.
3.2 Patterns of movementBehavior definition in animals is strongly connected to the movements of the animal.Animal behavior is commonly divided into three comprehensive classes [1, 60], namelyreflexes, orientation of movement, and fixed action patterns, which will now be de-scribed briefly. A more thorough description can be found e.g. in [18, 36, 39, 60, 62].
3.2.1 ReflexesA reflex is an automatic response to an external stimulus. While reflexes in humans areregarded as simple, involuntary actions, they constitute the entire behavior repertoire ofsimple biological organisms. The intensity and duration of a reflexive response generallydepend on stimulus configuration. Reflexes share a number of properties, as discussed ine.g. [36, 60]. Below is a list of some of these properties, as used in this thesis project.
Threshold: Normally, the stimulus for any reflex must rise above a certain minimumlevel, known as the reflex threshold, in order to evoke a response.
Latency: The time between the onset of a stimulus and the occurrence of a response.
Refractory period: Following a reflexive response, the threshold for the specific reflexmay be elevated briefly, thus generating a period of time during which it is unlikelythat a stimulus may evoke any response.
Temporal summation and sensitization: Temporal summation refers to the fact that twoor more sub-threshold stimuli may evoke a response, if they occur within a short
10 Chapter 3. Animal behavior
period of time. Related to temporal summation is sensitization, where a reflexive re-sponse may by more easily evoked (in practice having a lower threshold) followingrepeated stimulus presentation.
Spatial summation: Two or more stimuli applied within a short distance from each othermay evoke a response where one stimulus would fail to do so. Thus, a reflexiveresponse has a receptive field.
Momentum (after-discharge): The response of some reflexes will outlast the stimulusevoking the response. The duration as well as the magnitude of the after-dischargegenerally increase with stimulus intensity.
Habituation: Repeated reflex responses may eventually lead to a decrease in responseintensity, and finally to no response at all. Habituation to a weak stimulus generallyoccurs sooner than to a strong one. Related to habituation is spontaneous recovery,the fact that the effect of habituation ceases with time.
Fatigue: Sense organs tire out, so that the animal is unable to detect stimulus, or musclesbecome exhausted, which make them unable to perform any movement.
Reflexes may interact in various ways, e.g. by competition, thus inhibiting each other,or by cooperation. The adaptive behavior emerging from sensitization and habituationis regarded as the simplest form of learning in biological organisms. Both processes,however, are reversible and thus the organism will eventually return to its original state ifleft alone for a sufficient long period of time. In general, this is not true for other types oflearning mechanisms.
3.2.2 Fixed action patternsFixed action patterns (FAPs) is defined by a stereotyped series of actions following areleasing stimulus. Thus, the response of an FAP typically outlasts the triggering stimulus,but in contrast to reflexive behavior, the duration of the response is not dependent onstimulus characteristics such as duration and intensity. See e.g. [40, 60] for a discussionon, and examples of, FAPs.
3.2.3 Orientation of movementThe orientation of animal movement may be roughly divided into three categories, i.e. ki-nesis, taxes, and navigation.
Kinesis: Indirect following of a gradient for orientation of movement. As an example,bacteria are, in general not capable of detecting a gradient of the concentration of a
3.2. Patterns of movement 11
chemical substance [62]. However, by making use of time dimension, they are ableto sample a gradient which can be used to reorient movement.
Taxes: Direct gradient following. Gradient ascent (or descent) in response to a perceiveddirected stimulus.
Navigation: More complex orientation of movement is found e.g. in homing pigeons,which use the sun as a compass to find the direction of their home location. Beesand ants, for example, use landmarks to guide them on their routes. These morecomplex navigation strategies will not be considered in this project, but the inter-ested reader is referred to e.g. [36, 39, 40, 60].

Chapter 4Behavior-based robotics
As mentioned in Chapter 1, BBR (in contrast with classical AI) takes a bottom-up ap-proach to robotic behavior, and the complete robotic brain is built from a repertoire ofsimple behaviors. It should be mentioned that, more recently, hybrid architectures1 havebecome increasingly common [48], thus filling the gap between BBR and AI somewhat.This chapter provides a brief introduction to the framework of BBR.
The main characteristics of behavior-based systems are low-level intelligence, i.e. atight connection between the robot’s sensors and its actuators, and decomposition of therobot’s overall behavior into individual behaviors, each of which represents a distinctfunctional unit [1]. The generation and, in particular, organization of behaviors constitutevast field of studies, and many methods have been suggested by researchers in the field. Itshould be noted that methods for the generation and organization of behaviors apply notonly to architectures in BBR, but also to most hybrid architectures [48]. More informationconcerning generation and organization of behaviors in BBR can be found e.g. in [1, 47,67, 71]. For a review of current methods used for behavior coordination, see e.g. [49].
Generation and coordination of robot behaviors can be accomplished by means ofhand-coding and traditional engineering techniques, or by means of artificial evolution,in which evolutionary algorithms (EAs) [25] are used as an optimization method. Thelatter case forms the field of evolutionary robotics (ER) [42]. A brief introduction toEAs is provided in Appendix A.
4.1 Generation of robot behaviors
As previously mentioned, in BBR relatively simple behaviors constitute the buildingblocks of the robotic brain. Several architectures for behaviors exist, e.g. if-then-else-
1Combining reactive behaviors from BBR, and deliberative plans from traditional AI.
13
14 Chapter 4. Behavior-based robotics
rules, various modifications of finite state machines (FSMs)2, and artificial neural net-works (ANNs). If-then-else-rules provides a quick way of generating simple behaviorsby means of hand-coding instructions directly into the robotic brain. As a simple exampleconsider a robot that moves straight ahead while there is no object in front of it, and stopsat the encountering of an obstacle. Assuming that conditions for obstacle-detection bythe robot’s sensors, as well as motor signals for the “move forward” and “stop” behaviorshave been defined, this behavior may be formulated as follows: if no object detected thenmove forward else stop.
Biologically inspired architectures, such as ANNs, often provide a suitable frameworkfor the generation of robot behaviors by means of EAs. Especially in cases where it isdifficult to arrive at an explicit model for a specific behavior, such an approach has anobvious advantage over hand-coded behaviors. A brief introduction to ANNs is providedin Appendix B.
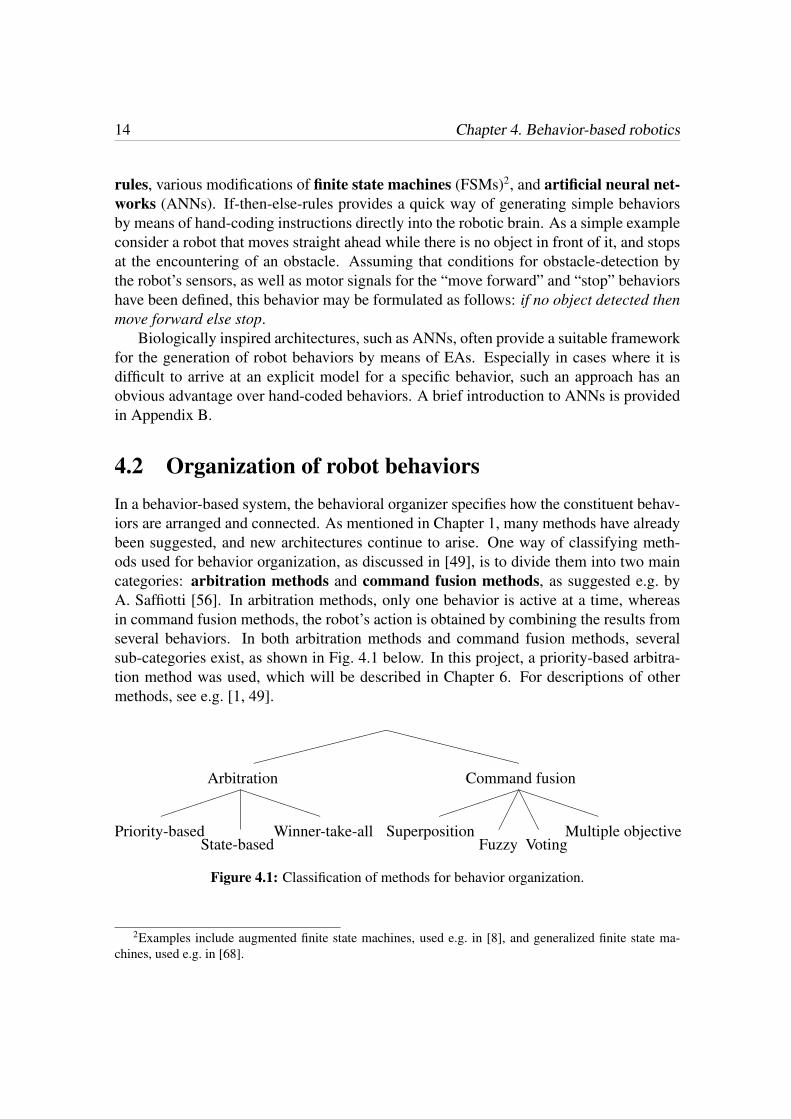
4.2 Organization of robot behaviorsIn a behavior-based system, the behavioral organizer specifies how the constituent behav-iors are arranged and connected. As mentioned in Chapter 1, many methods have alreadybeen suggested, and new architectures continue to arise. One way of classifying meth-ods used for behavior organization, as discussed in [49], is to divide them into two maincategories: arbitration methods and command fusion methods, as suggested e.g. byA. Saffiotti [56]. In arbitration methods, only one behavior is active at a time, whereasin command fusion methods, the robot’s action is obtained by combining the results fromseveral behaviors. In both arbitration methods and command fusion methods, severalsub-categories exist, as shown in Fig. 4.1 below. In this project, a priority-based arbitra-tion method was used, which will be described in Chapter 6. For descriptions of othermethods, see e.g. [1, 49].
����������
XXXXXXXXXX
Arbitration Command fusion������
PPPPPP
���������
AAA
PPPPPP
Priority-basedState-based
Winner-take-all SuperpositionFuzzy Voting
Multiple objective
Figure 4.1: Classification of methods for behavior organization.
2Examples include augmented finite state machines, used e.g. in [8], and generalized finite state ma-chines, used e.g. in [68].
Chapter 5Hydra
This chapter presents the biological model organism of choice for this project, Hydra.The motivation for selecting Hydra as the model organism will first be given, followedby a general description of the organism (in a very condensed form). Lastly, the behaviorrepertoire of Hydra, as described in the literature, is presented.
For this project, several biological organisms were considered as possible model or-ganisms. As mentioned in Section 1.2 Staddon has, based on Jennings’ studies [27, 28],modeled behavior selection in bacteria, and in Stentor [62]. At least in the case of Stentor,Staddon’s model could be expanded to include behaviors not only for the attached Sten-tor, but also for the free swimming one. To allow also for modeling of internal processesin the organism, such as e.g. an active feeding behavior, some multicellular organismswere considered as well. The nervous system of C. Elegans, consisting of 302 neurons,has been completely mapped out, and the animal has been the subject of numerous stud-ies. Flatworms, such as Dugesia, were also considered. Both C. Elegans and Dugesiaare capable of assosiative learning [6, 13, 28, 50]. While this type of learning in animalsis a fascinating topic in its own right, it restricts the possibility of repeating experimentsconcerning behavior selection. As discussed in Section 3.2.1, habituation is a reversibleprocess, something that is not generally true for associative learning. Hydra is an organ-ism more complex than unicellular bacteria and Stentor, but less complex than C. Elegansand flatworms. It has an active feeding behavior but it is not capable of associative learn-ing. The complexity level of Hydra, as well as the number of quantitative and qualitativebehavioral studies available, made Hydra the model organism of choice for this project.
5.1 Hydra as a model organism
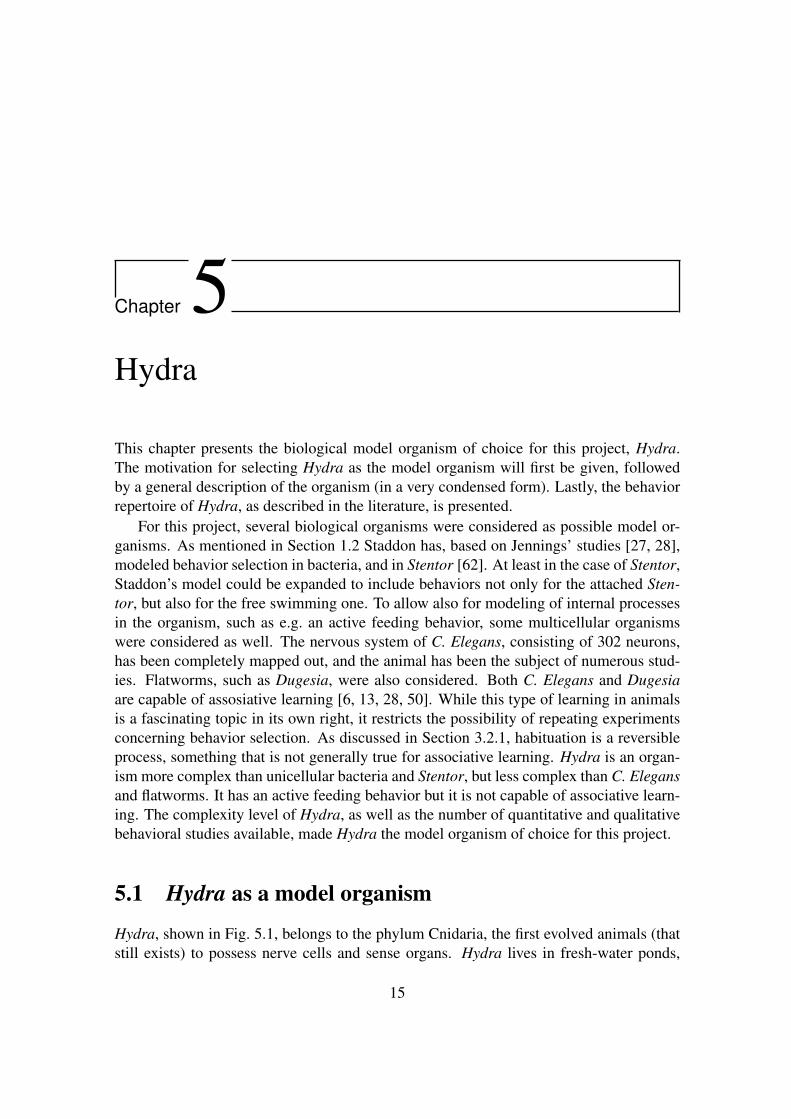
Hydra, shown in Fig. 5.1, belongs to the phylum Cnidaria, the first evolved animals (thatstill exists) to possess nerve cells and sense organs. Hydra lives in fresh-water ponds,
15
16 Chapter 5. Hydra
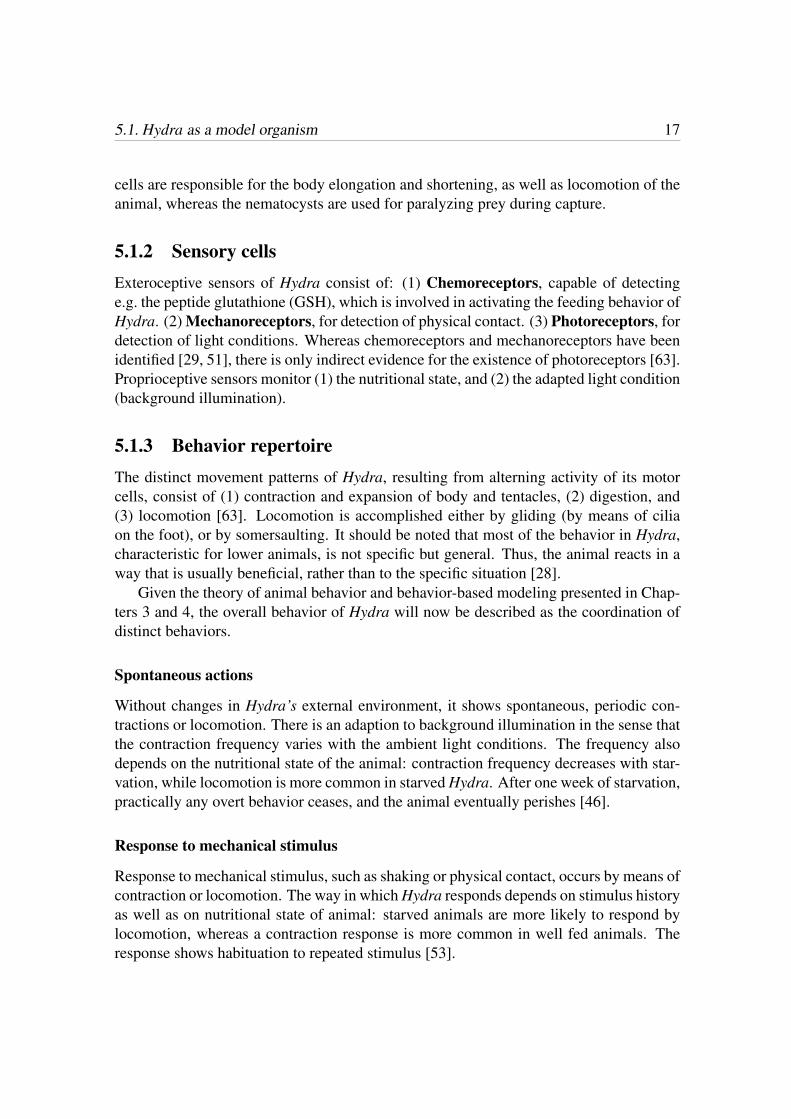
Figure 5.1: The cnidarian Hydra. Image courtesy of BioMedia Associates [7].
lakes, and streams. It is most often found attached to some vegetation by the base of itstubular body1, where it feeds on small aquatic invertebrates, e.g. the multicellular arthro-pod Daphnia or the single-celled protozoan Euglena [24]. Hydra lives and reproducessexually and asexually, in the latter case by means of budding. Most cnidarians have afree swimming medusa stage. Hydra, however, does not, and hence it remains in its tube-shaped polyp form throughout its life. Because of their radial symmetry, cnidarians arecommonly referred to as radiate animals.
5.1.1 Physiology
Hydra is, like other cnidarians, designed around two layers of cell tissue: the outer ec-toderm layer, and the inner endoderm layer. These two cell tissues are separated by agelatinous section, named the mesoglea. The endoderm layer surrounds the animal’s gut,which only opening is located at the hypostome2. Hydra does not possess a central ner-vous system (CNS), but rather its nerve cells are organized in a nerve net that extendsthrough the body, with a limited number of sensory inputs and motor outputs. Nerve cellsare spread throughout the ectoderm as well as the endoderm tissue, and consist of two celltypes: ganglion neurons3, and sensory neurons. However, it is believed that these neu-rons of Hydra actually are multifuntional, thus each possessing the functions of sensory-,motor-, and inter-neurons [63]. Hydra has two types of effectors, or motor cells, namely(1) muscular cells of the endoderm and the ectoderm layer, respectively, and (2) nema-tocysts, which are stinging organells, located on the tentacles of the animal. The muscle
1Henceforth, the base of Hydra’s body will be referred to as its foot.2Area at the top of the animal’s body, and the base of its tentacles.3Interconnected neurons that either process sensory information or control motor outputs.
5.1. Hydra as a model organism 17
cells are responsible for the body elongation and shortening, as well as locomotion of theanimal, whereas the nematocysts are used for paralyzing prey during capture.
5.1.2 Sensory cellsExteroceptive sensors of Hydra consist of: (1) Chemoreceptors, capable of detectinge.g. the peptide glutathione (GSH), which is involved in activating the feeding behavior ofHydra. (2) Mechanoreceptors, for detection of physical contact. (3) Photoreceptors, fordetection of light conditions. Whereas chemoreceptors and mechanoreceptors have beenidentified [29, 51], there is only indirect evidence for the existence of photoreceptors [63].Proprioceptive sensors monitor (1) the nutritional state, and (2) the adapted light condition(background illumination).
5.1.3 Behavior repertoireThe distinct movement patterns of Hydra, resulting from alterning activity of its motorcells, consist of (1) contraction and expansion of body and tentacles, (2) digestion, and(3) locomotion [63]. Locomotion is accomplished either by gliding (by means of ciliaon the foot), or by somersaulting. It should be noted that most of the behavior in Hydra,characteristic for lower animals, is not specific but general. Thus, the animal reacts in away that is usually beneficial, rather than to the specific situation [28].
Given the theory of animal behavior and behavior-based modeling presented in Chap-ters 3 and 4, the overall behavior of Hydra will now be described as the coordination ofdistinct behaviors.
Spontaneous actions
Without changes in Hydra’s external environment, it shows spontaneous, periodic con-tractions or locomotion. There is an adaption to background illumination in the sense thatthe contraction frequency varies with the ambient light conditions. The frequency alsodepends on the nutritional state of the animal: contraction frequency decreases with star-vation, while locomotion is more common in starved Hydra. After one week of starvation,practically any overt behavior ceases, and the animal eventually perishes [46].
Response to mechanical stimulus
Response to mechanical stimulus, such as shaking or physical contact, occurs by means ofcontraction or locomotion. The way in which Hydra responds depends on stimulus historyas well as on nutritional state of animal: starved animals are more likely to respond bylocomotion, whereas a contraction response is more common in well fed animals. Theresponse shows habituation to repeated stimulus [53].
18 Chapter 5. Hydra
Response to light stimulus
On exposure to strong light there is an immediate inhibition of any ongoing contraction.Following a latency, a response consisting of either contraction or locomotion is evoked.As in the case of mechanical stimulus, locomotion is more common in starved animals.The latency is inversely related to light intensity [59]. There is no habituation [53].
Feeding
The feeding behavior of Hydra consists of a sequence of actions, namely prey capture,mouth opening, ingestion, digestion, and regurgitation4. The behavior is evoked by me-chanical stimulation of Hydra’s tentacles or by the presence of GSH, which is released byprey stung by nematocysts. The behavioral threshold is regulated by Hydra’s nutritionalstate, with starved animals exhibiting a lower threshold than recently fed ones. Also, thereis a refractory period following a feeding response, with the capacity of responding beinggradually regained [32, 33].
5.1.4 Behavior coordinationAs described in the literature, feeding inhibits responses to light and mechanical stim-uli. In addition, response to light inhibits response to mechanical stimuli, thus forming apriority-based relation of Hydra’s behaviors [32, 54].
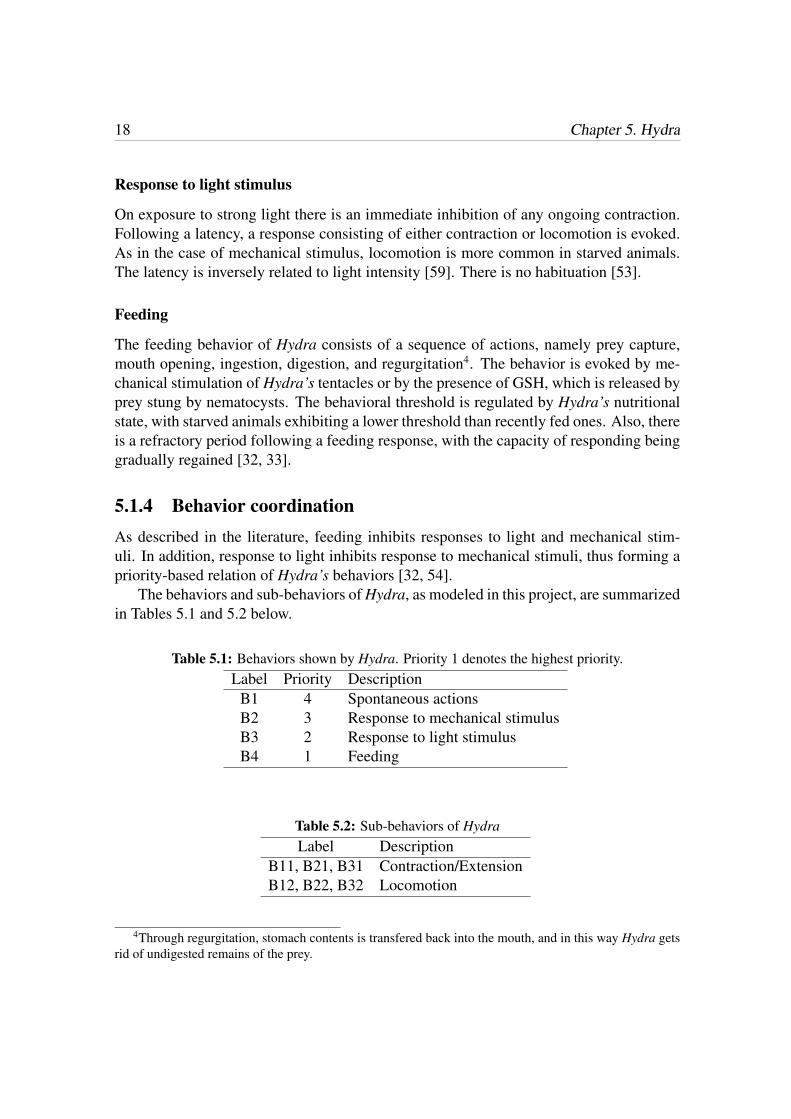
The behaviors and sub-behaviors of Hydra, as modeled in this project, are summarizedin Tables 5.1 and 5.2 below.
Table 5.1: Behaviors shown by Hydra. Priority 1 denotes the highest priority.Label Priority Description
B1 4 Spontaneous actionsB2 3 Response to mechanical stimulusB3 2 Response to light stimulusB4 1 Feeding
Table 5.2: Sub-behaviors of HydraLabel Description
B11, B21, B31 Contraction/ExtensionB12, B22, B32 Locomotion
4Through regurgitation, stomach contents is transfered back into the mouth, and in this way Hydra getsrid of undigested remains of the prey.
Chapter 6Models and methods
In this thesis the overall behavior of Hydra is modeled by defining individual behaviors,as well as a behavioral organizer for coordination of those behaviors. The model of Hydraaimes at describing the behavior of the animal as functions of its motivational state. Forthe initial purpose of validating the behavioral model, a simulated system was developed.Also, once a behavioral model has been validated, such a system can be used to predictthe behavior of the animal in various environmental set-ups. In this project, however,the simulated system was only used for validation experiments, as discussed in Section7.2. This chapter starts with a description of the simulated system, and concludes bypresenting the methods used for generating and organizing the behaviors of Hydra.
6.1 The simulated system
Hydra was modeled ignoring the dynamical properties of its body. It should be notedthat, as pointed out e.g. in [10, 12], the body of an animal is indeed connected to itsbehavior. Thus, this simplification was made not because the properties of Hydra’s bodyare unimportant for its behavior, but rather in an attempt to isolate, as much as possible,and focus on the behavioral traits in this first work towards a behavioral model of theanimal. Also, the time aspect of this project was a factor in making this simplification.As will be discussed in Chapter 8, an expansion of the model to include a more realisticmorphology of Hydra might very well be a task for future work.
In this simplified model of Hydra, the animal’s body is represented in 2D, by a circlewith radius r and maximum extension length lmax. The movement of the animal is con-trolled simply by setting the corresponding states directly, which is described in Section6.1.1. The physical state variables describing the body of the simulated Hydra is given inTable 6.1. In the 2D model of Hydra, the position of the animal’s hypostome, rather thanof its foot, was taken as the interface to (the simulated) environment. While this approach
19
20 Chapter 6. Models and methods
might seem far-fetched at first, the reason for it is twofold: (1) This allows for simulationof the change in position of the body and tentacles caused by contraction and expansion,while the animal remains attached by its foot. (2) It has been argued that the hypostomeand the tentacles are the most sensitive regions of Hydra [28, 66].
Table 6.1: Physical state variables for the simulated Hydra in a 2D environment. For the extensionrate, rext, 0 denotes maximal contraction, and 1 maximal extension. S denotes the size of thearena.
Variable Range Descriptionxf [0, S] Position of footyf [0, S] Position of footθext [0, 2π] Direction of body extensionθloc [0, 2π] Direction of animal locomotionrext [0, 1] Extension rate
The interface area between Hydra and its environment, in the simulated system, is takenas a circle with radius, r, and center in
x = xf + rext · lmax · cos(θext),
y = yf + rext · lmax · sin(θext). (6.1)
Settings of the model parameters are specified in Section 6.1.6.
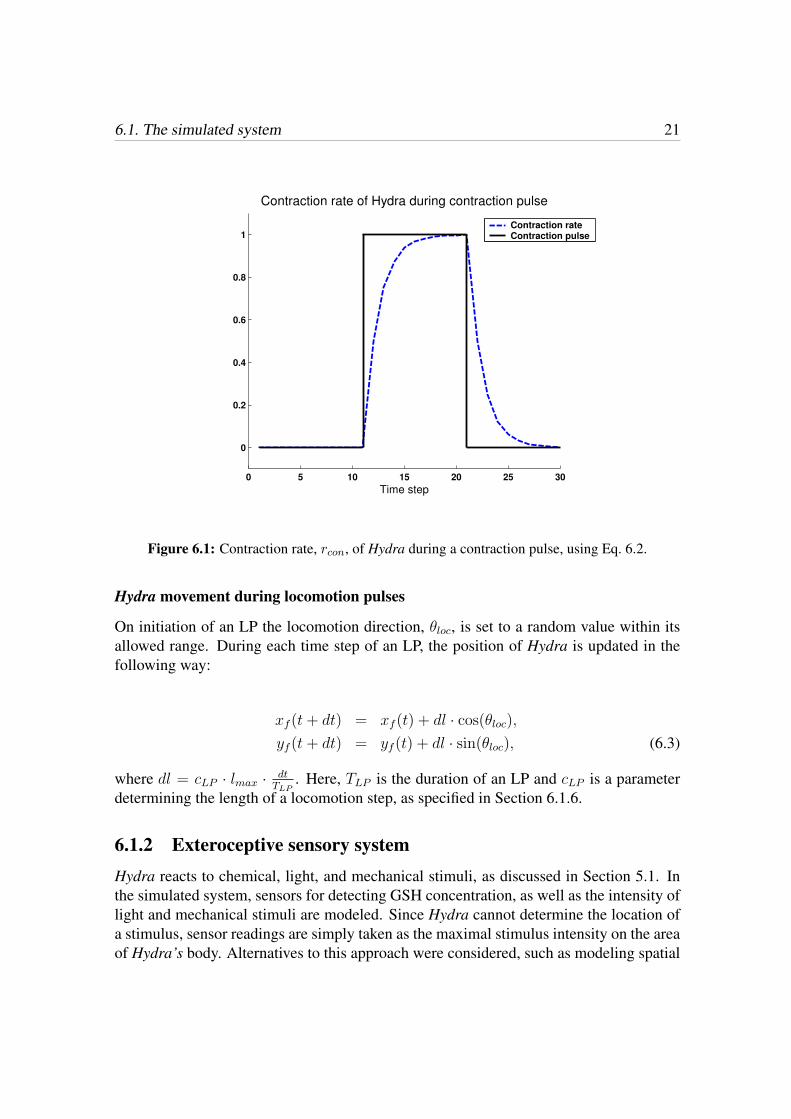
6.1.1 Movement patternsAs described in Section 5.1.3, behaviors B1-B3 all generate movement of Hydra by (1)contraction, and expansion of its body, or (2) locomotion. These movements are evokedby bioelectric contraction bursts and locomotion bursts, respectively, in pacemakers of theanimal, as described e.g. in [46] and in [64]. While, as discussed in Chapter 3, no attemptis made in this project to model Hydra on a neural level, the concept of contraction pulses(CPs) and locomotion pulses (LPs) is adopted. Thus, the behavioral output will, at times,consist of a CP or an LP. The effect of these behavioral outputs on the state variables ofthe simulated Hydra is described below.
Hydra movement during contraction pulses
A contraction pulse has an effect on the simulated Hydra according to
rcon(t+ dt) = arcon(t) + bcp(t), (6.2)
where rext = 1 − rcon, and cp(t) is the CP signal (1 during a CP, 0 otherwise) at time t.An example is shown in Fig. 6.1. At the end of a CP, the extension heading, θext, of theanimal is set to a new, random value within its allowed range.
6.1. The simulated system 21
0 5 10 15 20 25 30
0
0.2
0.4
0.6
0.8
1
Time step
Contraction rate of Hydra during contraction pulse
Contraction rateContraction pulse
Figure 6.1: Contraction rate, rcon, of Hydra during a contraction pulse, using Eq. 6.2.
Hydra movement during locomotion pulses
On initiation of an LP the locomotion direction, θloc, is set to a random value within itsallowed range. During each time step of an LP, the position of Hydra is updated in thefollowing way:
xf (t+ dt) = xf (t) + dl · cos(θloc),
yf (t+ dt) = yf (t) + dl · sin(θloc), (6.3)
where dl = cLP · lmax · dtTLP
. Here, TLP is the duration of an LP and cLP is a parameterdetermining the length of a locomotion step, as specified in Section 6.1.6.
6.1.2 Exteroceptive sensory systemHydra reacts to chemical, light, and mechanical stimuli, as discussed in Section 5.1. Inthe simulated system, sensors for detecting GSH concentration, as well as the intensity oflight and mechanical stimuli are modeled. Since Hydra cannot determine the location ofa stimulus, sensor readings are simply taken as the maximal stimulus intensity on the areaof Hydra’s body. Alternatives to this approach were considered, such as modeling spatial
22 Chapter 6. Models and methods
summation, as described in Section 3.2.1. Albeit a common reflex property, indicationof spatial summation in Hydra was not found in the literature, and thus it did not seemmotivated to use such an approach.
6.1.3 Proprioceptive sensory systemAs mentioned in Chapter 5, the proprioceptive sensory system of Hydra monitors the nu-tritional state as well as the adapted light condition of the animal. Clearly, these propertiesshould ideally be implemented also in a model of the animal. One problem with trying tomodel the adapted light condition of Hydra is that, as pointed out in Section 5.1.2, thereis only indirect evidence of photoreceptors in Hydra. Also, the data found in the liter-ature concerning the influence of adapted light condition on behavior does not containinformation on background illumination conditions [46]. Due to the two factors just men-tioned, the adapted light condition was left out in this project, and thus only the nutritionalstate of Hydra was modeled in the proprioceptive sensory system. During simulations thenutritional state, Mh, is updated according to
Mh(t+ dt) = max
(0,Mh(t)− dthmax
fmax
)(6.4)
during feeding, and
Mh(t+ dt) = min (hmax,Mh(t) + dt) (6.5)
if another behavior is active. The upper limit imposed on Mh, hmax, corresponds tomaximum allowed starvation time, and fmax corresponds to the maximum duration offeeding (see Section 5.1.3). Thus, the decrease in Mh during feeding is hmax
fmaxunits per
second. See Table 6.3 in Section 6.1.6 for parameter values.
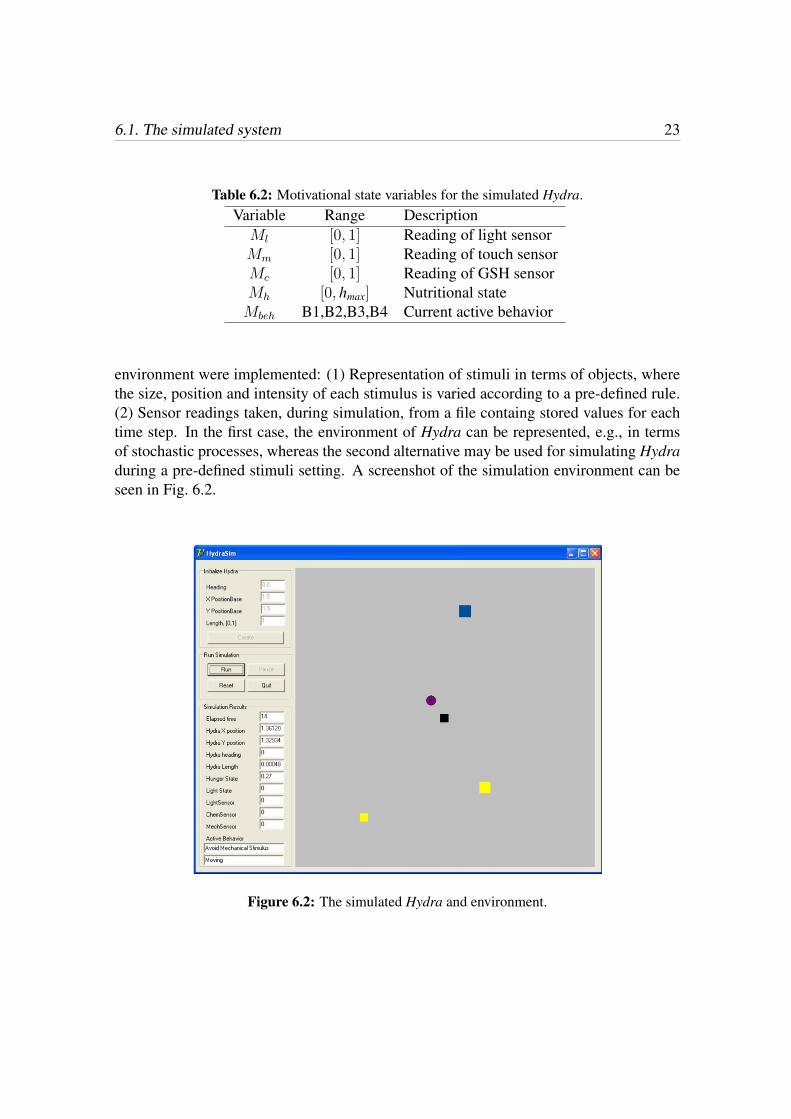
6.1.4 Motivational stateAs described in Section 3.1, it is the motivational state of an animal that give rise tobehavior. Consistently with this theory, the motivational state variables of the simulatedHydra, are taken as the union of the animal’s exteroceptive sensory system, as describedin Section 6.1.2, its proprioceptive sensory system, as described in Section 6.1.3, and itscurrent active behavior. The motivational state variables are summarized in Table 6.2below.
6.1.5 EnvironmentSimulations of the modeled Hydra were carried out in a 2D-environment. A square-shaped arena with side-length S and periodic boundary conditions were used. Two al-ternatives for the representation of light, mechanical, and chemical stimuli in Hydra’s
6.1. The simulated system 23
Table 6.2: Motivational state variables for the simulated Hydra.Variable Range DescriptionMl [0, 1] Reading of light sensorMm [0, 1] Reading of touch sensorMc [0, 1] Reading of GSH sensorMh [0, hmax] Nutritional stateMbeh B1,B2,B3,B4 Current active behavior
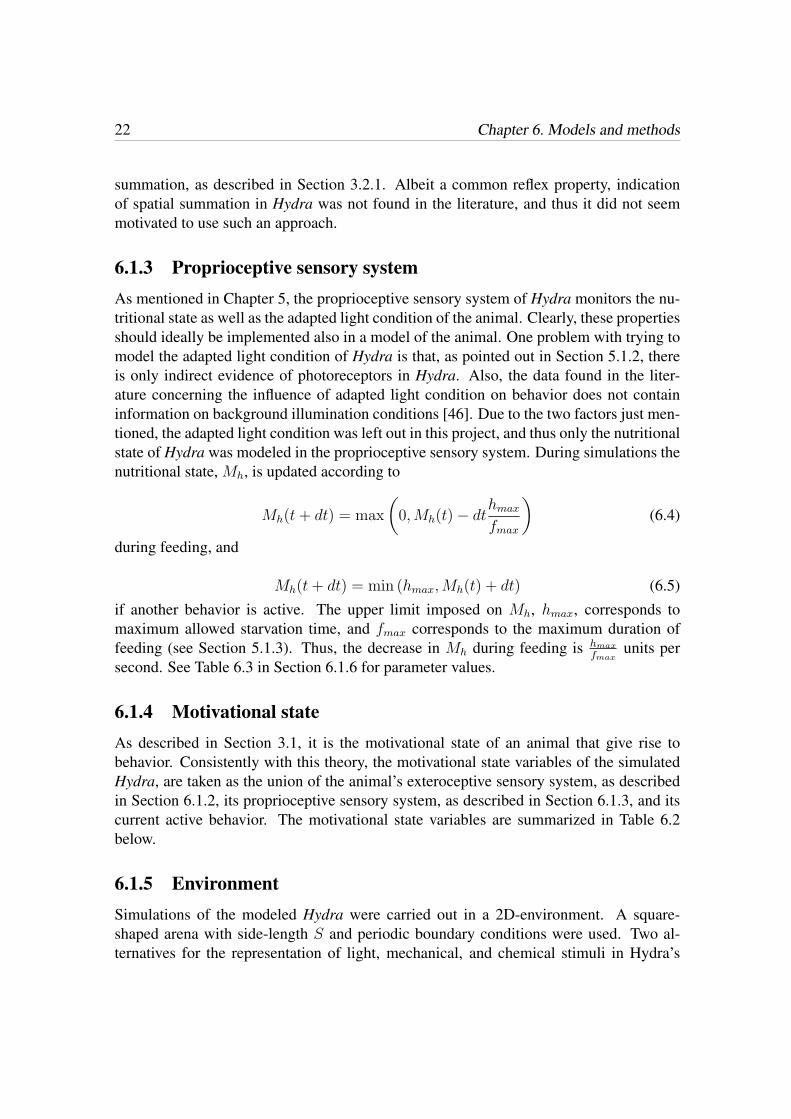
environment were implemented: (1) Representation of stimuli in terms of objects, wherethe size, position and intensity of each stimulus is varied according to a pre-defined rule.(2) Sensor readings taken, during simulation, from a file containg stored values for eachtime step. In the first case, the environment of Hydra can be represented, e.g., in termsof stochastic processes, whereas the second alternative may be used for simulating Hydraduring a pre-defined stimuli setting. A screenshot of the simulation environment can beseen in Fig. 6.2.
Figure 6.2: The simulated Hydra and environment.
24 Chapter 6. Models and methods
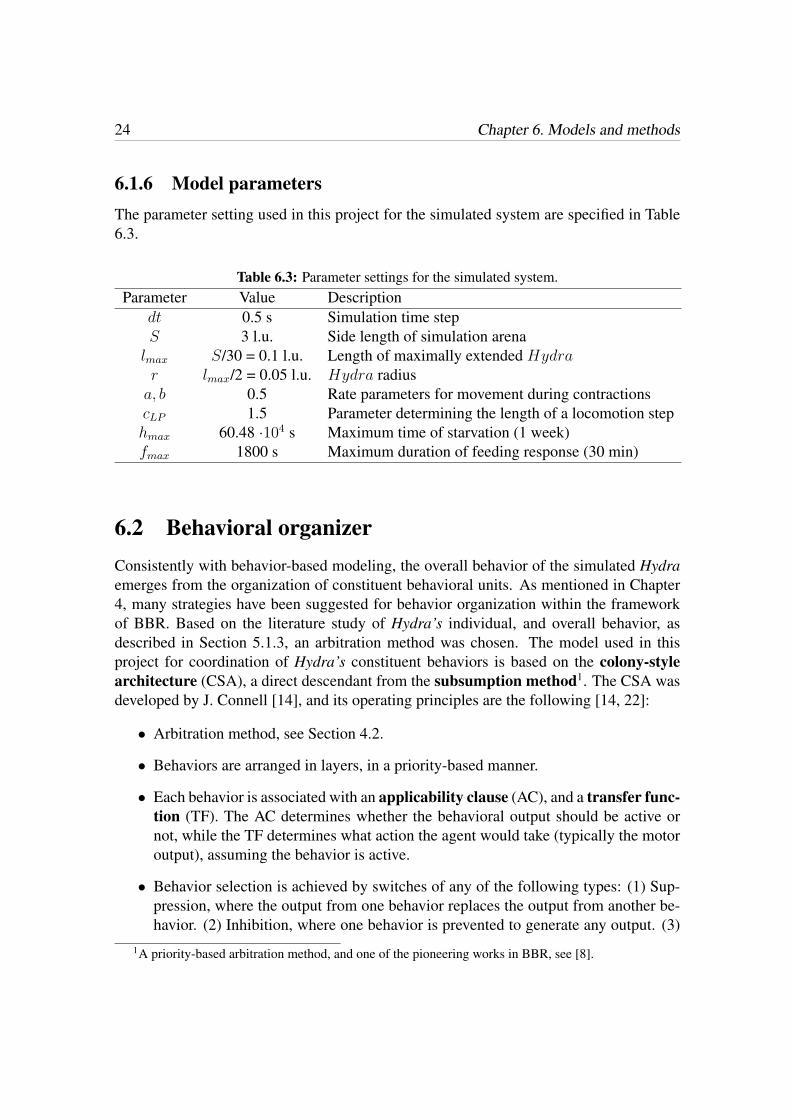
6.1.6 Model parametersThe parameter setting used in this project for the simulated system are specified in Table6.3.
Table 6.3: Parameter settings for the simulated system.Parameter Value Description
dt 0.5 s Simulation time stepS 3 l.u. Side length of simulation arenalmax S/30 = 0.1 l.u. Length of maximally extended Hydrar lmax/2 = 0.05 l.u. Hydra radiusa, b 0.5 Rate parameters for movement during contractionscLP 1.5 Parameter determining the length of a locomotion stephmax 60.48 ·104 s Maximum time of starvation (1 week)fmax 1800 s Maximum duration of feeding response (30 min)
6.2 Behavioral organizerConsistently with behavior-based modeling, the overall behavior of the simulated Hydraemerges from the organization of constituent behavioral units. As mentioned in Chapter4, many strategies have been suggested for behavior organization within the frameworkof BBR. Based on the literature study of Hydra’s individual, and overall behavior, asdescribed in Section 5.1.3, an arbitration method was chosen. The model used in thisproject for coordination of Hydra’s constituent behaviors is based on the colony-stylearchitecture (CSA), a direct descendant from the subsumption method1. The CSA wasdeveloped by J. Connell [14], and its operating principles are the following [14, 22]:
• Arbitration method, see Section 4.2.
• Behaviors are arranged in layers, in a priority-based manner.
• Each behavior is associated with an applicability clause (AC), and a transfer func-tion (TF). The AC determines whether the behavioral output should be active ornot, while the TF determines what action the agent would take (typically the motoroutput), assuming the behavior is active.
• Behavior selection is achieved by switches of any of the following types: (1) Sup-pression, where the output from one behavior replaces the output from another be-havior. (2) Inhibition, where one behavior is prevented to generate any output. (3)
1A priority-based arbitration method, and one of the pioneering works in BBR, see [8].
6.3. Constituent behaviors 25
Release type, where a higher-priority behavior enables the output of a lower-prioritybehavior to pass through the switch.
6.2.1 Applicability clauseThe AC defines, for each behavior, whether the output from the behavioral unit shouldbe active or not. An AC can be situation-driven, i.e. related to a goal state, where thepresent state (resulting from the agent’s action) causes the AC to be either true or false. Asan example, consider a robot that turns only when an obstacle appears in front of the robot(and only until the object is no longer in front of it). The AC can also be event-driven. Anevent is characterized by a very brief (point-like) occurrence, whereas situations typicallyare extended intervals of time [14]. An event-driven AC is of a set/reset type, where acertain event triggers the AC, and some other criteria resets it.
6.2.2 Transfer functionThe TF determines the actual action (output) of the behavioral module, given the currentmotivational state. The output from the TF is only passed out from the behavioral modulewhen the AC is true.
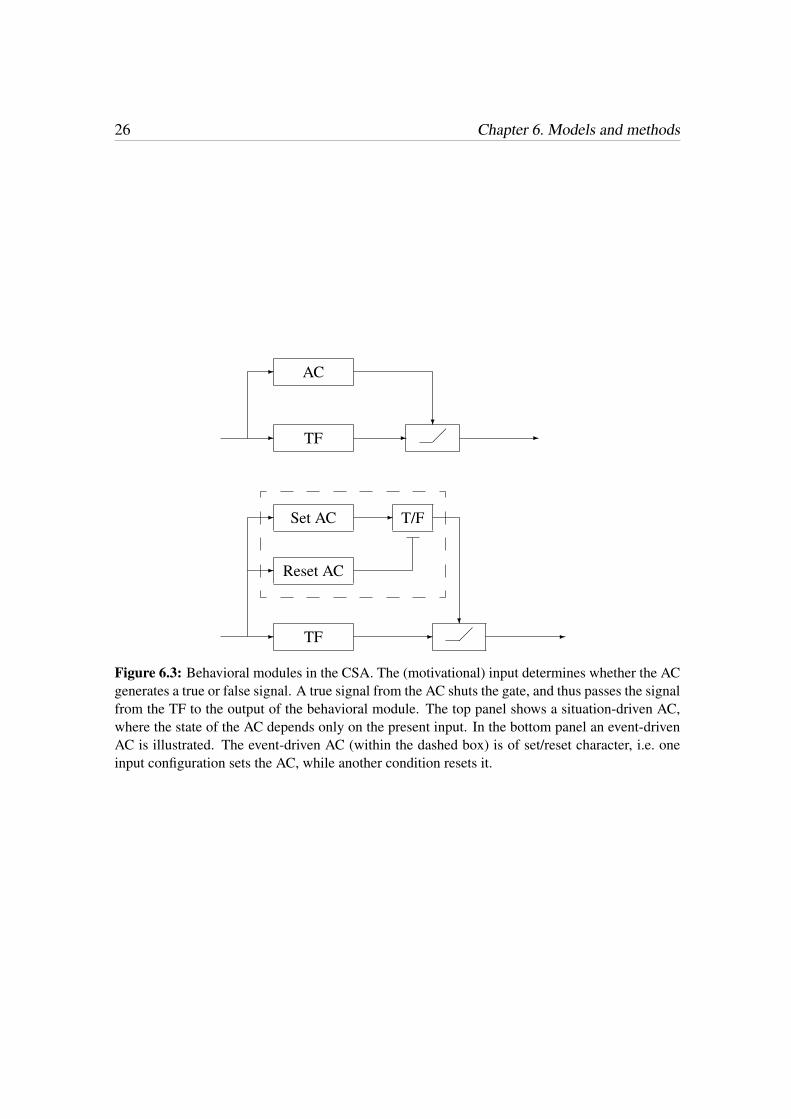
6.3 Constituent behaviorsUsing the CSA, modeling each of the constituent behaviors consists of two steps, namely(1) defining an AC, and (2) defining a TF. The architectures of a behavioral module isillustrated in Fig. 6.3.
As described in Section 4.1, there are several different methods by which behaviors canbe generated. In the case of Hydra, the constituent behaviors are relatively simple, andthus implementation by means of hand-coding was used in most cases. As a complementto hand-coding, biologically inspired methods such as RNNs and EAs were also used.A brief description of these methods is given in Appendices A and B, whereas specificimplementation details for the resulting behavioral model of the simulated Hydra arestated in Chapter 7.
26 Chapter 6. Models and methods
- AC
?- TF - -�
-
-
Reset AC
Set AC - T/F
?- TF - -�
Figure 6.3: Behavioral modules in the CSA. The (motivational) input determines whether the ACgenerates a true or false signal. A true signal from the AC shuts the gate, and thus passes the signalfrom the TF to the output of the behavioral module. The top panel shows a situation-driven AC,where the state of the AC depends only on the present input. In the bottom panel an event-drivenAC is illustrated. The event-driven AC (within the dashed box) is of set/reset character, i.e. oneinput configuration sets the AC, while another condition resets it.
Chapter 7Results and discussion
In this chapter the resulting behavioral model of Hydra is presented. The process of mod-eling the overall behavior of Hydra was carried out in two steps: (1) Generation of theconstituent behaviors involved in Hydra’s overall behavior. Using the CSA, this amountsto defining an appropriate AC as well as a TF for each behavior. (2) Generation of thebehavioral organizer, i.e. organizing the constituent behaviors into layers, and definingthe interacting connections. The two steps were carried out independently of each other.This chapter starts with a presentation of the results concerning each of the constituentbehaviors, and concludes with a description of the overall behavior of the simulated Hy-dra.
7.1 Generation of behaviors
The four constituent behaviors of Hydra, as described in Section 5.1.3, were generated in-dependently of each other. However, as mentioned in Section 6.1.1, the behavioral outputof B1-B3 share some characteristics, namely how Hydra should allocate its time betweencontracted and extended states, as well as in locomotion, depending on the animal’s moti-vational state. Thus, the transfer functions of B1-B3 share the task of evoking a CP or anLP, whichever is applicable, at the appropriate point in time, assuming that the particularbehavior is the active one.
It should be noted that each behavior is a self-contained unit, operating only at a locallevel. Hence, a behavioral unit is not supplied with any information concerning the otherbehaviors included in the implemented behavior repertoire. It is therefore worth stressingthat, while the applicability clause of each behavior determines whether the output fromits transfer function should be active or not, the selection of which behavioral output thatis finally passed on to the actuators is carried out by the behavioral organizer. The resultsfrom the generation of the ACs as well as the TFs for each of the constituent behaviors in
27
28 Chapter 7. Results and discussion
the behavior repertoire of Hydra will now be described.
7.1.1 B1: Spontaneous actionsHydra’s spontaneous actions, as described in Section 5.1.3, depend only on its proprio-ceptive state, and not on any external stimulus.
Applicability clause
By default, spontaneous actions is an applicable behavior (since it does not require anytriggering situation, event, or state to evoke activity). Thus, the AC for this behavior, B1,is always true.
Transfer functions
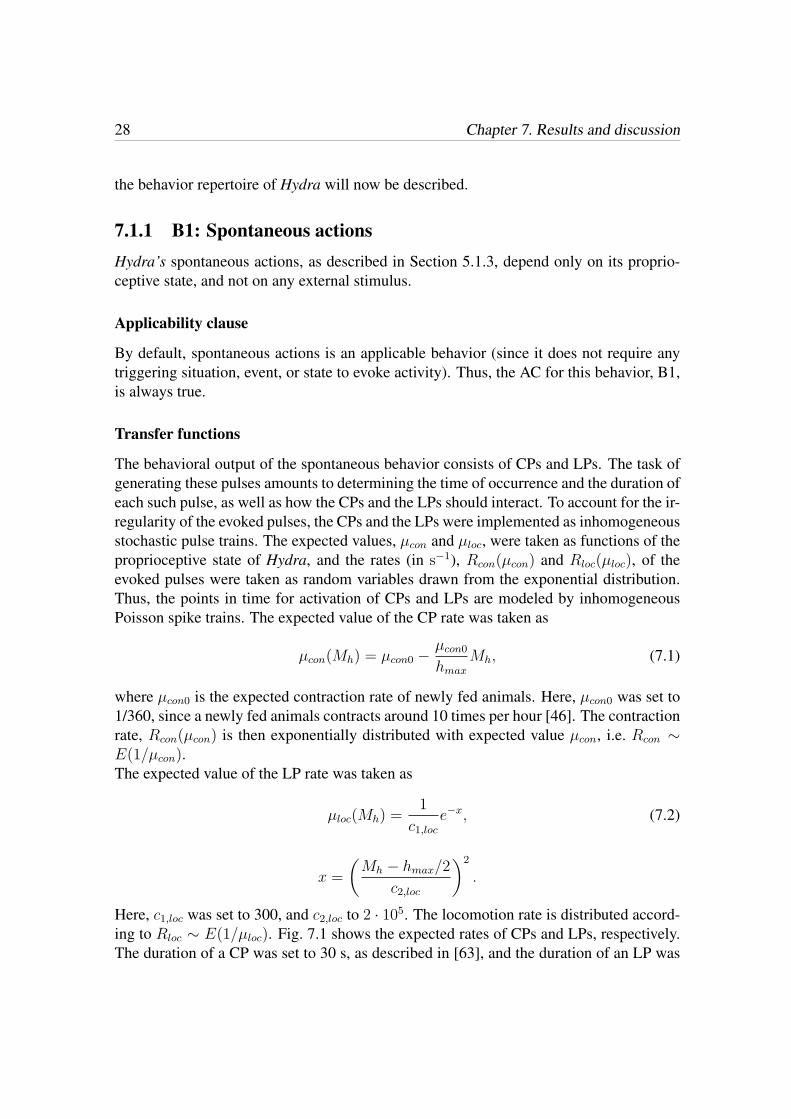
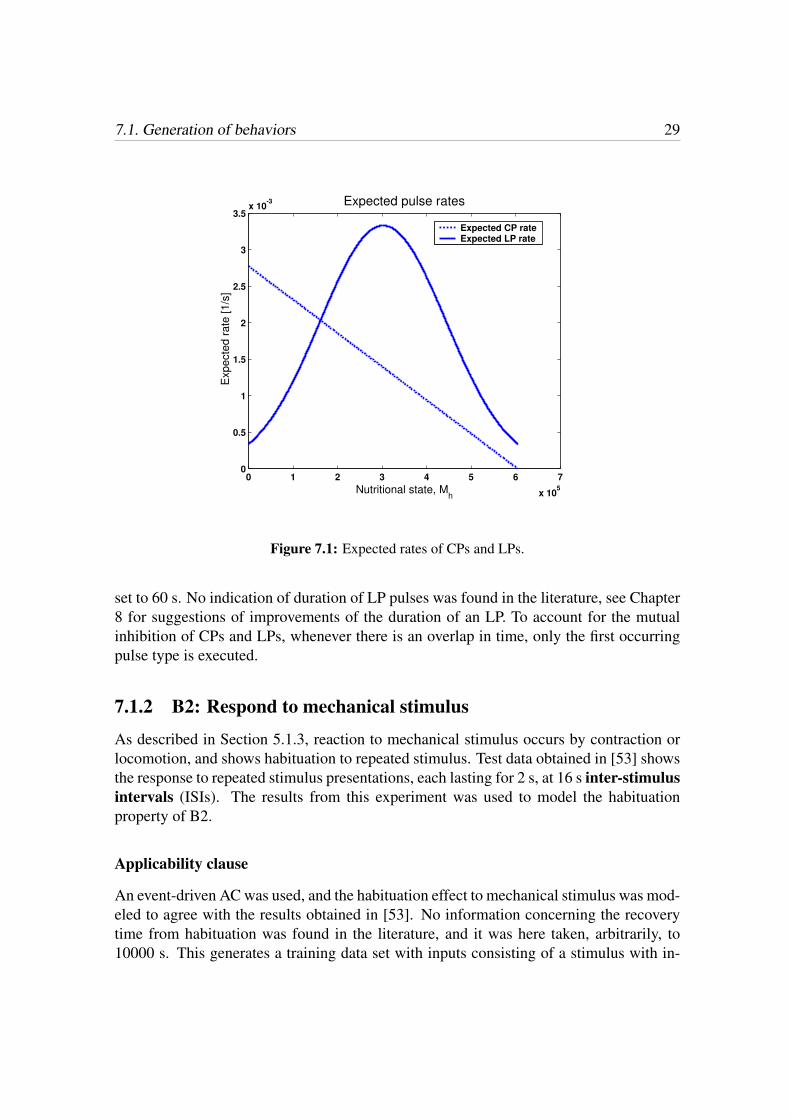
The behavioral output of the spontaneous behavior consists of CPs and LPs. The task ofgenerating these pulses amounts to determining the time of occurrence and the duration ofeach such pulse, as well as how the CPs and the LPs should interact. To account for the ir-regularity of the evoked pulses, the CPs and the LPs were implemented as inhomogeneousstochastic pulse trains. The expected values, µcon and µloc, were taken as functions of theproprioceptive state of Hydra, and the rates (in s−1), Rcon(µcon) and Rloc(µloc), of theevoked pulses were taken as random variables drawn from the exponential distribution.Thus, the points in time for activation of CPs and LPs are modeled by inhomogeneousPoisson spike trains. The expected value of the CP rate was taken as
µcon(Mh) = µcon0 −µcon0
hmax
Mh, (7.1)
where µcon0 is the expected contraction rate of newly fed animals. Here, µcon0 was set to1/360, since a newly fed animals contracts around 10 times per hour [46]. The contractionrate, Rcon(µcon) is then exponentially distributed with expected value µcon, i.e. Rcon ∼E(1/µcon).The expected value of the LP rate was taken as
µloc(Mh) =1
c1,loc
e−x, (7.2)
x =
(Mh − hmax/2
c2,loc
)2
.
Here, c1,loc was set to 300, and c2,loc to 2 · 105. The locomotion rate is distributed accord-ing to Rloc ∼ E(1/µloc). Fig. 7.1 shows the expected rates of CPs and LPs, respectively.The duration of a CP was set to 30 s, as described in [63], and the duration of an LP was
7.1. Generation of behaviors 29
0 1 2 3 4 5 6 7
x 105
0
0.5
1
1.5
2
2.5
3
3.5x 10
-3
Nutritional state, Mh
Expecte
d r
ate
[1/s
]
Expected pulse rates
Expected CP rateExpected LP rate
Figure 7.1: Expected rates of CPs and LPs.
set to 60 s. No indication of duration of LP pulses was found in the literature, see Chapter8 for suggestions of improvements of the duration of an LP. To account for the mutualinhibition of CPs and LPs, whenever there is an overlap in time, only the first occurringpulse type is executed.
7.1.2 B2: Respond to mechanical stimulus
As described in Section 5.1.3, reaction to mechanical stimulus occurs by contraction orlocomotion, and shows habituation to repeated stimulus. Test data obtained in [53] showsthe response to repeated stimulus presentations, each lasting for 2 s, at 16 s inter-stimulusintervals (ISIs). The results from this experiment was used to model the habituationproperty of B2.
Applicability clause
An event-driven AC was used, and the habituation effect to mechanical stimulus was mod-eled to agree with the results obtained in [53]. No information concerning the recoverytime from habituation was found in the literature, and it was here taken, arbitrarily, to10000 s. This generates a training data set with inputs consisting of a stimulus with in-
30 Chapter 7. Results and discussion
tensity Mc = 1 and 2 s duration, presented every 16 s for 3 hours, followed by an absenceof the stimulus for 10000 s, and then repeated presentation every 16 s for 4300 s. Theoutputs of the training data set were reconstructed from [53], and can be seen (later on) inFigs. 7.3 and 7.5.
For this model, two different approaches were used: (1) an RNN, and (2) a habituationmodel based on leaky integrators. Both models were optimized, parametrically and struc-turally, by means of an EA. The fitness measure was, in both cases, taken as f = 1/e,where e is the root mean squared error (RMSE) over the data set during periods ofstimulus presentation1:
e =1
N
√√√√ N∑i=1
(o(i)− y(i))2, (7.3)
where o(i) represents the i:th measured response, and y(i) the corresponding responsefrom the model. On the occurrence of a stimulus the output from the habituation unit, theresponse strength, s, is related to the probability of a stimulus evoking a response [53].To ensure a valid range of the response probability, pB2, regardless of habituation model,the following conversion was carried out:
pB2 =
s, 0 ≤ s ≤ 1,0, s < 0,1, s > 1.
(7.4)
Activation of the AC occurs if Mc > 0 and pB2 > X , where X is a random variabledrawn from the uniform distribution, X ∼ U(0, 1). In general, the latency depends onstimulus strength, as described in Section 3.2.1. However, no such information was foundin the literature for Hydra’s response to mechanical stimulus, therefore it was set to beconstant. Reset of the AC occurs at completion of the response, which may be a CP or anLP, as described below. The results from each test case of evolving a habituation unit willnow be described.
Test A: Evolving an RNN to represent habituationAs a first experiment it was tested whether an RNN, parametrically and structurally op-timized by means of an EA to fit experimental data obtained in [53], could represent thehabituation to mechanical stimulus. A continuous time RNN was used. After applyingEuler’s method for numerical integration of the network equations, the dynamics of neu-ron i in the network is governed by the following equation (see also Appendix B):
yi(t+ ∆t) = yi(t) +∆t
τi
[−yi(t) + σ
(bi +
n∑j=1
wijyj(t) +m∑
j=1
wIijIj(t)
)], (7.5)
1Note that no contribution to the RMSE occurs during the recovery period.
7.1. Generation of behaviors 31
where b is the bias term, τ the time constant, I the input signal(s), and w and wI are thesynaptic weights from other neurons and input signals, respectively. The integration timestep, ∆t, was set to 0.2 s. The simulation time step (time between two consecutive inputsignals) is 2 s, which gives 10 integration steps between data points used in the calculationof Eq. 7.3. A background to the RNNs used here is given in Appendix B. The RNN wasevolved using an EA with the following properties (see Appendix A for an explanation ofthe terms): explicit encoding, elitism, no crossover, tournament selection, and structuralas well as parametrical mutations. After an investigation of various mutation operators,six different operators were used, as described below. The EA properties are summarizedin Table 7.1.
m1 - Creep mutation: The value of the gene is updated according townew = wold(1 − 2rc + c), where r ∼ U [0, 1] and c is the creep rate. Since thismutation may generate values outside the allowed range, the gene was scaled intoits proper interval using w → wmax if w > wmax, and w → wmin if w < wmin.
m2 - Full-range mutation: The gene is given a new, random value within the allowedparameter interval.
m3 - Add connection mutation: A connection between two units (either between twoneurons, or between an input signal and a neuron) with a randomly chosen synapticweight (within the allowed range), is added.
m4 - Remove connection mutation: Removal of a connection between two units.
m5 - Add neuron mutation: One neuron is added to the RNN (at a randomly chosenlocation). To avoid a macromutation, i.e. a mutation that alters the performance ofthe resulting individual in a significant way, the neuron is added with all weightsset to zero (and with randomly selected bias and time constant). Thus, only thepossibility of new connections is established as a result of this mutation operator.
m6 - Remove neuron mutation: Removal of one randomly chosen neuron and all its in-coming and outgoing connections.
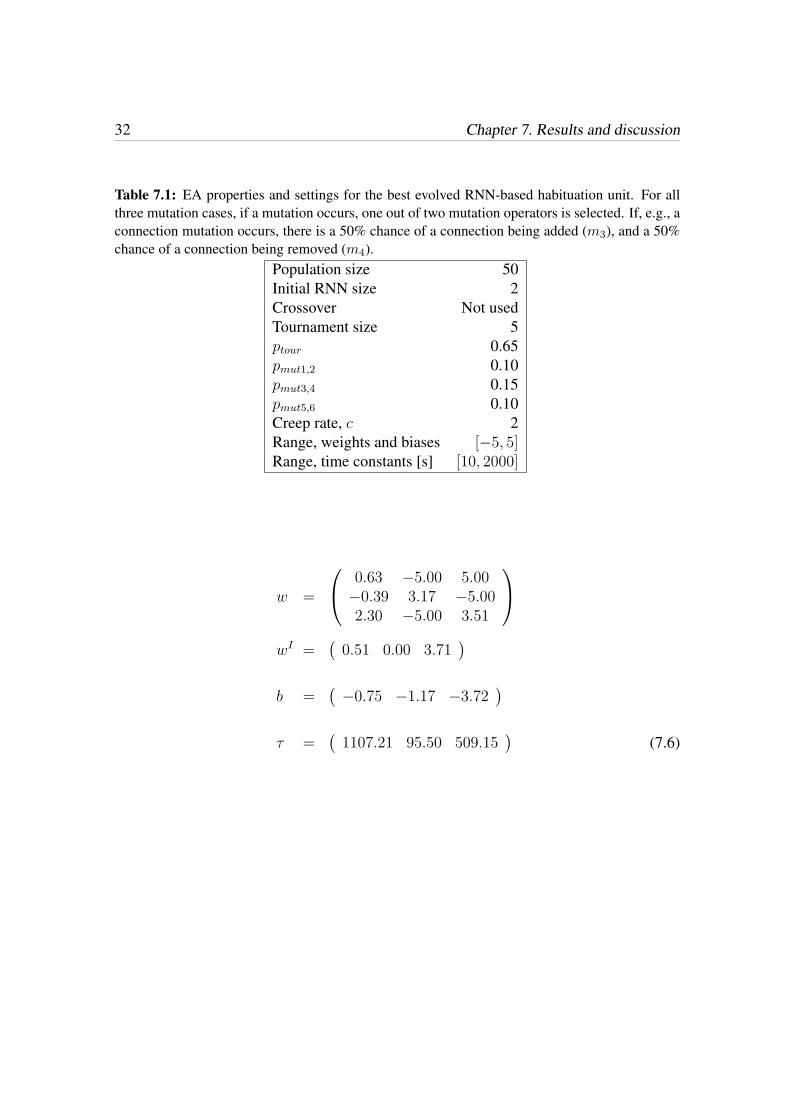
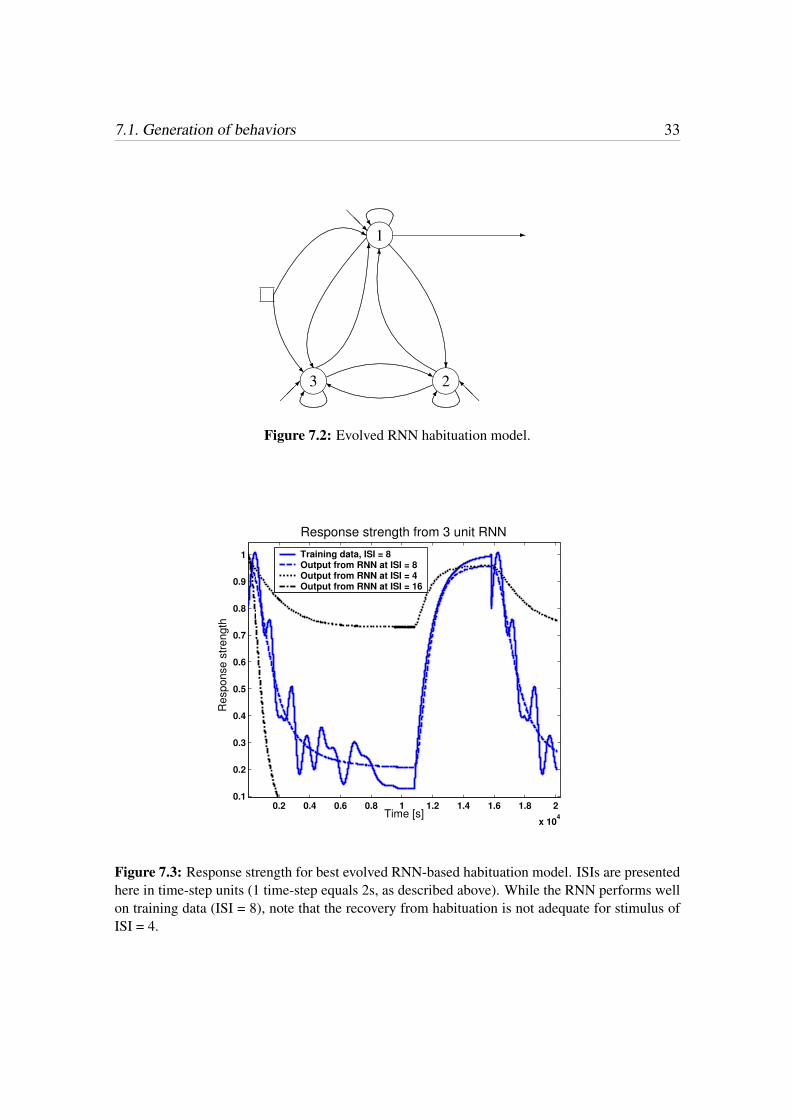
In Fig. 7.2, the structure of the best evolved RNN is shown. The network consists of threeneurons and, as can be seen from the network parameters in Eq. 7.6, all connections butone input signal connection were established. The evolved RNN performs adequately onthe test data, as can be seen in Fig. 7.3. However, its generalization ability to other ISIsand stimulus intensities is poor, an example of which is also shown in Fig. 7.3. In general,it should be possible to improve this ability by including such stimulus properties in thetraining data set. However, no such data was found in the literature, and it was decided touse another approach rather than creating a new, somewhat arbitrary data set. As a result,a solution based on a model of habituation was investigated, which will be described next.
32 Chapter 7. Results and discussion
Table 7.1: EA properties and settings for the best evolved RNN-based habituation unit. For allthree mutation cases, if a mutation occurs, one out of two mutation operators is selected. If, e.g., aconnection mutation occurs, there is a 50% chance of a connection being added (m3), and a 50%chance of a connection being removed (m4).
Population size 50Initial RNN size 2Crossover Not usedTournament size 5ptour 0.65pmut1,2 0.10pmut3,4 0.15pmut5,6 0.10Creep rate, c 2Range, weights and biases [−5, 5]Range, time constants [s] [10, 2000]
w =
0.63 −5.00 5.00−0.39 3.17 −5.002.30 −5.00 3.51
wI =
(0.51 0.00 3.71
)b =
(−0.75 −1.17 −3.72
)τ =
(1107.21 95.50 509.15
)(7.6)
7.1. Generation of behaviors 33
����3 ����2
����1.
.....................................
..................................
..............................
..........................
.......................
...........................................
................... .................. .................. ........................................s
.
.........
.........
.....
........................
........................
........................
......................
...
......................
...
......................
...
........................
..R
-.
........................
..................
........................
...............
.....................................
..................................
................................
.............................
...........................
........................
..........
..........
.
..........
..........
....................
...................
.
..........
..........
..........
..........
.....................................
...................................
.................................
..............................
............................
..........................
.......................
.....................
...................
....................
....................U
6.
.................................
..........
..........
..........
..........
..........
.........
............................
...........................
......................
.....
......................
....
........................
.
.........................
..........................
............................
..............................
.
........................
............
........................
...........
........................
..........
......................
...........
......................
..........
......................
..........
...............................
..............................
.............................
..........
..........
.........
6
?
............ ................................................................................................
.........................�
............ ................................................................................................
.........................�
................................
.......................................................................................... ...........
��� @@I
@@R
...................................
................................................................. .............................. .............................. ............................... ................................
.................................
........................
.........................................
................................ .............................. .............................. ................................
...................................................................
sk
Figure 7.2: Evolved RNN habituation model.
0.2 0.4 0.6 0.8 1 1.2 1.4 1.6 1.8 2
x 104
0.1
0.2
0.3
0.4
0.5
0.6
0.7
0.8
0.9
1
Response strength from 3 unit RNN
Response s
trength
Time [s]
Training data, ISI = 8Output from RNN at ISI = 8Output from RNN at ISI = 4Output from RNN at ISI = 16
Figure 7.3: Response strength for best evolved RNN-based habituation model. ISIs are presentedhere in time-step units (1 time-step equals 2s, as described above). While the RNN performs wellon training data (ISI = 8), note that the recovery from habituation is not adequate for stimulus ofISI = 4.
34 Chapter 7. Results and discussion
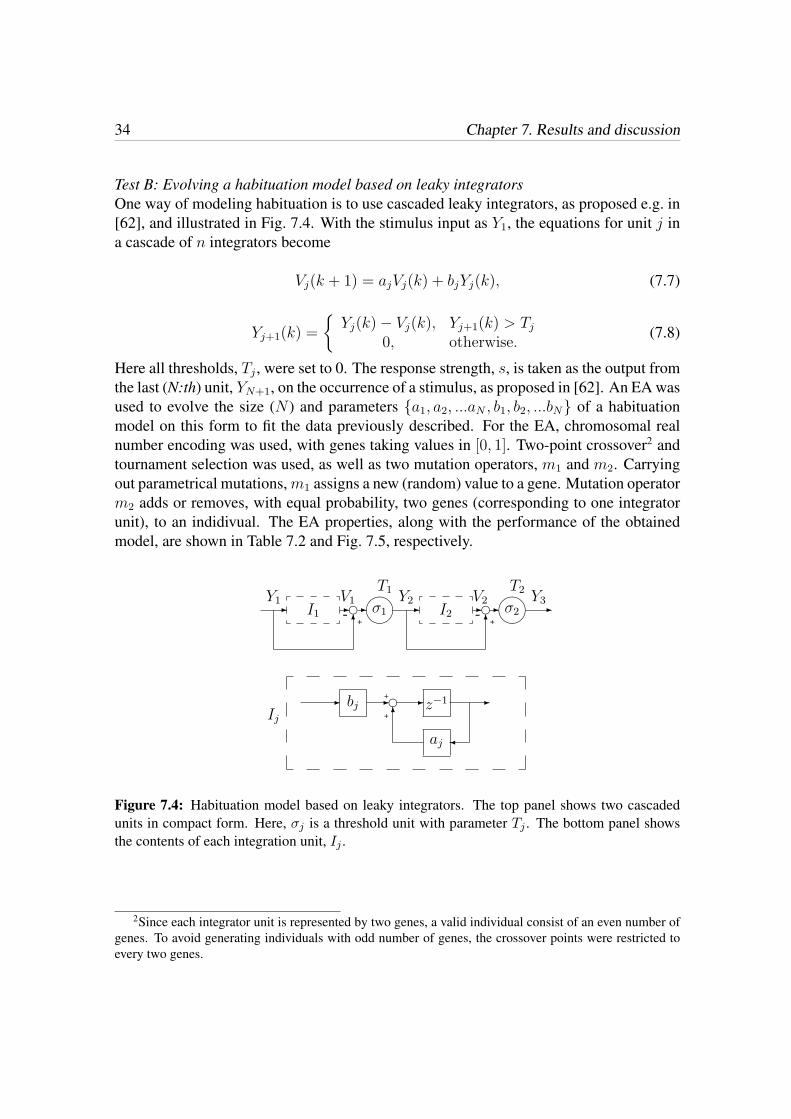
Test B: Evolving a habituation model based on leaky integratorsOne way of modeling habituation is to use cascaded leaky integrators, as proposed e.g. in[62], and illustrated in Fig. 7.4. With the stimulus input as Y1, the equations for unit j ina cascade of n integrators become
Vj(k + 1) = ajVj(k) + bjYj(k), (7.7)
Yj+1(k) =
{Yj(k)− Vj(k), Yj+1(k) > Tj
0, otherwise.(7.8)
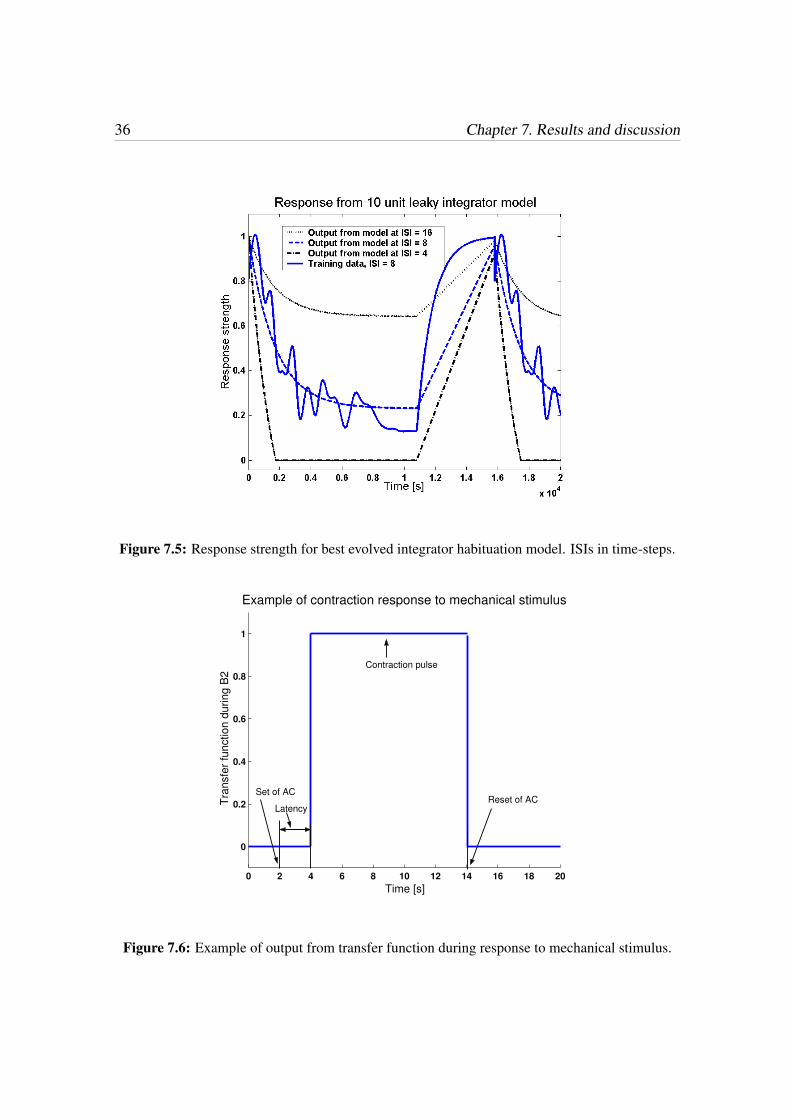
Here all thresholds, Tj , were set to 0. The response strength, s, is taken as the output fromthe last (N:th) unit, YN+1, on the occurrence of a stimulus, as proposed in [62]. An EA wasused to evolve the size (N ) and parameters {a1, a2, ...aN , b1, b2, ...bN} of a habituationmodel on this form to fit the data previously described. For the EA, chromosomal realnumber encoding was used, with genes taking values in [0, 1]. Two-point crossover2 andtournament selection was used, as well as two mutation operators, m1 and m2. Carryingout parametrical mutations,m1 assigns a new (random) value to a gene. Mutation operatorm2 adds or removes, with equal probability, two genes (corresponding to one integratorunit), to an indidivual. The EA properties, along with the performance of the obtainedmodel, are shown in Table 7.2 and Fig. 7.5, respectively.
- I1 - e-����σ1 - I2 - e-����σ2 -
6 6
Y1
-+
V1T1
Y2 V2T2
Y3
-+
Ij- bj - e -z−1 -
�aj
6
+
+
Figure 7.4: Habituation model based on leaky integrators. The top panel shows two cascadedunits in compact form. Here, σj is a threshold unit with parameter Tj . The bottom panel showsthe contents of each integration unit, Ij .
2Since each integrator unit is represented by two genes, a valid individual consist of an even number ofgenes. To avoid generating individuals with odd number of genes, the crossover points were restricted toevery two genes.
7.1. Generation of behaviors 35
Table 7.2: EA properties for the best evolved cascaded integrators habituation unit.Population size 100Initial model size 5 unitsTournament size 10pcross 0.5ptour 0.70pmut1 0.10pmut2 0.05Parameter range (a,b) [0, 1]
The best model obtained consists of 10 units, the parameter values of which are givenbelow.
a =(
0.001 0.001 0.001 0.001 0.001 0.001 0.002 0.001 0.998 0.003)
b =(
0.124 0.010 0.105 0.012 0.711 0.204 0.107 0.549 0.004 0.010)
Transfer function
The transfer function is initialized when the AC is set, and its task is to generate a CP oran LP. One problem with determining whether locomotion or contraction is the adequateresponse is that only qualitative descriptions of this relationship were found in the litera-ture [28, 45, 46]. These descriptions implies that there is a relative increase in locomotionresponses in starved animals. Here, the following relationship was used to determine theresponse type
fcon = acon,
floc = alocMh, (7.9)
for 0 < Mh < hmax. If Mh = hmax, neither a CP nor an LP is evoked. Here, acon
was set to 300 and aloc to 0.001. The probability of locomotion and contraction response,respectively, was taken as
pcon =fcon
fcon + floc
,
ploc =floc
fcon + floc
. (7.10)
The constant latency was set to 2 s, the duration of a CP to 10 s, and the duration of anLP to 60 s. Fig. 7.6 shows an example of the output from the transfer function during acontraction response to mechanical stimulus. The AC, being of set/reset character, causesthe behavioral output to be active between the time of set and reset.
36 Chapter 7. Results and discussion
Figure 7.5: Response strength for best evolved integrator habituation model. ISIs in time-steps.
0 2 4 6 8 10 12 14 16 18 20
0
0.2
0.4
0.6
0.8
1
Example of contraction response to mechanical stimulus
Tra
nsfe
r fu
nction d
uring B
2
Time [s]
Contraction pulse
Latency
Set of AC Reset of AC
Figure 7.6: Example of output from transfer function during response to mechanical stimulus.
7.1. Generation of behaviors 37
0 10 20 30 40 50 60 70 80 90 1000
50
100
150
200
250
300
350
400
450
Latency vs. stimulus intensity
Relative light intensity [%]
Reaction t
ime [
s]
Measured dataFunction approximation
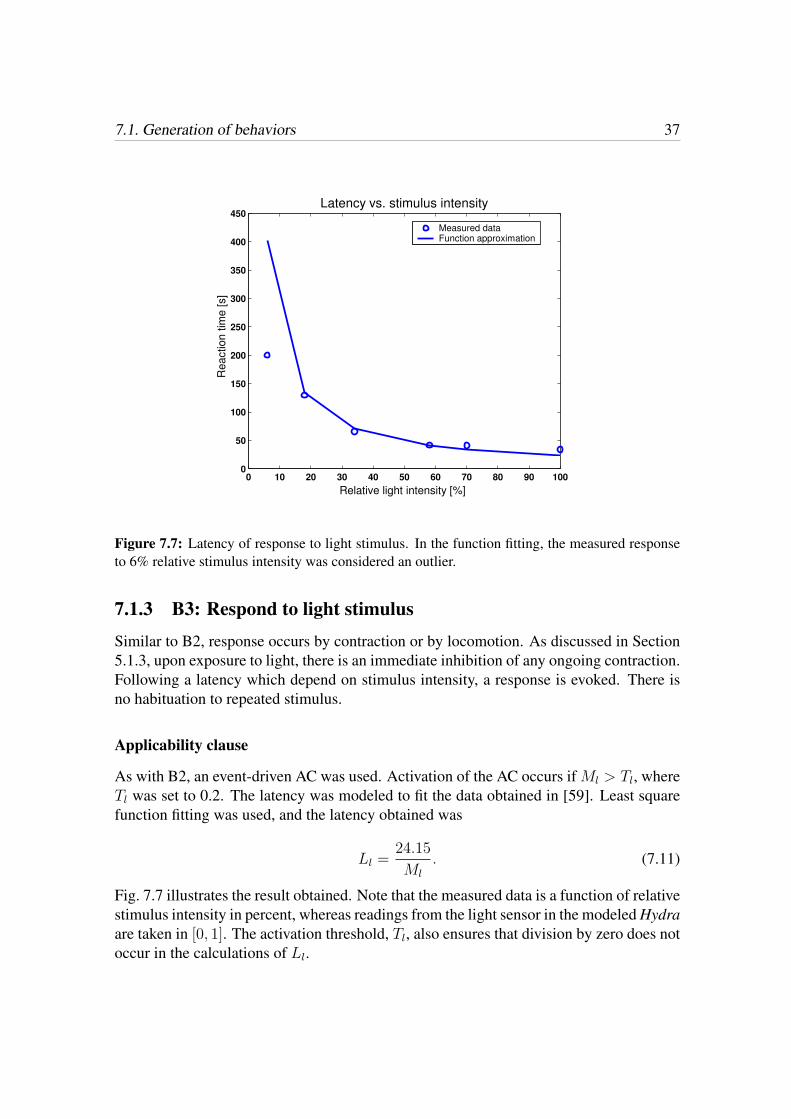
Figure 7.7: Latency of response to light stimulus. In the function fitting, the measured responseto 6% relative stimulus intensity was considered an outlier.
7.1.3 B3: Respond to light stimulus
Similar to B2, response occurs by contraction or by locomotion. As discussed in Section5.1.3, upon exposure to light, there is an immediate inhibition of any ongoing contraction.Following a latency which depend on stimulus intensity, a response is evoked. There isno habituation to repeated stimulus.
Applicability clause
As with B2, an event-driven AC was used. Activation of the AC occurs if Ml > Tl, whereTl was set to 0.2. The latency was modeled to fit the data obtained in [59]. Least squarefunction fitting was used, and the latency obtained was
Ll =24.15
Ml
. (7.11)
Fig. 7.7 illustrates the result obtained. Note that the measured data is a function of relativestimulus intensity in percent, whereas readings from the light sensor in the modeled Hydraare taken in [0, 1]. The activation threshold, Tl, also ensures that division by zero does notoccur in the calculations of Ll.
38 Chapter 7. Results and discussion
Transfer function
The TF of B3 share the same task as the one of B2, namely to evoke a CP or an LP,whichever is applicable. Eqs. 7.9 and 7.10 were applied to determine response type alsoin this case. Similar to B2, the time for the applicable response was set to t + Ll, wheret is the time for activation of the AC, and Ll is the latency as determined above. Also inthis case, the duration of a CP was set to 10 s, and the duration of an LP to 60 s.
7.1.4 B4: Feeding
The feeding behavior of Hydra is activated by the presence of GSH and, as discussedin Section 5.1.3, both activation threshold and duration of the response depend on thenutritional state of the animal. Throughout the feeding response, there is a total inhibitionof other behaviors [52].
Applicability clause
Also for B4, an event-driven AC was used. The activation threshold and duration ofresponse were determined with respect to measured data from experimental studies of theanimal.
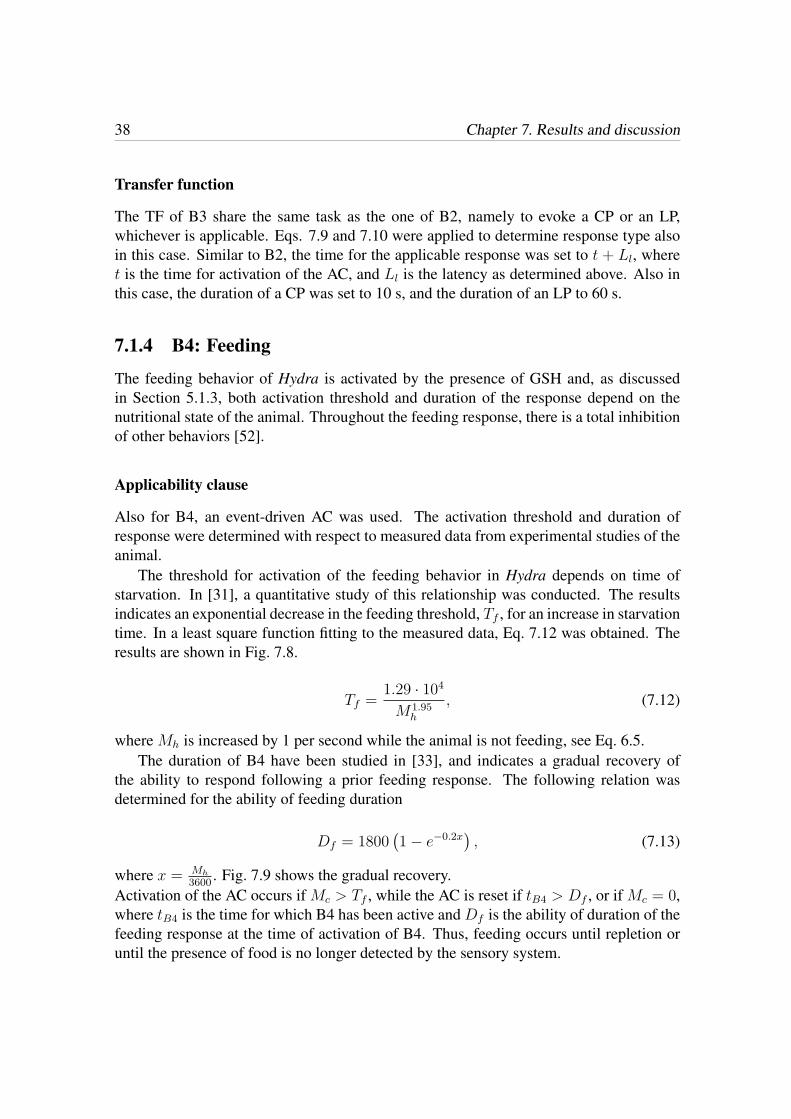
The threshold for activation of the feeding behavior in Hydra depends on time ofstarvation. In [31], a quantitative study of this relationship was conducted. The resultsindicates an exponential decrease in the feeding threshold, Tf , for an increase in starvationtime. In a least square function fitting to the measured data, Eq. 7.12 was obtained. Theresults are shown in Fig. 7.8.
Tf =1.29 · 104
M1.95h
, (7.12)
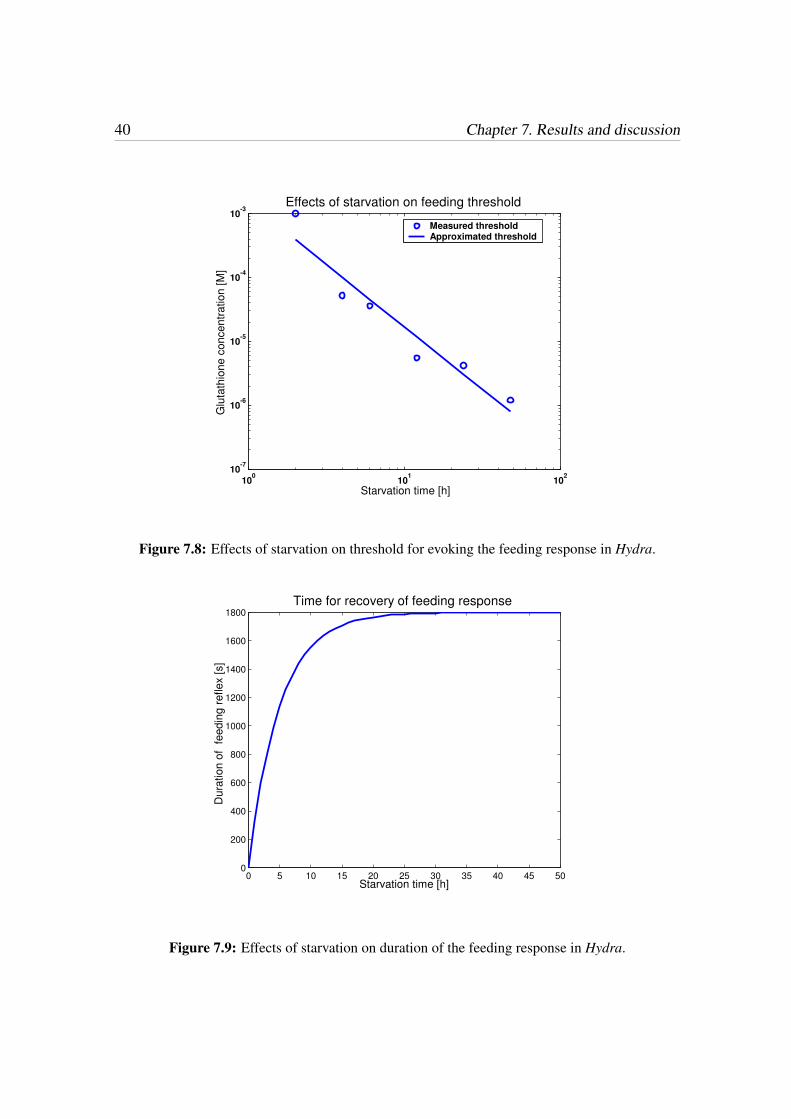
where Mh is increased by 1 per second while the animal is not feeding, see Eq. 6.5.The duration of B4 have been studied in [33], and indicates a gradual recovery of
the ability to respond following a prior feeding response. The following relation wasdetermined for the ability of feeding duration
Df = 1800(1− e−0.2x
), (7.13)
where x = Mh
3600. Fig. 7.9 shows the gradual recovery.
Activation of the AC occurs if Mc > Tf , while the AC is reset if tB4 > Df , or if Mc = 0,where tB4 is the time for which B4 has been active and Df is the ability of duration of thefeeding response at the time of activation of B4. Thus, feeding occurs until repletion oruntil the presence of food is no longer detected by the sensory system.

7.1. Generation of behaviors 39
Transfer function
Feeding in Hydra consists of a sequence of actions, and involves e.g. tentacle movement.However, in the simplified model of Hydra used in this project it does not seem motivatedto model any movement of the animal during B4. Thus, the transfer function was omittedin the sense that no physical state variable is affected by the feeding behavior.
40 Chapter 7. Results and discussion
100
101
102
10-7
10-6
10-5
10-4
10-3
Effects of starvation on feeding threshold
Starvation time [h]
Glu
tath
ione c
oncentr
ation [
M]
Measured thresholdApproximated threshold
Figure 7.8: Effects of starvation on threshold for evoking the feeding response in Hydra.
0 5 10 15 20 25 30 35 40 45 500
200
400
600
800
1000
1200
1400
1600
1800Time for recovery of feeding response
Starvation time [h]
Dura
tion o
f f
eedin
g r
eflex [
s]
Figure 7.9: Effects of starvation on duration of the feeding response in Hydra.
7.2. Generation of behavioral organizer 41
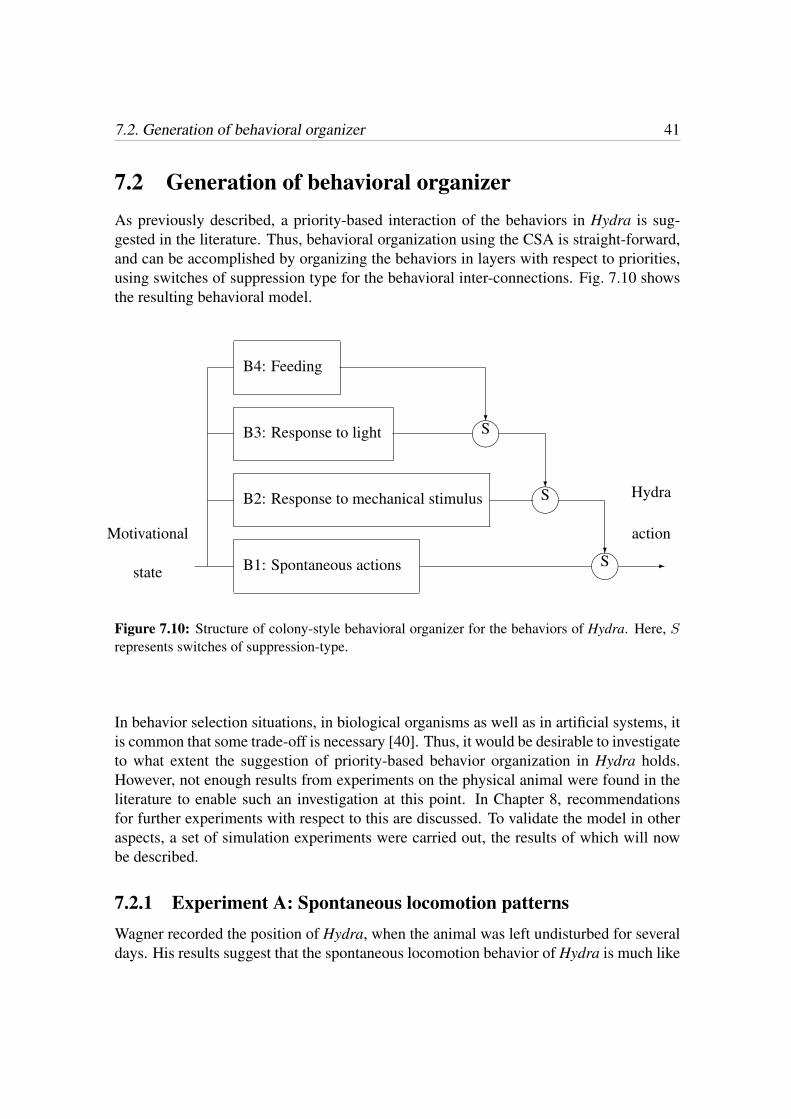
7.2 Generation of behavioral organizerAs previously described, a priority-based interaction of the behaviors in Hydra is sug-gested in the literature. Thus, behavioral organization using the CSA is straight-forward,and can be accomplished by organizing the behaviors in layers with respect to priorities,using switches of suppression type for the behavioral inter-connections. Fig. 7.10 showsthe resulting behavioral model.
B4: Feeding
B3: Response to light
B2: Response to mechanical stimulus
B1: Spontaneous actions -
?
?
?
����S
����S
����S
Hydra
actionMotivational
state
Figure 7.10: Structure of colony-style behavioral organizer for the behaviors of Hydra. Here, Srepresents switches of suppression-type.
In behavior selection situations, in biological organisms as well as in artificial systems, itis common that some trade-off is necessary [40]. Thus, it would be desirable to investigateto what extent the suggestion of priority-based behavior organization in Hydra holds.However, not enough results from experiments on the physical animal were found in theliterature to enable such an investigation at this point. In Chapter 8, recommendationsfor further experiments with respect to this are discussed. To validate the model in otheraspects, a set of simulation experiments were carried out, the results of which will nowbe described.
7.2.1 Experiment A: Spontaneous locomotion patternsWagner recorded the position of Hydra, when the animal was left undisturbed for severaldays. His results suggest that the spontaneous locomotion behavior of Hydra is much like
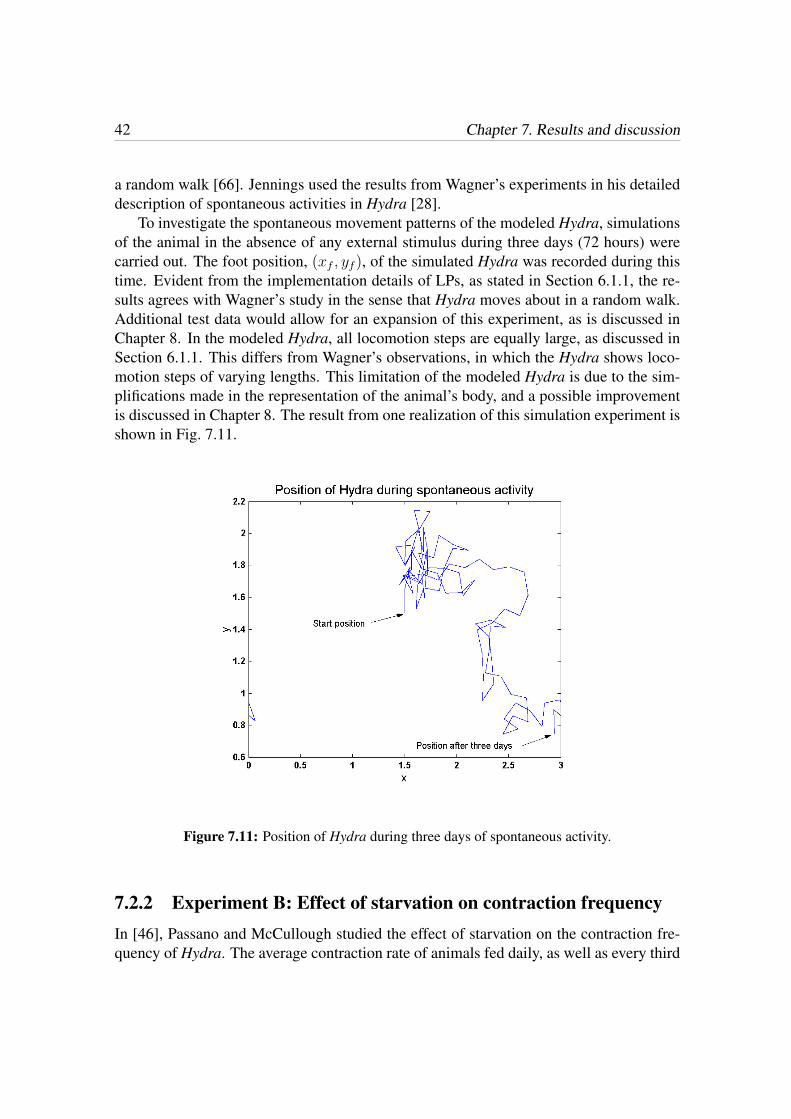
42 Chapter 7. Results and discussion
a random walk [66]. Jennings used the results from Wagner’s experiments in his detaileddescription of spontaneous activities in Hydra [28].
To investigate the spontaneous movement patterns of the modeled Hydra, simulationsof the animal in the absence of any external stimulus during three days (72 hours) werecarried out. The foot position, (xf , yf ), of the simulated Hydra was recorded during thistime. Evident from the implementation details of LPs, as stated in Section 6.1.1, the re-sults agrees with Wagner’s study in the sense that Hydra moves about in a random walk.Additional test data would allow for an expansion of this experiment, as is discussed inChapter 8. In the modeled Hydra, all locomotion steps are equally large, as discussed inSection 6.1.1. This differs from Wagner’s observations, in which the Hydra shows loco-motion steps of varying lengths. This limitation of the modeled Hydra is due to the sim-plifications made in the representation of the animal’s body, and a possible improvementis discussed in Chapter 8. The result from one realization of this simulation experiment isshown in Fig. 7.11.
Figure 7.11: Position of Hydra during three days of spontaneous activity.
7.2.2 Experiment B: Effect of starvation on contraction frequencyIn [46], Passano and McCullough studied the effect of starvation on the contraction fre-quency of Hydra. The average contraction rate of animals fed daily, as well as every third
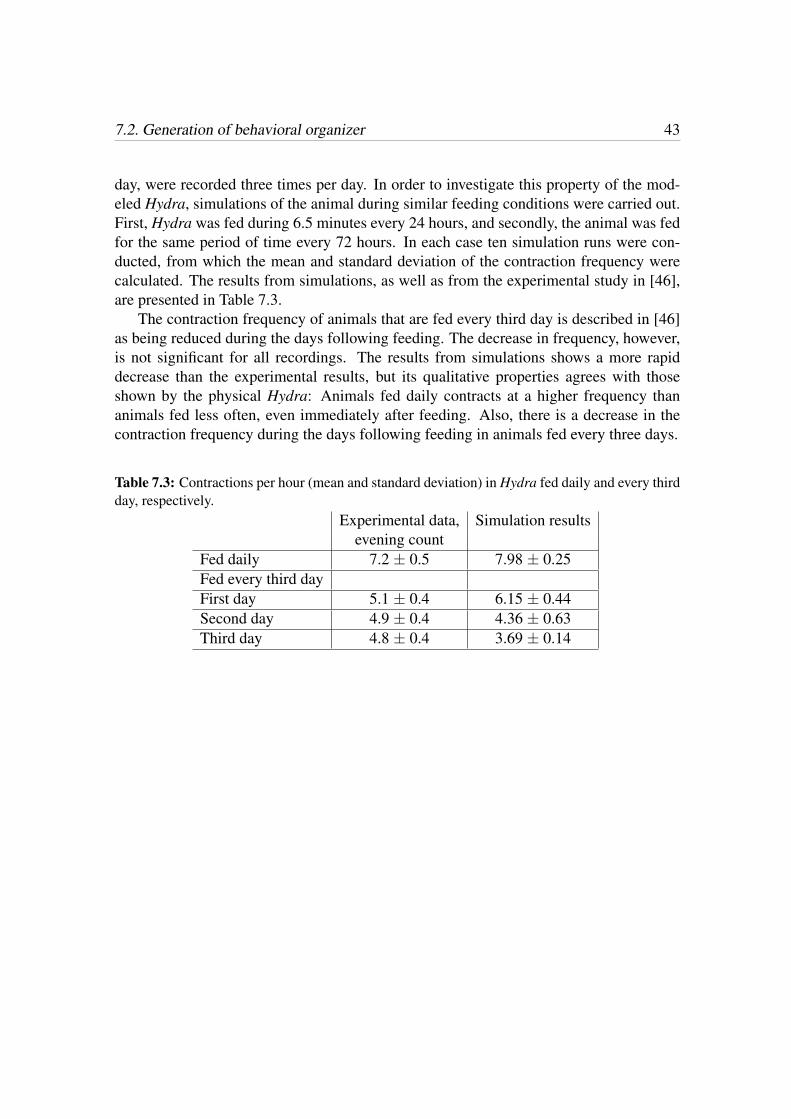
7.2. Generation of behavioral organizer 43
day, were recorded three times per day. In order to investigate this property of the mod-eled Hydra, simulations of the animal during similar feeding conditions were carried out.First, Hydra was fed during 6.5 minutes every 24 hours, and secondly, the animal was fedfor the same period of time every 72 hours. In each case ten simulation runs were con-ducted, from which the mean and standard deviation of the contraction frequency werecalculated. The results from simulations, as well as from the experimental study in [46],are presented in Table 7.3.
The contraction frequency of animals that are fed every third day is described in [46]as being reduced during the days following feeding. The decrease in frequency, however,is not significant for all recordings. The results from simulations shows a more rapiddecrease than the experimental results, but its qualitative properties agrees with thoseshown by the physical Hydra: Animals fed daily contracts at a higher frequency thananimals fed less often, even immediately after feeding. Also, there is a decrease in thecontraction frequency during the days following feeding in animals fed every three days.
Table 7.3: Contractions per hour (mean and standard deviation) in Hydra fed daily and every thirdday, respectively.
Experimental data, Simulation resultsevening count
Fed daily 7.2 ± 0.5 7.98 ± 0.25Fed every third dayFirst day 5.1 ± 0.4 6.15 ± 0.44Second day 4.9 ± 0.4 4.36 ± 0.63Third day 4.8 ± 0.4 3.69 ± 0.14

Chapter 8Summary and conclusions
In this thesis work methods from BBR have been used to model the behavior of a simplebiological organism. Literature studies were conducted concerning suitable model organ-isms, as well as methods for behavior generation and organization. Based on the literaturesurveys, the cnidarian Hydra was selected as the model organism for this project, and theCSA was selected as the framework for modeling the behavior of Hydra. The two mainreasons for choosing Hydra as the model organism are the animal’s complexity level, andthe number of measurement data available from prior ethological experiments conductedon the animal. The reasons for choosing the CSA are that it supports implementation ofpriority based behaviors (as is the case with Hydra’s behaviors according to the litera-ture), as well as allows for modeling the reflex properties found in Hydra such as latency,habituation, and duration of response.
The general conclusion of the work conducted in this project is that it is possibleto model several of the behavioral properties of Hydra using the CSA as a framework.The modeled latency of Hydra’s response to light stimulus, the habituation effect of itsresponse to mechanical stimulus, the duration of a CP and the feeding response, respec-tively, as well as the variable feeding threshold are consistent with experimental data.Specifically, it was found that a habituation model based on cascaded leaky integratorscan represent the habituation properties of the animal. Simulations of the overall behav-ior of the animal shows that the spatial movement pattern of undisturbed Hydra, as wellas the effect of starvation on contraction frequency, agrees with results from experimentsconducted on the physical animal. In order to obtain conclusive results concerning theoverall behavior of Hydra, however, some improvements remain.
Several future contributions would be of interest: Expanding the model to includethe morphology of Hydra would allow for more accurate modeling, e.g. of the durationof an LP, as well as the distance of movement, in the case of locomotion by means ofsomersaulting, as discussed in Section 7.2.1. Generation of more test data for validationpurposes would also be of interest. For example, a recording not only of the spatial
45
46 Chapter 8. Summary and conclusions
patterns of movement, but also of the time of occurrence for each movement, wouldallow for an expansion of the simulations carried out in Section 7.2.1 to include alsothe frequency of locomotion. If such experiments were also to include a recording ofthe contraction frequency, more insight of the interaction between CPs and LPs could begained. Furthermore, experiments concerning the adaption to ambient light conditionswould be of interest, since such experimental data could be used to model an additionalinternal process of the animal. Also of interest for further work is an investigation of theextent to which priority-based behavior organization in Hydra holds. For this purpose,experiments on how the animal reacts to light and mechanical stimuli during feeding, notonly initially, but also after some time has passed, are recommended.
Bibliography
[1] ARKIN, R., Behavior-Based Robotics. Cambridge, MA: The MIT Press, 1998.
[2] ARKIN, R., KAHLED, A., WEITZENFELD, A., and CERVANTES-PEREZ, F., “Be-havioral models of the praying mantis as a basis for robotic behavior”, Journal ofRobotics and Autonomous Systems, vol. 32, no. 1, pp. 39–60, 2000.
[3] ARKIN, R. C., “Reactive robotic systems”, in Handbook of Brain Theory and Neu-ral Networks (ARBIB, M., ed.), pp. 793–796, Cambridge, MA: MIT Press, 1995.
[4] BEKEY, G., Autonomous Robots: From Biological Inspiration to Implementationand Control. Cambridge, MA: The MIT Press, 2005.
[5] BERGREN, C., Anatomy of a Robot. New York, NY: McGraw-Hill, 2003.
[6] BEST, J. and RUBINSTEIN, I., “Maze learning and associated behavior in planaria”,Journal of Comparative and Physiological Psychology, vol. 55, pp. 560–566, 1962.
[7] BIOMEDIA ASSOCIATES, “http://www.ebiomedia.com”, Oct. 13th, 2006.
[8] BROOKS, R., “A robust layered control system for a mobile robot”, IEEE Journalof Robotics and Automation, vol. RA-2, no. 1, pp. 14–23, 1986.
[9] BROOKS, R. A., “Intelligence without reason”, in Proceedings of the 12th Interna-tional Joint Conference on Artificial Intelligence (IJCAI-91) (MYOPOULOS, J. andREITER, R., eds.), (Sydney, Australia), pp. 569–595, Morgan Kaufmann publishersInc.: San Mateo, CA, USA, 1991.
[10] BUASON, G., BERGFELDT, N., and ZIEMKE, T., “Brains, bodies, and beyond:Competitive co-evolution of robot controllers, morphologies and environments”,Genetic Programming and Evolvable Machines, vol. 6, no. 1, pp. 25–51, 2005.
47
48 Bibliography
[11] BÄCK, T., FOGEL, D., and MICHALEWICZ, Z., eds., Handbook of EvolutionaryComputation. Bristol: Institute of Physics Publishing and Oxford University Press,1997.
[12] CHIEL, H. and BEER, R., “The brain has a body: Adaptive behavior emerges frominteractions of nervous system, body and environment”, Trends in Neurosciences,vol. 20, no. 12, pp. 553–557, 1997.
[13] CLARK, W. and GRUNSTEIN, M., Are We Hardwired? The Roles of Genes in Hu-man Behavior. Oxford University Press, 2000.
[14] CONNELL, J., “A colony architecture for an artificial creature”, Tech. Rep., 1151,MIT Artificial Intelligence Laboratory, June 1989.
[15] DAWKINS, R., The Selfish Gene. Oxford: Oxford University Press, 2nd ed., 1989.
[16] DAWKINS, R., Climbing Mount Improbable. New York, N.Y.: W.W. Norton andCompany, 1996.
[17] DAWKINS, R., The Blind Watchmaker. London: Penguin Books, 2000.
[18] EIBL-EIBESFELDT, I., Ethology: The Biology of Behavior. New York, NY: Holt,Rinehart and Winston, 2nd ed., 1975.
[19] GIBSON, J., The Ecological Approach to Visual Perception. Boston, MA: HoughtonMifflin, 1979.
[20] GROOME, D., An Introduction to Cognitive Psychology : Processes and Disorders.London: Psychology Press, 2nd ed., 1999.
[21] HAEFNER, J., Modeling Biological Systems: Principles and Applications. NewYork, NY: Chapman & Hall, 1996.
[22] HARPER, C. and WINFIELD, A., “A methodology for provably stable behaviour-based intelligent control”, Robotics and Autonomous Systems, vol. 54, pp. 52–73,2006.
[23] HAYKIN, S., Neural Networks: A Comprehensive Foundation. Upper Saddle River,NJ: Prentice Hall, 2nd ed., 1999.
[24] HICKMAN, C., ROBERTS, L., LARSON, A., I’ANSON, H., and EISENHOUR, D.,Integrated Principles of Zoology. New York, N.Y.: McCraw-Hill, 13th ed., 2006.
[25] HOLLAND, J., Adaptation in natural and artificial systems. Cambridge, MA: MITPress, 1992.
Bibliography 49
[26] HOLYOAK, K. and MORRISON, R., eds., The Cambridge Handbook of Thinkingand Reasoning. New York, N.Y.: Cambridge University Press, 2005.
[27] JENNINGS, H., Contributions to the Study of the Behavior of Lower Organisms.Washington: Carnegie Institution of Washington, 1904.
[28] JENNINGS, H., Behavior of the Lower Organisms. Bloomington: Indiana UniversityPress, 1962.
[29] KASS-SIMON, G., PANNACCIONE, A., and PIEROBON, P., “GABA and glutamatereceptors are involved in modulating pacemaker activity in Hydra.”, ComparativeBiochemistry and Physiology A, vol. 136, pp. 329–342, 2003.
[30] KOCH, C. and SEGEV, I., eds., Methods in Neuronal Modeling, from Ions to Net-works. Cambridge, MA: MIT Press, 2nd ed., 1998.
[31] KOIZUMI, O. and MAEDA, N., “Rise of feeding threshold in satiated Hydra”, Jour-nal of Comparative Physiology, vol. 142, pp. 75–80, 1981.
[32] LENHOFF, H., “Behavior, hormones, and Hydra”, Science, vol. 161, pp. 434–442,1968.
[33] LENHOFF, H. and LOOMIS, W., eds., The Biology of Hydra and Some Other Coe-lenterates. Miami, FL: University of Miami Press, 1961.
[34] MAES, P., “How to do the right thing”, Connection Science Journal, Special Issueon Hybrid Systems, vol. 1, no. 3, pp. 291–323, 1989.
[35] MANGEL, M. and CLARK, C., Dynamic Modeling in Behavioral Ecology. Prince-ton, NJ: Princeton University Press, 1988.
[36] MANNING, A. and DAWKINS, M., An Introduction to Animal Behaviour. Cam-bridge: Cambridge University Press, 1998.
[37] MATARIC, M., “Behavior-based robotics as a tool for synthesis of artificial behaviorand analysis of natural behavior”, Trends in Cognitive Science, vol. 2, no. 3, pp. 82–87, 1998.
[38] MAYNARD SMITH, J., Evolution and the Theory of Games. Cambridge, MA: Cam-bridge University Press, 1982.
[39] MCFARLAND, D., Animal behavior: Psychobiology, Ethology and Evolution. Pren-tice Hall, 3rd ed., 1998.
[40] MCFARLAND, D. and BÖSSER, T., Intelligent Behavior in Animals and Robots.MIT Press, 1993.
50 Bibliography
[41] MITCHELL, M., An Introduction to Genetic Algorithms. Cambridge, MA: The MITPress, 1996.
[42] NOLFI, S. and FLOREANO, D., Evolutionary Robotics. Cambridge, MA: The MITPress, 2000.
[43] NORDAHL, M., 2006. Private communication.
[44] NORTHROP, R., Introduction to Dynamic Modeling of Neuro-Sensory Systems. CRCPress, 2001.
[45] PASSANO, L. and MCCULLOUGH, C., “Pacemaker hierarchies controlling the be-haviour of Hydras”, Nature, vol. 199, pp. 1174–1175, 1963.
[46] PASSANO, L. and MCCULLOUGH, C., “Co-ordinating systems and behavior in Hy-dra, I. pacemaker system of the periodic contractions”, Journal of Experimental Bi-ology, vol. 41, pp. 643–664, 1964.
[47] PETTERSSON, J., Generation and Organization of Behaviors for AutonomousRobots. PhD thesis, Chalmers University of Technology, Göteborg, 2006.
[48] PIRJANIAN, P., “An overview of system architectures for action selection in mobilerobots”, Tech. Rep., Laboratory of Image Analysis, Aalborg University, Aalborg,May 1997.
[49] PIRJANIAN, P., “Behavior coordination mechanisms - state-of-the-art”, Tech. Rep.,IRIS-99-375, Institute of Robotics and Intelligent Systems, School of Engineering,University of Southern California, Los Angeles, CA, October 1999.
[50] RIDDLE, D., BLUMENTHAL, T., MEYER, B., and PRIESS, J., C. Elegans II. NewYork: Cold Spring Harbor Laboratory Press, 1997.
[51] RUGGIERIA, R., PIEROBONB, P., and KASS-SIMON, G., “Pacemaker activity inHydra is modulated by glycine receptor ligands”, Comparative Biochemistry andPhysiology A, vol. 138, pp. 193–202, 2004.
[52] RUSHFORTH, N., “Modification in temporal patterning of pacemaker activity inHydra by sensory input”, The Journal of General Physiology, vol. 50, p. 2484, 1967.
[53] RUSHFORTH, N., BURNETT, A., and MAYNARD, R., “Behavior in Hydra: Con-traction responses of Hydra Pirardi to mechanical and light stimulation”, Science,vol. 139, pp. 760–761, 1963.
[54] RUSHFORTH, N., KROHN, I., and BROWN, L., “Behavior in Hydra: Inhibition ofthe contraction responses of Hydra Pirardi”, Science, vol. 145, pp. 602–604, 1964.
Bibliography 51
[55] RUSSELL, S. and NORVIG, P., Artificial Intelligence: A Modern Approach. UpperSaddle River, N.J: Prentice-Hall, 2nd ed., 2003.
[56] SAFFIOTTI, A., “The uses of fuzzy logic in autonomous robot navigation”, SoftComputing, vol. 1, no. 4, pp. 180–197, 1997.
[57] SEVERIN, E., Robot Companions: MentorBots and Beyond. New York, NY:McGraw-Hill, 2003.
[58] SIEGWART, R. and NOURBAKHSH, I., Introduction to Autonomous Mobile Robots.Cambridge, MA: MIT Press, 2004.
[59] SINGER, R., RUSHFORTH, N., and BURNETT, A., “The photodynamic action oflight on Hydra”, Journal of Experimental Zoology, vol. 54, no. 2, pp. 169–173,1963.
[60] SLATER, P., Essentials of Animal Behaviour. Cambridge: Cambridge UniversityPress, 1999.
[61] STADDON, J., Adaptive Behavior and Learning. Cambridge, MA: Cambridge Uni-versity Press, 1983.
[62] STADDON, J., Adaptive Dynamics. Cambridge, MA: MIT Press, 2001.
[63] TADDEI-FERRETTI, C. and MUSIO, C., “The neural net of Hydra and the modu-lation of its periodic activity”, in Foundations and Tools for Neural Modeling, In-ternational Work-Conference on Artificial and Natural Neural Networks, IWANN’99 (MIRA, J. and SÁNCHEZ-ANDRÉS, J. V., eds.), vol. 1606 of Lecture Notes inComputer Science, pp. 123–137, Springer, 1999.
[64] TADDEI-FERRETTI, C. and MUSIO, C., “Photobehavior of Hydra (Cnidaria, Hy-drozoa) and correlated mechanisms: A case of extraocular photosensitivity”, Jour-nal of Photocmemistry and Photobiology, 2000.
[65] TOATES, F. M., Animal Behavior: A Systems Approach. New York, NY: John Wiley& Sons, 1980.
[66] WAGNER, G., “On some movements and reactions of Hydra”, Quarterly Journal ofMicroscopical Science, vol. 48, pp. 585–622, 1905.
[67] WAHDE, M., An Introduction to Adaptive Algorithms and Intelligent Machines.Göteborg: Chalmers Reproservice, 4th ed., 2005.
[68] WAHDE, M. and SANDHOLT, H., “Evolution of complex behaviors on an au-tonomous robot”, in Proceedings of the 7th UK Mechatronics Forum InternationalConference, (Oxford), Pergamon Press, 2000.
52 Bibliography
[69] WATSON, J., Behaviorism. New York, N.Y.: Norton, 1925.
[70] WEBB, B., “Can robots make good models of biological behavior?”, Behavioraland Brain Sciences, vol. 24, pp. 1033–1050, 2001.
[71] WOLFF, K., Generation and Optimization of Motor Behaviors in Real and Simu-lated Robots. PhD thesis, Chalmers University of Technology, Göteborg, 2006.
[72] XUE, X. and HENDERSON, T., “Video based animal behavior analysis”, Tech. Rep.,UUCS-06-006, School of Computing, University of Utah, Salt Lake City, UT, 2006.
Appendix AEvolutionary algorithms
In this appendix, a brief introduction to EAs is given. Numerous literature is available onthe subject, for a more thorough review see e.g. [11, 41, 67].
EAs is an umbrella term for search algorithms inspired by evolution in nature. Dif-fering somewhat in representation and implementation details, versions of EAs includegenetic algorithms (GAs), evolution strategies (ES), and genetic programming (GP) [67].Suited for problems with large search space and many local optima, EAs have been usedin a wide variety of application areas, such as function optimization, scheduling, con-struction of ANNs, system identification, and time series prediction. An EA operates ona population, which consists of several individuals. An individual can be seen as a can-didate solution for the task at hand, and its information is contained in one or more chro-mosomes, forming the genome of the individual. Each chromosome, in turn, consists ofa set of genes, in which the information is encoded. During the flow of an EA, whichcan be seen if Fig. A.1, each individual is evaluated and assigned a fitness, i.e. a mea-sure of goodness, based of its ability to solve the given task. The EA operators selection,crossover, and mutation are then applied, forming the individuals of the next genera-tion. During selection, two individuals are chosen for reproduction, and fitter individualsstand a better chance of being selected than less fit ones. The crossover procedure com-bines information from the selected individuals, and mutations randomly change piecesof information encoded in the genome of an individual, inserting new genetic material inthe population.
A.1 Encoding schemeThere are several ways of encoding the information contained in the genome of an indi-vidual. In this project, explicit encoding, and real-number encoding is used. In explicit
53
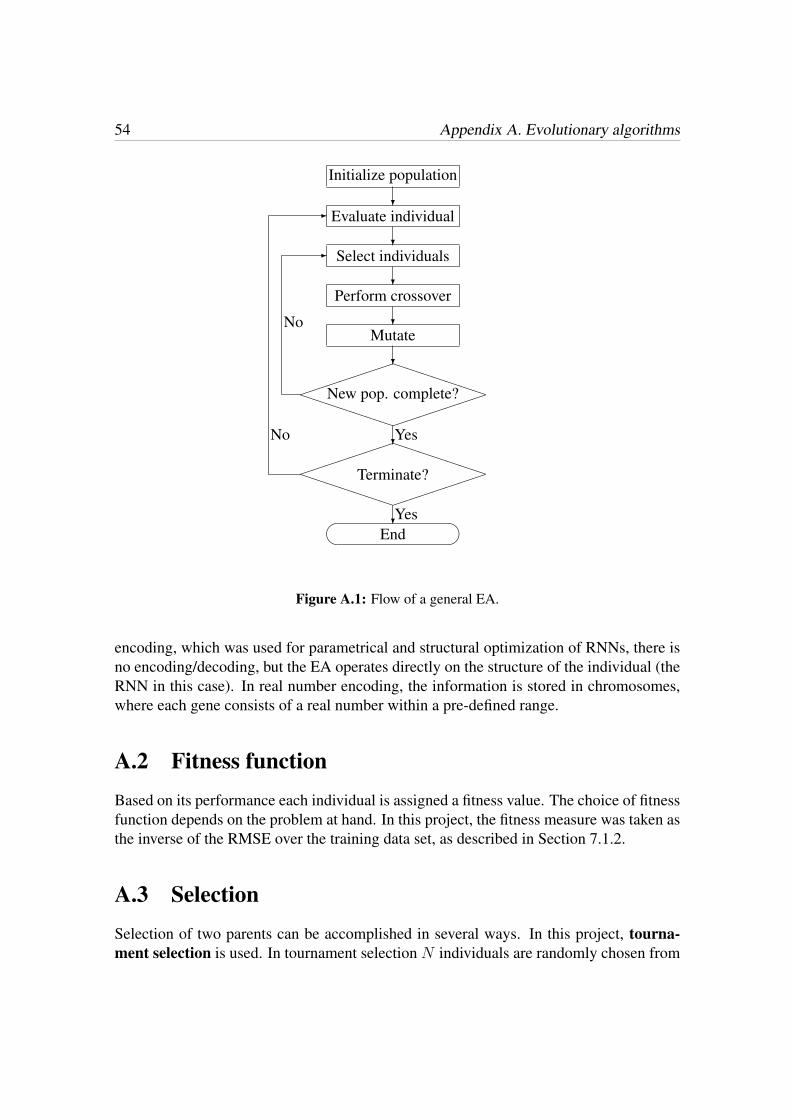
54 Appendix A. Evolutionary algorithms
Initialize population
Evaluate individual
Select individuals
Perform crossover
Mutate
?
?
?
?
?
����
���PPPPPPPPPPPPPP��
����
�New pop. complete?
?
-
Yes
No
����
���PPPPPPPPPPPPPP��
����
�Terminate?
?
-
Yes
No
�� � End
Figure A.1: Flow of a general EA.
encoding, which was used for parametrical and structural optimization of RNNs, there isno encoding/decoding, but the EA operates directly on the structure of the individual (theRNN in this case). In real number encoding, the information is stored in chromosomes,where each gene consists of a real number within a pre-defined range.
A.2 Fitness functionBased on its performance each individual is assigned a fitness value. The choice of fitnessfunction depends on the problem at hand. In this project, the fitness measure was taken asthe inverse of the RMSE over the training data set, as described in Section 7.1.2.
A.3 SelectionSelection of two parents can be accomplished in several ways. In this project, tourna-ment selection is used. In tournament selection N individuals are randomly chosen from
Appendix A. Evolutionary algorithms 55
the population, where N is referred to as the tournament size. Out of the N selectedindividuals, the best one (having the highest fitness) is selected with probability ptour.With probability 1− ptour another, randomly chosen, individual is selected. The selectionprocedure is carried out twice, resulting in two individuals selected to generate offspring(through crossover and mutations).
A.4 CrossoverThrough the use of crossover, genetic material from two parents are combined. Thecrossover operator is highly dependent on the encoding scheme, and often care must betaken in order to ensure that the resulting offspring actually encodes valid solutions tothe problem at hand. In this project, crossover was not used in the experiment involvingan RNN. In the case where an EA was used to optimize the parameters and size of ahabituation model consisting of leaky integrators, two-point crossover was used. In two-point crossover, two crossover points are randomly chosen for each parent. The genesbetween the crossover points on one chromosome swaps places with the genes betweenthe crossover points on the other chromosome. In this way, the length of chromosomesmay be altered from parent to offspring, by the crossover operator.
A.5 MutationsMutations provide the EA with new material to work with. The mutation operator isproblem specific, and several mutation operators may be used in one EA. In this projecta number of mutation operators were used. Standard mutation operators, such as fullweight mutation, where a gene simply is given a new, random value within its allowedrange, and real number creep mutation, where the change of a gene is limited in mag-nitude, were used to alter the parameters of the problems. In addition structural mutationoperators were implemented, to allow for optimization of the structure of the solutionas well as its parameters. Implementation details of the mutation operators used in thisproject are stated in Section 7.1.2.
A.6 ElitismIn elitism a copy of the best individual is inserted in the next generation without anymodification. Hence, through the use of elitism the maximum fitness of the populationwill never decrease during the run of an EA.

Appendix BRecurrent neural networks
ANNs are, as the name implies, networks of computational units, called neurons. Anartificial neuron has three basic properties: (1) A number of synaptic weights (weightedlinks) which connects input signals (and bias) to the neuron. (2) An adder that sumsthe weighted inputs. (3) An activation function that limits the output amplitude of theneuron. The activation function can also serve to add non-linearity to the neuron. A modelof an artificial neuron is shown in Fig. B.1.
ANNs have been used in various application fields, including image recognition, timeseries prediction, non-linear control problems, and as robotic brains [67]. In cases whereinput-output data is available, specifically in cases where it is difficult to arrive at ananalytical model for the problem, or when such a model simply does not exist, ANNs canbe advantageous, and is then used as a black-box model of the system. RNNs is one kindof ANNs, that make use also of feedback connections between neurons (as opposed tofeedforward neural networks, FFNNs). While FFNNs always generate the same outputfor any given input, the feedback connections provide RNNs with some memory, allowingits output to depend also on previous inputs. ANNs can operate in continuous time orin discrete time. In this project only continuous time RNNs were used, and the relevantequations for these networks will now be presented. For a more thorough review of ANNs,see e.g. [23].
B.1 Network equationsAs previously mentioned, the RNNs used in this project operate in continuous time. Thearchitecture of the RNN is such that the neurons are not arranged in layers (as is the
57
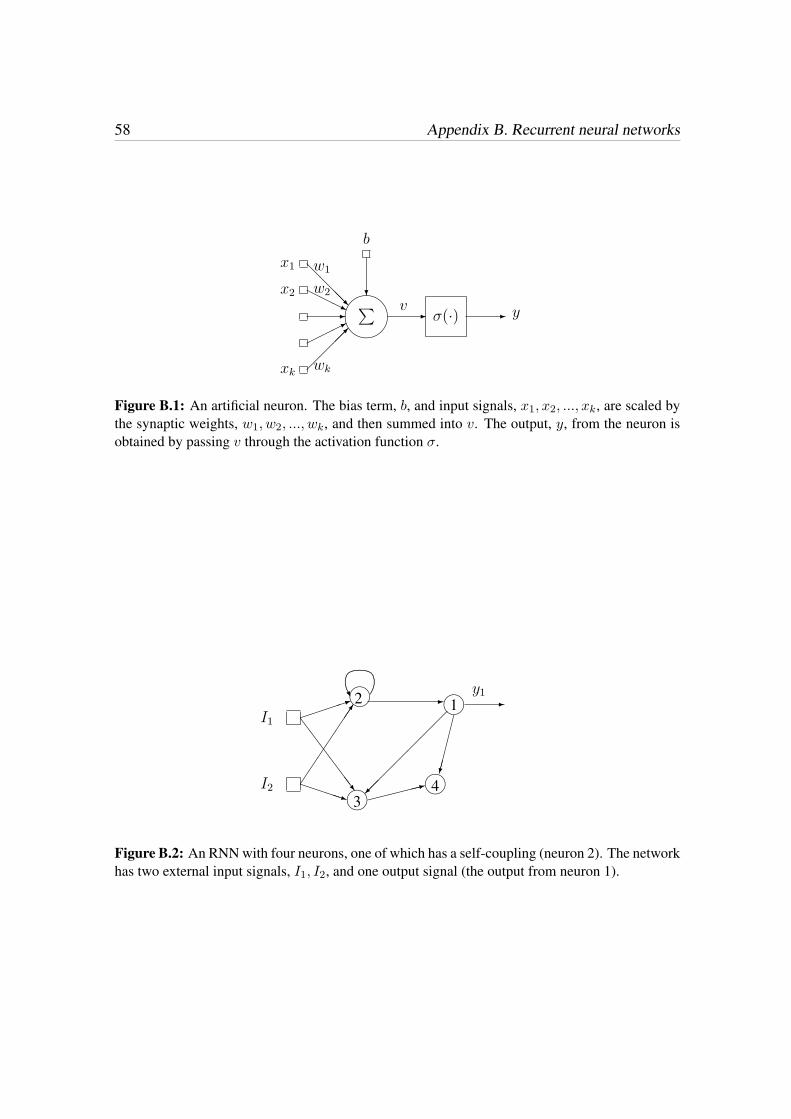
58 Appendix B. Recurrent neural networks
����∑
- σ(·) --
HHHj
@@@@R
���*
�����
?
b
x1
x2
xk
yv
w1
w2
wk
Figure B.1: An artificial neuron. The bias term, b, and input signals, x1, x2, ..., xk, are scaled bythe synaptic weights, w1, w2, ..., wk, and then summed into v. The output, y, from the neuron isobtained by passing v through the activation function σ.
n n
n n
2 1
34
�
PPPPq
SSSSSSw
����1
�����:
���
����
-
������
-y1
I2
I1
................................................
............................................................................................................
.............U
Figure B.2: An RNN with four neurons, one of which has a self-coupling (neuron 2). The networkhas two external input signals, I1, I2, and one output signal (the output from neuron 1).
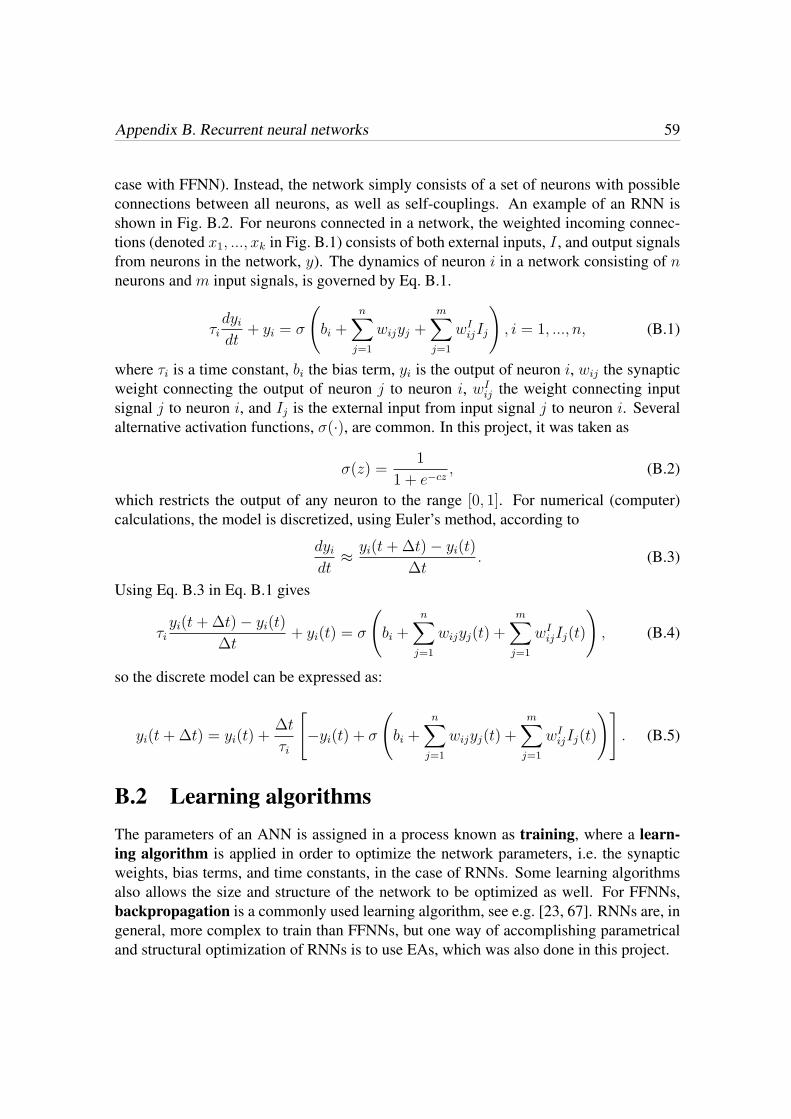
Appendix B. Recurrent neural networks 59
case with FFNN). Instead, the network simply consists of a set of neurons with possibleconnections between all neurons, as well as self-couplings. An example of an RNN isshown in Fig. B.2. For neurons connected in a network, the weighted incoming connec-tions (denoted x1, ..., xk in Fig. B.1) consists of both external inputs, I , and output signalsfrom neurons in the network, y). The dynamics of neuron i in a network consisting of nneurons and m input signals, is governed by Eq. B.1.
τidyi
dt+ yi = σ
(bi +
n∑j=1
wijyj +m∑
j=1
wIijIj
), i = 1, ..., n, (B.1)
where τi is a time constant, bi the bias term, yi is the output of neuron i, wij the synapticweight connecting the output of neuron j to neuron i, wI
ij the weight connecting inputsignal j to neuron i, and Ij is the external input from input signal j to neuron i. Severalalternative activation functions, σ(·), are common. In this project, it was taken as
σ(z) =1
1 + e−cz, (B.2)
which restricts the output of any neuron to the range [0, 1]. For numerical (computer)calculations, the model is discretized, using Euler’s method, according to
dyi
dt≈ yi(t+ ∆t)− yi(t)
∆t. (B.3)
Using Eq. B.3 in Eq. B.1 gives
τiyi(t+ ∆t)− yi(t)
∆t+ yi(t) = σ
(bi +
n∑j=1
wijyj(t) +m∑
j=1
wIijIj(t)
), (B.4)
so the discrete model can be expressed as:
yi(t+ ∆t) = yi(t) +∆t
τi
[−yi(t) + σ
(bi +
n∑j=1
wijyj(t) +m∑
j=1
wIijIj(t)
)]. (B.5)
B.2 Learning algorithmsThe parameters of an ANN is assigned in a process known as training, where a learn-ing algorithm is applied in order to optimize the network parameters, i.e. the synapticweights, bias terms, and time constants, in the case of RNNs. Some learning algorithmsalso allows the size and structure of the network to be optimized as well. For FFNNs,backpropagation is a commonly used learning algorithm, see e.g. [23, 67]. RNNs are, ingeneral, more complex to train than FFNNs, but one way of accomplishing parametricaland structural optimization of RNNs is to use EAs, which was also done in this project.