Embed Size (px)
Citation preview
MODELING FOR DECISION MAKING UNDER UNCERTAINTY
IN ENERGY AND U.S. FOREIGN POLICY
A DISSERTATION
SUBMITTED TO THE DEPARTMENT OF MANAGEMENT
SCIENCE AND ENGINEERING
AND THE COMMITTEE ON GRADUATE STUDIES
OF STANFORD UNIVERSITY
IN PARTIAL FULFILLMENT OF THE REQUIREMENTS
FOR THE DEGREE OF
DOCTOR OF PHILOSOPHY
Lauren C. Culver
August 2017

http://creativecommons.org/licenses/by-nc/3.0/us/
This dissertation is online at: http://purl.stanford.edu/jb634vj5353
© 2017 by Lauren Claire Culver. All Rights Reserved.
Re-distributed by Stanford University under license with the author.
This work is licensed under a Creative Commons Attribution-Noncommercial 3.0 United States License.
ii

I certify that I have read this dissertation and that, in my opinion, it is fully adequatein scope and quality as a dissertation for the degree of Doctor of Philosophy.
John Weyant, Primary Adviser
I certify that I have read this dissertation and that, in my opinion, it is fully adequatein scope and quality as a dissertation for the degree of Doctor of Philosophy.
Coit Blacker
I certify that I have read this dissertation and that, in my opinion, it is fully adequatein scope and quality as a dissertation for the degree of Doctor of Philosophy.
Mark Zoback
Approved for the Stanford University Committee on Graduate Studies.
Patricia J. Gumport, Vice Provost for Graduate Education
This signature page was generated electronically upon submission of this dissertation in electronic format. An original signed hard copy of the signature page is on file inUniversity Archives.
iii
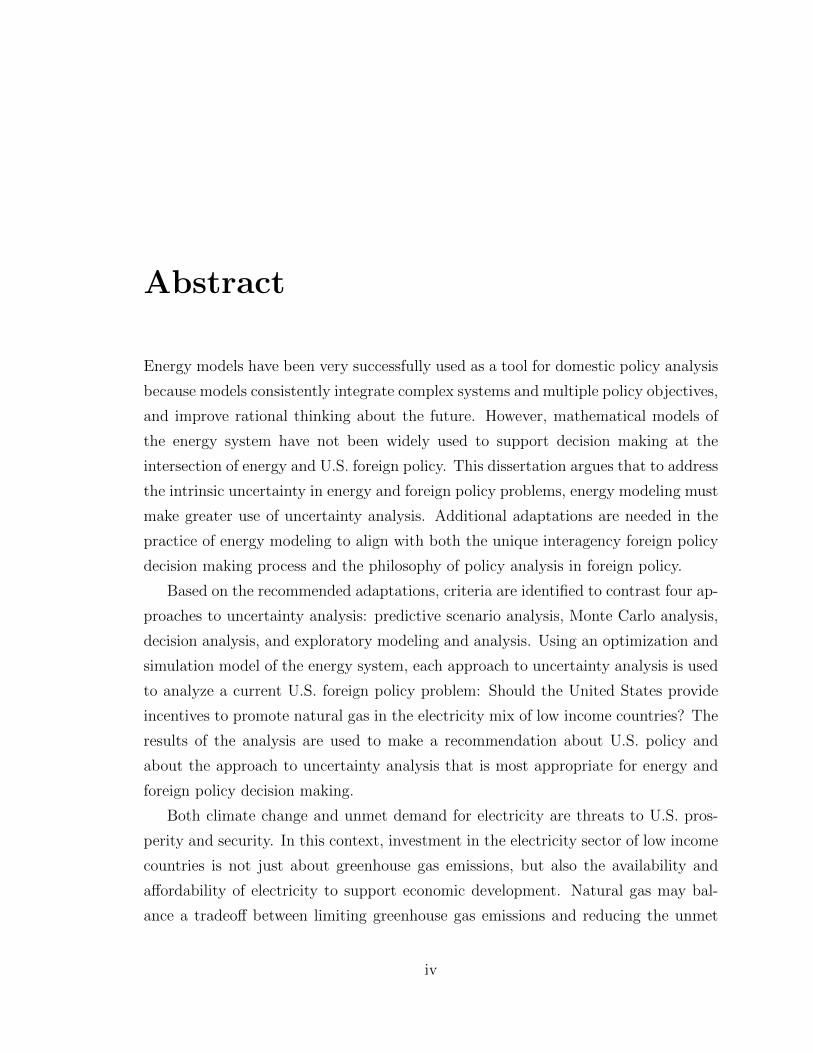
Abstract
Energy models have been very successfully used as a tool for domestic policy analysis
because models consistently integrate complex systems and multiple policy objectives,
and improve rational thinking about the future. However, mathematical models of
the energy system have not been widely used to support decision making at the
intersection of energy and U.S. foreign policy. This dissertation argues that to address
the intrinsic uncertainty in energy and foreign policy problems, energy modeling must
make greater use of uncertainty analysis. Additional adaptations are needed in the
practice of energy modeling to align with both the unique interagency foreign policy
decision making process and the philosophy of policy analysis in foreign policy.
Based on the recommended adaptations, criteria are identified to contrast four ap-
proaches to uncertainty analysis: predictive scenario analysis, Monte Carlo analysis,
decision analysis, and exploratory modeling and analysis. Using an optimization and
simulation model of the energy system, each approach to uncertainty analysis is used
to analyze a current U.S. foreign policy problem: Should the United States provide
incentives to promote natural gas in the electricity mix of low income countries? The
results of the analysis are used to make a recommendation about U.S. policy and
about the approach to uncertainty analysis that is most appropriate for energy and
foreign policy decision making.
Both climate change and unmet demand for electricity are threats to U.S. pros-
perity and security. In this context, investment in the electricity sector of low income
countries is not just about greenhouse gas emissions, but also the availability and
affordability of electricity to support economic development. Natural gas may bal-
ance a tradeoff between limiting greenhouse gas emissions and reducing the unmet
iv

demand for electricity. However, the net benefits of a policy to promote natural gas
depends on changing markets, technological developments, and uncertain implemen-
tation by low income countries. Modeling for decision making under uncertainty can
guide policy action now while these uncertainties remain unresolved.
The results of the modeling show policies that increase the share of natural gas
in the electricity mix provide net benefits, but not unconditionally. Whether a policy
delivers net benefits depends on features of the energy system, the demand for elec-
tricity, and the capacity of low income countries to deliver investment in generating
and distribution infrastructure. Concessional finance for natural gas power plants is
most successful when there is an end to the practice of oil indexation in gas contracts
and better information about the rate of fugitive methane emissions.
Based on the approaches to uncertainty analysis contrasted, a combination of de-
cision analysis and exploratory modeling and analysis are found to have the most
potential to be a tool for energy and foreign policy analysis. Used together the meth-
ods are greater than the sum of their parts. When combined these approaches have
the most suitable implications for encoding uncertain variables, conducting broad pol-
icy search, quickly providing updated results, producing results that can be correctly
interpreted by decision makers to provide direction and intuition, and directing the
collection and integration of new information. In combination these approaches shift
the burden of reasoning correctly about the implications of policies in a probabilistic
world away from the decision maker, while providing insights into the energy system
that a decision maker can integrate with other types of policy judgments.
v

Acknowledgments
Many people have contributed to my success at Stanford. Some have directly influ-
enced my intellectual path, while others have supported my well-being. I am deeply
grateful for the sacrifices people have made for me and the investments they have
made in me. There are several people I especially would like to thank.
I am very grateful for the guidance and support of my primary advisor, Professor
John Weyant. He has been a thoughtful sounding board for my vision and an invalu-
able guide to the work that has come before me. I am very thankful for the direction
from my other committee members. Professor Chip Blacker has given me new and
rigorous insight into foreign policy making, bringing greater meaning to my previous
experience in government and to this work. Professor Mark Zoback has given me
valuable perspective on the challenges and opportunities facing natural gas. I would
like to thank Hill Huntington and Professor Michael Wara for their feedback leading
up to and after my defense.
I would also like to thank other Stanford faculty and staff that have played an
important role in my success. Professor Richard Sears and Professor Jim Sweeney
have made me more thoughtful about tradeoffs in the energy system and the role
of policy. Lori Cottle has made labyrinthine administrative processes painless. The
staff at the Hume Center for Speaking and Writing have been tremendously helpful
through their dissertation boot camps and workshops. A special thanks to Helen Lie
and Cassie Wright for their advice and encouragement.
I would like to thank my many colleagues for their friendship and for creating
an environment that held me up while pushing me forward. First, the members
of the Decision Analysis and Risk Analysis group and others in the Department
vi

who have given their time and feedback: Heather Altman, Noah Burbank, Danielle
Davidian, Onder Guven, Greg Heon, Alejandro Martinez, Philip Keller, and Matt
Smith. Second, my former colleagues in the Bureau of Energy Resources who inspired
and sharpened many of my ideas: Annie Medaglia, Margo Pogorzelski, Clare Conrad,
Robin Dunnigan, Marti Flacks, Andrea Richter, Anna Shpitsberg, Molly Ward, and
Natasha Vidangos. And finally, it has been an honor and a pleasure to work with the
members of the Energy Policy and Strategy group: Melanie Craxton, Delavane Diaz,
Karim Farhat, Benjamin Leibowicz, Patricia Levi, James Merrick, Maria Roumpani,
and John Taggart. They have unrivaled expertise and enthusiasm for addressing the
difficult energy challenges facing our world.
Funding for my work has been generously provided by the Benchmark Fellowship
through the Stanford Graduate Fellowship program.
Finally, I would like to thank my loving family. My aunt and uncle, Renee and
Van Culver, have given generously of their lives. My time with them grounded and
refreshed me. My always supportive parents, Hunt and Michelle Culver, have achieved
new heights of sacrifice for me as I undertook this great challenge. Thank you for
blessing my life. SDG.
vii
Contents
Abstract iv
Acknowledgments vi
1 Introduction 1
1.1 Decision making at the intersection of energy and foreign policy . . . 1
1.2 Evaluating natural gas to balance climate and development goals . . . 6
1.2.1 Why this example . . . . . . . . . . . . . . . . . . . . . . . . . 9
1.2.2 Scope of example . . . . . . . . . . . . . . . . . . . . . . . . . 10
1.3 Research questions . . . . . . . . . . . . . . . . . . . . . . . . . . . . 13
1.4 Dissertation outline . . . . . . . . . . . . . . . . . . . . . . . . . . . . 14
2 Modeling for Foreign Policy Decisions 16
2.1 Exposing a methodological gap . . . . . . . . . . . . . . . . . . . . . 19
2.1.1 Foreign policy decision making . . . . . . . . . . . . . . . . . . 20
2.1.2 Improving foreign policy decisions . . . . . . . . . . . . . . . . 25
2.2 Extending an existing idea into a new area of study . . . . . . . . . . 31
2.2.1 Modeling complexity . . . . . . . . . . . . . . . . . . . . . . . 31
2.2.2 Modeling multiple objectives . . . . . . . . . . . . . . . . . . . 34
2.2.3 Modeling uncertainty . . . . . . . . . . . . . . . . . . . . . . . 35
2.2.4 Models in the domestic energy policy process . . . . . . . . . . 37
2.3 Operationalizing energy models for foreign policy . . . . . . . . . . . 38
2.3.1 Dual nature of the policy problem . . . . . . . . . . . . . . . . 39
2.3.2 Structural changes to accommodate the dual nature . . . . . . 44
viii

2.3.3 Philosophical changes to fit the dual nature . . . . . . . . . . 45
2.4 Conclusion . . . . . . . . . . . . . . . . . . . . . . . . . . . . . . . . . 48
3 Energy Poverty and Climate Change 50
3.1 Conflict between national interests . . . . . . . . . . . . . . . . . . . 56
3.1.1 How should we measure energy poverty? . . . . . . . . . . . . 58
3.1.2 Is it possible to leapfrog the grid? . . . . . . . . . . . . . . . . 60
3.1.3 Is there an ambition gap? . . . . . . . . . . . . . . . . . . . . 61
3.1.4 Is there a conflict between reducing energy poverty and
mitigating climate change? . . . . . . . . . . . . . . . . . . . . 63
3.2 Risks and opportunities for natural gas . . . . . . . . . . . . . . . . . 65
3.2.1 Six attributes of energy supply to reduce energy poverty . . . 66
3.2.2 Natural gas and energy poverty . . . . . . . . . . . . . . . . . 68
3.3 Conclusion . . . . . . . . . . . . . . . . . . . . . . . . . . . . . . . . . 80
4 Specifying the Policy Problem 81
4.1 Decision frame . . . . . . . . . . . . . . . . . . . . . . . . . . . . . . 82
4.2 System boundaries . . . . . . . . . . . . . . . . . . . . . . . . . . . . 86
4.3 Decision basis . . . . . . . . . . . . . . . . . . . . . . . . . . . . . . . 91
4.3.1 Uncertain information . . . . . . . . . . . . . . . . . . . . . . 91
4.3.2 Policy alternatives . . . . . . . . . . . . . . . . . . . . . . . . 96
4.3.3 Preferences . . . . . . . . . . . . . . . . . . . . . . . . . . . . 98
4.4 Conclusion . . . . . . . . . . . . . . . . . . . . . . . . . . . . . . . . . 105
5 Models and Uncertainty Analysis 106
5.1 Modeling approaches for decision making under uncertainty . . . . . 107
5.1.1 Taxonomies of uncertainty . . . . . . . . . . . . . . . . . . . . 108
5.1.2 Uncertainty analysis . . . . . . . . . . . . . . . . . . . . . . . 109
5.2 Energy system models . . . . . . . . . . . . . . . . . . . . . . . . . . 113
5.2.1 Nomenclature . . . . . . . . . . . . . . . . . . . . . . . . . . . 115
5.2.2 Optimization . . . . . . . . . . . . . . . . . . . . . . . . . . . 117
5.2.3 Simulation . . . . . . . . . . . . . . . . . . . . . . . . . . . . . 123
ix
5.3 Uncertainty analysis: The role of natural gas . . . . . . . . . . . . . . 125
5.3.1 Predictive scenario analysis . . . . . . . . . . . . . . . . . . . 127
5.3.2 Monte Carlo analysis . . . . . . . . . . . . . . . . . . . . . . . 136
5.3.3 Decision analysis . . . . . . . . . . . . . . . . . . . . . . . . . 148
5.3.4 Exploratory modeling and analysis . . . . . . . . . . . . . . . 157
6 Conclusions 169
6.1 Natural gas in U.S. foreign policy . . . . . . . . . . . . . . . . . . . . 169
6.1.1 Policy recommendation . . . . . . . . . . . . . . . . . . . . . . 170
6.1.2 Policy insights . . . . . . . . . . . . . . . . . . . . . . . . . . . 172
6.2 Uncertainty analysis for energy and foreign policy decision support . 181
6.2.1 Articulating a philosophy and aligning the process . . . . . . . 181
6.2.2 Structure . . . . . . . . . . . . . . . . . . . . . . . . . . . . . 184
6.2.3 Practical considerations . . . . . . . . . . . . . . . . . . . . . 194
6.3 Connection to energy security . . . . . . . . . . . . . . . . . . . . . . 197
6.4 Conclusions and future research . . . . . . . . . . . . . . . . . . . . . 200
6.4.1 Summary of findings . . . . . . . . . . . . . . . . . . . . . . . 200
6.4.2 What is the ultimate application or use of the research? . . . . 201
6.5 Future research directions . . . . . . . . . . . . . . . . . . . . . . . . 202
A Input Assumptions 204
B INTrO Documentation 218
C NEO Documentation 226
Bibliography 238
x

List of Tables
3.1 Energy poverty demographics . . . . . . . . . . . . . . . . . . . . . . 53
4.1 Energy related demographics of low income countries . . . . . . . . . 90
4.2 Indicators of U.S. interests in low income countries . . . . . . . . . . 92
4.3 Uncertain variables for uncertainty analysis . . . . . . . . . . . . . . . 93
4.4 Policy alternatives and costs . . . . . . . . . . . . . . . . . . . . . . . 99
5.1 Pairing of models and approaches to uncertainty analysis . . . . . . . 107
5.2 Sixteen countries evaluated in the energy models . . . . . . . . . . . . 114
5.3 Scenario analysis: Uncertain variable values . . . . . . . . . . . . . . 128
5.4 Scenario analysis: Policies which maximize net benefits . . . . . . . . 131
5.5 Scenario analysis: Policies with net benefits . . . . . . . . . . . . . . 132
5.6 Monte Carlo analysis: Uncertain variable values . . . . . . . . . . . . 137
5.7 Monte Carlo analysis: Policies with net benefits . . . . . . . . . . . . 146
5.8 Decision analysis: Uncertain variable values . . . . . . . . . . . . . . 150
5.9 Decision analysis: Policies with net benefits . . . . . . . . . . . . . . 150
5.10 Decision analysis: Value of information . . . . . . . . . . . . . . . . . 152
5.11 Decision analysis: Circumstances in which policies have net benefits . 153
5.12 Exploratory analysis: Uncertain variable values . . . . . . . . . . . . 158
5.13 Exploratory analysis: Circumstances in which policies have net benefits 168
6.1 Model run time for different approaches to uncertainty analysis . . . 189
A.1 Constants . . . . . . . . . . . . . . . . . . . . . . . . . . . . . . . . . 204
A.2 Country parameters (Climatescope, 2016; World Bank) . . . . . . . . 205
xi

A.3 Fuel parameters (EIA AEO, 2016) . . . . . . . . . . . . . . . . . . . . 206
A.4 Fuel parameters for discrete choice . . . . . . . . . . . . . . . . . . . 207
A.5 EIA IEO 2016 Natural Gas Production (Tcf) . . . . . . . . . . . . . . 208
A.6 EIA IEO 2016 Natural Gas Consumption (Tcf) . . . . . . . . . . . . 209
A.7 Projected Wellhead Prices (2016 USD/Mcf) . . . . . . . . . . . . . . 210
A.8 Projected Citygate Prices (2016 USD/Mcf) . . . . . . . . . . . . . . . 211
A.9 Pipeline capacity (Mcf) . . . . . . . . . . . . . . . . . . . . . . . . . . 212
A.10 Pipeline transportation cost (2016 USD/Mcf) . . . . . . . . . . . . . 213
A.11 LNG transportation cost (2016 USD/Mcf) . . . . . . . . . . . . . . . 214
A.12 Natural gas value chain costs and capacities . . . . . . . . . . . . . . 215
A.13 Elasticity of Supply (2016 USD/Mcf) . . . . . . . . . . . . . . . . . . 216
A.14 Elasticity of Demand (2016 USD/Mcf) . . . . . . . . . . . . . . . . . 217
xii

List of Figures
2.1 Tradeoffs between policy judgments . . . . . . . . . . . . . . . . . . . 28
2.2 Framework to relate policy analysis styles and activities . . . . . . . . 46
3.1 Meaningful energy consumption . . . . . . . . . . . . . . . . . . . . . 60
3.2 Natural gas production in 2015 . . . . . . . . . . . . . . . . . . . . . 70
4.1 Schematic of energy system represented in models . . . . . . . . . . . 87
4.2 Influence of U.S. policy on energy system . . . . . . . . . . . . . . . . 88
4.3 Decision diagram . . . . . . . . . . . . . . . . . . . . . . . . . . . . . 104
5.1 Uncertainty analysis in energy models . . . . . . . . . . . . . . . . . . 110
5.2 Load duration curve . . . . . . . . . . . . . . . . . . . . . . . . . . . 117
5.3 Regions of natural gas trade in the optimization model . . . . . . . . 118
5.4 Mathematical representations of uncertainty . . . . . . . . . . . . . . 126
5.5 Scenario analysis: Tradeoff between unmet demand and emissions . . 130
5.6 Scenario analysis: Electricity generation . . . . . . . . . . . . . . . . 134
5.7 Monte Carlo analysis: Tradeoff between unmet demand and emissions 138
5.8 Monte Carlo analysis: The tradeoff between unmet demand and emis-
sions differs by country and policy . . . . . . . . . . . . . . . . . . . . 139
5.9 Monte Carlo analysis: Electricity generation . . . . . . . . . . . . . . 141
5.10 Monte Carlo analysis: Distribution of unmet demand for electricity
and emissions . . . . . . . . . . . . . . . . . . . . . . . . . . . . . . . 143
5.11 Monte Carlo analysis: Distribution of costs for each policy . . . . . . 145
5.12 Decision analysis: Decision tree . . . . . . . . . . . . . . . . . . . . . 151
xiii

5.13 Decision analysis: Electricity generation . . . . . . . . . . . . . . . . 155
5.14 Exploratory analysis: Tradeoff between unmet demand and emissions 160
5.15 Exploratory analysis: Policies with net benefits . . . . . . . . . . . . 161
5.16 Exploratory analysis: Patient rule induction . . . . . . . . . . . . . . 162
5.17 Exploratory analysis: Results of patient rule induction method . . . . 163
5.18 Exploratory analysis: Results of classification . . . . . . . . . . . . . 164
xiv

Chapter 1
Introduction
This dissertation is about reimagining energy models to support decision making at
the intersection of energy and foreign policy. Within this context, the work will
explore the role of natural gas in the electricity sector of low income countries as a
means to balance a tension between climate change mitigation and energy needed for
economic development. The purpose of this introduction is to present the motivation
for the research project and layout the approach. In so doing, this chapter will also
introduce and scope a case study that will be used throughout the dissertation.
1.1 Decision making at the intersection of energy
and foreign policy
Energy is a common part of U.S foreign policy. Recent well-known examples include
sanctions discouraging imports of Iranian oil and sanctions affecting the Russian
oil and gas industry. Developing robust energy-foreign policy requires mastery of
geopolitics, politics, and highly technical workings of the energy sector, including the
economics, finance, regulation, and infrastructure. Foreign policy should be made
based on U.S. interests, but in a complex, uncertain world, especially when there are
competing objectives, it is not always clear which policies maximize those interests.
1
CHAPTER 1. INTRODUCTION 2
Even though the energy system is complex, it can be thoughtfully considered using
energy models. Energy models are mathematical descriptions of an energy system
including the infrastructure, environmental impacts, and the surrounding economic
landscape. Many foreign policy decision makers have not encountered energy models
in their careers, and those that have may have difficulty obtaining new insight by
looking at the packaged results of analysis. Many decision makers find model results
to be too rigid to be useful in real policy decisions. If the results confirm their existing
beliefs, they are not likely to pursue additional analysis. If the results conflict with
their ideas, they are likely to fault the model as overly simplified, based on bad
assumptions, or just wrong.
The foreign policy decision making literature, explored in Chapter 2, explains
how decisions are made and the departures from rational decision making. However,
scholars have not taken the next step to recommend types of policy analysis to com-
pensate for these distortions in decision making. While many analytical methods
exist, energy models have not yet been usefully applied. Energy models are valuable
tools for managing the complexity and uncertainty in global markets, infrastructure,
technology, and social and political systems. No model is perfect, but the question
should be whether using an energy model is better than the alternatives. Models are
more transparent and more rigorous the mental models decision makers’rely on.
Without a model to logically organize all of the available information, it is near
impossible to judge the consequences of different policies in the real world. Decision
makers, therefore, rely on analogy and lived experience to guide policy judgments.
Using analogy to draw parallels between past events and the current situation is
precarious in foreign policy and in energy. Only in very rare circumstances is the
past “like” the future to a degree that warrants strong conviction that a particular
policy will or will not work. Every situation has unique elements - the players,
the landscape, the threats, the opportunities - that should be considered uniquely.
If not reflecting on the “lessons” of history, policy makers often rely on their own
personal experiences. The advantage of using these honed instincts is the human
mind can integrate disparate information that is both quantitative and qualitative.
CHAPTER 1. INTRODUCTION 3
The disadvantage is that humans are prone to a variety of cognitive biases, especially
when it is a complex issue and when it involves uncertainty about the future.
When foreign policy decisions interact with the global energy system, the land-
scape is too complex not to use energy models to create sense. Models force specificity
that distinguishes a situation from past situations. They integrate the knowledge of
the working level with the political expertise at a senior level. Models calculate the
evolution of a complex system without computational error, and when models are
used to analyze different possible futures they improve decision making.
Unfortunately, the results of a mathematical model do not easily integrate with
qualitative information or even quantitative knowledge in a tangent domain. A prac-
ticed analyst that has spent time building the model and exploring the results will
develop insight into the system, but simply communicating the results to a decision
maker does not transfer the intuition. As the non-model decision factors are in the
heads of the decision makers, the decision maker is the one that needs to to inter-
nalize the results as if they are lived experience. If the model results can be used
to provide the decision maker new mental models, the decision maker can do the
work of bringing together the larger context. As policy makers have less technical
expertise and less available time to understand the model, it is important to consider
the digestibility of model results.
While energy models could be very useful in foreign policy making, energy models
have not been designed with the foreign policy decision making context in mind.
Energy modeling must be reoriented to support the foreign policy context. Necessary
adaptations include alignment with the unique interagency decision making process,
explicit consideration of uncertainty, and a philosophy of interpreting model results
not as fact but as direction and intuition.
Adapting the modeling process to suit the National Security Council decision
making process requires aligning the modeling cycle with the policy making cycle
and making choices throughout the modeling process that take advantage of the best
of an interagency process without becoming an unwitting extension of the worst.
Explicit consideration of uncertainty can be done through the practice of uncer-
tainty analysis. Considering uncertainty is important because a policy may provide
CHAPTER 1. INTRODUCTION 4
benefits in one future, but not in another future. One goal of of this work is to judge
what may be sacrificed in the level of system detail in the model and the precision of
representing preferences to accommodate uncertainty analysis that best aligns with
the philosophy of model interpretation and the adaptations to the decision environ-
ment. A variety of modeling and decision-making under uncertainty methods exist
and are useful for different problems. Each approach to uncertainty analysis has
strengths and limitations when it comes to supporting the requirements for foreign
policy.
Many approaches to uncertainty analysis benefit from a less detailed representa-
tion of the energy system. Only when exceptional model results are attributed to
the subsystem does it warrant more thorough representation. Separate from policy
design, the results of models used by subject matter experts can also be used to
identify subsystems where detail may have important consequences that might be
overlooked in a simplified representation. Uncertainty analysis itself can be used to
compensate for simplification. Rather than modeling a subsystem in great detail, the
distribution of possible results from that subsystem can be used directly in the energy
model. For example, in the policy problem considered, the net benefits of different
policies depend on the amount of electric generating capacity that is installed each
year. Rather than trying to model all of the mechanisms by which planned capacity
fails to materialize, a distribution on what is achieved can be used as the input.
An important difference between the approaches to uncertainty analysis is how
the burden of reasoning correctly about probability is allocated between the analyst
and the decision maker. Some methods require uncertainties are encoded - mathe-
matically represented - probabilistically, which introduces additional computations.
These additional steps take time, and are not easy to do. However, when these steps
are avoided, by choosing approaches to uncertainty analysis that do not require them,
it only obscures the probabilistic nature of the world. Though there are costs to the
analyst and the decision maker to encode these probabilities, the benefits accrue to
the decision maker during interpretation.
There are many different types of energy models that are used by different stake-
holders for different purposes. The philosophy behind the knowledge produced by
CHAPTER 1. INTRODUCTION 5
the models differs accordingly. For example, industry uses energy models to support
investment decisions, regulators use energy models to design regulation, and scientists
use energy models to explore the consequences of our expanding knowledge of climate
science. Energy models have been very useful for domestic policy analysis. However,
the substance and process of domestic policy making and, therefore, domestic policy
analysis is different from foreign policy analysis. For domestic policy analysis, en-
ergy models have been used as tools to “research and analyze” to produce objective
and scientific knowledge. Successful tools in foreign policy analysis, in contrast, “de-
sign and recommend” or “advise strategically ”, resulting in subjective or negotiated
knowledge.
The first aim of this research is to describe the adaptations to energy models that
are needed to support energy and foreign policy problems and the unique context of
foreign policy decision making. The primary audience of this work, therefore, is the
modeling community. Based on the adaptations to energy modeling recommended,
criteria are developed to evaluate the suitability of the four different approaches to
uncertainty analysis for energy and foreign policy. Four approaches to uncertainty
analysis are contrasted in Chapter 5 by applying the methods to a particular policy
problem, described in Chapters 3 and 4, and comparing the substance and process
of the results. The four approaches to uncertainty analysis include predictive sce-
nario analysis, Monte Carlo analysis, decision analysis, and exploratory modeling
and analysis. There are other approaches discussed, but not pursued because of their
misalignment with the foreign policy making context.
The conclusions drawn about the approaches to uncertainty analysis are not judg-
ments of the validity or usefulness of the methods in general. Methods that are not
evaluated or perform poorly in the energy and foreign policy decision making context
may be valuable in other contexts. This work should serve as a roadmap to effec-
tively bridge into a new policy domain. In practice every policy problem will have
its own unique challenges to overcome, so this work lays out generic considerations
that should be incorporated. This work may also help policy makers become better
directors and consumers of energy modeling.
CHAPTER 1. INTRODUCTION 6
The primary contribution of this work is to make a recommendation about the
most helpful approach to uncertainty analysis based on a comparison of techniques
applied to the same policy problem and consideration of the strengths and limita-
tions of the technique within the interagency policy making process. To contrast the
approaches to uncertainty analysis concretely, a single policy problem, described in
the next section, is used as an example. The result is a numerical demonstration of
different approaches. Among the four approaches to uncertainty analysis contrasted,
a combination of decision analysis and exploratory modeling and analysis most effec-
tively balances insight and effort according to the criteria developed.
Decision analysis satisfies the need for clear direction based on a rational analysis
of the consequences of particular actions. Decision analysis should be coupled with
exploratory modeling and analysis to build intuition about what circumstances allow
a policy to have net benefits and to guard against artifacts of modeling choices. The
same, simple, energy model underpins both methods. Used together these techniques
lessens the burden of probability by reducing the number of uncertainties to encode,
and leaves it with the analyst rather than transferring it to the decision maker.
1.2 Evaluating natural gas to balance climate and
development goals
The second aim of this research is to weigh in on an unresolved U.S. energy and
foreign policy matter. The economic development and political stability of low income
countries contributes to U.S. prosperity and security. It is, therefore, part of U.S.
foreign policy to provide foreign aid and diplomatic and military support to foreign
countries. As the threats to security and prosperity caused by climate change become
more salient in the minds of global decision makers, a previously mundane and esoteric
matter is moving into the field of view: the electricity mix of other countries. While
policy makers are thinking through the future consequences of global climate change
like increases in migration, violent conflict, and humanitarian disasters, there is a
recognition that underlying these stresses to international stability is the persistence

CHAPTER 1. INTRODUCTION 7
of global poverty. And while the causal relationship between economic growth and
energy is undetermined, it is apparent that socioeconomic development cannot happen
without adequate supply of energy to households and the economy at large. In this
context, investment in the electricity sector of low income countries is not just about
greenhouse gas emissions, but also the availability and affordability of electricity to
support economic development.
The types of generators (coal power plants, diesel power plants, gas power plants,
solar photovoltaics, wind turbines, etc.) in an electricity system have different trade-
offs in terms of their emissions intensity and the affordability and availability of power
generation. While natural gas emits less carbon dioxide during combustion than coal,
diesel, or biomass, it is still a fossil fuel. Historically, natural gas for power genera-
tion has been limited to a few geographic areas and predominately wealthy countries.
Recent changes in natural gas technologies upstream, like hydraulic fracturing and
horizontal drilling, and midstream, like liquified natural gas (LNG) floating regasifi-
cation and storage units (FSRUs), coupled with changes in global gas markets suggest
a new opportunity for gas to become an affordable fuel for all countries.
If low income countries are able to capitalize on low cost natural gas, natural
gas may be a pathway to balance climate change mitigation and poverty reduction.
However, there are many ways a bet on natural gas could go wrong. Renewable energy
costs are declining rapidly, fugitive methane emissions erode the climate benefit of
natural gas, and local capacity to build power plants and increase the electrification
rate all contribute to the viability of natural gas.
Both mitigating climate change and reducing energy poverty are in the interests
of the United States. However, these two interests are not independent. Depending
on the evolution of the uncertain variables above, these two goals may be in conflict
with one another. Policies and investments that attempt to achieve one may be
counterproductive for the other. The tradeoff implied by U.S. foreign policy pursuing
these goals should reflect the U.S. interest, but it is not obvious what the balance
should be, nor how different policy alternatives support the balance. Without rigorous
analysis, U.S. foreign policy will not have the necessary nuance to make the most out
of a low-carbon, fossil fuel.
CHAPTER 1. INTRODUCTION 8
In the absence of a model to develop nuanced natural gas policy, the alternative
is likely to be making policy based on criteria other than U.S. interests. Promoting
natural gas in the poorest countries, countries with natural gas resource, countries
with significant coal use, or populous countries may seem like reasonable criteria, but
these criteria describe the foreign country and do not necessarily align with a rational
calculation of U.S. interests.
Without a concerted evaluation, policy will be driven by ideology that supports or
opposes certain fuels, rather than a calculation of U.S. interest. For example, a global
environmental movement is promoting the idea that fossil fuel resources are best left
in the ground. Analysis to support this idea prioritizes climate outcomes over other
outcomes like development. It is in the U.S. interest, however, to balance these goals
in some way. Similarly, many in the environmental movement are opposed to natural
gas development because of the dangers of fugitive methane emissions. Methane is
a potent greenhouse gas that warrants greater study and abatement. However, oil
and gas operations contribute a small proportion of overall methane emissions. Using
technology that exists today, methane from oil and gas operations can be monitored
and reduced. A rigorous evaluation of competing U.S. interests should be the basis
for U.S. foreign policy, rather than simply eliminating a possible solution because of
its risks.
Because of the complexity of the global energy system, the challenges of thinking
about the tradeoff between two national interests, and the myriad uncertainties, the
United States has not articulated a clear position on natural gas. The ambiguity
delays investments into both natural gas and renewable energy as the private sector
maintains a healthy fear of a policy change that could undermine their investment.
In the void, coal projects are steadily being built. Lack of clarity on the future of
gas, therefore, works against U.S. interests to mitigate climate change and eliminate
energy poverty.
Is it in the national interest of the United States to promote natural gas-
fired power in low income countries to balance the cost of unmet demand
for electricity and the cost of climate change?
CHAPTER 1. INTRODUCTION 9
This is a complicated question. If globally abundant natural gas resources are devel-
oped sustainably at a low enough cost to cause fuel-switching in the power sector that
results in electricity being affordably delivered to the energy poor, then yes. But the
viability of natural gas depends on changing markets, technological developments,
and uncertain implementation by developing countries. Modeling for decision mak-
ing under uncertainty can guide policy action now while these uncertainties remain
unresolved.
This work provides evidence for explicit U.S. support for policies to promote nat-
ural gas in low income countries. The analysis is one of few studies on the role
of natural gas in low income countries, and the first to consider the issue from the
perspective of the interests of the United States. Not only do future emissions and
changes in energy poverty depend on changes in the energy system and the actions
of low income countries, but the best policy to incentivize behavior depends on these
variables.
Concessional finance for natural gas power plants can deliver reductions in green-
house gas emissions and unmet demand for electricity in line with climate and develop-
ment goals. Importantly, natural gas can deliver these benefits in circumstances when
other policies may be ineffective or counterproductive to reducing energy poverty.
The benefits of a policy to increase the share of natural gas in the electricity mix are
not unconditional. Gas-on-gas pricing and a low rate of fugitive methane emissions
are the most important conditions for concessional finance for natural gas to have
net benefits. In order to maximize net benefits, the United States should be willing
to provide concessional finance for natural gas and technical assistance for fugitive
methane emission reductions in some circumstances, and provide concessional finance
for renewable energy or technical assistance for carbon pricing in other circumstances.
1.2.1 Why this example
The policy decision on the role of natural gas was chosen as a case study for several
reasons. First, it has qualities like that of many questions at the intersection of
energy and foreign policy. The stakes are high, and the answer is not obvious. It
CHAPTER 1. INTRODUCTION 10
is a data-poor, complex problem with intertwined geopolitical, political, economic,
financial, and environmental systems. The complexity is exacerbated by unknowns
like the decisions of others, volatility in markets, and technological change. Second,
the policy problem involves the whole of the interagency.
Third, the question has yet to be resolved. The poorly defined policy problem
must be dealt with as it is, rather than as might be convenient. A policy decision
from the past would be difficult to evaluate in an unbiased manner because of the
benefit of hindsight and the greater understanding that comes from thinking about
what happened and what did not happen in the light of what did happen. It is
difficult to think about how much confidence you have in uncertainty analysis when
the conclusion is no longer uncertain.
Fourth, the question captures many dimensions of policy problems at the inter-
section of energy and foreign policy. Some questions have an overwhelming hard
security dimension. When a hard security decision must be made, it dominates any
other consequences that might have been an objective otherwise.
Finally, there is need for a thoughtful evaluation of the climate-development trade-
off implicit in the evolution of a fuel mix. There is very little scholarship on the role
of natural gas in addressing energy poverty. There is none with a consideration of
uncertainty.
1.2.2 Scope of example
Considering the role of natural gas to balance climate and development goals is very
broad. The scope of this work is modest in comparison.
Globally, natural gas is used in many sectors of the economy: process heat, house-
hold heating, cooking, many kinds of transportation, fertilizer and petrochemical
feedstocks, and power generation. In low income countries natural gas could provide
many benefits to industry and households. To understand the role natural gas could
play throughout the economy, each sector needs to be modeled. However, these sec-
tors are very different. In each of these sectors natural gas competes with different
CHAPTER 1. INTRODUCTION 11
fuels, adds value to the economy differently, and has different impacts on the environ-
ment. Because of the network effects in a natural gas system, it is important to think
about how use in one sector affects the costs and benefits of also using it in another
sector. An energy model that seeks to represent each sector in sufficient detail in
an integrated way is unwieldy, and is likely to obscure insight rather than provide
it. A proper analysis would use a different model to understand the effect of policy
on investment in each sector, and then use yet another model to reason about the
interactions. In this research, only the electricity sector is addressed; it is a starting
point to the broader analysis.
Looking at the electricity sector alone is valuable because in the electricity sector
natural gas faces the most competition and has the most impacts on the environment.
Natural gas used in the electricity sector adds the least value to the economy relative
to the other sectors. Therefore, if natural gas were to be viable in the electricity
sector it would also be viable in the other sectors. However, if natural gas were viable
as a feedstock or for transportation, it would not necessarily be viable for power
generation.
The scope of the works is also constrained by a simple representation of the elec-
tricity sector. The work does not consider the strategic role that gas may play in
the electricity system to balance net load resulting from variable renewable supply
and variable load. There is no carbon capture and storage, no energy storage, and
no explicit representation of transmission and distribution. While it goes without
saying that energy efficiency should also be a priority, it is not explicitly represented.
Low demand is framed negatively in this work as inadequate electricity for realizing
development goals, but it could also be interpreted within this simplified model as
positive improvements in energy efficiency.
The focus of the research is natural gas, so conclusions about other electricity
supply technologies out of context would not be well-founded. This author supports
as much dispatchable zero carbon sources of electricity as are feasible and socially de-
sirable recognizing that on the dimensions of reducing emissions and unmet demand
these technologies are a win-win. However, no analysis was done to understand the
country specific availability of these resources or the important social considerations
CHAPTER 1. INTRODUCTION 12
that might affect development. Energy system revolutions in manufacturing tech-
nologies, electric vehicles, small modular nuclear reactors and the like are not taken
into consideration.
The conclusions of this work apply to low income countries. An analysis of the role
of natural gas as a “bridge ”to a decarbonized energy system in developed countries
should look much different. Developed countries are facing a fundamentally different
situation. They have adequate generating capacity, flat electricity growth, and aging
infrastructure that needs replacing. This is a stark contrast to electricity systems in
the developing world where there are frequent power shortages, fast growing demand,
and large populations not connected to the central grid network.
This research focuses on a normative question of whether the United States should
provide incentives to promote natural gas in the electricity mix, but does not consider
the challenges of implementing a policy. Understanding the role of natural gas in
low income countries is a big question. There are many obstacles to responsible
governance of natural gas resources, creating financially viable private stakeholders
along the value chain, expanding electrification, and helping communities absorb
electricity and transform it into growth. This analysis focuses on whether support for
natural gas should be a part of U.S. policy and the circumstances that drive whether
such policies deliver net benefits.
There are assumptions about implementation that need to be considered in more
detailed analysis of a different nature. For example, after the U.S. decides on a policy,
it falls to individual agencies to develop analyses and procedures to implement the
strategy. The intent may not be fully realized. Additionally, the economics in the
energy models do not explicitly represent interactions with financial markets. It is
assumed that economic projects are able to obtain financing. Finally, it is assumed
that the energy delivered results in development, while in reality this can never be
taken for granted. These issues will not be taken up in this research, but are extremely
important areas for additional research.
CHAPTER 1. INTRODUCTION 13
The analysis is purely from the point of view a U.S. foreign policy decision maker.
If the role for natural gas were to be evaluated from another perspective, the un-
derlying energy models might need modifications, and the representation of policy
alternatives, preferences, and beliefs about the future would be very different.
1.3 Research questions
Given the background described above, this dissertation aims to answer the following
four research questions:
1. How can energy system modeling be adapted to support policy making at the inter-
section of energy and U.S. foreign policy?
2. How do approaches to decision-making under uncertainty compare in their alignment
with the needs of the U.S. foreign policy decision-making process?
3. Is it in the national interests of the United States to provide incentives to affect the
role natural gas plays in the electricity system of low income countries?
4. Which characteristics of the system predict whether investment in expanded use of
natural gas will be in the interests of the United States?
To answer these questions, two energy models are built to evaluate the energy system
in a low income country. Using these models four different approaches to uncertainty
analysis are used to assess the implications of U.S. policy options. Using the insight
provided by each of the methods, a policy recommendation on the U.S. position on
natural gas is made. The results of these analyses are also the basis for contrasting
the approaches to uncertainty analysis to judge their appropriateness for supporting
foreign policy decision-making. Sixteen countries are modeled, but only the results
from Guatemala, Ghana, Mozambique, and Pakistan are presented.
CHAPTER 1. INTRODUCTION 14
1.4 Dissertation outline
Having laid out the context for this work, the remainder of the dissertation is orga-
nized as follows.
Chapter 2 reviews the literature on foreign policy decision making, highlighting
the lack of policy analysis tools at the nexus of energy and foreign policy. It then
reviews the use of models for domestic energy policy analysis, and concludes that for
energy models to successfully support foreign policy three things are needed: a clear
articulation of the philosophy for interpreting energy models, intentional alignment
with the unique context of the interagency foreign policy making process, and a
new balance between the complexity of models and the sophistication of uncertainty
analysis.
Chapter 3 introduces the tension between reducing greenhouse gas emissions and
increasing the supply of electricity needed to fuel economic development in low in-
come countries. It concludes that ongoing debates about the appropriate investment
portfolio in low income countries is driven by differences in beliefs about uncertain
local and global factors. Clarifying a role for natural gas to balance the tradeoff be-
tween reducing emissions and reducing the demand for electricity that is not satisfied
must include an evaluation of these uncertainties to understand when benefits may
be realized.
Chapter 4 frames the generic question about the role of natural gas in reducing
emissions and energy poverty in low income countries as a specific U.S. foreign policy
problem. The scope of the problem is narrowed and assumptions are made explicit
in preparation for building relevant mathematical models of the energy system.
Chapter 5 reviews approaches to decision making under uncertainty and presents
two energy system models. Four approaches to uncertainty analysis are applied to the
energy system models to evaluate five specific policy options and their implications
for emissions and unmet demand for electricity.
Chapter 6 concludes the dissertation in two ways. First, it draws on the results
of the uncertainty analyses to support a recommendation for U.S. foreign policy on
natural gas. Second, it articulates a philosophy of model result interpretation and

CHAPTER 1. INTRODUCTION 15
contrasts the approaches to uncertainty analysis to recommend one that aligns with
the foreign policy making process.

Chapter 2
Modeling for Foreign Policy
Decisions
Where you stand depends on where
you sit.
Graham Allison, 1969
There is a new and growing specialization of U.S. foreign policy at the intersection
of energy and foreign policy.1 Concerns range from global governance of energy
markets to promote energy security to the international imperative to arrest climate
change (Kalicki & Goldwyn, 2005; Youngs, 2009; Pascual & Elkind, 2010; Bahgat,
2011; Newell, 2011; Pascual, 2015). Energy “rests at the core of geopolitics, because
fundamentally, energy is an issue of wealth and power, which means it can be both
a source of conflict and cooperation” including on climate change and socioeconomic
development (Clinton, 2012).
The United States engages other nations on energy as part of its foreign policy
both to advance domestic concerns and to support the energy goals of other countries.
In response to the 1973 Oil Crisis, with the strong support of then Secretary of
State, Henry Kissinger, the International Energy Agency was created in the first
1This dissertation will exclusively consider the foreign policy of the United States, and willhenceforth just refer to it as foreign policy.
16

CHAPTER 2. MODELING FOR FOREIGN POLICY DECISIONS 17
step towards international cooperation on energy. Today, bilateral and multilateral
agreements exist with partners all over the world as in Power Africa, the U.S. Asia
Pacific Partnership for a Sustainable Energy Future, and Connecting the Americas
2022. In recent years, through the G7 and G20, the United States has worked with
other countries on energy issues such as energy security and eliminating fossil fuel
subsidies. Under the United Nations, the United States collaborates to reduce energy
poverty through the Sustainable Development Goals and to promote renewable energy
and energy efficiency through the Sustainable Energy for All initiative (UNGA, 2014,
2015).
Energy is also a source of conflict, and as such, often intertwines with tradi-
tional national security concerns of the United States. There are many examples:
debates about the NordStream pipeline have stressed European Union solidarity; dis-
putes about transit of and payment for Russian gas through Ukraine continue to
threaten the independence of Ukraine; disagreement on oil revenue sharing between
the Iraqi central government and the Kurdistan regional government undermine a
federal state; controversy surrounding dams along the Mekong river challenge the
regional hegemony of China; and oil transit causes conflict in an already fragile re-
lationship between South Sudan and Sudan. Similarly, blackouts and fuel subsidy
reforms have a history of causing mass protests and undermining political stability.
Energy also nurtures seeds of corruption, as seen recently in multi-billion dollar scan-
dals involving the national oil companies in Nigeria and Brazil. And as energy poor
communities fall prey to extremism, as in Nigeria, and captured oil fields provide
revenues for terrorist groups, as in Iraq and Libya, energy also supports violence.
Just as energy can be used to create or exacerbate rifts between neighbors, energy
is also a foundation for political alliances. Turkish Stream brought together Turkey
and Russia during a period of uncertainty in the West. Venezuela uses PetroCaribe to
buy influence throughout the Caribbean. And it is not just other countries that use
energy as leverage in geopolitical negotiations. The United States has used sanctions
on oil trade to encourage Iran to negotiate an end to its nuclear program, and sanc-
tions on technologies for hydrocarbon development have been enacted to influence
Russia’s behavior.
CHAPTER 2. MODELING FOR FOREIGN POLICY DECISIONS 18
All of these concerns are intrinsically foreign policy matters because they are
about countries concentrating and exercising power to achieve their goals. These is-
sues are also fundamentally energy concerns, as policies are diluted or amplified by
technological and market changes in energy that are beyond the control of foreign
policy decision makers. Foreign policy decisions that interact with domestic or inter-
national energy policies will continue to increase as more countries become invested
in the trade of energy and as climate change has more devastating local consequences
(Clinton, 2010). Yet, as I explain in this chapter, analytic tools to support policy
decisions at the nexus of energy and foreign policy are uncommon.
In contrast, in support of domestic energy policy, analytic tools, specifically math-
ematical models, have proven to be valuable tools to systematically explore alternative
policies and their consequences (Hogan, 2002). These mathematic models are simpli-
fied representations of a real system used as a cognitive tool for a specific purpose.
While energy models do not precisely predict how the energy system changes, they
provide useful insights for the policymaking process. To achieve this an analyst makes
judgments about which details are necessary and when simplifications make models
more cognitively and computationally tractable. The simplifications that are accept-
able in a given model depend on the policy question being addressed. Models must
be chosen and modified to provide meaningful insight. This is common wisdom, but
in practice is not always done (Morgan & Henrion, 1990; Pidd, 1999).
In foreign policy, the use of mathematical models is uncommon. There are a
number of reasons this may be the case: topics are not typically represented mathe-
matically, objectives do not lend themselves to quantification, and practitioners have
limited mathematical training. Despite the lack of familiarity with models, it is
difficult to imagine how foreign policy decision makers can effectively grapple with
the complexity, competing objectives, and uncertainty in the energy system without
mathematical tools. What would it mean for models to be adapted to fit the needs
of decision-making in this overlap of energy and foreign policy?
Two things are at stake in exploring this question: the quality of the decisions
being made and the reputation of modeling for policy analysis. Without cognitive
tools to support policy making it is impossible to arrive at high quality decisions that

CHAPTER 2. MODELING FOR FOREIGN POLICY DECISIONS 19
harmonize complex national interests in a changing energy landscape. And without
the proper adaptation and positioning, energy models employed for foreign policy
decision support are destined to be misused and misunderstood. It is imperative
then, that models be reimagined for this new context in which they may be applied.
This dissertation describes changes to the structure and the philosophy of energy
models for effective use in foreign policy decision making. In this chapter, I begin by
laying out what it means to adapt existing energy models to the context of energy
and foreign policy.
The remainder of this chapter is divided into three sections. Section 2.1 reviews the
literature on foreign policy decision making, noting the limited use of mathematical
models for decision support. Section 2.2 considers the important role models have
traditionally played in energy policy analysis. Based on the unique needs of foreign
policy decision support and the success of models to support energy policy analysis,
Section 2.3 begins to operationalize the intersection of energy models and foreign
policy analysis. I conclude that structural and philosophical changes to energy models
will be required.
2.1 Exposing a methodological gap
Foreign policy is, more than anything else, about decisions. In decision theory, the de-
cision basis describes what is known, what outcomes are desirable, and what actions
can be taken to change the outcomes (Howard, 1988). The information, alterna-
tives, and preferences are brought together systematically with a particular logic. As
elsewhere, information, preferences, and alternatives are the basis for foreign policy
decisions (George, 1980, p 111). But where does the information come from? What
alternatives are evaluated? Whose preferences are used? In foreign policy, the answer
to these questions is driven in large part by who makes decisions and the process by
which those decisions are made.
Foreign policy making is different from domestic policymaking for many reasons,
not least of which is the decision making process (Kissinger, 1977). Foreign policy does
not fall to a single agency with a clear mandate and the relevant tools to design and
CHAPTER 2. MODELING FOR FOREIGN POLICY DECISIONS 20
implement policy. Rather, foreign policy is comprised of many agencies with disparate
missions. Rather, the expertise and resources of many agencies are brought together
to set foreign policy under the auspices of the National Security Council (National
Security Council). The National Security Council advises the President “with respect
to the integration of domestic, foreign, and military policies relating to the national
security.” The National Security Council, created by the National Security Act of
1947, is by statute comprised of the President, Vice President, the Secretary of State,
the Secretary of Defense, and the Secretary of Energy and advised by the Chairman
of the Joint Chiefs of Staff and the Director of National Intelligence. In practice,
at the discretion of the President, other Cabinet members and senior officials join
discussions on matters relating to their office.
In preparation for presidential decisions, the Special Assistant to the President
for National Security Affairs, commonly referred to as the National Security Adviser,
convenes relevant senior officials. Often, this Principals Committee will follow or
initiate a series of meetings conducted at less senior levels of the same agencies to
synthesize information and refine alternative courses of action. The National Security
Staff shepherds policy decisions through this interagency process.2
Our understanding of the unique context of foreign policy decision making has
implications for the shape of policy analysis, such as energy modeling, which can
support high quality decision making at the intersection of energy and foreign policy.
2.1.1 Foreign policy decision making
Much has been written to explain ex post why certain foreign policy decisions were
made (Snyder, 1954; Snyder et al., 2002; Hudson, 2013; Mintz & DeRouen Jr, 2010).
In 1971, Graham Allison published the Essence of Decision: Explaining the Cuban
Missile Crisis in which he explains three models, which act as different lenses with
which to explain foreign policy decisions3 (Allison, 1971). Forty years of critique and
subsequent work integrating knowledge from political science, economics, psychology,
2In the rest of this paper, references to the National Security Council refer to this interagencyNational Security Council process and not the narrow convening of five people as defined in statute.
3Allison’s models are models in the sense of paradigms not mathematical expressions of a system.
CHAPTER 2. MODELING FOR FOREIGN POLICY DECISIONS 21
and sociology has refined our understanding of foreign policy decision making. While
Allison’s models are controversial, the truth he exposed is salient. In this chapter,
Allison’s models serve as a base from which to explore the amendments and additions
to the original work that together is the richness of our understanding of foreign policy
decision making.
Model I
In Allison’s Model I, foreign policy decisions are an intentional calculation to maximize
the expected outcome of a decision according to the decision maker’s preferences
(Allison, 1971). In this rational actor model, the state is like a single decision maker
with defined alternatives, clear preferences, and an understanding of the consequences
of each choice. Borrowing from expected utility theory, a rational choice is one that
is most likely to result in the preferred outcome. Under the strict axioms of expected
utility theory, the decision maker’s preferences are complete, transitive, continuous,
and independent (von Neumann & Morgenstern, 1944).
Scholarship in cognitive psychology and behavioral economics, has revealed the
fragility of these assumptions in real world decision making. The complexity of the
decision environment and the cognitive limits of the human brain prevent reasoning
about the decision basis accurately. Rather than being perfectly rational, people
exhibit bounded rationality and resort to heuristics to reason about the information
in front of them, the alternatives they will consider, and how to apply their preferences
(Simon, 1957).
The use of these mental shortcuts results in a number of cognitive biases that
can produce decisions that conflict with rational choice. Cognitive biases such as
availability, representativeness, and anchoring hinder clear thinking about informa-
tion and alternatives (Tversky & Kahneman, 1974). Confirmation bias - when a
person interprets new information in a way that reinforces their previous beliefs -
and belief perseverance - when a person ignores new evidence that conflicts with
their initial opinion - have been the cause of many foreign policy failures (Anderson
et al., 1980; Blum & Pate-Cornell, 2015). These cognitive limitations explain the use,
and commonly the misuse of history and analogy in foreign policy decision making

CHAPTER 2. MODELING FOR FOREIGN POLICY DECISIONS 22
(George, 1980; Jervis, 1968). In any group decision making environment, like that of
the National Security Council, these cognitive biases are compounded.
When information is not only complex, but also uncertain, people make choices
that are not consistent with their own preferences. First, in decisions with more
than one objective, people may choose an alternative that meets a threshold of ac-
ceptability, satisficing rather than optimizing their choice (Simon, 1959; Mintz et al.,
1994). Second, experimental work has shown that people exhibit ambiguity aver-
sion, demonstrating a preference for known risks over unknown risks (Fox & Tversky,
1995; Heath & Tversky, 1991). Third, people violate rational behavior by valuing
gains and losses asymmetrically. People fear losses more than they desire gains of the
same magnitude, rather than being indifferent to the reference point (Kahneman &
Tversky, 1979; Tversky & Kahneman, 1992). The importance of the reference point
has important consequences in international relations as it causes countries to main-
tain the status quo even when change would be beneficial, and it may cause a country
to take excessive risks to avoid a loss (Levy, 1992).
Model II
Drawing on organizational theory, Allison’s Model II explains foreign policy actions as
the aggregate consequence of a loose alliance of semi-independent organizations each
acting according to their standard procedures and resources (Allison, 1971). Agencies
form strong identities at birth that shape decision making for decades (Zegart, 2011;
Halperin & Clapp, 2007). Even in a changing threat landscape, organizations resist
change to their mission and procedures (Zegart, 2007; Vaughan, 1996).The routines,
structures, and culture of an organization powerfully influences what agencies do and
how they do it (March & Olsen, 2006; Zegart, 2005).
Strong organizational identity influences how each agency views the decision basis
for a given policy problem. Each agency directs its limited attention to issues with
the most institutional relevance. Accordingly, the information an agency collects is
only what is of interest to their organization. The agency’s ability to interpret that
information is impeded by accepted institutional mindsets. Increasing specialization
among and within agencies further hinders analysis because disaggregated signals that

CHAPTER 2. MODELING FOR FOREIGN POLICY DECISIONS 23
would result in decisive policy action are missed (Zegart, 2007; Bendor & Hammond,
2010). When evaluating alternatives, an agency considers a narrow set of options
which are familiar and under their control.
Within the interagency these institutional identities hold back the interagency’s
evaluation of the decision basis. Agencies offer only the information they think is
relevant based on their understanding of the problem, widening the information gap
between expert bureaucrats and decision makers (Zegart, 2005). Agencies demon-
strate a hesitancy to step beyond their historical competency or out of their “lane.”
If a policy aligns with the organization’s core mission, each agency will suggest tools
and strategies that make use of their strengths stifling consideration of the full range
of options. If the policy is perceived as a departure from their mission, agencies may
not see creative uses of their resources. Even if all participants had a common under-
standing of the problem, different institutional perspectives result in different policy
stances. Agencies prioritize outcomes differently even when they agree on the broader
narrative of the national interest. Because each agency has a different mission, they
have legitimately different preferences. Without guile, agency representatives perceive
their issue as a critical factor in a policy decision.
Even this level of interagency interaction assumes a consistent interest and partici-
pation of agency representatives. However, the interagency National Security Council
process could be fairly characterized as an organized anarchy with inconsistent, ill-
defined preferences and inconsistent participation. In this environment, decisions
may not always be the result of concerted problem solving. Instead decisions are
the product of the energy and expertise of those convened at a particular time and
the solutions looking for a problem to solve (Cohen et al., 1972). This garbage can
theory of organizations contrasts sharply with the image of carefully calculated policy
decisions.
Model III
Allison’s model III explains foreign policy decisions as the result of bargaining among
individuals representing the interests of distinct organizations, or, as Allison says, the
“pulling and hauling that is politics (Allison, 1971, p144).” “Where you stand depends
CHAPTER 2. MODELING FOR FOREIGN POLICY DECISIONS 24
on where you sit (Allison, 1971, p176)” sums up an entire literature on bureaucratic
politics that seeks to understand the results of competition and compromise between
decision makers with different national interests, institutional interests, information,
and power (Allison, 1971; George, 1980; Halperin & Clapp, 2007; Hilsman, 2011;
Caldwell, 1977). Agencies are in competition for influence, resources, and success
(Halperin & Clapp, 2007). Within the context of the National Security Council, these
politics inhibit the information presented, the alternatives considered, the objectivity
of evaluation, and the level of debate.
Agency representatives withhold or share information based on their organiza-
tional interests and their perception of policy interests. Agencies must choose which
issues to go to bat for knowing there will be future decisions to settle in the inter-
agency. Particular policies may be the battlefield for ongoing rivalries. Agencies
volunteer their resources for policies they expect to be successful, and shy away from
participating in policies they perceive to be troubled. Often agencies will present one
“real” policy and two extremes that by oversimplifying the analysis they can box in
a decision.
Intellectual resources, like competence, information, and analytical support as
well as bureaucratic resources, like status and persuasion skills are not distributed
equally. Uneven distribution of influence because of personal charisma or the clout of
the organization affects the perception of alternatives. Viewed with the bureaucratic
politics lens, Art describes foreign policy making as
a political process of building consensus and support for a policy among
those participants who have the power to affect the outcome and who often
disagree over what they think the outcome should be . . . The content of
any particular policy reflects as much the necessities of the conditions in
which it is forged - what is required to obtain agreement - as it does the
substantive merits of that policy (Art, 1973, p468-469).
Critics of the bureaucratic politics model have argued that it undervalues the role
of prevailing mindsets and national values (Art, 1973; Krasner, 1972; Rhodes, 1994)
and ignores the influence of other actors like Congress (Art, 1973) and the President
CHAPTER 2. MODELING FOR FOREIGN POLICY DECISIONS 25
(Krasner, 1972). Others think that as a model to explain decisions it is too vague, and
there is not enough data to validate the theory (Bendor & Hammond, 1992; Caldwell,
1977).
Despite these critiques, Allison’s models make clear that to understand foreign
policy decision making many layers must be examined. This has important implica-
tions for policy analysis. Model I suggests the role of policy analysis is to correct for
cognitive limitations in the face of complexity, multiple objectives, and uncertainty.
While distinct modes of interagency cooperation, Model II and Model III point to
something equally important - process influences content. Contrasting the Model II
organizational perspective with that of the Model III bureaucratic politics: where
information is limited because of narrow interests, information is offered or withheld
to influence the outcome of discussions; when solutions offered might have come from
a standard set of capabilities, solutions are offered with organizational gain in mind;
where stances on a particular policy originate in institutional mindsets, positions are
taken to advance the organization’s success. All three models operate simultaneously
(Snyder & Diesing, 1977, p440). In order to be successful, energy models must ac-
commodate the foreign policy decision making process because who makes it and how
it is made is just as important as the problem itself.
2.1.2 Improving foreign policy decisions
The foreign policy decision making literature supported by the contributions of many
fields explains how real decision making departs from rational choice theory. Not
only is the substance of the policy clouded by complexity, competing objectives, and
uncertainty, but the information, alternatives, and preferences are distorted by the
unintentional effects of organizational behavior and the intentional contrivances of
bureaucratic politics. While illuminating, this literature does not, however, take the
next step of making recommendations for improving foreign policy decision making
(George, 1972, p758),[p331]Brenner1976. Political science has largely ignored issues
of public administration. Therefore, little has been said about how to support the
foreign policy decision making process and to improve the quality of decisions. A
CHAPTER 2. MODELING FOR FOREIGN POLICY DECISIONS 26
notable exception is the work of Alexander George on systems of advising and types
of judgment. This section will look at how analytic tools relate to systems of advising
and types of judgment and then review the use mathematical modeling as an analysis
tool in national security.
Systems of advice
Scholars have evaluated various Presidents’ configurations of the National Security
Council (Johnson, 1974). Each organizational design choice has implications for
search and evaluation. The President has considerable flexibility in how the infor-
mation and advice from advisors is synthesized and relayed. Systems of advising are
different positions and roles the National Security Council can take in the interagency
process. While framed as the advisory system around the President, these systems
of advising could describe every level of the interagency process supporting the Na-
tional Security Council - with a senior member of the National Security Staff at the
center. For a given policy decision, each level of the National Security Council could
be operating under different systems in parallel.
George (1980) explores four archetypes of National Security Council design: the
devil’s advocate, the formal options model, multiple advocacy, and the collegial model.
With a devil’s advocate arguing for alternatives not favored by the majority, unimag-
inative suggestions stemming from institutional mindsets may be more easily ferreted
out. To work properly the minority opinion must be genuinely argued, which can
be a challenge if no one of influence believes in and pursues it with vigor. A system
of formal options minimizes the importance of each agencies’ preferences, advancing
many policy choices to the top for a final decision. Multiple advocacy is a structured,
controlled competition of ideas in which advisors are given equal time, resources, and
expertise to debate alternatives. It is intended to overcome disparities in power and
influence that may bias evaluation of the alternatives and to subject each alternative
to scrutiny from organizations that did not offer the option. While this deliberate
process might be the most thorough of the four, it consumes considerable time and at-
tention from all parties. The collegial model is a hub and spoke architecture with the
President at the center and a few advisors providing competing information (George,

CHAPTER 2. MODELING FOR FOREIGN POLICY DECISIONS 27
1972). This system is nimble because fewer participants are involved, but it puts a
heavy time and cognitive burden on the President. While the organizational distor-
tions are minimized, this system lacks routine oversight and is susceptible to capture
by a charismatic individual (Barilleaux, 1984).
None of these systems say anything about how information should be analyzed
and presented. George is clear that within any of these systems, “analysis is not a
substitute for bargaining but serves to inform and discipline the bargaining process
in a way that helps prevent ending up with a badly compromised policy that is likely
to prove ineffectual (George, 2006, p76).” However, while discussing the pros and
cons of each system in great detail, he does not talk about the role of analytical
tools within each system or the utility of different forms of analysis. How and where
analytic tools are developed and used will influence how the results are perceived.
Facilitated improperly, analysis may not influence the decision at all or could become
an extension of organizational routine or a tool of bureaucratic politics. Some systems
may be more or less amenable to an analytic conversation and some analytic tools,
like mathematical modeling, may be more or less appropriate.
Types of judgment
In addition to his work on advising systems, George has also written about the role of
judgment in decision making. He disaggregates the types of judgments that are central
to policymaking into seven types: time and resource trade-off judgments, judgments
of political side effects and opportunity costs, judgments of utility and acceptable
risk, judgments about short-term and long-term payoffs, judgment to satisfice or
optimize goals, judgments about value complexity, and timing judgments. While
George differentiates the value of analysis and the value of judgment, concluding that
they are not substitutes but complements of one another, he does not make explicit
the relationship between analytic tools and types of judgment.
Judgments guide the direction and interpretation of analysis by clarifying many
small choices leading up the policy decision itself. For example, the trade-off judg-
ments among analytical quality of an option, the need to obtain support, and the
use of time and political resources, as shown in Figure 2.1, must be made for each

CHAPTER 2. MODELING FOR FOREIGN POLICY DECISIONS 28
new policy decision. This judgment will impact how much and what type of analysis
is needed. Some analytic models when built can then clarify whether more informa-
tion or more analysis could possibly result in a meaningfully higher quality decision
(Howard & Abbas, 2015; Birge & Louveaux, 2011). The decision maker’s judgment
about short and long-term payoffs, satisfying or optimizing outcomes, and value com-
plexity can be explicitly incorporated in some types of analysis. A rigorous treatment
of these issues is likely to improve judgment. In contrast, while judgments about
political side effects and opportunity costs or utility and acceptable risk could be
treated mathematically, that analysis would not generally improve human judgment.
Figure 2.1: Tradeoff judgment among analytical quality, support, and time and re-sources reproduced from George (2006, p74)
Mathematical models as analytic tools for foreign policy
While George has refined ideas about systems of advising and the types of judgment
needed in policymaking, he does not speak to the role or diversity of analytic tools for

CHAPTER 2. MODELING FOR FOREIGN POLICY DECISIONS 29
decision support beyond affirming their importance in complex policy decisions. In
practice, only a few analytic tools have historically been used for foreign policy anal-
ysis and only for a narrow set of applications (Quade, 1964; Kugler, 2006; National
Research Council, 2011; Tetlock, 2005). The application of mathematical models,
specifically, has been even more narrowly constrained to a few sub-disciplines of for-
eign policy. The mathematical models historically used in national security matters
are methods from systems analysis, operations research, and economics.
Systems analysis focuses on the relationships and interactions between compo-
nents to deconstruct a system into subsystems which are express fundamental pro-
cesses mathematically. The interaction of the subsystems with each other and the
effect of external forces including intended policies is studied to understand the con-
sequences of decisions and their impacts on one or more objectives. Systems analysis
has been used extensively in the military related to weapon development and bud-
geting beginning under the leadership of Secretary of Defense McNamara (Kugler,
2006; Quade & I.Boucher, 1968; Hitch & McKean, 1960). The models successfully
handle complexity, but have been limited to well-structured problems and technical
or economic analysis.
Operations research is a mathematical approach to problem solving that refers to
a broad range of specific methods. Operations research methods were developed to
support operations in World War II. Today methods like optimization programming
and stochastic processes continue to be used to improve homeland security and to
plan the force structure of the military (Washburn, 1994; Kugler, 2006; Kaplan et al.,
2011; Jaiswal, 2012). In contrast, to the big picture view provided by system analy-
sis, operations research methods tend to focus on details. Policy problems must be
quantifiable and structured to suit the assumptions of a specific modeling technique.
Game theory is a mathematical model to analyze the strategies for competition or
cooperation when the optimal strategy depends on the actions of others. Game theory
has been used in national security and international relations to understand how states
respond to conflict and the risks and opportunities from cooperation. Game theory
has been used to develop U.S. deterrence and arms control policies because of the
CHAPTER 2. MODELING FOR FOREIGN POLICY DECISIONS 30
insight into strategies to manage power differentials between adversaries (Brams &
Bramj, 1985; Brams & Kilgour, 1988; Powell, 1999; de Mesquita, 2011).
As the concept of national security has expanded since the Cold War, the use of
modeling for foreign policy decision support has not continued apace. Application
areas remain limited to the types of military planning described. These application
areas are characterized by policy issues with quantifiable systems, well-structured
problems that lend themselves to a particular mathematical modeling approach, and
often a cadre of mathematical people. While clearly issues of national security, these
policy issues were confined to a narrow subset of agencies with more or less unified
interpretations of the national interest. Mathematical modeling could be used to
understand many more national security issues, for example, the spread of pandemics
or extremism or the migration of people. Yet in these policy matters, as in energy
and foreign policy matters, mathematical modeling has not become a fundamental
part of policy making.
Some energy models have been used to explore geopolitical or international en-
ergy issues, but few models have explicitly been built to assist foreign policy making
(Beccue et al., 1997; Schwartz & Randall, 2003; Medlock et al., 2011; International En-
ergy Agency, 2011; Chyong & Hobbs, 2011; McCollum, 2012; McCollum et al., 2013;
Richter & Holz, 2015; Bazilian & Chattopadhyay, 2016). The usefulness of these
analyses has not been assessed. While energy systems can typically be meaningfully
quantified, energy policy questions are often ill structured. Ill structured problems
have numerous alternatives, conflicting objectives, uncertainties that cannot be de-
scribed with probability, and relationships in the system that are unknown (Dunn,
1981, p104). The complex interactions of subsystems, ambiguous ranking of prefer-
ences, and uncertainty over long-time horizons lead policymakers to use heuristics to
pursue near-term goals with limited view of long-term outcomes.
Models can play an important role supporting foreign policy decision making, but
to be effective they need to suit both the specific details of the policy problem and
the nature of the policy making process. The models that have been used successfully
in subfields of foreign policy, were able to compensate for decision makers’ bounded
rationality and approximate the conditions for rational choice. The models united
CHAPTER 2. MODELING FOR FOREIGN POLICY DECISIONS 31
several decision makers as a single set of clear preferences, codified available infor-
mation, specified a few alternatives, and enforced logic to transform the bounded
rationality of the individuals into the cold rationality of mathematics.
2.2 Extending an existing idea into a new area of
study
The review of the foreign policy decision making literature has provided a map for
improving the quality of foreign policy decisions, but does not give guidance about
the usefulness of particular tools that could be employed in decision making in energy
and foreign policy. This section will review mathematical models that have widely
contributed to energy policymaking (Hogan, 2002). Mathematical models have been
useful precisely because they can manage the impediments to rational decision mak-
ing. In this section I will review how complexity, multiple objectives, and uncertainty
in the energy system have been managed with models in energy policy analysis.
There is a long tradition of using models to frame, design, and evaluate policy
remedies to energy problems. Mathematical models for policy analysis are used to
communicate and explore scientific understanding and to facilitate decision-making.
Since the early models developed during the 1973 Oil Embargo, mathematical models
have been employed to guide policy in energy markets, infrastructure investments,
research and development portfolios, and environmental impacts. Energy models
have been useful tools of energy policy analysis because they credibly describe the
behavior of complex systems that could not otherwise be analyzed even by careful
study of the parts and because they meaningfully measure explicit goals of energy
policy relating to the economy and the environment.
2.2.1 Modeling complexity
Despite limitations that arise from simplifying the real world, models organize and
discipline thinking about interactions in a system. Like in foreign policy, without
models, energy policy decision makers also rely on heuristics. But, in a fast changing

CHAPTER 2. MODELING FOR FOREIGN POLICY DECISIONS 32
global energy system, a rule of thumb is sure to be outdated quickly. By formalizing
an understanding of the individual interactions in the energy system, a model can
be used to explore the outcomes of policy alternatives or the effect of constraints or
shocks in the system. In energy policy analysis this is particularly useful because
experiments cannot be run on the real world and measurements of the present do not
clarify the future.
The energy system is both technically and economically complex because it unites
the natural world, the engineered environment, changing technology, micro and macro
economics, finance, society, politics, and geopolitics. A complex system results in un-
predictable outcomes from the interactions between variables in the network (Manson,
2001). The behavior of the system is non-linear: a small change in one variable may
result in a disproportionately large effect on another variable because of feedbacks
in the system. Without models it would be difficult to isolate feedbacks in the sys-
tem.“No gluing together of partial studies of a complex nonlinear system can give a
good idea of the behavior of the whole (Gell-Mann, 1995).”
There are three archetypes of mathematical models that capture technical and
economic complexity: descriptive, prescriptive, and predictive. A descriptive model
describes the outcome (y) of given inputs (x) in a known model represented as a
series of mathematical equations f(x). Simulation models and process engineering
models are descriptive models commonly used for systems analysis in energy. A
prescriptive model prescribes the inputs (x) needed to achieve a certain outcome
(y) in a known model represented as f(x). Prescriptive models are also common in
energy policy analysis in the form of various optimization methods. A predictive
model predicts the f(x) that best explains the outcomes (y) of new input values (x).
In energy policy analysis, these statistical models are common in econometric work to
generate parameters from experimental or historical data. Prediction methods, like
those used in statistics and econometrics, are limited by the availability of data and
the assumption that the future will look like the past.
There is a common misconception that the goal of energy policy models is fore-
casting, attempting to quantitatively describe the future in order to plan actions.
The ability of models to forecast the future energy system is not the measure of a
CHAPTER 2. MODELING FOR FOREIGN POLICY DECISIONS 33
good model. All energy models are likely to be eclipsed by changes in the technology,
economics, society, and policy. As George Box explains, “All models are wrong; some
are useful.” Therefore, as many have said, “The purpose of modeling is insight, not
numbers.”
While policy analysis for foreign policy has been limited to a few narrow domains
and a few dominant modeling approaches, in the field energy, the use of models for
policy analysis has and continues to expand (Hogan, 1975; Brock & Nesbitt, 1977;
Manne et al., 1979; Kavrakolu, 1987; Weyant et al., 1999; Hogan, 2002; Weyant,
2004; Nakata, 2004; Jebaraj & Iniyan, 2006; Herbst et al., 2012; Gabriel et al., 2013).
The many different modeling approaches have largely evolved from two disciplines:
engineering and economics. Engineering models, have come from specific scientific
disciplines and from the fields of operations research and systems analysis. Engineer-
ing models typically have comprehensive technological or scientific detail and prices
or demands are assumed exogenously. In contrast, energy policy models developed
from the field of economics solve for equilibrium prices that bring supply and demand
into balance in all markets or a certain subset of markets, typically energy markets,
to maximize welfare or minimize cost. Economic models have minimal technology
representation.
Perhaps exactly because models have allowed analysts to constructively manage
complexity, there is a tendency for energy analysts to maximize the level of model
detail to represent the system as precisely as possible. With growing computational
power, model resolution of time and geography, system verisimilitude, and modeling
integration has increased. As time and effort are invested in a model, organizations
are reluctant to design models from scratch each time. Rather, modules are added
and refined to explore a new part of the system, and rarely pared back. This practice
runs counter to statements of best practice which advise building a model as simple
as possible, and no simpler (Merrick, 2017; Morgan & Henrion, 1990). Energy models
have hybridized to incorporate the explicit technological detail of engineering models
and the general equilibrium effects of economic models. In the area of climate pol-
icy, the integrated assessment model has emerged. Integrated assessment models tie
CHAPTER 2. MODELING FOR FOREIGN POLICY DECISIONS 34
models of the energy system, the economy, and the physical world together to under-
stand the interactions between people, land, water, air, and the atmosphere (Weyant,
2017).
For many questions, these complex models may be necessary. However, when pol-
icy making takes the form of decision making, this detail is likely to obscure important
relationships. Model verisimilitude is pursued to satisfy an analysts predisposition,
not because it is useful to the decision maker. This detail also leads the non-expert
to mistake precision for accuracy, detail for likelihood. These caveats are understood
by experienced modelers, but often they are not translated to or fully grasped by
policymakers.
2.2.2 Modeling multiple objectives
In addition to managing complexity, energy models have also been a tool for energy
policy analysis because models track many important metrics of energy policy. Eco-
nomic metrics of energy policy like investment costs, consumer prices, changes in gross
domestic product, return on investment, and payback periods can be easily calculated
and aggregated. Many environmental metrics can also be calculated such as concen-
trations of air pollutants, volumes of effluent, and rates of morbidity and mortality.
The field of environmental economics has developed accepted methods for translating
these environmental metrics into monetary units. Economic and environmental costs
and benefits can then be compared in common units.
The fields of lifecycle analysis and decision theory have developed techniques to
compare outcomes in terms of multiple-objectives when economic and environmen-
tal outcomes cannot be translated into common units4 (Hertwich & Hammitt, 2001;
Keeney & Raiffa, 1976). Multi-criteria decision making is a family of methods to deal
with multiple, often conflicting, objectives. Multi-criteria decision making methods
are categorized based on whether they are for single or multiple decision makers;
whether they are deterministic, stochastic, or fuzzy; and whether they are optimiz-
ing over a set of objective functions or comparing a small number of alternatives.
4An objective is the goal. An attribute is the measure of attainment of the objective. Valuesdictate preferences which clarify how to tradeoff objectives.
CHAPTER 2. MODELING FOR FOREIGN POLICY DECISIONS 35
Multi-attribute decision making is further subdivided by value measurement models,
outranking models, and aspiration-reference level models. All multi criteria decision
making algorithms have been used in energy policy analysis (Hobbs & Meier, 2000;
Pohekar & Ramachandran, 2004; Greening & Bernow, 2004; Loken, 2007; Wang et al.,
2009). Often more than one multi criteria method is used during an analysis because
different methods may reach different conclusions (Hobbs & Meier, 2000).
While energy models represent economic and environmental goals effectively, mod-
els have not been used equally well to track energy security goals. Energy policy is
often described as a balance between the economy, the environment, and security,
but the modeling literature is heavily skewed toward the goals that are quantifiable.
Energy security is not easily quantifiable. Part of the difficulty is energy security
does not have a universal definition. Some definitions of energy security are quantifi-
able and others are not (Winzer, 2012; Sovacool et al., 2012a; Sovacool & Mukherjee,
2011). Most modeling work that has explicitly addressed energy security has done
so as a qualitative evaluation of the impact of changes of economic flows or environ-
mental stocks. The treatment of the multiple objectives in energy does not reflect
their relative importance to policy objectives, but rather the tendency of analysts to
model attributes that are quantifiable.
2.2.3 Modeling uncertainty
As a tool for energy policy analysis, energy models have effectively managed complex-
ity and multiple objectives with success by enforcing logic and consistent preferences.
Energy models have also benefited from advanced methods for decision making under
uncertainty to manage incomplete information. Understanding uncertainty is a very
important part of energy policy analysis. Uncertainties about technologies, markets,
others’ investment decisions, other countries’ policy decisions, social and political
change, and our understanding of the physical world affect the energy system in ever
changing ways.

CHAPTER 2. MODELING FOR FOREIGN POLICY DECISIONS 36
Most energy policy models are deterministic, leading analysts to use their best
estimates to parameterize variables that are uncertain. A simple example by Quade
& Carter (1989) demonstrates the limitations of a deterministic analysis.
Suppose there is uncertainty about 10 factors and we make a best guess
for all 10. If the probability that each best guess is right is 0.6 (a very
high batting average for most best guesses), the probability that all 10
are right is about six-tenths of 1%. If we confined the analysis to this one
case, we would be ignoring a set of possibilities that had something like
99.4% probability of occurring.
That only a tiny fraction of possible futures is revealed in a deterministic model is not
a matter of concern per se. In many cases a policy chosen because its performance in
one future world, also performs best in many futures. However, only in the cases where
models are completely linear will using average values in place of random variables
result in a solution you would observe on average (Savage & Markowitz, 2009). Using
average values can be especially pernicious in analysis concerned with climate change,
as many phenomenon are not normally distributed. Extreme outcomes are more likely
when there are “fat tails” in the distribution.
Uncertainty analysis is family of specialized modeling methods which guide under-
standing about the effectiveness of policies when important variables are uncertain.
Different methods of uncertainty analysis are useful for addressing each level of uncer-
tainty. Uncertainty analysis that is helpful in untangling one type of uncertainty may
not be useful for interpreting and communicating results about other kinds of un-
certainty. The most common treatment of uncertainty is scenario analysis, in which
uncertainty is not treated probabilistically. Kann and Weyant categorize methods
that can be used when uncertainty can be described probabilistically. A family of
techniques based on exploratory modeling and analysis has been developed that uses
a model to run experiments and then reason about the collection of results. It is not
probabilistic. In Chapter 5, these techniques and others will be reviewed in more
detail.

CHAPTER 2. MODELING FOR FOREIGN POLICY DECISIONS 37
Energy models have absorbed many advances in operations research, but sophis-
ticated treatment of uncertainty has been slow among academics and virtually non-
existent among think tank and government efforts. Mathematically sophisticated
treatments of uncertainty in energy policy analysis are the exception not the norm.
Probabilistic approaches suffer from the curse of dimensionality and the difficulty in
characterizing probability distributions or performing subjective probability assess-
ments of decision makers or experts (Keeney & Von Winterfeldt, 1989; Morgan &
Henrion, 1990; Kaplan, 1992). Predictive scenario modeling, the least sophisticated
uncertainty analysis, is the dominate method for dealing with uncertainty in energy
models regardless of the level of uncertainty. Unlike probabilistic (Kann & Weyant,
2000) and robust decision making methods (Lempert et al., 2003), scenarios do not fa-
cilitate a thorough search for policies. Energy models that have emphasized a detailed
representation of the energy system cannot nimbly be refitted for uncertainty anal-
ysis. With a detailed model a more sophisticated uncertainty analysis is cognitively
and computationally cumbersome.
2.2.4 Models in the domestic energy policy process
Decisions in U.S. energy policy are highly distributed and specialized. The Depart-
ment of Energy manages the energy technology research and development portfolio.
The Environmental Protection Agency is responsible for the impact of energy pro-
duction and consumption on water, air, and climate pollution. The Federal Energy
Regulatory Commission regulates the interstate trade of electricity and natural gas.
The Nuclear Regulatory Commission more narrowly considers the operational and
safety requirements for the nuclear power generation fleet. The Department of Inte-
rior oversees the development of coal, oil, and natural gas resources and renewable
energy projects on federal lands. The Department of Defense is concerned with en-
ergy as it relates to operations of their bases. The Council on Environmental Quality
evaluates the environmental and economic effects of domestic policies including en-
ergy. The State Department leads the diplomatic engagement related to domestic
energy production and consumption and the energy concerns of foreign countries.
CHAPTER 2. MODELING FOR FOREIGN POLICY DECISIONS 38
Each agency has resources to make policy decisions in their limited area of juris-
diction. By statute or by delegation of authority from the President, decisions are
typically the responsibility of each Secretary (or Administrator). In many of these
agencies, models are used to support decision making. The models are largely internal
and rarely, formally or informally, reviewed by other agencies. While energy models
are used to support many agencies, they are not typical in the interagency. A notable
exception is the work of the interagency working group on the social cost of carbon
(Metcalf & Stock, 2017; Greenstone et al., 2013).
Outside of federal agencies, policy think tanks, industry, and academic institutions
develop models to do independent analysis. Sometimes this modeling work is in
support of a particular policy discussion and at other times it is policy research
to increase our general knowledge and understanding (Morgan & Henrion, 1990).”
The models developed in these groups, therefore, do not necessarily link directly to
decisions. Rather, the modelers are part of the policy community network (Murphy
et al., 2016). Unfortunately, there is sometimes a “disconnect between” the questions
that the modeling community investigate and the questions policymakers need to
answer (Munson, 2004).
2.3 Operationalizing energy models for foreign
policy
The first section explained that models have been used successfully as analytical tools
to support decision making in a few sub disciplines in foreign policy, but with little
reflection about how they play into the foreign policy decision making context. These
policy problems were well structured and models served to approximate the assump-
tions of a rational choice theory: a rational, single decision maker choosing among a
limited set of alternatives with clear preferences and information which if uncertain
could be represented probabilistically. The previous section discussed the dominance
of mathematical models as a tool for energy policy analysis. Despite challenges, en-
ergy models successfully untangle complexity, evaluate multiple objectives, and frame
CHAPTER 2. MODELING FOR FOREIGN POLICY DECISIONS 39
the shape of uncertainty. Models provide discipline for a policy discussion by making
qualitative assertions quantitative. While energy models, therefore, have potential to
support decision making at the intersection of energy and foreign policy, the purpose
of this section is to show that the solution is not as simple as reusing the modeling
approaches that have successfully supported energy policy analysis.
To say that energy and foreign policy decision making should use models does not
say anything about the appropriate modeling methodologies to use.5 There are many
kinds of energy models. A diversity of methods have been developed to manage
the complexity, multiple objectives, and uncertainty characteristics of the energy
system. Specific decisions have been made during model development to specifically
deepen the treatment of one of these characteristics, typically at the expense of the
others. A policy problem at the intersection of energy and foreign policy inherits the
character of both its foreign policy and its energy policy parent. Operationalizing
the application of models like those used in energy policy analysis to meet the need
for tools for decision support at the intersection between energy and foreign policy
will require specific redesigns to energy model structure and a clearly articulated
philosophy about the role of models in this particular sub discipline.
2.3.1 Dual nature of the policy problem
At the intersection of energy and foreign policy, complexity, multiple objectives, and
uncertainty is inherited from both the energy system to be evaluated and the foreign
policy nature of the decision to be made. On their own, energy models are not a good
fit to support decision making at the intersection of energy foreign policy. As a direct
result of the intersection of fields, there are attributes of the policy problem which
have not been managed in energy policy analysis which must now be addressed.
5I am proposing that energy models can be adapted to be helpful analytic tools, but I am notexcluding the possibility that other policy analysis tools, not considered here, also have a role toplay in decision making in energy and foreign policy.
CHAPTER 2. MODELING FOR FOREIGN POLICY DECISIONS 40
Complexity
Energy models have been a dominant tool for energy policy analysis because they
tame complexity by codifying the parts of the problem that can be well-structured. In
energy that is quite a bit of the problem. In foreign policy it is not. A well-structured
energy policy question becomes ill-structured with the additional complexity of so-
cial, political, and geopolitical systems. On their own, these systems do not lend
themselves to mathematical representation and may be more comfortably evaluated
with qualitative or perhaps statistical methods. However, when interacting with the
physical and economic systems central to energy, a strong cognitive tool like a model
is needed to manage complexity. To merge these two fields then, the socio-political
factors must either be explicitly represented in the mathematical model or treated as
an after-market, add-on analysis.
Many modeling choices will be affected by the blending of the energy and foreign
policy qualities of the policy decision. Energy models are typically concerned with
long-time horizons that span decades, whereas foreign policy is typically concerned
with time horizons of years and sometimes months. In energy modeling it is appro-
priate to assume that agents in the model are responding to changes in the system
in economically rational ways striving for economic efficiency. However, in foreign
policy agents may be motivated by corruption or political power. These differences
have implications for model design from the beginning.
Multiple Objectives
At the intersection of energy and foreign policy, the economic or environmental goals
of traditional energy policy are subsumed within the concept of the national interest.
Unlike energy policy objectives which are often naturally quantified, national inter-
est does not lend itself toward measurement. National interests are context specific
embodiments of unchanging national values and national ideology. Ideology, or the
fundamental beliefs that outline the proper organization of society, is what often lends
foreign policy a sense of mission and an imperative for action. Irreducible national
values include physical security, sovereignty, and prosperity (George, 1980). Basic,
CHAPTER 2. MODELING FOR FOREIGN POLICY DECISIONS 41
self-regarding national interests relate directly to one of these national values. While
often used in political rhetoric as a useful justification for decisions, the concept of the
national interest is controversial as a criterion for policy analysis (Rosenau, 1968). As
it relates to analysis, some argue it can be normatively structured from component
interests and can be applied scientifically for policy analysis (George, 2006). Oth-
ers conceive of national interest as a non-operational goal, that can only be used to
explain actions (Rosenau, 1968).
Regardless of whether national interest is subjective or objective, there is consen-
sus that national interest is made up of various subgoals that compete for influence
in foreign policy (George, 1987). Like energy security, however, many of the subgoals
of national interest are difficult to quantify either because there is not a common
definition or because the definition is not measured in units of any kind. It may not
be possible to put subgoals on a common basis for comparison, but some attempt to
quantify the goals is important to bound the national interest to calculate the cost of
action or inaction (George, 1980). Whether the difficult work of quantifying is done
or not, the subgoals must be compared to each other to make tradeoffs. Quantifying
values to be able to see how a decision trades one goal for another can sometimes
feel contrived, but it is an important step for transparency. When two goals conflict
there is an implicit tradeoff in every policy solution. Better to be explicit about that
tradeoff by quantifying than to obscure the results of a given choice.
There is no theoretical basis for trading off among subgoals of the national in-
terest. Tradeoffs are not a question for science, but a political question. In this
sense, there are “no experts, per se, but only advocates and referees” (George, 1980,
p110). Analytics can illustrate the consequences and likelihoods of outcomes, but
cannot say how they should be valued. National values in foreign policy are part
mythology and part reality, therefore, they are conceived of differently by different
people. In practice, the relative weight of subgoals is the policymakers subjective
judgment. Basic-self regarding interests have priority. It is not clear how to trade-
off secondary self-regarding interests, other-regarding interests, or collective interests
(George, 1980).

CHAPTER 2. MODELING FOR FOREIGN POLICY DECISIONS 42
Foreign policy has more agencies at the table and more values today than during
the Cold War (Halperin & Clapp, 2007). As states have democratized, foreign pol-
icy has expanded explicitly into economic matters. Globalization has increased the
overlap between domestic and international concerns, and the scope of the national
interest has widened. With the expansion of the national interest the range and scope
of foreign policy has expanded. Today, it is rarely possible to classify foreign policy
issues as military, diplomatic, or economic.
Energy affects the U.S. national interest through many subgoals. Economic growth
and environmental quality are basic, self-regarding interests that are affected by the
availability and affordability of energy and the local environmental ramifications of
energy production and consumption. There are also other-regarding interests related
to energy. For example, energy use in other countries affects their prosperity; pollution
and revenue management affect the political legitimacy of the regime. These are
reflected in global stability and international terrorism which affect the security of
the United States. The United States has a secondary, self-interest in a “viable,
manageable, less conflict-prone system (George, 1987).” The stability of global energy
markets and climate change are collective interests. The costs of climate change
adaptation will affect U.S. prosperity and the prosperity of other nations to varying
degrees. Climate change will have ramifications for physical security as sea levels rise
and human migration intensifies.
Uncertainty
At the intersection of energy and foreign policy all of the technological and market
uncertainties are inherited from the energy nature of the problem. These uncertainties
are confounding for the most proficient energy analyst, more so for most participants
in the foreign policy process. The foreign policy nature of the policy decision adds
additional uncertainty in information and preferences. First, there is limited avail-
able data for energy systems outside the countries of the Organisation for Economic
Co-operation and Development (OECD). Energy systems of interest are also often ob-
scured intentionally or because of weak standards for transparency. Second, all policy
decisions are affected by decisions of other state or non-state actors intentionally or
CHAPTER 2. MODELING FOR FOREIGN POLICY DECISIONS 43
unintentionally trying to nudge the outcomes. Finally, the implementation of many
foreign policies is uncertain. Unlike domestic energy policy that may be enforced by
regulation, by the Environmental Protection Agency or the Federal Energy Regula-
tory Commission, for example, energy and foreign policy is often achieved through
softer channels like diplomatic influence, technical assistance, or financial incentive.
Decision Making Process
As presented in the discussion of Allison’s models of foreign policy decision making,
making up for the bounded rationality of decision makers is not the only goal of policy
analysis. While complexity, multiple objectives, and uncertainty are inherited from
both the energy system and the foreign policy decision, the decision making process is
dominated by foreign policy. At the intersection of energy and foreign policy, decisions
are rarely made within a single agency, but rather within the context of the National
Security Council shepherded by the National Security Staff. Because of the pervasive
nature of energy in the global political and economic system, many agencies have a
stake in an energy and foreign policy decision. However, their understanding of the
problem is very different.
Agencies provide different information, offer different alternatives, and hold dif-
ferent preferences. First, the energy information an agency has is shaped by its
connections and its mission. For example, the Department of Energy is likely to
have data collected from industry and the Department of State is likely to have data
passed on from ministries of foreign governments. When the data from different
agencies is incomplete or conflicts, it is not always clear how to proceed. Second,
the alternatives offered by an agency differs based on their interests, values, and re-
sources. For example, the U.S. Agency for International Development may promote
capacity building within a foreign ministry, while the Overseas Private Investment
Corporation and the Export-Import Bank suggest expanding opportunities for Amer-
ican investment. Third, the preferences demonstrated by the representatives of each
agency mirror preferences within their agency and favor policies that reinforce the
goals of their agency. This may be in part self-serving, but can also be explained by
the self-selection of individuals choosing to work for the part of the government that
CHAPTER 2. MODELING FOR FOREIGN POLICY DECISIONS 44
aligns with their personal values. The Department of State will be most concerned
with how a policy affects the diplomatic agenda. The Department of Defense will
be concerned with impacts on servicemen and military assets. The Environmental
Protection Agency will be tuned into the implications for the environment.
Models must also be designed to bring out the best in the interagency and guard
against the distortions to the decision basis predicted by organizational theory or
bureaucratic politics. This challenge points to the importance of thinking critically
about who is involved during model development, where is the model maintained
and used, and how different agencies engage the model before and during the intera-
gency discussions. For a model to support interagency decision making the different
information, alternatives, and preferences of each agency must be accommodated.
2.3.2 Structural changes to accommodate the dual nature
Structural changes must be made to energy models to accommodate foreign pol-
icy problems. These structural changes are necessary for two reasons. First, the
model must appropriately tradeoff the complexity of the system representation and
the method of uncertainty analysis conducted. Second, the approach to uncertainty
analysis must suit the National Security Council decision making process.
There is a trend in energy models toward increasing the detail and breadth of
the representation of the energy system. For foreign policy, this trend may be coun-
terproductive. In foreign policy, uncertain social, political, and geopolitical factors
such as the actions of other actors or the successful implementation of policy need
to be considered. Many of these cannot be represented convincingly as mathematical
expressions, but they can be represented as uncertainties. Shifting this complexity to
uncertainty analysis requires more sophisticated treatment of uncertainty than pre-
dictive scenario analysis, which is common in domestic energy policy analysis. Adding
this uncertainty, therefore, requires a simplified mathematical model. “The desired
level(s) of resolution in a model should be determined by the research strategy for
dealing with uncertainty (Bankes, 1993).” Choices in model design that would more
satisfyingly incorporate complexity are, therefore, in direct conflict with those that

CHAPTER 2. MODELING FOR FOREIGN POLICY DECISIONS 45
would incorporate uncertainty. Unfortunately, model design literature does not pro-
vide direction for how to tradeoff system verisimilitude with sophisticated treatment
of uncertainty.
Structural changes are also needed to integrate the model in the interagency de-
cision process. Simplifying the model may again be a good model design choice. To
be an effective tool for decision making, the model must be trusted and understood
by decision makers. Simplicity will facilitate communication. Transparency, which
may or may not come with simplicity, will be important to facilitate the diversity
of interagency perspectives. A more transparent model will make clear how differ-
ent information or preferences are affecting the policy decision. There is guidance
on unifying information and preferences from work on participatory policy analysis
(Hoppe, 1999b; Geurts & Joldersma, 2001). But that literature does not address the
role of simplification for communication or transparency much less for treatment of
uncertainty.
Thus far it is clear that while foreign policy, like energy policy, must manage
complexity, multiple objectives, and uncertainty, each of these characteristics takes on
a different nature at the intersection of energy and foreign policy. While energy models
can play a helpful role supporting these decisions, the models must be re-proportioned
to fit the expanded problem definition and associated challenges and to work within
a very different decision making process. But something more fundamental also must
be done. There must be a clear articulation of the role of model results as policy
analysis.
2.3.3 Philosophical changes to fit the dual nature
Policy analysis as a discipline emerged in response to the needs of policy makers
wishing to use what is known about a situation to evaluate alternative actions to
reach goals. In the tradition that knowledge is based on the logical interpretation of
natural phenomenon, policy analysis was initially considered the search for objective
truth. At that time it was accepted that scientific rationality could solve collective
problems (Lynn, 1999). In an antipositivist rejection of policy analysis as objective

CHAPTER 2. MODELING FOR FOREIGN POLICY DECISIONS 46
truth, subjective interpretation of societal perspectives was embraced in policymaking
(Torgerson, 1986; Lindblom, 1959). The relationship between science and politics has
continued to change. Today’s post-positivist understanding of policy analysis asserts
that while objectivity is the aim, there are implicit values and bias embedded in
every analysis (Hoppe, 1999a). While an analyst may strive for objective truth, the
analyst’s assumptions affect the conclusions of analysis.
While the philosophy behind policy analysis has changed in the past few decades, it
has affected the broad landscape of policy analysis activities differently. Mayer et al.
(2013) propose a comprehensive framework, reproduced in Figure 2.2, to organize
the diverse activities that are considered policy analysis. Using this framework the
policy analysis that takes place to support energy policy and foreign policy can be
contrasted. On each vertex of the hexagon is a different type of analysis that can be
distinguished by the methods of analysis, the role of analysts, and the qualities of
analysis that are desired. The edge of the hexagon represents the philosophy that is
supposed by these methods.
Figure 2.2: Framework to relate policy analysis styles reproduced from Mayer et al.(2013, p51)
Energy policy analysis has tended to resemble the “research and analyze” vertex
of the hexagon. Policy analysis is conducted by an independent scientist coming from
either the policy making agency or external academic institutions. The role of the
scientist is to be an objective researcher, synthesizing the facts and using them to

CHAPTER 2. MODELING FOR FOREIGN POLICY DECISIONS 47
explain how the modeled system behaves and where policies would intervene. The
policy analysis has a scientific quality and is evaluated in terms of its validity and
reliability. Riding the post-positivist philosophy of policy analysis, energy models
have expanded towards the “clarify values and arguments” vertex expanding thinking
into issues of ethics. This is especially true in climate policy analysis where there are
intra- and inter-generational distributions of costs and benefits to reason through.
Foreign policy analysis has traditionally been of the “design and recommend” va-
riety. Rather than a scientist, the analyst is conceived of as an independent expert
whose role is as an impartial advisor. The policy analysis produced is judged by its
policy relevance and whether the information is useable and action oriented. The
trend in foreign policy analysis is to diversify activities towards the “advise strategi-
cally” vertex. This type of policy analysis is conducted by a client advisor who more
explicitly makes recommendations based on the needs of the decision client. This
type of policy analysis is judged by its political effectiveness and its feasibility. In
foreign policy, the concern with workability has grown along with a recognition of the
importance of considering implementation during the policy formulation phase.
The edge between “research and analyze”and “design and recommend” is char-
acterized as a rational style. This rational style of policy analysis assumes that the
world is to a large extent empirically knowable and often measurable. Not surpris-
ingly, in this style of policy analysis the role of the analysis is to create knowledge.
The role of this knowledge in policy is prescriptive because of the belief that greater
insight into causes, effects, nature, and scale produces better policy. The edge be-
tween “design and recommend” and “advise strategically” is described as the client
advice style. Here different interests may be equally valid and qualitative information
plays an important role.
The framework clarifies the differences between the two kinds of policy analysis
contrasted, but it does not tell us how to reunite these divergent philosophies when
using a model to address questions at the intersection of energy and foreign policy.“If
we are to improve modeling for policy analysis, we must understand how it is that
insight can be produced by such means (Bankes, 1993).” When using a mathematical
model that was originally imagined as an energy model, one must be explicit about
CHAPTER 2. MODELING FOR FOREIGN POLICY DECISIONS 48
whether the model is a tool to “research and analyze,” to “design and recommend,” or
to “advise strategically.” The output of the model will have very different meanings if
the philosophy behind the analysis assumes the model produces objective knowledge
versus subjective, negotiated advice.
While both foreign policy and energy policy benefit from models that manage
complexity, multiple objectives, and uncertainty, the nature of those characteristics
differ in the two policy arenas. When energy and foreign policy are brought together
structural changes need to be made to models to accommodate the dual nature.
Because of computational and cognitive limitations, the model developer must decide
which characteristics require the most thorough treatment. But structural changes
are not sufficient. A model also must be reimagined to support the unique National
Security Council decision making process. In that environment, it must also be clear
what philosophy of policy analysis is operating.
2.4 Conclusion
There are a growing number of important policy decisions to be made at the intersec-
tion of energy and foreign policy. Scholarship on foreign policy decision making does
not provide advice on analytic tools to support decision making, but does provide
several views of the challenges that need to be overcome. Energy policy analysis has
a long history of using models for decision support, but when intersecting with foreign
policy the policy question takes on a new character that cannot simply be solved with
existing energy models.
Foreign policy is about decisions. A decision is defined by its decision basis:
the information, alternatives, and preferences united by a logic. Rational choice
theory expects a single decision maker to make a rational decision based on perfect
information, defined alternatives, and clear preferences. In reality surrounded by
complexity, decisions are made with bounded rationality. Uncertainty means there
is incomplete information. Alternatives are ambiguous and limitless. Multiple, often
conflicting objectives, mean that preferences are not clear.
CHAPTER 2. MODELING FOR FOREIGN POLICY DECISIONS 49
Foreign policy is further complicated because in the place of a single decision
maker is a unique interagency process synthesizing what is understood and making
recommendations through the National Security Council. Both organizational theory
and theories of bureaucratic politics predict that this decision making environment
distorts the decision basis in many meaningful ways. Analytical tools, like math-
ematical models, can be used to assist a decision maker with complexity, multiple
objectives, and uncertainty, but it has not yet been articulated how to use such an
analytical tool to strengthen the interagency process and not add fuel to the fire.
Mathematical models have been used successfully in energy policy analysis, in part
because they have employed well-developed methods to manage complexity, multiple
objectives, and uncertainty. But energy policy decision making is typically not an
interagency process.
For energy models to be useful tools for policy analysis at the intersection of
energy and foreign policy, structural changes will need to be made to the models to
incorporate both the energy and foreign policy attributes of the policy problem. These
structural changes will include judgments about how to tradeoff the sophistication
of techniques for dealing with the complexity, multiple objective, and uncertainty
characteristics of the problem and a way to facilitate diverse information, alternatives,
and preferences of different agencies. Just as importantly, the philosophy of policy
analysis behind the energy model must be articulated as the role of the model will
affect the proper interpretation of the results. This dissertation will explore the
adaptations needed for energy models to fit a foreign policy question: How should
verisimilitude and sophistication of uncertainty analysis be traded off? In what ways
will the model structure help or hinder its use in the interagency process? What is
the philosophy guiding model use?

Chapter 3
Energy Poverty and Climate
Change
Not everything that can be counted
counts, and not everything that
counts can be counted.
William Bruce Cameron, 1963
Chapter 2 singled out a special class of policy problems at the intersection of
energy and foreign policy. These problems are intrinsically energy questions and
foreign policy concerns. The substantive elements of the policy problem are inherited
from both policy domains, and this blending requires new analytical tools to support
decision making. To effectively support foreign policy decision making existing energy
modeling approaches will require structural and philosophical modifications. This
chapter lays out a current policy problem at the intersection of energy and foreign
policy that will allow a concrete exploration as to what model adaptations are needed,
which I describe in further detail in subsequent chapters.
Should the United States promote expanded use of natural gas in low and
middle income countries to reduce energy poverty and limit greenhouse
gas emissions?
50
CHAPTER 3. ENERGY POVERTY AND CLIMATE CHANGE 51
The global energy system and the United States national interest overlap in many
ways. Among them, are linkages to global climate change and global poverty. Global
energy consumption produces two thirds of global greenhouse gas emissions. Because
of the growing concentration of greenhouse gases in the atmosphere and their effect
on the climate, the way society produces and consumes energy is increasingly con-
strained. Arresting dangerous anthropogenic interference with the climate will require
net zero greenhouse gas emissions by 2100 (IPCC, 2014). While climate change is
not an existential threat to the United States, it will have consequences for basic,
self-interests - domestic economic growth and national security.
In addition to the ethical reasons to avoid altering the climate, there are several
secondary, self-interested reasons which motivate policymakers. Climate change is a
matter of collective interest because of the global nature of greenhouse gas emissions.
While the literature on climate impacts is nascent, climate change is expected to re-
duce gross domestic product as resources are diverted to adapt to climate change by
raising roads, strengthening sea walls, and cleaning up after natural disasters. Cli-
mate change is an existential threat to many countries and the livelihoods of billions
of people. Climate change will reduce species diversity, exacerbate famine-causing
droughts, intensify devastating storms, and encourage human migration from parts
of the world that cannot adapt to changes. The U.S. Department of Defense de-
scribes climate change as a threat multiplier “that will aggravate stressors abroad
such as poverty, environmental degradation, political instability, and social tensions -
conditions that can enable terrorist activity and other forms of violence (DoD, 2014).”
Like climate change, global socio-economic development is also in the national
interest connected to a basic, self-interest in economic growth and national security.
For decades, the United States government has engaged in diplomacy, lending, and
foreign aid to foster growth in low and middle income countries1 to raise the stan-
dards of living for the global poor. As energy is a fundamental input for economic
1The World Bank makes distinctions between countries based on income because of the impre-cision of the more commonly used term - developing country. For clarity, countries are classifiedbased on whether they are high income, upper middle income, lower middle income, or low incomecountries. In this paper, developing countries will refer to both low and middle income countriesunless a particular distinction is being made that builds on the different circumstances of low andmiddle income countries.

CHAPTER 3. ENERGY POVERTY AND CLIMATE CHANGE 52
development, it has been a central part of the strategy to raise people out of poverty.
Energy poverty is the lack of “a basic minimum threshold of modern energy ser-
vices for consumption and productive uses (Advisory Group on Energy and Climate
Change, 2010).2 ” The energy poor include 2.9 billion people that cook with tradi-
tional biomass fuels, 1.1 billion without a connection to an electricity network, and a
further 1 billion people with inadequate electricity (IEA and World Bank, 2015; IEA,
2011). Table 3.1 summarizes the distribution of the energy poor globally.
Energy poverty is a barrier to development (Modi et al., 2005; Advisory Group
on Energy and Climate Change, 2010; UNDP and WHO, 2009), economic growth
(Granoff et al., 2015; Elias & Victor, 2005), and international security (Sovacool,
2014; Bazilian et al., 2010b). Without reliable electricity in the home, life comes to a
standstill every night when the sun goes down. Children study by dim candlelight or
kerosene lamp, and many schoolchildren attend school without electricity (Practical
Action, 2013). Women and children spend hours each day collecting sticks or dung
to cook over inefficient fires, leaving little time for going to school or starting a busi-
ness (WHO, 2006). Indoor air pollution from kerosene lighting and cooking without
modern fuels results in 4 million premature deaths each year and countless respira-
tory ailments (WHO, 2006). It is estimated that use of polluting fuels like wood and
coal cost society $123 billion each year in terms of health, environmental, and eco-
nomic costs (Bhatia & Angelou, 2015a). A third of health facilities in Africa do not
have electricity and even more have an unreliable electricity supply that compromises
refrigeration of vaccines and medicines (Practical Action, 2013). Energy shortages
are an impediment to economic growth in agriculture, manufacturing, and enterprise
(Practical Action, 2010; Asafu-Adjaye, 2000; Ramachandran et al., 2009; G8 Energy
Ministers, 2009). Poverty and lack of education create a vicious cycle leading to
unemployment, idleness, and social discontent. While there is weak evidence that vi-
olent extremism is caused by poverty, as many violent attacks are perpetrated by the
2Energy services are the desired outputs of energy use: light, boiling water, heat, refrigeration,mechanical power, mobility, communication etc. Modern energy often refers to non-solid fuels thatare convenient and not harmful to human health, like electricity, natural gas, and liquified petroleumgases. Consumptive energy services are those like light, air conditioning, and cooking which areconsumed for well-being. In contrast, productive energy services enhance productivity and generatesincome like agricultural or food processing equipment.
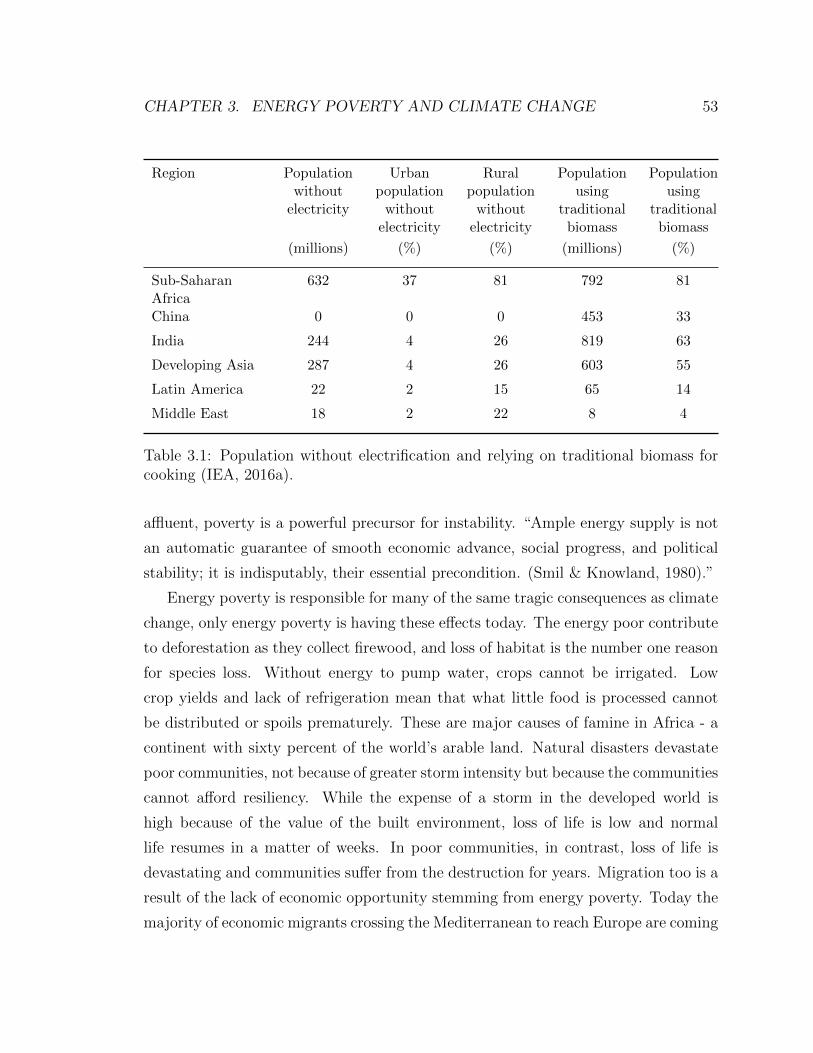
CHAPTER 3. ENERGY POVERTY AND CLIMATE CHANGE 53
Region Populationwithout
electricity
Urbanpopulation
withoutelectricity
Ruralpopulation
withoutelectricity
Populationusing
traditionalbiomass
Populationusing
traditionalbiomass
(millions) (%) (%) (millions) (%)
Sub-SaharanAfrica
632 37 81 792 81
China 0 0 0 453 33
India 244 4 26 819 63
Developing Asia 287 4 26 603 55
Latin America 22 2 15 65 14
Middle East 18 2 22 8 4
Table 3.1: Population without electrification and relying on traditional biomass forcooking (IEA, 2016a).
affluent, poverty is a powerful precursor for instability. “Ample energy supply is not
an automatic guarantee of smooth economic advance, social progress, and political
stability; it is indisputably, their essential precondition. (Smil & Knowland, 1980).”
Energy poverty is responsible for many of the same tragic consequences as climate
change, only energy poverty is having these effects today. The energy poor contribute
to deforestation as they collect firewood, and loss of habitat is the number one reason
for species loss. Without energy to pump water, crops cannot be irrigated. Low
crop yields and lack of refrigeration mean that what little food is processed cannot
be distributed or spoils prematurely. These are major causes of famine in Africa - a
continent with sixty percent of the world’s arable land. Natural disasters devastate
poor communities, not because of greater storm intensity but because the communities
cannot afford resiliency. While the expense of a storm in the developed world is
high because of the value of the built environment, loss of life is low and normal
life resumes in a matter of weeks. In poor communities, in contrast, loss of life is
devastating and communities suffer from the destruction for years. Migration too is a
result of the lack of economic opportunity stemming from energy poverty. Today the
majority of economic migrants crossing the Mediterranean to reach Europe are coming

CHAPTER 3. ENERGY POVERTY AND CLIMATE CHANGE 54
from African countries with dismally low rates of electrification. Migration, social
unrest, and political illegitimacy create an environment that supports extremism.
The potential for regional instability and global terrorism is a concern for the United
States.
As a matter of foreign policy, the United States works bilaterally with foreign
governments and in partnership with the international community, including through
multilateral development banks, to address energy poverty and climate change. In
recognition of the threat energy poverty poses to human dignity, economic develop-
ment, and global security, eliminating energy poverty has moved to the forefront of
international policy (Bazilian et al., 2010a; UNGA, 2012, 2014). The United Nations’
Sustainable Development Goal 7.1 is the culmination of international commitment to
address energy poverty establishing a goal to achieve universal access to affordable,
reliable, and modern energy services by 2030 (UNGA, 2015). However, without new
efforts to alleviate energy poverty, the absolute number of energy poor is expected to
rise as population growth outpaces investment in energy infrastructure (IEA, 2011).
In parallel, the United States cooperates with all nations to address climate change
through the United Nations Framework Convention on Climate Change (UNFCCC).
The United States was instrumental in shaping the most recent international climate
agreement that is comprised of nationally determined contributions intended to keep
a global temperature rise this century well below 2 degrees Celsius.
While both climate change and energy poverty are current areas of foreign policy
engagement, some of the policy is muddled. As I will explain in the following sections,
reducing energy poverty and mitigating climate change are in conflict with each other.
The conflict is driven by the fuel mix and the needs of the energy poor. Investment
in different types of energy supply strain the climate-poverty tension to a greater or
lesser degree providing a lever for U.S. foreign policy intervention.
The United States already uses several foreign policy tools to influence energy
investment decisions of other countries. The United States encourages investment
in foreign countries through the Export-Import Bank (Ex-Im), the Overseas Private
Investment Corporation (OPIC), the Foreign Commercial Service, and the diplo-
matic support of the State Department’s Foreign Service. Through the U.S. Agency
CHAPTER 3. ENERGY POVERTY AND CLIMATE CHANGE 55
for International Development (USAID) and the Millennium Challenge Corporation
(MCC) the United States grants funding to support energy projects directly. The
Departments of State, Energy, and Interior and USAID provide technical assistance
to foreign governments at every stage of energy investment. The United States is
also a major contributor to several multilateral development banks - the World Bank
Group, the Inter American Development Bank, the Asian Development Bank, the
African Development Bank, and the European Bank for Reconstruction and Devel-
opment - organizations which provide loans, risk guarantees, grants, and technical
assistance to foreign governments to influence the nature of energy investment.
In the past the United States has used these policy levers specifically to change
the fuel mix in foreign countries by providing differentiated support to coal-fired, gas-
fired, and renewable electricity investment. Ex-Im’s charter mandates support for
renewable energy that is given in the form of fast-tracked loans and credit guarantees.
For the past five years, OPIC, the U.S. development finance institution, has financed
more than $1 billion of renewable energy projects each year. Conversely, under the
Climate Action Plan, the United States instituted a policy to ban public finance
for coal. By reducing public finance, it was hoped that fewer coal fired power plants
would be built in developing countries, and, therefore, fewer greenhouse gas emissions
would be released into the atmosphere.
While policy to support renewable energy and discourage coal has been articu-
lated, the policy on natural gas is ambiguous. Unlike the outright ban on coal finance,
agencies have different guidance about investment in natural gas. For example, OPIC
must ratchet down the greenhouse gas impact of its investment portfolio over time:
thirty percent before 2020 and fifty percent before 2025. This effectively limits OPICs
annual investment in natural gas to one small (about 300 MW) power plant each year.
On the other hand, Power Africa, launched in 2013 to support investment in electric-
ity generation capacity across Africa through finance and technical assistance, intends
to meet half of its 30,000 MW target with natural gas (Power Africa, 2015).
Policymakers do not agree on the proper role for natural gas in low and middle
income countries. On one side of the argument, some advocate that as a fossil fuel
natural gas should be banned to avoid locking in infrastructure. Others believe that
CHAPTER 3. ENERGY POVERTY AND CLIMATE CHANGE 56
the environmental impacts of natural gas are an improvement over coal, and that
electricity from natural gas is more affordable, reliable, and versatile than from re-
newable energy. This side argues that U.S. policy should not only permit investment
in natural gas, but should promote it to prevent the expansion of coal use.
The status quo - a diversity of policies on natural gas - is an impediment to
investment. Ambiguity about the long-term role of gas stalls investment in natural
gas supply, distribution, and power generation. It also exposes investors in renewable
energy projects to risk which raise their cost of capital. In both ways hesitancy
leads to delayed investment in energy supply, which prolongs energy poverty. In
the meantime countries continue to invest in coal-fired generation that will lock in
avoidable emissions. Lack of clarity about the future for natural gas in low and middle
income countries, therefore, undermines both climate and development policy.
Clarifying the role of natural gas is an important policy decision. This chapter ex-
plains two obstacles to defining a coherent policy. Section 3.1 reviews ongoing debates
among energy poverty scholars and practitioners. These debates culminate in a dis-
agreement about the extent of the conflict between policies to mitigate climate change
and reduce energy poverty. The analysis presented here shows how lack of knowledge
impedes investment and prolongs energy poverty. Section 3.2 presents a framework
to evaluate energy supply technologies while confusion about the policy conflict per-
sists, and applies the framework to expose the risks and opportunities for developing
countries investing in natural gas. Natural gas is found to be a promising fuel for
reducing energy poverty, but a greater understanding of the relative importance of
market and technological uncertainties is needed to know whether an investment in
natural gas delivers net benefits in the long-term.
3.1 Conflict between national interests
In 2012 the UN launched the Sustainable Energy for All initiative setting out the goal
to 1) ensure universal access to modern energy services, 2) to double the share of re-
newable energy in the global energy mix, and 3) double the global rate of improvement
in energy efficiency by 2030 (UNGA, 2012). Similarly in 2015, the UN Sustainable
CHAPTER 3. ENERGY POVERTY AND CLIMATE CHANGE 57
Development Goals set targets for energy and climate in support of socio-economic
development.3 These are high profile examples of the simultaneous pursuit of climate
change mitigation and economic development. If you observed the political processes
and organizational efforts, you might conclude that climate and development issues
peacefully coexist. Each policy problem engages a different cadre of government offi-
cials, academics, and civil society advocates. If the two goals are independent, that
is one goal may be achieved without endangering the other, then this division of
expertise does not create a problem. However, as will be discussed in this section,
these policy issues are not independent. Solutions must be considered based on their
impact on both goals.
Despite recognition of both the ills caused by a lack of energy and the commitment
to increase access to energy, there is disagreement on what is required to eliminate
energy poverty. There is no universal metric for energy poverty, and understanding
about the amount of energy needed to escape energy poverty and the attributes of en-
ergy supply to meet the needs of the energy poor is limited. These unresolved debates
prevent consensus on whether reducing energy poverty conflicts with climate change
mitigation creating a fragile foundation for a discussion about the role of different
energy technologies and fuels in the fight against energy poverty. Indecision about
which kinds of energy supply investments are appropriate affects national policies for
infrastructure and subsidies for fossil fuels and renewable energy. The lack of clarity
creates new pressures for policymakers allocating their capacity and resources. Policy
uncertainty inflates private investors’ calculations of risk, and higher risk delays in-
vestment and raises the cost of capital prolonging energy shortages and perpetuating
energy poverty. This section synthesizes the ongoing scholarly debates that under-
pin continued controversy about the role of different fuels and energy technologies in
addressing energy poverty.
3Goal 7.1 is to ensure universal access to affordable, reliable and modern energy services by 2030;Goal 13.2 is to integrate climate change measures into national policies, strategies, and planning.

CHAPTER 3. ENERGY POVERTY AND CLIMATE CHANGE 58
3.1.1 How should we measure energy poverty?
Energy poverty is the lack of “a basic minimum threshold of modern energy ser-
vices for consumption and productive uses (Advisory Group on Energy and Climate
Change, 2010).” While there is consensus on this as a definition, there is no universal
approach to measuring it because there is no single understanding of what it means
to be below the energy poverty line. Unlike nutritional poverty, which can be defined
in terms of a minimum daily caloric intake, there is no absolute reference for what
fulfills a minimum level of basic energy needs.
In the absence of a theoretical basis for energy poverty, there are three major chal-
lenges to constructing a robust metric. First, unlike measurements of income poverty
- like the World Bank’s $1.90 per day, a relative measure based on the purchasing
power parity of the poorest countries in the world denominated in currency (Ferreira
et al., 2015) - there is no common, fungible unit of energy from which people derive
utility directly. While money, can be spent flexibly to meet a household’s needs,
an excess of one energy service, like light, cannot meet the need for another energy
service, like boiling water.
Second, there is no consensus on which energy services are basic - essential for
livelihood. Light and heat are surely basic energy services, but there is no agreement
about other household or non household uses of energy. Basic household uses of energy
could include mobility, refrigeration, or mechanical power that can bring crops to
market, pump water, sharpen farm equipment, and process crops (ex. corn threshers,
rice dehuskers, presses, etc.).4 The agricultural sector has tremendous potential to
drive economic growth and alleviate extreme poverty for rural farmers who account
for three quarters of the extreme poor (UNDP, 2007). “Improving the productivity,
profitability and sustainability of smallholder farming is the main pathway out of
poverty in using agriculture for development (World Bank, 2008).” Energy services
to achieve development outcomes are also needed outside the household in community
facilities like hospitals and schools and to drive the broader economy.
4Practical Action (2010) and Sovacool et al. (2012b) provide a review of rural energy needsbeyond cooking and lighting.
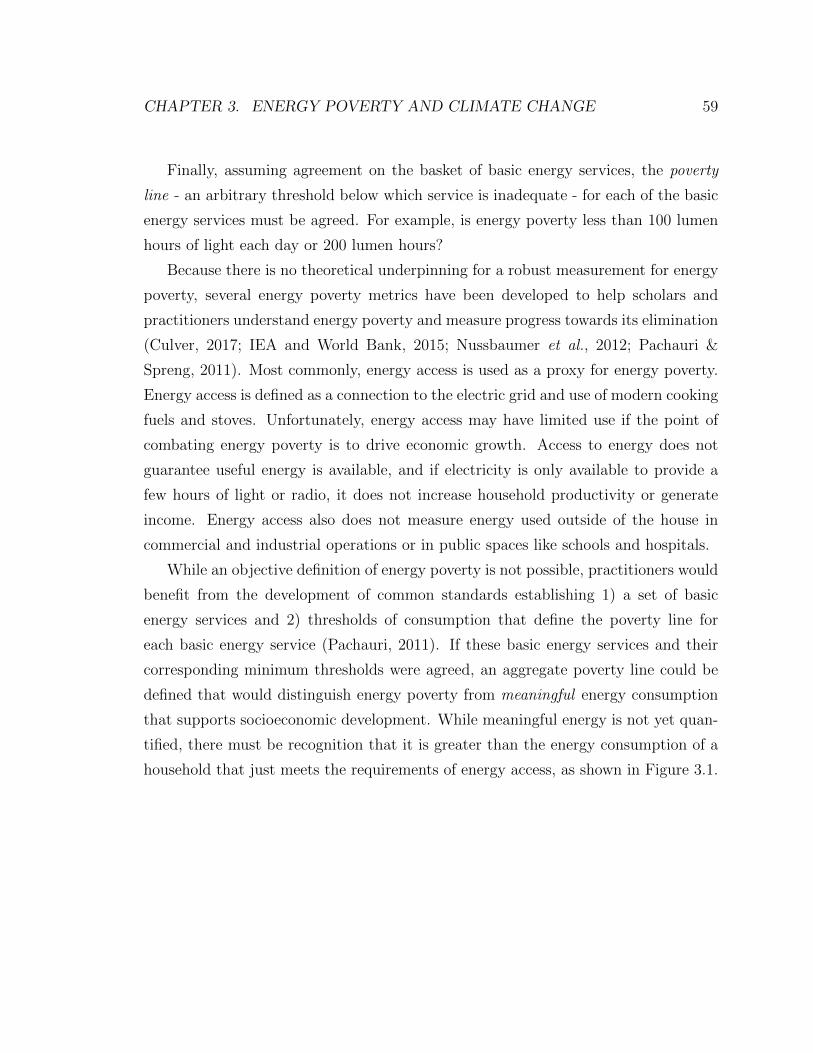
CHAPTER 3. ENERGY POVERTY AND CLIMATE CHANGE 59
Finally, assuming agreement on the basket of basic energy services, the poverty
line - an arbitrary threshold below which service is inadequate - for each of the basic
energy services must be agreed. For example, is energy poverty less than 100 lumen
hours of light each day or 200 lumen hours?
Because there is no theoretical underpinning for a robust measurement for energy
poverty, several energy poverty metrics have been developed to help scholars and
practitioners understand energy poverty and measure progress towards its elimination
(Culver, 2017; IEA and World Bank, 2015; Nussbaumer et al., 2012; Pachauri &
Spreng, 2011). Most commonly, energy access is used as a proxy for energy poverty.
Energy access is defined as a connection to the electric grid and use of modern cooking
fuels and stoves. Unfortunately, energy access may have limited use if the point of
combating energy poverty is to drive economic growth. Access to energy does not
guarantee useful energy is available, and if electricity is only available to provide a
few hours of light or radio, it does not increase household productivity or generate
income. Energy access also does not measure energy used outside of the house in
commercial and industrial operations or in public spaces like schools and hospitals.
While an objective definition of energy poverty is not possible, practitioners would
benefit from the development of common standards establishing 1) a set of basic
energy services and 2) thresholds of consumption that define the poverty line for
each basic energy service (Pachauri, 2011). If these basic energy services and their
corresponding minimum thresholds were agreed, an aggregate poverty line could be
defined that would distinguish energy poverty from meaningful energy consumption
that supports socioeconomic development. While meaningful energy is not yet quan-
tified, there must be recognition that it is greater than the energy consumption of a
household that just meets the requirements of energy access, as shown in Figure 3.1.
CHAPTER 3. ENERGY POVERTY AND CLIMATE CHANGE 60
Figure 3.1: Energy consumption above some as yet unestablished energy poverty lineis meaningful. Energy access does not mean an end to energy poverty.
3.1.2 Is it possible to leapfrog the grid?
The absence of a universal metric for energy poverty is not purely an academic matter.
The unresolved distinction between meaningful energy and energy access is contro-
versial because it has implications for energy investment. If energy access is used as
the metric for energy poverty, then energy supply need not meet a high bar of quality.
Extending the electricity grid has historically been the primary approach for re-
ducing energy poverty. The grid delivers high quality energy that can be used in
many applications. However, grid extension is slow, costs of new connections are
high, and for technical and economic reasons the grid may never reach remote rural
areas. Improvements in standalone distributed energy technologies, like solar home
systems have cost effectively brought light and communication to many. These sys-
tems have done a great deal to improve the quality of life in poor communities, and
there is a strong appeal to provide households with renewable energy. The success
of these systems and continued cost declines in renewable energy technology has lead
some scholars to argue that low-cost renewables will allow low and middle income
countries to leapfrog the grid - avoid investments in grid-based fossil fuel generation
and rely on distributed renewable electricity to provide sustainable energy (Levin &
Thomas, 2016).

CHAPTER 3. ENERGY POVERTY AND CLIMATE CHANGE 61
Whether it is feasible to leapfrog the grid depends on the metric for energy poverty.
While standalone systems can provide energy access, it is unrealistic to deliver mean-
ingful energy services to the energy poor with distributed renewables alone. Lighting
and phone charging can be achieved through commercially viable solar home systems
and super efficient LEDs, but high power and higher energy applications like refrig-
erators, irons, and water pump cannot realistically be delivered (Lee et al., 2016).
In the future, more super efficient appliances will be available (Global LEAP, 2016).
However, equipment for productive uses in agriculture and enterprise has not been a
focus of innovation.
3.1.3 Is there an ambition gap?
Delivering adequate energy to provide basic, minimum energy services is a much
greater task than expanding electricity connections or providing technologies that
deliver a subset of energy services. While some argue small, distributed systems pro-
viding light and phone charging are an important first step in building customers that
will expand their energy consumption over time (Craine et al., 2014). Others think
that a focus on energy access is directing focus away from activities that will promote
development. In an ongoing debate about the aims of energy policies and investments
in developing countries, Bazilian & Pielke (2013) warn against the possibility that uni-
versal energy access could be achieved without attendant benefits of socioeconomic
development, something the authors attribute to an “ambition gap.” The ambition
gap, in energy units, is the difference between a meaningful level of energy consump-
tion, required to realize development targets, and the minimal electricity used when
households are first connected to the grid or standalone system. In terms of institu-
tions, the ambition gap is the difference in policies and investments needed to drive
economic growth and those needed to deliver 50 -100 kWh/year to the energy poor.
Institutions that spend their efforts on incremental solutions may only deliver poverty
management rather than the transformational policies that could deliver sustainable
development (Bazilian & Pielke, 2013). “Low ambition risks becoming self-fulfilling,
because the way we view the scale of the challenge will strongly influence the types of
CHAPTER 3. ENERGY POVERTY AND CLIMATE CHANGE 62
policies, technologies, levels of investment and investment vehicles that analysts and
policy makers consider (Bazilian & Pielke, 2013).”
Depending on assumptions about the scope of basic energy services the ambition
gap can be very large. In the United States, the basket of energy services that might
be considered basic is expansive, and the threshold of what would be minimal usage
is relatively high. This is reflected in average annual per capita energy use of 13,000
kWh/year (BP, 2016). In contrast, in Germany that number is 8,000 kwh/year.
Germany likely has the same basket of basic services, but greater energy efficiency.
In North Africa annual per capita consumption is less than 2,000 kWh/year which
likely reflects a smaller basket of basic energy services and less usage. However, even
using North Africa as the aspirational level of development suggests a very large
ambition gap when compared to the 100 kWh/year often assumed for those granted
energy access (IEA, 2015; Modi et al., 2005; Bazilian et al., 2014).
The ongoing debate about the normative level of per capita demand needed to
escape energy poverty is compounded by a lack of understanding about what is driving
energy demand in developing countries today. Elias & Victor (2005) review the
evidence for causality between energy and growth at the national level where the
evidence is the strongest, but despite the strength of the relationship it is not clear
if energy poverty is a symptom or a cause of poverty. While energy and economic
development are inextricably linked, the connections between them in developing
countries are complex and imperfectly understood.
Demand growth in low and middle income countries has been consistently un-
derestimated because of the lack of understanding about the relationship between
energy demand growth and income level. Wolfram et al. (2012) has shown that the
relationship between energy demand and income growth changes based on which seg-
ment of the population is benefiting from economic growth. If the bottom income
quartile grows wealthier, then energy demand grows faster than per capita income.
If the top income quartile becomes wealthier, then energy demand grows half as fast
as per capita income. The energy demand of a rising middle class is also the subject
of greater investigation. As incomes rise households are likely to buy additional ap-
pliances for daily comforts and productive uses. Not only will this cause household
CHAPTER 3. ENERGY POVERTY AND CLIMATE CHANGE 63
energy demand rise, but the economy will need additional energy to produce and
transport more goods. Policies for pro-poor growth, those that target people living in
poverty, may result in faster energy demand growth than is currently being forecast
(Gertler et al., 2016; Lee et al., 2016).
3.1.4 Is there a conflict between reducing energy poverty and
mitigating climate change?
The connection between a metric for energy poverty and the implications for energy
supply and demand is significant for climate change. Without a theoretical basis for an
energy poverty metric or an agreed standard, there is significant freedom in imagining
the energy system in low and middle income countries. The disagreement about
the viability of leap-frogging prevents consensus on the contribution renewables will
make to the energy supply in low and middle income countries (Casillas & Kammen,
2010; Deichmann et al., 2011; IEA, 2011; Szabo et al., 2013). This results in differing
assumptions about the emissions intensity of economic growth. Similarly, assumptions
about per capita energy consumption will drive the scale of emissions that come with
development. These assumptions alone determine whether there is a conflict between
policies to reduce energy poverty and mitigate climate change.
There are differences of opinion on whether energy poverty can be solved indepen-
dently from climate change. Energy modeling to evaluate potential climate policies
show these policies do not deliver universal energy access without additional targeted
interventions directed to the energy poor (IEA, 2011; Lucas et al., 2015; Calvin et al.,
2013). In fact, some studies show that energy policies directed at climate mitigation
raise the price of energy and, therefore, reduce consumption in the developing world
(Calvin et al., 2013). This suggests a conflict between climate change mitigation and
energy poverty reduction. In contrast, energy modeling to investigate energy poverty
concludes that universal access to energy can be provided to billions of people with
poor or no access to energy today with a negligible impact on emissions (Chakravarty
& Tavoni, 2013; Pachauri et al., 2013; Bazilian et al., 2012; IEA, 2011; Sanchez,
2010). While this implies that energy poverty and climate change policies could be
CHAPTER 3. ENERGY POVERTY AND CLIMATE CHANGE 64
set independently of one another, these conclusions depend on assumptions related
to the debates just reviewed. These studies assume 1) the energy poor will consume
a minuscule amount of energy and 2) the energy supply will ‘leapfrog’ fossil fuel use
in favor of carbon-free solutions. Modeling results that suggest that universal energy
access can be achieved with minimal emissions are sensitive to assumptions about
energy consumption. The IEA, which assumes rural and urban areas’ annual per
capita consumption will be 50 kWh and 100 kWh respectively, projects a 1% increase
in global energy demand and a 0.7% increase in emissions (IEA, 2011). Sanchez
(2010) found a 1.6% increase in global emissions, but assuming a slightly larger 35
kilograms of LPG and 120 kWh of electricity per capita each year. Chakravarty &
Tavoni (2013) use a much higher 10GJ per capita (roughly 2700kWh) and find a 7%
increase in global energy demand and increased emissions.
One’s beliefs about the amount of energy the energy poor will or should aspire to
consume in the future drives projections of global emissions. The energy required to
support even meager development opportunities for the energy poor is considerably
more than the energy associated with providing household energy access. Acknowl-
edging the amount of energy required to meaningfully reduce energy poverty bursts
the illusion of leapfrogging and makes it of utmost importance to consider other ways
to scale energy supply while restraining climate forcing emissions. The consequence
of an unrealistic assessment of the carbon intensity of supply is a miscalculation about
global emissions. A misunderstanding of the scale of demand may also lead to overly
optimistic conclusions about future greenhouse gas emissions. Underestimates in de-
mand may lead to underinvestment in supply resulting in future shortages or price
spikes that are particularly painful for the poor (Wolfram et al., 2012). Without a
proper view of energy demand, supply decisions may result in poverty management,
undermining the original development goal.
The lack of a universal metric for energy poverty and assumptions about en-
ergy supply and demand have important implications for investment and institutions.
Without an accurate estimation of basic energy services and the poverty line for each,
an important discussion of the scale of energy infrastructure and the environmental
and climate impacts is preempted. “If one assumes that billions will remain with

CHAPTER 3. ENERGY POVERTY AND CLIMATE CHANGE 65
levels of energy consumption an order of magnitude less than even the most mod-
est definition of modern access, then one can understand the oft-repeated claim that
universal energy access can be achieved with essentially no increase in the global
emissions of carbon dioxide (Bazilian & Pielke, 2013).” Those that set comparatively
high goals for energy consumption and those that expect much higher demand than
currently forecast, must grapple with how to attract investment to adequately supply
energy that is both meaningful for the energy poor and low-carbon.
3.2 Risks and opportunities for natural gas
In the last section, I established there is a conflict between mitigating climate change
and reducing energy poverty. The size of the conflict is obscured by things unknown
about the present and unknown about the future. Climate change and energy poverty
cannot be pursued independently. Strong, coordinated action will be required to
give investors clear, long-term policy signals to reduce investment risk. Incomplete
understanding of energy poverty results in disagreement about which fuels and energy
technologies to invest in to reduce energy poverty. Yet, investment in energy supply
cannot be delayed while more work is done to improve our understanding. How can
energy supply investments be made now with both goals in mind? In this section I
present a framework, based on the literature, for evaluating the appropriateness of
different energy solutions for meaningfully reducing energy poverty, and apply the
framework to assess the prospects for natural gas to contribute to meaningful and
sustainable reductions in energy poverty.5
5The paper highlights some unique opportunities and challenges to the viability of natural gasas a means of reducing energy poverty. There are many more obstacles facing expansion of energyin low and middle income countries through the grid or through mini-grid technologies that are notunique to natural gas. These challenges are common to all fuels and energy technologies that arebeing developed to serve the energy poor. Similarly, there are many opportunities that will havesignificantly expand energy supply in every sector. The absence of a discussion of these issues doesnot reflect their unimportance. Each of these topics is the subject of considerable work that couldnot be treated adequately here: Pay-as-you-go energy services (Moreno & Bareisaite, 2015); Superefficient appliances (Phadke et al., 2015; Global LEAP, 2015; Buskirk, 2015); Targeted assistanceprograms (Rawlings & Rubio, 2005; et al. Dhand, 2014); Governance (Desai & Jarvis, 2012); Pric-ing; Finance (SE4ALL, 2015); No credit sector serving poor (Karlan et al., 2014); Utility viability

CHAPTER 3. ENERGY POVERTY AND CLIMATE CHANGE 66
3.2.1 Six attributes of energy supply to reduce energy poverty
As modern energy services, especially for productive uses, cannot be measured and
aggregated coherently, the attributes of energy required to support meaningful energy
services can be assessed instead (Bhatia & Angelou, 2015a; Practical Action, 2014).
Energy should be adequate, available, convenient, affordable, clean-burning, and low-
emission.
• Adequate: Good enough energy? Adequate energy means it is capable of deliver-
ing the needed energy service. In electricity generation, adequacy is measured in
terms of power capacity and voltage stability; for cooking and heat, adequacy is
measured in terms of the heat rate. Systems that are designed to deliver lighting
or phone charging services are not adequate to operate high power appliances.
• Available: Enough energy? Available energy is obtained or used at a national
or wholesale level. In the power sector, availability is measured by the number
of hours of electricity generated each day, particularly hours in the evening
for household and during the working day for businesses. Fuel availability is
measured for energy services provided from fuels like cooking, heating, and
transportation.
• Convenient: Around when needed? Convenient energy occurs in a place and
time that is useful for the final customer. The distribution or collection of a
fuel or energy carrier is central to convenience. The proximity of an electric-
ity connection and the number of disruptions each day are distribution issues
that affect convenience for the consumer. Cooking and heating also require
distribution networks that are proximately located and reliable.
• Affordable: Cheap enough? Affordable energy is determined in both absolute
and relative terms. When a consumer has multiple supply options the afford-
ability of energy is relative to the alternative, for example, whether LPG is
competitive with firewood. For the global poor, especially, energy must also be
(Trimble, 2016; Eberhard et al., 2011); Technology standards; Fossil fuel and fertilizer subsidies(Coady et al., 2015a,b; Victor, 2009); Grid extension and connection policy.

CHAPTER 3. ENERGY POVERTY AND CLIMATE CHANGE 67
inexpensive in an absolute sense on a unit basis such as dollars per kilowatt
hour.
• Clean-burning: Degrading the air? Clean-burning energy does not degrade air
quality and is, therefore, not harmful to human health. Any combustion activi-
ties whether for power generation or heat, should be evaluated on the resulting
ambient or indoor air pollution. Energy that lowers air quality endangers the
well-being and productivity of the energy poor.
Together these first five attributes reflect the idea that a sufficient quantity of en-
ergy must be delivered when it is needed, cleanly and conveniently, at a low enough
price and with enough quality to support the desired application, for example, to op-
erate household appliances and farm equipment. However, eliminating energy poverty
by 2030 will only be sustainable, if the efforts to address energy poverty are carried
out within a broader international commitment to mitigating climate change. There-
fore, there is a sixth attribute of energy supply that can meaningfully reduce energy
poverty. Investments that are not low-emission will exacerbate climate change in-
creasing the number of global poor and working against the initial goals of increasing
development, growth, and security.
• Low-emission: Changing the climate? To meet climate mitigation targets, mid-
dle and low income countries need to rapidly reach their peak emissions and
then begin to reduce them. This emissions trajectory will conflict with coun-
tries’ aspirations for economic growth if energy supply is not low-emission.
The poor are particularly susceptible to the physical impacts of climate change.
Those lacking access to modern energy services will find it all the more difficult to
adapt to drought, flood, and heat-waves that will cripple agriculture, contribute to
further epidemics, and increase mortality (Birol, 2014). Even with a rise of only 2◦C
in global mean temperature, changes to the environment after 2030 may result in
sending 720 million poor people back into poverty by degrading human health and
the environment (Granoff et al., 2015).
Investments in energy supply options that do not provide all six attributes result
in energy services that are either incremental or unsustainable.
CHAPTER 3. ENERGY POVERTY AND CLIMATE CHANGE 68
3.2.2 Natural gas and energy poverty
Because of the conflict between energy poverty and climate change policy goals, nat-
ural gas is being considered as an opportunity to balance the tension. Using the six
attributes of meaningful and sustainable energy supply defined, this section surveys
the contribution natural gas could make to reducing energy poverty. The chapter will
evaluate the adequacy of natural gas in urban electricity, rural electricity, cooking,
heat, petrochemicals, and transportation; the role of global resources and technology
in the availability of gas; the role of distribution infrastructure in the convenience
of natural gas; the role of markets and technology in the affordability of gas; the
clean-burning quality of natural gas; and the life-cycle emissions of natural gas.
Adequate
Natural gas6 is a versatile fuel - fully adequate for centralized power generation,
distributed power generation, cooking, household heating, industrial process heat,
petrochemical production, and transportation.
Natural gas is used to generate electricity for households and industry connected
to the electricity grid. Improving the quality of grid electricity will promote growth
and development. Households and industries in urban areas are expected to grow and
will account for most of global income growth (Deichmann et al., 2011; New Climate
Economy, 2014; World Bank, 2010). Solutions that leverage the existing grid may
also be the best way to address the energy poverty of the peri-urban poor. The peri-
urban poor, on the outskirts of urban centers, may be relatively easily reached by
grid extension with sizable impacts on reducing energy poverty.
Grid extension may not reach rural areas for decades, and in some remote areas the
grid is not likely to arrive at all. Therefore, using natural gas for power generation for
rural households is considerably more complicated than in urban environments. While
the technology and business models for small scale gas-fired power generation are not
6Natural gas is a mixture of lightweight hydrocarbons including methane, ethane, propane, andbutane. Methane is the dominant molecule by volume and is a gas at standard temperature andpressure. When natural gas is processed, liquid petroleum gases - ethane, propane, and butane - areseparated from the methane.
CHAPTER 3. ENERGY POVERTY AND CLIMATE CHANGE 69
fully mature, generators and micro-turbines make it possible to produce electricity
from natural gas apart from a centralized grid. Additional technology development is
required to run equipment used in agriculture or small enterprise directly on cylinders
of natural gas.
Natural gas is an excellent fuel for cooking and household heating because it is
fast-response, high-heat, and combusts cleanly and efficiently. In urban areas, gas can
be delivered by city gas pipeline networks or in cylinders. In rural areas, cylinders of
liquid petroleum gas (LPG) are most practical. LPG stoves accommodate culturally
rooted cooking practices and are, therefore, more likely to be adopted and deliver
social benefits than other improved cookstove designs (Durix et al., 2016).
Industry combusts natural gas directly in industrial boilers for process heat or
combined heat and power. Industry also uses natural gas as a feedstock for fertilizer
and petrochemicals. Globally, natural gas is used in the transportation sector as
compressed natural gas (CNG), LPG, and liquified natural gas (LNG) to move people
and goods by two stroke engine, light duty vehicle, taxi fleets, public bus systems,
trucking, and shipping.
Available
The availability of gas is the result of economic incentives and technology to produce
and transport natural gas. The availability of gas in low and middle income countries
is affected both by the global natural gas system and domestic infrastructure and
policy choices.
A natural gas revolution is unfolding globally with the United States at the center.
After years of preparing for declining natural gas production, new technologies for
producing directly from the source rock - including horizontal drilling and hydraulic
fracturing - caused a dramatic increase in U.S. gas production. As supply increased,
natural gas hub prices steadily declined, sustained by production cost declines through
technology improvements. With lower gas prices, natural gas fired power plants
are more profitable to operate than coal fired power plants in many U.S. electricity
markets. This fuel switching in the power sector has U.S. carbon dioxide emissions
from power generation at its lowest level in a decade (EIA, 2016).
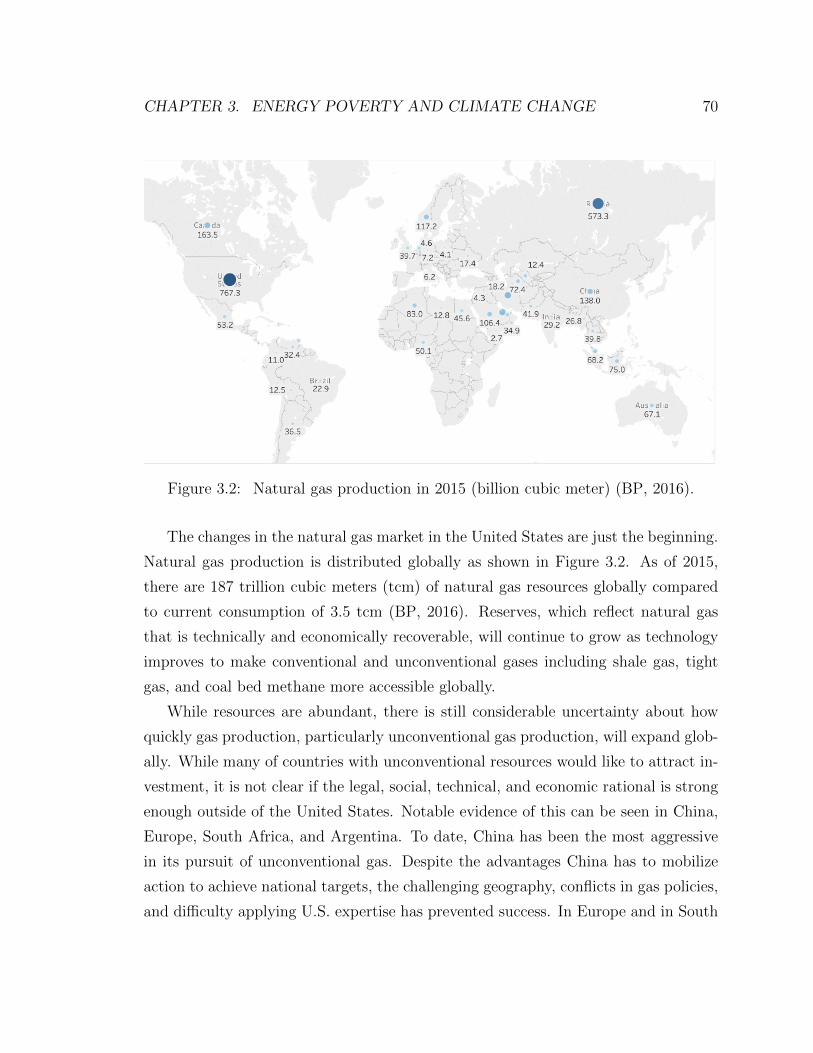
CHAPTER 3. ENERGY POVERTY AND CLIMATE CHANGE 70
Figure 3.2: Natural gas production in 2015 (billion cubic meter) (BP, 2016).
The changes in the natural gas market in the United States are just the beginning.
Natural gas production is distributed globally as shown in Figure 3.2. As of 2015,
there are 187 trillion cubic meters (tcm) of natural gas resources globally compared
to current consumption of 3.5 tcm (BP, 2016). Reserves, which reflect natural gas
that is technically and economically recoverable, will continue to grow as technology
improves to make conventional and unconventional gases including shale gas, tight
gas, and coal bed methane more accessible globally.
While resources are abundant, there is still considerable uncertainty about how
quickly gas production, particularly unconventional gas production, will expand glob-
ally. While many of countries with unconventional resources would like to attract in-
vestment, it is not clear if the legal, social, technical, and economic rational is strong
enough outside of the United States. Notable evidence of this can be seen in China,
Europe, South Africa, and Argentina. To date, China has been the most aggressive
in its pursuit of unconventional gas. Despite the advantages China has to mobilize
action to achieve national targets, the challenging geography, conflicts in gas policies,
and difficulty applying U.S. expertise has prevented success. In Europe and in South
CHAPTER 3. ENERGY POVERTY AND CLIMATE CHANGE 71
Africa, unconventional gas production has been met with social resistance. Outside
of the United States, landowners do not have mineral rights and, therefore, do not
have a financial incentive to accept any inconveniences of development. In Argentina,
exploration has only recently begun in earnest after a recent change in the investment
climate.
Abundant conventional reserves do not automatically result in available natural
gas supply either. The cost of investment in production and transportation of natural
gas is sizable. Investors must have a high degree of confidence that international prices
of natural gas will be high enough to cover investment costs and provide a return.
In recent years, low gas prices have delayed new natural gas projects and are forcing
reconsideration of high cost projects. Expanded production will require global prices
that warrant reinvestment in fields and investment in additional LNG transportation
infrastructure.
Sufficient gas on global markets will not always mean a specific country will have
the gas it needs. Local availability relies on domestic infrastructure and policy choices.
As a gas, transportation and storage requires specialized infrastructure to move and
store natural gas that has been compressed or liquified at cryogenic temperatures.
Gas importing countries must invest in international pipelines or LNG import and
regasification facilities. Two technology developments make this more promising to-
day than at any period before: small scale LNG and floating storage and regasification
units (FSRUs).
LNG tankers are typically designed to carry large volumes of LNG to lower costs
by economies of scale. In many cases, these large volumes are more than a low income
country can absorb in local markets. Small scale LNG technologies, however, make it
possible for an increasing number of developing countries to begin to build a natural
gas market. Similarly, FSRUs allow more countries to import natural gas because they
are less capital expensive than onshore options (typically $100 million -$250 million
vs. $500 million to $1 billion) and can be operational more quickly (12 months vs 4
years for engineering, procurement, and construction). Many developing countries do
not have credit worthy offtakers of natural gas so regasification infrastructure could
not be financed. FSRUs lower the risk to the private sector. While countries pay
CHAPTER 3. ENERGY POVERTY AND CLIMATE CHANGE 72
a premium on regasification on a volume basis, the flexibility that a floating option
provides is expanding the number of interested importers. Vessels can be used for
regasification and converted back to use in transportation if the buyer is unable or
unwilling to purchase the gas.
Some low and middle income countries have domestic gas resources. Investment
to produce these resources could provide a double benefit of supplying natural gas
without the additional costs of transportation and regasification and by generating
revenue through taxes and royalties. Domestic resources, however, do not automati-
cally mean gas is available. In order to get the full benefits, domestic resources must
be managed well. Investment conditions must be globally competitive to attract the
limited resources of upstream companies. Domestic obligations, a requirement that
gas producers sell a volume of gas to the domestic market, generally at a price below
the international price, is a common disincentive for investment.
Local gas availability is also affected by policies. Third party access requirements
are necessary to efficiently utilize infrastructure. Regulated prices facing the produc-
ers and distributers of gas lead to underinvestment in infrastructure to produce gas
and stifle imports of gas that must be purchased at international prices and then sold
at a loss. Many countries use poorly designed energy subsidies - for natural gas and for
electricity - to control the prices faced by consumers7 (Coady et al., 2015a,b). These
subsidies promote inefficient use of fuel, often benefit the wealthy more than the poor,
and contribute to financially unviable electric utilities. Unless the price of imported
gas and electricity generation and distribution can be recovered by consumer tariffs,
import infrastructure will be unbuilt or unused.
Convenient
The convenience of natural gas is highly dependent on the available distribution in-
frastructure in the form of wires, pipelines, or a network for cylinder refilling. If
7In lieu of domestic obligations and subsidies, revenue from domestic production and safety netpayments to defer the cost of energy can be distributed to the poorest citizens through direct subsidypayments. Direct payments do not distort the incentives for domestic production or efficient energyconsumption and can make energy more affordable for the poor.

CHAPTER 3. ENERGY POVERTY AND CLIMATE CHANGE 73
sufficient investment is made in natural-gas fired generation capacity and grid ex-
tension, more reliable electricity will reduce the energy poverty for households and
businesses. Expanded use of natural gas, delivered by wire through a centralized
electricity grid, to reduce power shortages will improve the convenience of energy
supply.
In applications where pipelines deliver gas, natural gas is a very convenient fuel.
These applications include centralized electricity generation, industrial use for com-
bustion or feedstocks, and city gas for cooking and heating. In most low and middle
income countries this infrastructure will only be found in urban areas, if available at
all.
Without a connection to the electricity grid or pipeline system, natural gas can be
delivered by cylinder as CNG, LNG, or LPG. These cylinders are delivered by truck,
but are not as convenient to store as liquid fuels. The convenience of gas cylinders,
especially in rural areas, is troubled by unreliable or unavailable distribution. Distri-
bution is hampered by poor infrastructure like roads for delivery. LPG distributors
have found it difficult to reach economies of scale outside of urban centers. Distri-
bution may improve if applications for small scale gas in rural areas beyond cooking
and heating are developed.
Meaningful adoption of natural gas for public, private, or goods transportation will
begin in urban areas where economies of scale can be achieved in refueling stations.
The convenience of storing liquid fuels and the ubiquity of existing engines that run
on gasoline and diesel will dampen adoption of natural gas vehicles. Deficiencies in
distribution by grid extension, city gas pipelines, or cylinder re-filling networks remain
serious obstacles to convenient use of natural gas, but they are surmountable.
Affordable
The affordability of gas for consumers in low income countries is driven by the global
market for natural gas, the costs of delivering the gas, and its competitiveness at the
point of end use.

CHAPTER 3. ENERGY POVERTY AND CLIMATE CHANGE 74
Natural gas can be an affordable fuel. Globally, production costs for natural gas
are $1-$4 per mmbtu (Rogner et al., 2012). Transporting gas by pipeline is inexpen-
sive, but is limited by geography and carries with it commercial and geopolitical risks
especially in the case of a single seller and single buyer of gas. Transporting natural
gas as LNG imposes additional costs for liquefaction, transportation, and regasifica-
tion which can add from $1 - $5 per mmbtu to the price of the commodity8 (Stokes
& Spinks, 2016).
Improvements in technology and an increasingly competitive market are resulting
in a reorganization of the global LNG market and applying downward pressure on both
the traded price and the costs associated with delivering LNG. Even before the first
LNG cargo left the lower 48 states, global LNG markets had begun a transformation.
As U.S. domestic production displaced the need for projected U.S. imports of LNG,
cargoes were redirected to Asian and European markets. The increased liquidity in
global LNG markets exerted downward pressure on LNG prices at European hubs
while Asian customers faced high oil-indexed prices. Since Asian customers began
to question the hallowed long-term contract based on an oil index, buyers have been
more selective about the terms they are willing to accept. Contract lengths have
shortened and destination clauses have been removed. While the majority of LNG
contracts are still oil-indexed and long-term, short-term LNG trading, especially by
aggregators, based on hybrid indexes and on spot and short-term contracts now make
up thirty percent of LNG trade or 75 mtpa of the total LNG supply of around 250
mtpa (Corbeau & Ledesma, 2016). Gas trade that is more beneficial to buyers is
expected to evolve further with 180 bcm of new LNG export capacity, including U.S.
projects indexed to Henry Hub.
Experts differ on if and when the oil index will be broken. If broken, then the
price of gas would be based on global supply and demand for gas. Global supply
uncertainty discussed previously would compound with global demand is uncertainty.
Asian demand for natural gas is expected to grow, but it is not clear how quickly.
China has a small share of gas in its energy mix compared to developed countries,
8Marginal costs for liquefaction, transportation and regasification are on the lower end of thisrange. Costs which include amortization of the capital expenditure are on the higher end of therange.
CHAPTER 3. ENERGY POVERTY AND CLIMATE CHANGE 75
and is looking to expand gas use to improve air quality. Gas demand in Europe
has been declining as renewable energy has crowded natural gas out of the electricity
sector. However, many believe with stringent climate targets and a disposition against
nuclear, Europe will need to use gas in place of coal. In Latin America gas demand
depends on hydro power availability, and with unpredictable weather patterns is not
clear how Latin America will play into global demand. Across Asia, Africa, and the
Middle East there are several middle income countries with existing gas infrastructure
that could relatively easily increase consumption with FSRU.
The cost of importing natural gas is becoming more cost effective with new floating
LNG technology. More supply and lower prices are likely to bring new buyers to the
LNG market, many of whom will be low and middle income countries. In the past
year Pakistan, Egypt, Ghana, Colombia, and the Philippines have moved to import
natural gas through floating regasification units. In the past eight years, ten countries
have added more than 20 mtpa of firm demand. This strong growth is expected to
continue with 69 projects for 137 mtpa of proposed import capacity under exploration
and a projected surplus in LNG ships. A surplus of LNG ships may encourage older
ships to convert to FSRUs, creating a more competitive market and contributing to
lower prices of delivered natural gas.
Affordability is both a relative and an absolute concern. The abundance of gas
makes the absolute price of gas less of a concern because with time the international
market will respond to high prices with more investment which will put downward
pressure on price. Perhaps more important then is the relative affordability of gas.
Natural gas has many competitors at the point of final use, therefore, the relative
affordability of gas depends on the sector.
In power generation relative affordability is based on the capital cost of renewable
energy and the cost of coal. Capital costs of renewable energy have been declining
rapidly in recent years because of technology development and expansion of manufac-
turing. It is not clear how quickly cost reductions will continue or how costs of system
integration, a challenge for variable renewable power, may escalate. In competition
with coal-fired power generation, the economics depend on both the relative cost of
coal and gas and the relative efficiencies of coal and gas-fired power plants. Gas does

CHAPTER 3. ENERGY POVERTY AND CLIMATE CHANGE 76
not need to be as cheap as coal on a per mmbtu basis because, typically, natural gas
fired power plants are considerably more efficient (Zhang et al., 2014).
The relative cost of gas fired power generation and coal fired power generation will
importantly affect the rate of fuel switching. In some low income countries there is
minimal existing investment in coal, so gas plants that are built will be run assuming
gas is affordable on absolute terms. But in countries that have existing coal power
fleets or plants under construction the decision between coal and gas is not one of
investment, but one of dispatch. In the United States and Europe, fuel switching
is occurring because of the relative prices. As seen in the United States, the power
generation mix is extremely sensitive to coal and gas prices. In countries with coal
capacity even a considerable investment in gas capacity does not mean that the plant
will be run. China and India will continue to use predominately coal because of the
relative affordability exacerbated by unreformed policies for coal, gas, and electricity.
In a decentralized setting, sufficiently small gas-fired turbines powering a mini-grid
could provide energy to household electric appliances, schools, and hospitals. A small
scale turbine, would work against the economies of scale typically pursued in turbine
technology, but the unit fuel cost could be affordable. With today’s technology,
however, the system cost is likely to be prohibitive for the poor. Financing such a
system would face barriers similar to that faced by other mini-grid alternatives such
as diesel, solar, and small-hydro systems.
In cooking and household heating, natural gas competes with firewood, collected
biomass fuels, or electricity. In urban areas heat might also be provided by coal
or liquid petroleum products. In this market, affordability is a barrier to natural
gas uptake. Even when the fuel itself may be affordable, poor households struggle to
afford an LPG stove and cylinder, much less a back-up cylinder for security. Empirical
studies have shown that the relative price of LPG to alternatives strongly influences
household fuel choice. In urban areas the poor typically pay for firewood or coal or
burn trash. In rural areas traditional fuels are often gathered, requiring considerable
time and physical exertion, but not money. In cooking and household heating, as well
as decentralized power generation and direct uses of gas, the affordability of natural
gas solutions hinges on efficient distribution.

CHAPTER 3. ENERGY POVERTY AND CLIMATE CHANGE 77
In the industrial sector, natural gas competes with biomass, coal, and liquid
petroleum products to provide process heat. For petrochemical production, natu-
ral gas competes with liquid petroleum products like naphtha or directly imported
chemical products. In the transportation sector, gas competes with petroleum prod-
ucts like gasoline and diesel and potentially with electricity in the future. In these
sectors natural gas is a desirable and competitive alternative.
Clean-burning
The extensive use of coal in the developing world has lead to untenable levels of air
pollution. Unlike coal and liquid petroleum fuels, natural gas combusts cleanly with
negligible emissions of sulfur, mercury, and particulates and relatively less nitrogen
oxides. In power generation, fuel-switching, using natural gas in place of coal-fired
power plants or diesel generators, improves air quality. Similarly, in industry, natural
gas boilers release less pollution and emissions than their coal or oil counterparts.
Using gas as a transportation fuel would reduce particulate emissions and nitrogen
oxides. In the electricity and industrial sectors, fuel switching is driven by the relative
economics of the fuel alternatives as well as any additional cost for complying with
local environmental regulations if any exist. In transportation, the relative fuel cost
and the relative capital costs both play a role in switching decisions.
Sickening air pollution is not only a product of modern energy use. Cooking and
household heating, whether with biomass or coal, degrade both ambient and indoor
air quality. Indoor air pollution, a scourge of the energy poor, is caused by use of
traditional fuels for cooking and heating and kerosene lighting. The indoor air quality
benefits of moving from biomass to natural gas for cooking and household heating
are well understood (ESMAP, 2007a).
Low-Emissions
Climate forcing emissions are released throughout the lifecycle of natural gas: pro-
duction, processing, transportation, distribution, and end use. Because of the global
nature of the natural gas system, additional consumption in a low or middle income
CHAPTER 3. ENERGY POVERTY AND CLIMATE CHANGE 78
country will cause emissions both outside a country’s borders and within. All emis-
sions have an impact on the global climate system.
In combustion, natural gas emits half as much carbon dioxide as coal. However, the
net climate benefits of natural gas used to displace other carbon-based fuels depend
on lifecycle emissions of LNG and global fugitive methane emissions. Unlike the other
pollutants, fugitive emissions result from leakage. Methane, a greenhouse gas and the
molecule that comprises over 90% of processed natural gas, is a more powerful climate
forcer than carbon dioxide (IPCC, 2014). Therefore, fugitive methane emissions from
the natural gas system, predominately in distribution, erode the relative climate
benefit over coal use.
As with all fuels and energy technologies, emissions are released throughout the
lifecycle (Heath et al., 2014; O’Donoughue et al., 2014). Natural gas production,
processing, LNG supercooling, LNG transportation, and heat for regasification all
require energy. Carbon dioxide emissions are a byproduct of these processes, the
carbon intensity of which will depend on its efficiency and the source of electricity.
While the electricity source may vary, it is often based on diverting and combusting
natural gas.
Fugitive methane emissions in production, distribution, and the LNG value chain
are the subject of considerable research (Lyon et al., 2016; EPA, 2016; Hutchins &
Morgan, 2016; Zavala-Araiza et al., 2015; Jackson et al., 2014; Brandt et al., 2014;
Skone, 2014; Alvarez et al., 2012; Howarth et al., 2011). Recent studies using top-down
measurements of atmospheric methane concentrations and bottom up measurements
aggregating individual sources have reported conflicting conclusions (Heath et al.,
2015). Alvarez et al. (2012) calculates system-wide leakage rates must be below
3.2% for gas to maintain a climate advantage over modern coal plants based on
methane and carbon dioxide emissions. Ongoing studies of leakage from production
and storage sites, natural gas distribution infrastructure, and the LNG value chain
will build our understanding of the high impact opportunities to mitigate leakage and
the comparative emissions advantages of natural gas.
Current empirical work provides a greater understanding of the scale of fugitive
emissions in the United States, and will lead to experimentation with policy and
CHAPTER 3. ENERGY POVERTY AND CLIMATE CHANGE 79
technology solutions. However, with greater understanding of fugitive emissions rates
in the United States, there will still be great uncertainty about the rate of emissions
globally. As natural gas production expands to meet new global demand it will matter
a great deal whether that supply comes from countries with strict or lax standards
for monitoring and remedying leaks. If expanded use of gas in low income countries
means more global production of natural gas from leaky places, then climate benefit
may be erased.
The climate forcing emissions associated with natural gas at the point of final
use depend upon the efficiency of combustion or chemical conversion and whether the
emissions can be captured and stored. To the extent that natural gas is combusted for
power generation or industrial demand instead of coal or diesel, the relative emissions
of carbon dioxide, sulfur dioxide, and black carbon improve climate change mitigation
(Wigley, 2011; Hayhoe et al., 2002). Emissions from gas will also depend on the
development of carbon capture and storage technology. If it becomes available and
affordable to retrofit gas plants with capture, then an investment will be a win for
development without a loss for the climate.
Unfortunately, more natural gas use in the power sector does not unequivocally
lead to better climate outcomes because of the risk of crowding out centralized re-
newable power. In the United States, modeling has demonstrated that additional
gas-fired power generation effectively pushes out coal-fired power, but also restricts
the deployment of renewable energy (Shearer et al., 2014). Researchers are working
to better understand the relationship between gas and renewables in the power sector,
but their work is currently limited to large existing networks like the United States
and Europe. The conclusions may differ in the context of a low income country with
insufficient infrastructure and power shortages.
The climate benefits of natural gas that displaces biomass as a household heating
or cooking fuel are ambiguous. In theory some biomass is carbon neutral, so switching
to natural gas would increase emissions. In practice, however, biomass is not always
sustainably harvested. Adding to the uncertainty, incomplete combustion of biomass
produces black carbon, a lesser studied contributor to climate change. More research
is required to understand the net climate effects of fuel switching in this sector.

CHAPTER 3. ENERGY POVERTY AND CLIMATE CHANGE 80
Used as feedstock, the greenhouse gas emissions from natural gas depend on the
natural gas leakage rates during delivery and storage as there are no combustion
emissions. Using gas as a transportation fuel reduces particulate emissions and emits
fifteen to twenty percent less carbon dioxide than petroleum based liquids.
3.3 Conclusion
This chapter has made two important contributions to the energy poverty conver-
sation. First, it reconstructed positions about the existence of a conflict between
policies to promote energy poverty reduction and climate change mitigation based on
the absence of an objective metric for energy poverty. Second, this chapter makes
a plea for a clear stance on natural gas. Ambiguity about the future of natural gas
undermines development and climate goals by sending weak signals to investors.
The last section showed an encouraging global picture for gas availability and
affordability, but there are challenges for translating that opportunity into meaningful
and sustainable energy supply for the energy poor. The adequacy and clean burning
attributes of natural gas are unquestionably favorable. However, uncertainty about
the availability, convenience, affordability, and low-emission quality of natural gas give
rise to questions about whether investments in natural gas will deliver the benefits
that are possible. Subsequent chapters will explore different approaches to uncertainty
analysis in energy models to clarify the net benefits of expanding the use of natural
gas to balance climate change and energy poverty.

Chapter 4
Specifying the Policy Problem
We fail more often because we solve
the wrong problem than because we
get the wrong solution to the right
problem.
Russell Ackoff, 1974
The last chapter described a policy problem currently facing foreign policymakers:
Should the United States promote expanded use of natural gas in low and
middle income countries to reduce energy poverty and limit greenhouse
gas emissions?
The complexity of the energy system, the conflicting policy objectives, and the market
and technological uncertainty described in the last chapter points to the need for
an energy model to support the decision making process. To move from the general
description in Chapter 3 to a mathematical model that can provide insight, the policy
problem must be refined. The purpose of this chapter is to specify a particular
problem frame that identifies appropriate system boundaries and makes assumptions
explicit. This representation of the policy choice will be the basis for the models
developed and analyzed in the next chapter.
81

CHAPTER 4. SPECIFYING THE POLICY PROBLEM 82
The rest of this chapter is organized as follows. Section 4.1 will clarify the decision
frame by defining the decision maker and narrowing the scope of the policy problem.
Section 4.2 will draw the boundaries of the energy system. Section 4.3 will make
specific assumptions about uncertain variables, policy alternatives, and how outcomes
will be valued.
4.1 Decision frame
The broad challenge of trading off energy poverty and climate change is too diffuse for
a satisfactory answer. To move forward, the problem must be structured so that it can
be modeled and the result can provide meaningful insight. This section describes the
frame - the particular perspective of the decision maker and a delimiting scope of the
problem. If the question is too broad it is cognitively and analytically unmanageable,
and if it is too narrow the conclusion is not useful for real world decisions.
A policy decision to clarify the role of natural gas to balance the tension between
reducing energy poverty and limiting climate forcing emissions could be evaluated
from many perspectives. The question could be asked from the perspective of a na-
tional government, an energy poor household, an infrastructure investor that wants
to avoid stranded assets, a multilateral development bank with a mandate for sus-
tainable poverty reduction, or the mythical social planner. The perspective drives
choices about the structure of the mathematical model and the parameters assumed
in the model.
In this dissertation, the decision is framed from the perspective of the U.S. Na-
tional Security Council.1 At the discretion of the President, invitations would be
issued to many agencies to participate in a process of collecting information, con-
ducting analysis, and recommending a policy decision. The National Security Staff
would be joined by participants from: the Office of the Vice President, the State De-
partment, the Department of Defense, the Department of Treasury, the Intelligence
1Climate change and energy poverty are matters of the national interest, and therefore, a policyon the role of natural gas in other countries’ fuel mix, is a matter of foreign policy. With or withoutthis broad view of the national interest, the policy problem is an interagency matter and will behandled through the National Security Council process.
CHAPTER 4. SPECIFYING THE POLICY PROBLEM 83
Community, the Department of Energy, the U.S. Agency for International Develop-
ment, the Environmental Protection Agency, the Department of Interior, the Overseas
Private Investment Corporation, the Export-Import Bank, the Millennium Challenge
Corporation, the White House Council on Environmental Quality, and the U.S. Trade
and Development Agency. Each of these organizations has resources or a competency
that crosses into the boundary of this particular policy area. In some agencies, more
than one office may be represented because of specialized energy, climate, develop-
ment, or regional expertise. Not at the table, but in the minds of government officials
will be the perspectives of multilateral development banks, countries that will be
directly affected by a decision, countries that will have strong feelings about a U.S.
position, private industry and investors, the U.S. Congress, and public opinion. The
conclusions drawn from this perspective of the U.S. national interest, or indeed any
other perspective, should not be interpreted as socially optimal for the world. The
result will narrowly point to what is in the best interests of the United States.
To narrow the scope of the problem, the decision under consideration is distin-
guished from the policy decisions that have already been made and those that can
be delayed to implementation (Howard & Abbas, 2015). In any policy decision there
are pre-decisions - choices that could be altered but are instead taken as given. Here,
I assume that activities to improve the socio-economic development of other nations
and mitigate greenhouse gas emissions are appropriate U.S. foreign policy actions
and that U.S. agencies have defined missions and established policy tools as defined
by statute. By acknowledging these pre-decisions, neither the motivation nor the
available policy tools will be reconsidered in the current analysis. Identifying post-
decisions sets apart choices that can be made during implementation. For example,
a decision whether to use concessional finance for power projects may be separated
from a decision to specify the particular interest rate or the process for loan evalu-
ation. After establishing what is given and what will be resolved in the future, the
policy decision is isolated.
To further narrow the scope, the scale of the energy question is limited. As
described in Chapter 3, natural gas can be used in many sectors of the economy to
promote growth. A model that treated each sector in even limited detail would be
CHAPTER 4. SPECIFYING THE POLICY PROBLEM 84
very complex, therefore, only the role of natural gas in the electricity sector will be
addressed here. The primary interest in this research is the tension between reducing
energy poverty and increasing emissions, which is most apparent in the electricity
sector.
While there are many challenges to expanding the use of natural gas for cook-
ing, such a policy does not require a tradeoff between the climate and development.
Natural gas for cooking will reduce energy poverty and the climate impact would be
negligible and perhaps positive as natural gas is more efficient and cleaner burning
than traditional biomass fuels (Pachauri et al., 2013). Similarly, use of natural gas
in transportation, petrochemicals, and industrial boilers, has clear benefits for eco-
nomic growth and will reduce the emissions intensity of these activities as coal and
petroleum products are displaced.
The tension between development and emissions is most acute in the electricity
sector. The use of natural gas is also most controversial in the electricity sector
because there are viable competitors with different costs and benefits. Natural gas
is more expensive than coal, which imposes higher fuel costs on the economy. If the
lower fuel costs of coal are not outweighed by the loss in productivity that may be
caused by lower air quality, then using natural gas is a drag on short term economic
growth. And while natural gas is a lower carbon fuel than coal, natural gas emits
greenhouse gases while renewable electricity technologies do not. Though renewable
energy is carbon free, these power plants run comparatively few hours each year and
have relatively high capital costs.
Power generation is the most difficult sector for natural gas to succeed. Countries
with limited natural gas supplies avoid burning natural gas because it typically creates
more value as a feedstock for fertilizers or petrochemicals. If this analysis shows a
case for expanding the use of natural gas in the electricity sector, the case is already
made for using gas in other sectors. The converse is not true. If natural gas makes
economic and environmental sense for any combination of industry, transportation, or
cooking, it still may not be the best solution for the electricity sector. This modeling
work will not evaluate the potential for economy wide use use of natural gas in low
and middle income countries as is done in gas master plans under development for
CHAPTER 4. SPECIFYING THE POLICY PROBLEM 85
several low and middle income countries with underdeveloped natural gas resources
(Huurdeman et al., 2013; Demierre et al., 2014; Power Africa, 2016). If, however, a
country decided separately to undertake a massive investment in natural gas, the role
of gas in electricity should be reevaluated based on the opportunities and costs in the
new national energy system.
The scope of the policy question is further narrowed by limiting the time-frame for
evaluation. In each of the models I assume that policy action is taken in 2018 through
2030. Both the climate and poverty agendas have important targets for 2030. Most
of the Intergovernmental Panel in Climate Change mitigation scenarios require global
emissions to peak around 2030. Within the United Nations Framework Convention
on Climate Change (UNFCCC), countries have pledged nationally determined contri-
butions - actions individual countries will take by 2030 to reduce or limit the growth
of emissions. The UN targets to eliminate extreme poverty and provide universal
access to energy are also set for 2030.
Finally, the scope of this analysis is refined because the policy need not be un-
conditionally applied. Rather than determining a blanket judgment about the role of
gas, more specifically what is of interest is the countries in which it will be in the U.S.
national interest to expand the use of natural gas. The United States has various pol-
icy concerns for different countries and each country has different characteristics that
may change the benefit or risk associated with expanded use of natural gas. It would
also be helpful to know the circumstances in which a pro-gas policy has net benefits.
For example, the policy may be robust if coal prices exceed a certain price, or if global
fugitive emissions rates are below a certain threshold, or if universal electrification is
achieved on schedule.
The reframed question is, therefore:
When and where is it in the national interest of the United States to
use existing policy tools to promote natural gas-fired power to balance
unmet demand for electricity and the cost of climate change caused from
greenhouse gas emissions?
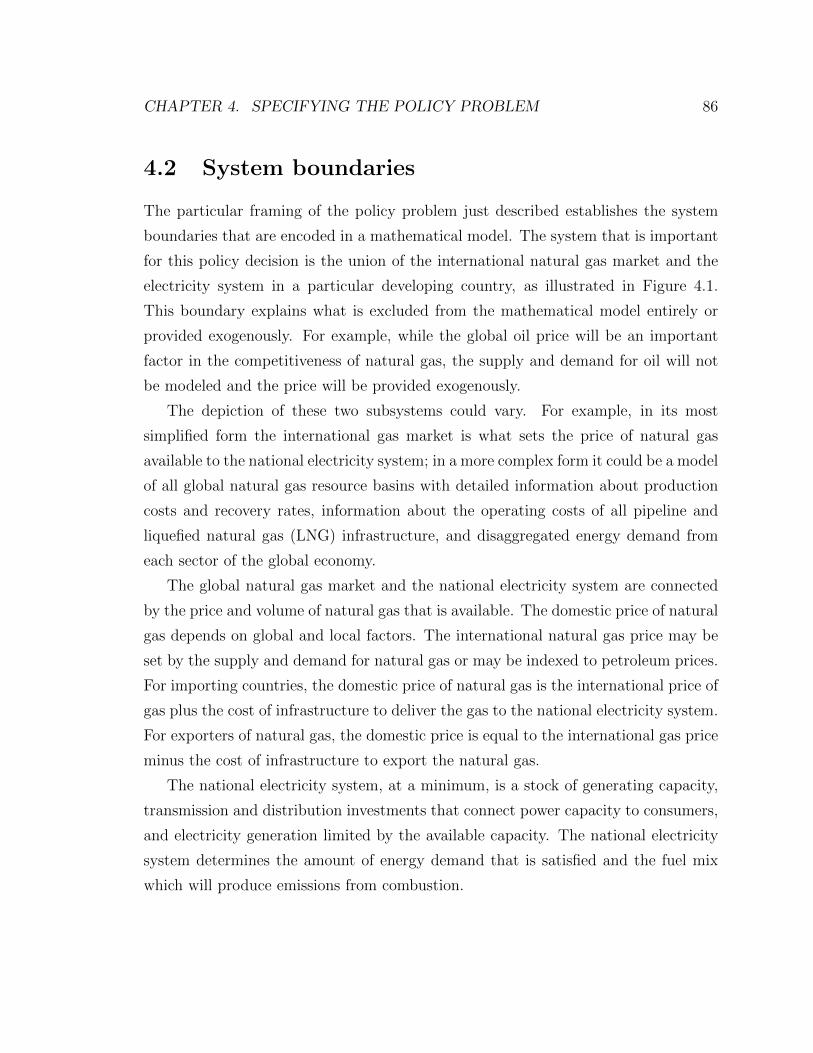
CHAPTER 4. SPECIFYING THE POLICY PROBLEM 86
4.2 System boundaries
The particular framing of the policy problem just described establishes the system
boundaries that are encoded in a mathematical model. The system that is important
for this policy decision is the union of the international natural gas market and the
electricity system in a particular developing country, as illustrated in Figure 4.1.
This boundary explains what is excluded from the mathematical model entirely or
provided exogenously. For example, while the global oil price will be an important
factor in the competitiveness of natural gas, the supply and demand for oil will not
be modeled and the price will be provided exogenously.
The depiction of these two subsystems could vary. For example, in its most
simplified form the international gas market is what sets the price of natural gas
available to the national electricity system; in a more complex form it could be a model
of all global natural gas resource basins with detailed information about production
costs and recovery rates, information about the operating costs of all pipeline and
liquefied natural gas (LNG) infrastructure, and disaggregated energy demand from
each sector of the global economy.
The global natural gas market and the national electricity system are connected
by the price and volume of natural gas that is available. The domestic price of natural
gas depends on global and local factors. The international natural gas price may be
set by the supply and demand for natural gas or may be indexed to petroleum prices.
For importing countries, the domestic price of natural gas is the international price of
gas plus the cost of infrastructure to deliver the gas to the national electricity system.
For exporters of natural gas, the domestic price is equal to the international gas price
minus the cost of infrastructure to export the natural gas.
The national electricity system, at a minimum, is a stock of generating capacity,
transmission and distribution investments that connect power capacity to consumers,
and electricity generation limited by the available capacity. The national electricity
system determines the amount of energy demand that is satisfied and the fuel mix
which will produce emissions from combustion.
CHAPTER 4. SPECIFYING THE POLICY PROBLEM 87
Figure 4.1: The energy system is limited to the global gas market and a nationalelectricity system. The outcomes of importance are the unmet demand for electricityand the greenhouse gas emissions.
While other stakeholders are not considered as the decision maker, they have an
important influence on the results of U.S. decisions. Investors in power generation and
natural gas infrastructure, national governments of low and middle income countries,
the populations in low and middle income countries, and the operators of power
plants are implicitly actors in the model. United States’ foreign policy can influence
the international gas market or the national energy system directly or indirectly by
influencing the actions of the partner government and private investors, as shown in
Figure 4.2.
The private sector makes investments in upstream natural gas production, natural
gas transportation infrastructure, and power generation infrastructure based on eco-
nomic calculations. Their investment decisions are influenced by specific policies and
the general policy environment in developing countries. The U.S. can change investor

CHAPTER 4. SPECIFYING THE POLICY PROBLEM 88
Figure 4.2: U.S. policy influences the energy system directly and indirectly to affectthe greenhouse gas emissions and unmet demand for electricity.
behavior by altering the costs and availability of technology and capital. Multilat-
eral development banks and international finance institutions, as well as other donor
countries, are not modeled, though their lending decisions and technical assistance
could be affected by what the United States decides.
The national government is largely responsible for setting infrastructure targets
like grid extension and capacity expansion. The leadership in a developing country
will make decisions based on domestic political interests. These interests may or
may not align with U.S. goals, but through diplomacy and technical assistance, U.S.
intervention may change the incentive structure for national governments. The U.S.
evaluation of the opportunity and risks associated with expanding natural gas use
will be different across countries because of their attributes and because of their
CHAPTER 4. SPECIFYING THE POLICY PROBLEM 89
importance to U.S. security and prosperity. Therefore, each country is at a different
starting point and has different resources which will affect the appropriateness of a
natural gas strategy. For example, countries with a naturally strong solar resource
may have different options from a country that does not. As shown in Table 4.1,
countries differ in their wealth, electrification rates, current coal use, domestic gas
availability, and existing gas infrastructure. Similarly, each country relates differently
to the U.S. national interest as summarized in Table 4.2. Some countries have an
historic relationship with the United States and others are areas of ongoing security
concerns.

CHAPTER 4. SPECIFYING THE POLICY PROBLEM 90
Cou
ntr
ies
GN
Ip
erca
pit
a,20
15(c
onst
ant
2010
US
D)
Ru
ral
acce
ssto
elec
tric
ity,
2014
(%of
rura
lp
opu
lati
on)
Urb
anac
cess
toel
ectr
icit
y,20
14(%
ofru
ral
pop
ula
tion
)
Ele
ctri
city
pro
du
ctio
nfr
omco
also
urc
es,
2014
(%of
tota
l)
Ele
ctri
city
pro
du
ctio
nfr
omoi
lan
dga
sso
urc
es,
2014
(%of
tota
l)
Nati
on
al
elec
tric
ity
con
sum
pti
on
,2014
(kw
hp
erca
pit
a)
Ban
glad
esh
1,03
651
842
97311
El
Sal
vad
or3,
680
9098
040
966
Eth
iop
ian
/a12
910
070
Gh
ana
1,64
663
920
35357
Gu
atem
ala
2,97
275
9617
14575
Hai
ti72
817
530
9139
Ind
ia1,
732
7098
757
805
Ind
ones
ia3,
707
9499
5336
814
Ken
ya1,
125
1310
00
19171
Moz
amb
iqu
e50
36
540
9463
Mya
nm
ar1,
228
4958
236
211
Nig
eria
2,46
639
580
82144
Pak
ista
n1,
211
9610
00
65472
Ph
ilip
pin
es3,
204
8397
4332
706
Tan
zan
ia82
84
410
58100
Yem
enn
/a59
970
100
217
Tab
le4.
1:E
ner
gyre
late
ddem
ogra
phic
sof
low
inco
me
countr
ies
(Wor
ldB
ank
Dev
elop
men
tIn
dic
ator
s)

CHAPTER 4. SPECIFYING THE POLICY PROBLEM 91
4.3 Decision basis
The decision frame and the system boundaries defined in the previous sections dictate
the structure of the mathematical model. Once framed and scoped, every policy
decision can be described by a decision basis - a collection of knowledge and beliefs
about what is known, what can be done, and how different outcomes would affect
the decision maker’s goals. There are an infinite number of possible decision bases.
And, as discussed in Chapter 2, agencies are likely to have different perspectives
on each aspect of the basis. This section will make explicit the assumptions about
the information, alternatives, and preferences used in the subsequent analyses. In
practice, the basis for this analysis would come from the National Security Council,
foreign policy agencies, or other experts.
Decision theorists use a stool as a metaphor for a complete decision. The three
legs of the stool are the information, alternatives, and preferences that make up the
decision basis. These are united by a logic which is the seat a decision maker can sit on.
For energy policy decisions this logic is an energy model, and the model can take many
forms to integrate the decision basis. The information, alternatives, and preferences
must be equally strong to hold up the logic. If one leg is too short, not fully developed,
the entire analysis is unstable. There are entire literatures on the theory and practice
of each leg of the stool such as procedures for assessing a decision makers’beliefs about
the likelihoods of events, iteratively developing alternatives based on insights from
the framing process, and formulating consistent preferences. In the decision basis
developed in this section, I have used this guidance to think systematically about
uncertainties, develop alternatives, and identify and structure preferences.
4.3.1 Uncertain information
The information leg of the stool includes the model structure, model parameters, and
distributions of values for uncertain variables. The model structures are presented
in Chapter 5 and the parameters are listed in the Appendix. A subset of the model
parameters, those that are naturally variable and those that are otherwise unknown,
are uncertain variables also known as uncertainties.
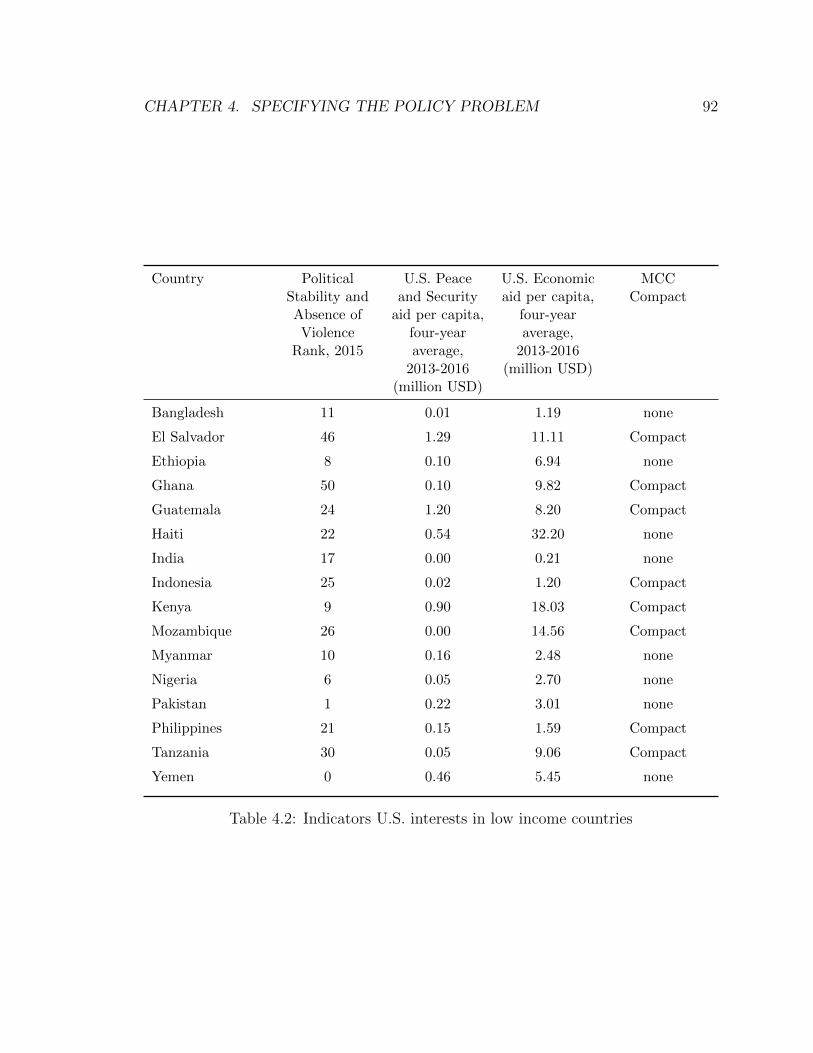
CHAPTER 4. SPECIFYING THE POLICY PROBLEM 92
Country PoliticalStability andAbsence ofViolence
Rank, 2015
U.S. Peaceand Security
aid per capita,four-yearaverage,
2013-2016(million USD)
U.S. Economicaid per capita,
four-yearaverage,
2013-2016(million USD)
MCCCompact
Bangladesh 11 0.01 1.19 none
El Salvador 46 1.29 11.11 Compact
Ethiopia 8 0.10 6.94 none
Ghana 50 0.10 9.82 Compact
Guatemala 24 1.20 8.20 Compact
Haiti 22 0.54 32.20 none
India 17 0.00 0.21 none
Indonesia 25 0.02 1.20 Compact
Kenya 9 0.90 18.03 Compact
Mozambique 26 0.00 14.56 Compact
Myanmar 10 0.16 2.48 none
Nigeria 6 0.05 2.70 none
Pakistan 1 0.22 3.01 none
Philippines 21 0.15 1.59 Compact
Tanzania 30 0.05 9.06 Compact
Yemen 0 0.46 5.45 none
Table 4.2: Indicators U.S. interests in low income countries
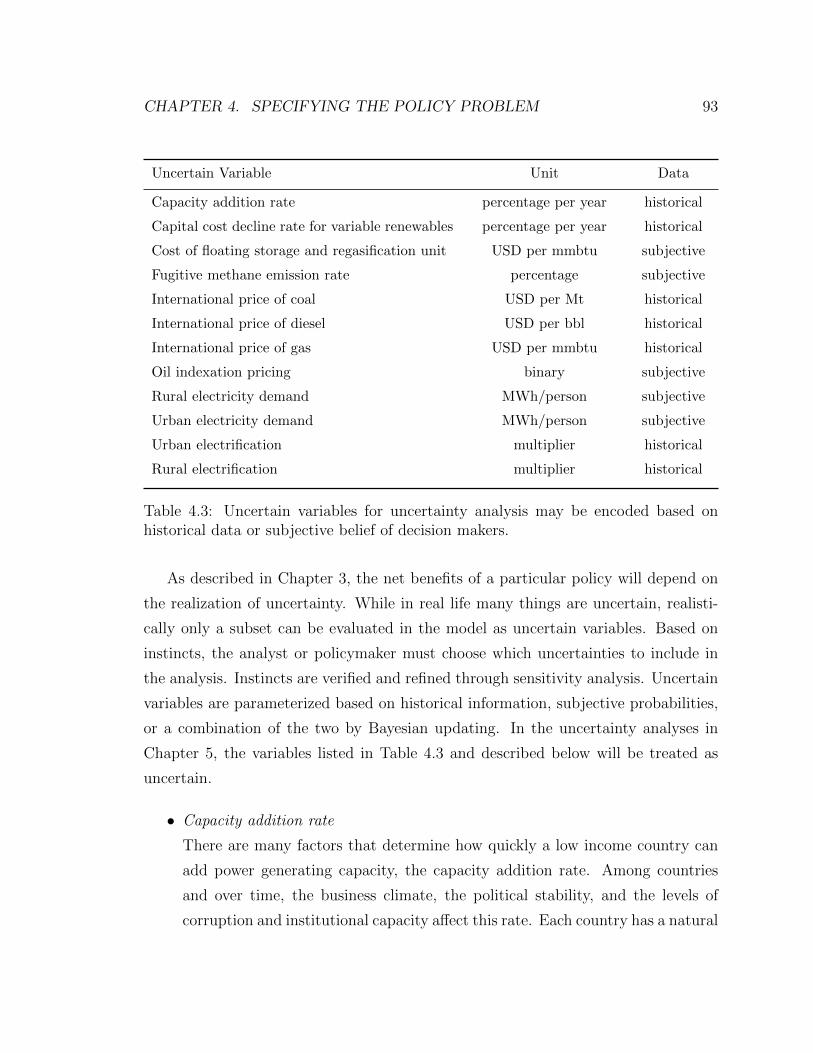
CHAPTER 4. SPECIFYING THE POLICY PROBLEM 93
Uncertain Variable Unit Data
Capacity addition rate percentage per year historical
Capital cost decline rate for variable renewables percentage per year historical
Cost of floating storage and regasification unit USD per mmbtu subjective
Fugitive methane emission rate percentage subjective
International price of coal USD per Mt historical
International price of diesel USD per bbl historical
International price of gas USD per mmbtu historical
Oil indexation pricing binary subjective
Rural electricity demand MWh/person subjective
Urban electricity demand MWh/person subjective
Urban electrification multiplier historical
Rural electrification multiplier historical
Table 4.3: Uncertain variables for uncertainty analysis may be encoded based onhistorical data or subjective belief of decision makers.
As described in Chapter 3, the net benefits of a particular policy will depend on
the realization of uncertainty. While in real life many things are uncertain, realisti-
cally only a subset can be evaluated in the model as uncertain variables. Based on
instincts, the analyst or policymaker must choose which uncertainties to include in
the analysis. Instincts are verified and refined through sensitivity analysis. Uncertain
variables are parameterized based on historical information, subjective probabilities,
or a combination of the two by Bayesian updating. In the uncertainty analyses in
Chapter 5, the variables listed in Table 4.3 and described below will be treated as
uncertain.
• Capacity addition rate
There are many factors that determine how quickly a low income country can
add power generating capacity, the capacity addition rate. Among countries
and over time, the business climate, the political stability, and the levels of
corruption and institutional capacity affect this rate. Each country has a natural
CHAPTER 4. SPECIFYING THE POLICY PROBLEM 94
rate of capacity addition, as inferred from history, that varies based on political
and economic changes in the country. This is an important uncertainty to
capture in the model because as capacity addition increases, unmet demand
will decrease. Emissions may or may not increase depending on changes in the
emissions intensity of the fuel mix.
• Capital cost decline rate for variable renewable electricity technologies
The cost of technologies like solar photovoltaics or wind turbines have been
declining for decades. As these technologies do not have fuel costs, the compet-
itiveness of electricity generation is driven by their capital costs. Cost declines
are described by a learning rate which captures cost reductions from a variety of
mechanisms including technological change, manufacturing efficiency, and ex-
perience with permitting and installation. While historical learning rates are
stable, there is variation year to year and a possibility that each mechanism
of cost reduction slows down. With continued declines in cost renewables may
produce electricity as inexpensively as fossil fuel technologies with the benefit
of no emissions.
• Cost of regasification
Liquified natural gas tankers converted into stationary floating storage and re-
gasification units allow more countries with relatively small gas demand and
high risk off takers to participate in global LNG markets. Rather than being
bought outright, these FSRUs are leased and the costs are recovered by a unit
charge on natural gas imported. Technology improvement and increasing com-
petition in the LNG tanker market may materialize and, therefore, reduce the
cost of delivered natural gas. Alternatively, high demand for the ships may raise
the price of delivered natural gas. Lower natural gas prices will make electricity
from natural gas more competitive with alternatives.
• Fugitive methane emissions rate
Fugitive methane emissions undermine the climate benefits of natural gas. Cur-
rent understanding of the rate of these emissions from natural gas operations is
limited in the United States and unknown globally. Over time ongoing research
CHAPTER 4. SPECIFYING THE POLICY PROBLEM 95
will clarify the percentage of methane released into the environment relative to
the amount of natural gas produced and transported. Above a certain rate, nat-
ural gas investment provides a relative climate benefit over coal use; below the
threshold and the climate forcing from gas will be comparable to that of coal.
The fugitive methane emission rate is not only uncertain because of incomplete
knowledge, but also because it could be changed by policy intervention.
• Oil indexation
The price of natural gas has been indexed to the price of oil for many decades.
This pricing mechanism gives the private sector confidence to invest in natural
gas production and transportation, but there is increasing pressure to move
away from an oil index to prices set by gas on gas competition. In the United
States and increasingly in Europe, the depth of the natural gas market trading
at hubs has provided enough stability to set gas prices based on the equilibrium
of gas supply and demand. Gas sales contracts based on hub prices or a hybrid
of hub prices and oil prices is increasingly common globally. Increased exports
of natural gas from the United States and a general period of oversupply may
reverse the international norm. The end or continuation of oil indexation could
change the price and volume of natural gas produced globally.
• Price of coal and diesel
Diesel and coal are internationally traded commodities. The price of diesel and
coal are largely set by the fundamentals of supply and demand for each fuel.
In contrast to natural gas, the costs of transportation are minimal compared to
the overall value of the fuel. The price of coal and diesel is represented by their
historical volatility and their base price.
• Price of natural gas
Natural gas prices are a function of the oil price, the price index, and the cost
of transforming and transporting natural gas. To isolate those elements, the
uncertain price of gas described here is assumed to be the equilibrium price of
natural gas supply and demand. This uncertainty will be based on the prices
and volatility at Henry Hub.

CHAPTER 4. SPECIFYING THE POLICY PROBLEM 96
• Rural and urban electricity demand
As explained in Chapter 3, there is neither a normative or descriptive estimate
for electricity demand of the energy poor, but there is in principle a meaning-
ful amount of energy that is the opposite of energy poverty. In this analysis
rural and urban electricity demand is the national average per capita electric-
ity demand regardless of whether the demand is satisfied or not. The demand
requirement is differentiated based on urban or rural geography to take into ac-
count the additional energy of industrialization attributed to an urban lifestyle.
• Rural and urban electrification
Rural and urban populations will only benefit from additional power capacity
to the extent they are connected to an electric network, whether that is the
central grid or a mini-grid. National governments are working to expand the
percentage of the population that is electrified by extending transmission and
distribution infrastructure and making additional grid connections. Without
expanding electrification, additional generation cannot reduce unmet demand.
The different approaches to uncertainty analysis require specific quantifications of
uncertainty, for example: a point estimate, a range, a discrete probability distribu-
tion, or a continuous probability distribution. The representation of the uncertainties
described above will be provided along with each approach to uncertainty analysis in
Chapter 5.
4.3.2 Policy alternatives
In the proceeding analysis, the five alternative policies described below and summa-
rized in Table 4.4 will be considered. The alternatives alter the system by reducing
the cost of gas, changing the relative levelized cost of electricity (LCOE), or reduc-
ing the climate impact of natural gas use. These policies are not inherently mutually
exclusive, but they will be considered individually to isolate the different mechanisms.
• No policy action
The first alternative is not to take specific action.

CHAPTER 4. SPECIFYING THE POLICY PROBLEM 97
• Ceiling on natural gas price
The second alternative is to put a ceiling on the price low and middle income
countries pay for natural gas. In this policy, if the price of gas rises above
a certain threshold, the United States would cover the difference between the
international price for natural gas and the ceiling. If the prevailing international
price for gas is less than the ceiling, there is no cost to the United States. This
policy would transfer the risk of high prices from the low income country to the
United States.
• Technical assistance: Carbon price
The third alternative is to charge electricity generators for the carbon diox-
ide that is produced. I include the carbon price as an alternative to serve as
a benchmark for the less economically efficient policies. While not politically
palatable in most countries today, a carbon price is the most economically ef-
ficient way to reduce emissions in the power sector. While the other policy
alternatives are likely to be welcomed by a national government, a carbon price
may face resistance. The cost of this policy to the United States will be quan-
tified by the direct costs of implementing a technical assistance program to
design and administer a carbon pricing scheme. The cost of the policy to the
electricity generators is not included, though, is is the cost to the generators
that increases the levelized cost of electricity for the thermal generators and
creates an incentive to change the fuel mix.
• Technical assistance: Fugitive methane emissions
The fourth alternative is to reduce fugitive emissions associated with the trans-
portation and distribution of natural gas within the foreign country. This al-
ternative will reduce the emissions risk of an investment in natural gas, but will
not do anything to reduce energy poverty. The cost of this policy will be quan-
tified by the costs of a technical assistance program to help regulators work
with industry to reduce emissions within the foreign country. An increased
use of gas anywhere in the world will cause an increase in fugitive emissions
from production and transportation to the consumer, those emissions are not
CHAPTER 4. SPECIFYING THE POLICY PROBLEM 98
addressed here. While the United States could adopt policies that reduce the
amount of fugitive emissions in U.S. production, that is not what is meant by
this alternative.
• Concessional finance: Variable renewable electricity
The fifth policy alternative is to provide concessional finance for variable renew-
able electricity technologies, solar and wind. Concessional finance for variable
renewable energy has a direct cost which is equal to the credit subsidy rate times
the size of the loan for capital investment. Concessional finance will reduce the
levelized cost of electricity for variable renewable electricity.
• Concessional finance: Natural gas-fired electricity
The final potential policy is to offer concessional finance for natural gas power
plants. Concessional finance lowers the levelized cost of electricity from natural
gas generators. This alternative will lower the cost of electricity produced from
new gas-fired power plants and will make it possible for gas to capture a larger
share of the generation mix. Concessional finance for natural gas has a direct
cost which is equal to the credit subsidy rate times the size of the loan for
capital investment.
4.3.3 Preferences
Preferences are necessary to rank the outcomes of alternative policy interventions.
There are three kinds of preferences: risk preference, time preference, and value
preference. For risk preference, I assume the decision maker is risk neutral, and for
time preference a discount rate of 3% is used. This remainder of this section will
describe value preferences in greater detail.
All approaches to formulating value preferences begin with identifying attributes of
the outcome that are desirable, clarifying their meaning, and quantifying them in some
way. The values of the U.S. decision maker are derived from the national interest. The
national interest is U.S. security, sovereignty, and prosperity. As discussed earlier, the
stability and prosperity of other countries indirectly affects the security and prosperity
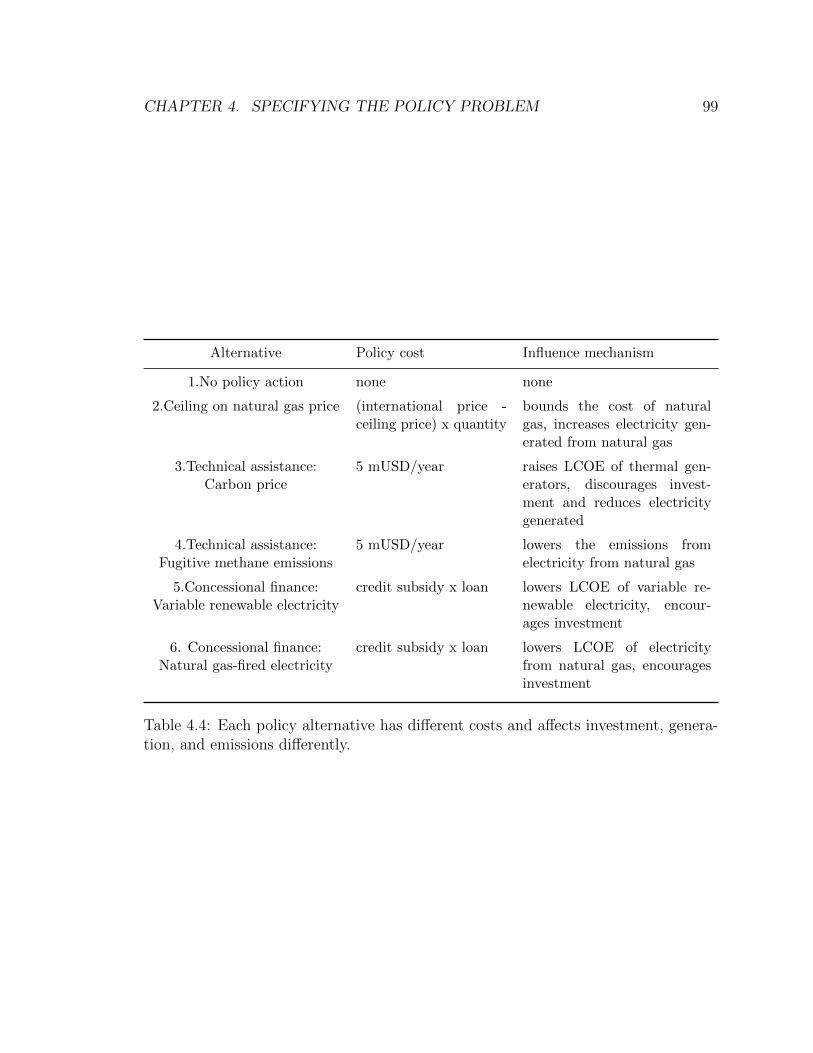
CHAPTER 4. SPECIFYING THE POLICY PROBLEM 99
Alternative Policy cost Influence mechanism
1.No policy action none none
2.Ceiling on natural gas price (international price -ceiling price) x quantity
bounds the cost of naturalgas, increases electricity gen-erated from natural gas
3.Technical assistance:Carbon price
5 mUSD/year raises LCOE of thermal gen-erators, discourages invest-ment and reduces electricitygenerated
4.Technical assistance:Fugitive methane emissions
5 mUSD/year lowers the emissions fromelectricity from natural gas
5.Concessional finance:Variable renewable electricity
credit subsidy x loan lowers LCOE of variable re-newable electricity, encour-ages investment
6. Concessional finance:Natural gas-fired electricity
credit subsidy x loan lowers LCOE of electricityfrom natural gas, encouragesinvestment
Table 4.4: Each policy alternative has different costs and affects investment, genera-tion, and emissions differently.
CHAPTER 4. SPECIFYING THE POLICY PROBLEM 100
of the United States. In this problem, three attributes of each outcome of policy
intervention will be assessed: the cost of U.S. policy intervention, greenhouse gas
emissions, and unmet demand for electricity.
• U.S. policy intervention
The cost of U.S. policy intervention, measured in USD, is the value of any
commitments of time or money by the U.S. government to carry out policies.
• Greenhouse gas emissions
Combusting fossil fuels for power generation results in greenhouse gas emissions.
Greenhouse gases are global pollutants so the benefit of reducing a MtCO2 is
the same regardless of location.
• Unmet demand
The impact of unmet demand for electricity in the developing world has an
indirect cost to the United States, as it directly reduces the economic prosperity
and the security of a foreign country. Through trade, migration, and conflict
the United States experiences the cost of unmet demand, though the cost is
greatly attenuated compared to the cost borne by foreign country.
There is one obvious omission from the list of attributes: air pollution. Reductions
in air pollution in a developing country, especially one with a reliance on coal, is a
desirable outcome of expanded use of natural gas. Air pollution raises health care
costs, lowers economic productivity, reduces revenue from tourism, and can undermine
political legitimacy. However, these impacts will not be considered for two reasons.
First, the consequences of air pollution require detailed modeling and information as
they cannot be described by the amount of pollutants alone. Because of the relevant
physical and biological mechanisms, the timing, location, morbidity thresholds, and
population density of emissions are required to calculate population weighted changes
in ambient concentrations of pollutants and link them to societal outcomes. The
sophisticated air flow models required for this are beyond the scope of this research.
Second, unlike greenhouse gas emissions, the cost of air pollution is concentrated in
the country where they are released. While the intrinsic value of the environment is

CHAPTER 4. SPECIFYING THE POLICY PROBLEM 101
important to many Americans, environmental degradation abroad, is not considered
a national interest (Levy, 1994). In this analysis, the costs of air pollution will not be
explicitly modeled, but this is not to say that the air quality implications are lost on
U.S. foreign policymakers. The national costs of air pollution are a very compelling
rationale for action in negotiations with foreign governments that are experiencing
intolerable levels of pollution and the political crisis that often accompanies it.
There are two primary approaches to formalize value preferences for the three
attributes selected. The first is to monetize all of the attributes so they can be
compared in common terms. The second approach, is a family of multi criteria
decision methods (MCDM) including multi-attribute utility theory. These methods
combine various techniques for normalizing, weighting, and amalgamating attributes
(Hobbs & Meier, 2000; Keeney & Raiffa, 1976). Many valid MCDM methods could
be used to elicit value preferences. There is no single best method. The best practice
is to use more than one method to identify any robust conclusions and to use the
different elicitation processes to help the decision makers better understand their own
preferences (Hobbs & Meier, 1994). The strength of these methods is that attributes
can be evaluated in their native units and it avoids the often uncomfortable position
of monetizing non-market attributes. However, the monetization method makes it
more explicit how different attributes compare in relative importance.
In this analysis, the attributes will be monetized. Policy cost is naturally mon-
etized and a standardized monetization of the cost of greenhouse gas emissions is
available. There is no completely satisfactory way to monetize unmet demand for
electricity, but a few options are considered.
The U.S. government uses a social cost of carbon to quantify the cost of greenhouse
gas emissions, though it presents some challenges in interpretation. The social cost of
carbon is the monetized social marginal damages from greenhouse gas emissions based
on the global benefits of reducing emissions (Metcalf & Stock, 2017). The social cost of
carbon is a standardized monetization of greenhouse gases developed for the purpose
of comparing federal government policy options. Several critiques have explored the
implications of the discount rate used, the abstract nature of the damage functions
underlying the final calculation, and the interpretation of averaging results across
CHAPTER 4. SPECIFYING THE POLICY PROBLEM 102
integrated assessment models (Weyant, 2017; Pindyck, 2017). Here I will highlight
only two issues that relate more narrowly to the U.S. national interest. First, the
social cost of carbon is derived from damage functions which include the cost of
changes to agricultural productivity, degradation of human health, biodiversity loss,
property damage from extreme weather, and sea level rise that will result from rising
temperatures. However, important damages like ocean acidification, civil conflict,
and human migration are not included because our understanding of these damages
are in their infancy. The absence of the costs means that the current social cost
of carbon likely underestimates the true value. Second, the current methodology
for the social cost of carbon calculates the global cost of greenhouse gas emissions.
As the impacts of climate change will be experienced by all countries, the current
methodology overstates what costs will be borne by the United States. Despite the
shortcomings of the current calculation of the social cost of carbon, it is by design the
standardized value for federal policy comparison and is, therefore, suitable for this
analysis. The social cost of carbon at the 3% discount rate is used in this analysis,
beginning at USD 37 MtCO2 and rising over the time horizon.2
There is no standardized value for the cost of unmet demand for electricity in
foreign countries. While it is commonly stated that energy poverty and climate change
are equal goals, this rhetoric is not useful guidance for developing value preferences. It
is unclear if equality means they deserve equal budgets, or equal time, or something
else. Poor agricultural productivity, damage to human health, loss of biodiversity,
human migration and conflict are impacts common to climate change and unmet
demand. The cost of unmet demand could therefore be calculated as a fraction of the
social cost of carbon. Property damage in the developed world is a large portion of
the social cost of carbon as calculated today and not an impact of unmet demand for
electricity. This suggests the cost of unmet demand is a small fraction of the social
cost of carbon. Another consideration is that the social cost of carbon is considering
impacts that will occur in the future and discounting them to the current period. The
2The average U.S. household uses 1 megawatt-hour (MWh) of electricity in a month. Based onthe average emissions intensity in the United States, that month of electricity use, plus the fuelsused for heating and cooking produces a metric ton of carbon dioxide (MtCO2).
CHAPTER 4. SPECIFYING THE POLICY PROBLEM 103
impacts of unmet demand for electricity are being felt now which would re-inflate the
relative proportions of the two measures.
The cost of unmet demand to the United States is only in part captured by the
economic value lost because of unmet demand. It is more broadly the cost of stability
and prosperity. Therefore, unlike greenhouse gas emissions, the cost to the United
States of unmet demand for electricity is not the same in every developing country.
Different countries have different costs depending on their importance to the U.S.
economy, their importance in ongoing conflicts, and the instability caused by poverty.
Unmet demand in a country with a strong trade relationship with the United States
will have a higher cost. Similarly, unmet demand in a country with ongoing conflict,
especially one in which the United States is already involved, will also have a higher
cost.
Another way to estimate the cost of unmet demand is to infer from current U.S.
expenditures. I consider two options. First, the United States spends at least USD 1
per capita to promote prosperity and stability in the countries concerned. Energy is
only a fraction of the investment, which also supports programs in health care, edu-
cation, and infrastructure. The fraction that is spent on energy could be considered
the cost of unmet demand. The fraction spent on energy will not be the same in
every country and the per capita expenditure varies across countries.
Similarly, one could look at what the U.S. has been willing to spend on energy
development projects specifically, comparing the U.S. investment to the lifetime elec-
tricity generation from the project. This number is widely inconsistent across projects
as this is not how projects are selected. Current decisions are made on projects with-
out an explicit value and decisions may be based on a variety of factors in addition
to electricity delivery. This results in a broad range of implied values. Many projects
are susceptible to double counting as when projects have more than one sponsor con-
tributing a portion of the funds but claiming responsibility for all of the electricity
generated.
These different techniques result in a range of possible valuations for the cost to the
United States of the unmet demand for electricity in low and middle income countries.
In practice, the most appropriate methodology and the number itself could be decided
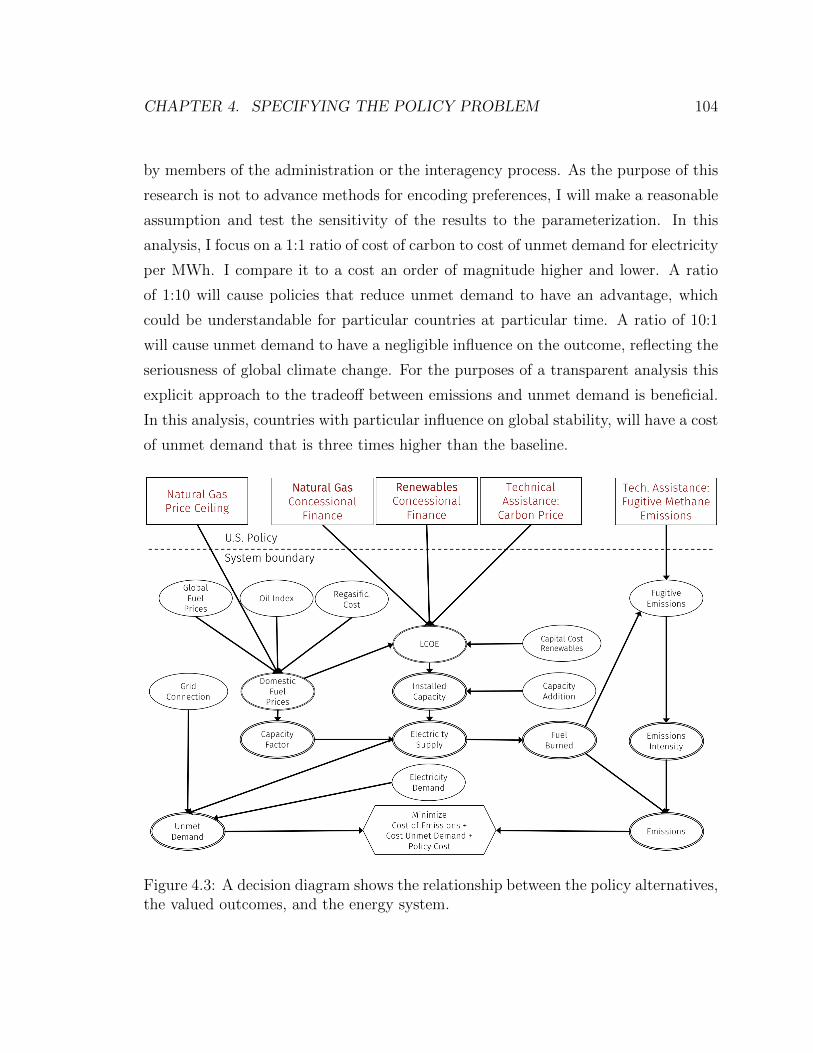
CHAPTER 4. SPECIFYING THE POLICY PROBLEM 104
by members of the administration or the interagency process. As the purpose of this
research is not to advance methods for encoding preferences, I will make a reasonable
assumption and test the sensitivity of the results to the parameterization. In this
analysis, I focus on a 1:1 ratio of cost of carbon to cost of unmet demand for electricity
per MWh. I compare it to a cost an order of magnitude higher and lower. A ratio
of 1:10 will cause policies that reduce unmet demand to have an advantage, which
could be understandable for particular countries at particular time. A ratio of 10:1
will cause unmet demand to have a negligible influence on the outcome, reflecting the
seriousness of global climate change. For the purposes of a transparent analysis this
explicit approach to the tradeoff between emissions and unmet demand is beneficial.
In this analysis, countries with particular influence on global stability, will have a cost
of unmet demand that is three times higher than the baseline.
Figure 4.3: A decision diagram shows the relationship between the policy alternatives,the valued outcomes, and the energy system.

CHAPTER 4. SPECIFYING THE POLICY PROBLEM 105
4.4 Conclusion
This chapter has refined the policy problem described in Chapter 3 in precise terms,
which will represented by mathematical modeling in Chapter 5. Figure 4.3 summa-
rizes the energy system boundaries, the U.S. policy options, and the valued objectives
of policy action. There are other possible framings than the one presented here. The
frame limits what can be answered, but is necessary so that the modeling is tractable
and the results are meaningful. This analysis of the role of natural gas in low and
middle income countries will narrowly address the U.S. national interest in specific
countries. This conclusion cannot be understood as what a social planner might find
to be economically efficient and may differ from the solution favored by leaders or
people in a developing country. The system boundary could have been more expan-
sive to include interactions in other fuel markets, electricity trade with neighboring
countries, and other sectors in the national economy. The system is limited to the
global gas market and the national electricity system. While this system and a consis-
tent decision basis will be considered in each of the modeling approaches in the next
chapter, the representation of them will change as system detail and the treatment
of uncertainty is varied. The decision basis presented here, which would in practice
come from an elicitation of members of the National Security Council, is based on my
assumptions. Using my own assumptions affects the policy recommendations made
in the final chapter, but it will allow a comparison of modeling approaches which is
the goal of the research.
Chapter 5
Models and Uncertainty Analysis
Essentially, all models are wrong,
but some are useful.
George Box, 1987
In this chapter, four different approaches to energy modeling under uncertainty
are contrasted: Predictive scenario analysis, Monte Carlo analysis, Decision analysis,
and Exploratory modeling and analysis. The four approaches are used to address the
question framed in Chapter 4:
When and where is it in the national interest of the United States to use
existing policy tools to promote natural gas-fired power to balance the
cost of unmet demand for electricity and the cost of climate change?
Uncertainty is an extremely important characteristic of this policy problem and
there is no guidance on which uncertainty analysis will yield the most insight. The
purpose of the chapter is to contrast available approaches to grappling with uncer-
tainty. To do that both a representation of the relevant uncertainty and a model of
the system are needed.
Two different models of the energy system are developed in this chapter to be
paired with different approaches to uncertainty. The first model of the energy system
is a combination of two optimization subroutines that determine the price of gas
106

CHAPTER 5. MODELS AND UNCERTAINTY ANALYSIS 107
delivered to the power sector based on equilibrium in the global gas market (INTrO)
and the corresponding least cost strategy for building and operating power plants
in a national electricity system (NEO). The second energy model is a simulation
of investment and operations of a national electricity system based on uncertain
exogenous gas prices (NESS). The two models are meant to approximate each other
as much as possible so that it is the different approaches to uncertainty analysis that
are contrasted. The optimization model will be the subject of scenario analysis and
Monte Carlo analysis. The simulation model will be the subject of decision analysis
and exploratory modeling and analysis, as summarized in Table 5.1.
Model name Acronym Uncertainty analysis
International Natural gas TRade INTrO Predictive scenario analysisOptimization Monte Carlo analysisNational Electricity Optimization NEO Predictive scenario analysis
Monte Carlo analysis
National Electricity System Simulation NESS Decision analysisExploratory modeling and analysis
Table 5.1: Pairing of models and approaches to uncertainty analysis
This chapter begins with a review of approaches to uncertainty analysis to place
the four that will be used here in context. The second section of this chapter will
present the two different models of the energy system. These two models will be used
to demonstrate four different approaches to managing uncertainty in the final section
of this chapter. In Chapter 6, the results from each of the approaches is synthesized to
make a single policy recommendation on the matter of natural gas and the methods
are contrasted to draw conclusions about the suitability of different treatments of
uncertainty for policy questions at the intersection of energy and foreign policy
5.1 Modeling approaches for decision making
under uncertainty
Modeling for decision making under uncertainty can be done in a variety of ways
with many types of underlying system models. The approaches to uncertainty analysis
CHAPTER 5. MODELS AND UNCERTAINTY ANALYSIS 108
differ based on how they treat unknown or inherently random variables in the system.
The differences in approach affect the input values, the solution algorithm, and the
form of the output. Each approach to uncertainty analysis assumes something about
both the types of uncertainty and the level of uncertainty that need to be addressed
in the analysis.
5.1.1 Taxonomies of uncertainty
Most simply, uncertainty arises anytime the probability of an event is not zero or one.
However, scholars have suggested a variety of taxonomies to make distinctions among
uncertainties. No single taxonomy is universally agreed, but a dominant view is
that there are two types of uncertainty model structure and parametric. Parametric
uncertainty can then be classified by its nature: aleatory or epistemic (Morgan &
Henrion, 1990).
Model structure uncertainty arises because models are by necessity a simplified
representation of reality. The relationship among variables, their functional forms,
and the parameters that are assumed fixed are choices by the model designer. This
implies other choices could have been made. Model structure uncertainty cannot be
represented probabilistically and is not likely to be reduced with more time (Morgan,
2003).
Deeper understanding of model structure and the artifacts of modeling choices is
understood with two methods: sensitivity analysis and model comparison. Sensitivity
analysis is commonly practiced and involves varying input values, one at a time or
jointly, to observe the corresponding change in output values. Sensitivity analysis
is used to find variables with the largest effect on outcomes and discontinuities in
results. Sensitivity analysis does not provide insight into uncertainty in the world,
but it rather helps the analyst learn more about the behavior of the model. Model
comparison, is another technique wherein models of different structures seek to answer
the same questions with the same input values. The differences in outputs between
models reveals information about the effect of the structural choices made in each
model (Huntington et al., 1982).
CHAPTER 5. MODELS AND UNCERTAINTY ANALYSIS 109
Aleatory uncertainty is the result of inherent randomness or natural variability
in a system. Aleatory uncertainty is irreducible, but this stochasticity can be de-
scribed probabilistically by specifying a distribution and its parameters. Epistemic
uncertainty is caused by incomplete knowledge. This incomplete knowledge could
be the result of limited understanding, unavailable information, or future decisions.
Epistemic uncertainty is reducible. Reducible uncertainty is important to identify
for two reasons. First, if the uncertainty can be narrowed then it may be worth the
cost of gathering more information. Second, there may be value in developing hedg-
ing strategies or delaying parts of the decision until more information is available.
Different types of uncertainty analysis make use of these advantages in policy design.
In addition to classification by type, uncertainties can also be described by a level
between total clarity and complete ignorance (Thissen & Walker, 2013). When there
is a clear idea of the direction of the future and point estimates are used for variables,
there is Level 1 uncertainty. Level 2 uncertainty is a recognition of multiple futures
with variables that can be characterized with probability. With Level 3 uncertainty,
it is possible to specify a range of potential values for variables and rank the most
likely, but it is not possible to describe the uncertainties probabilistically. In Level 4
uncertainty, alternative futures are plausible, but can be neither represented proba-
bilistically nor rank ordered. Level 5 similarly cannot be represented probabilistically
or ranked because of unknowns in the structure and variables.
5.1.2 Uncertainty analysis
Uncertainty analysis is family of specialized modeling methods that guide under-
standing about the effectiveness of policies when important variables are uncertain.
Different methods of uncertainty analysis are useful for addressing each level of un-
certainty. Uncertainty analysis that is helpful in untangling one type of uncertainty
may not be useful for interpreting and communicating results about other kinds of
uncertainty.
For Level 1 uncertainty, predictive scenarios are commonly used (EIA, 2017; IEA,
2016b). In a predictive scenario, one or a combination of a few input variables are
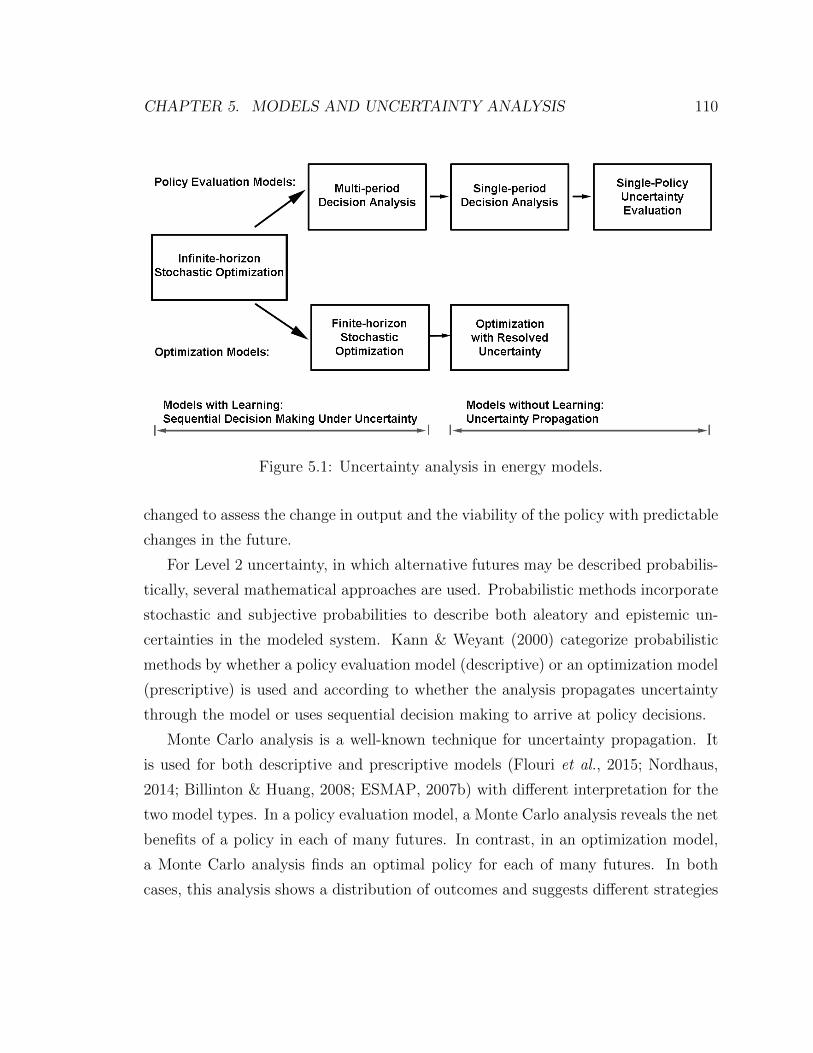
CHAPTER 5. MODELS AND UNCERTAINTY ANALYSIS 110
Figure 5.1: Uncertainty analysis in energy models.
changed to assess the change in output and the viability of the policy with predictable
changes in the future.
For Level 2 uncertainty, in which alternative futures may be described probabilis-
tically, several mathematical approaches are used. Probabilistic methods incorporate
stochastic and subjective probabilities to describe both aleatory and epistemic un-
certainties in the modeled system. Kann & Weyant (2000) categorize probabilistic
methods by whether a policy evaluation model (descriptive) or an optimization model
(prescriptive) is used and according to whether the analysis propagates uncertainty
through the model or uses sequential decision making to arrive at policy decisions.
Monte Carlo analysis is a well-known technique for uncertainty propagation. It
is used for both descriptive and prescriptive models (Flouri et al., 2015; Nordhaus,
2014; Billinton & Huang, 2008; ESMAP, 2007b) with different interpretation for the
two model types. In a policy evaluation model, a Monte Carlo analysis reveals the net
benefits of a policy in each of many futures. In contrast, in an optimization model,
a Monte Carlo analysis finds an optimal policy for each of many futures. In both
cases, this analysis shows a distribution of outcomes and suggests different strategies

CHAPTER 5. MODELS AND UNCERTAINTY ANALYSIS 111
for different states of the world while not providing any guidance on what state of
the world to expect.
Single period decision analysis, which uses a descriptive model, also employs un-
certainty propagation (Manne & Richels, 1978; Hamalainen & Karjalainen, 1992;
Zhou et al., 2006; Loken, 2007). Uncertain variables are described by discrete proba-
bilities and the value of the outcome is calculated for every combination of uncertain
variables. The result is a single policy that maximizes the expected value. Decision
analysis and Monte Carlo techniques use a deterministic model evaluated repeatedly.
The size of the deterministic model is limited by the number of variables treated as
uncertain and the number of times the model must be solved.
In contrast to uncertainty propagation models which suggest a policy based on the
current understanding of alternative futures, sequential decision making techniques
incorporate learning. Sequential decision making with a descriptive model is done
with multi-period decision analysis. Multi-period decision analysis is implemented
much the same as single-period decision analysis, but there is more than one decision
separated by uncertainty. Subsequent decisions are delayed until the revelation of
some previously uncertain variable. For a prescriptive analysis, stochastic optimiza-
tion is used to perform sequential decision making under uncertainty.
Unlike the canonical form of the linear program for linear optimization, stochas-
tic optimization has resulted in different solution algorithms developed in different
disciplines with different vocabulary and notation (Dantzig, 1963; Powell, 2014). Vari-
ations of dynamic programming and stochastic programming are two commonly used
solution algorithms. In stochastic programming uncertainty is resolved after one or
more stages. The decision maker can respond to the information learned and com-
pensate accordingly. The result is a single strategy that typically takes advantage
of hedging to balance the risks of action and delay. In dynamic programing, the
optimization is broken into subproblems solved with backward recursion. Again, the
result is an optimal policy given current information and expected future information.
Neither of these techniques use a simple adaptation of a deterministic model; both
require developing a specific model that can be solved with these methods (Egging,

CHAPTER 5. MODELS AND UNCERTAINTY ANALYSIS 112
2010; Powell et al., 2012; Webster et al., 2012; Messner et al., 1996). As a result, they
are not widely used in energy policy analysis.
Level 4 analysis1 in which alternative futures cannot be described probabilistically
or ranked is approached through methods that can identify a robust policy. Explo-
rative scenarios have also been used to understand policy decisions in unknown futures
(Wack, 1985b,a; van der Heijden, 1996; Schwartz, 1996; Borjeson et al., 2006; Wilkin-
son & Kupers, 2013; Trutnevyte, 2016). With this method, plausible narratives of the
future are developed based on assumptions that challenge conventional wisdom. Op-
tions are evaluated in these distinct futures to identify a policy that would perform
well despite considerable change. This use of scenarios is different from predictive
scenarios described earlier for exploring Level 1 uncertainty or “normative” scenarios
which are not used for uncertainty analysis (Quist, 2007).
Finally, Level 5 uncertainty, also referred to as deep uncertainty, recognizes that
the uncertainty may go deeper than variability or lack of knowledge. In deep uncer-
tainty the functional relationships between variables are uncertain themselves. Several
techniques are being refined for this type of uncertainty that are also relevant for Level
4 uncertainty. These techniques include robust decision making, exploratory mod-
eling and analysis, and dynamic adaptive analysis (Lempert et al., 2003; Thissen &
Walker, 2013; Haasnoot et al., 2013; Kwakkel & Pruyt, 2013). These techniques have
been used by a small set of energy and climate policy researchers (Hallegatte et al.,
2012; Chattopadhyay et al., 2016; Kwakkel et al., 2015; Keller, 2012; Agusdinata,
2008; Isley et al., 2015; Kalra et al., 2014).
Exploratory modeling and analysis explores policy performance across uncertainty
space with computational experiments to identify robust policies (Lempert et al.,
2003; Bankes, 1993). Uncertain inputs are sampled over their rangem and data anal-
ysis methods are used to reason about the system’s outcomes. This approach identifies
combinations of uncertain inputs for which the policy assessed succeeds or fails. The
policy is improved iteratively to perform better in these conditions.
1Thissen & Walker (2013, p231) assert that there are no methods of analysis designed specificallyfor Level 3 uncertainty. In practice, Level 3 uncertainty is treated as either Level 2 or Level 4.
CHAPTER 5. MODELS AND UNCERTAINTY ANALYSIS 113
5.2 Energy system models
In this chapter, different approaches to modeling uncertainty will be applied to two
different energy models: a simulation model and an optimization model. Both models
are constructed to represent the global natural gas market and a national electricity
system as laid out in the system boundaries in Chapter 4. The core function of the
models is to invest in power plants and generate electricity based on the competitive-
ness of different fuels and technologies. The fuel mix and the amount of electricity
generation drives emissions and meets demand for electricity.
For each country in Table 5.2 individually, both models determine the least cost
strategy for investing in power generation capacity and electricity generation based on
fuel costs, capital costs, operating costs, carbon charges if any, and costs of finance.
Six types of generating capacity can be installed: biomass, coal, diesel, natural gas,
variable renewable energy (ex. solar photovoltaics and wind turbines), and dispatch-
able zero carbon electricity (ex. large hydro, nuclear, and geothermal). For each type
of power generation plant the initial capacity is given along with the capital cost,
cost of capital, capacity factor, lifetime, heat rate, fuel cost, and emission intensity
parameters for a generator of a specific fuel type.
In the optimization framework the price of gas is calculated and in the simulation
model it is provided exogenously. The domestic price of gas depends on whether the
country is an importer or an exporter. If an importer then the domestic price of gas
is the international price plus the unit cost of regasification. If an exporter, then the
domestic price is the international price minus the unit cost of natural gas exported,
the opportunity cost of selling gas on international markets.
The prices for competing fuels are provided exogenously in both models. The
models share common assumptions about the characteristics of different fuels, tech-
nologies, and countries, as listed in the Appendix. In both models, fuels are param-
eterized as centralized power generators, but electrification in both models could be
interpreted as grid extension or mini-grid electricity. Transmission and distribution
is not modeled explicitly in either model.
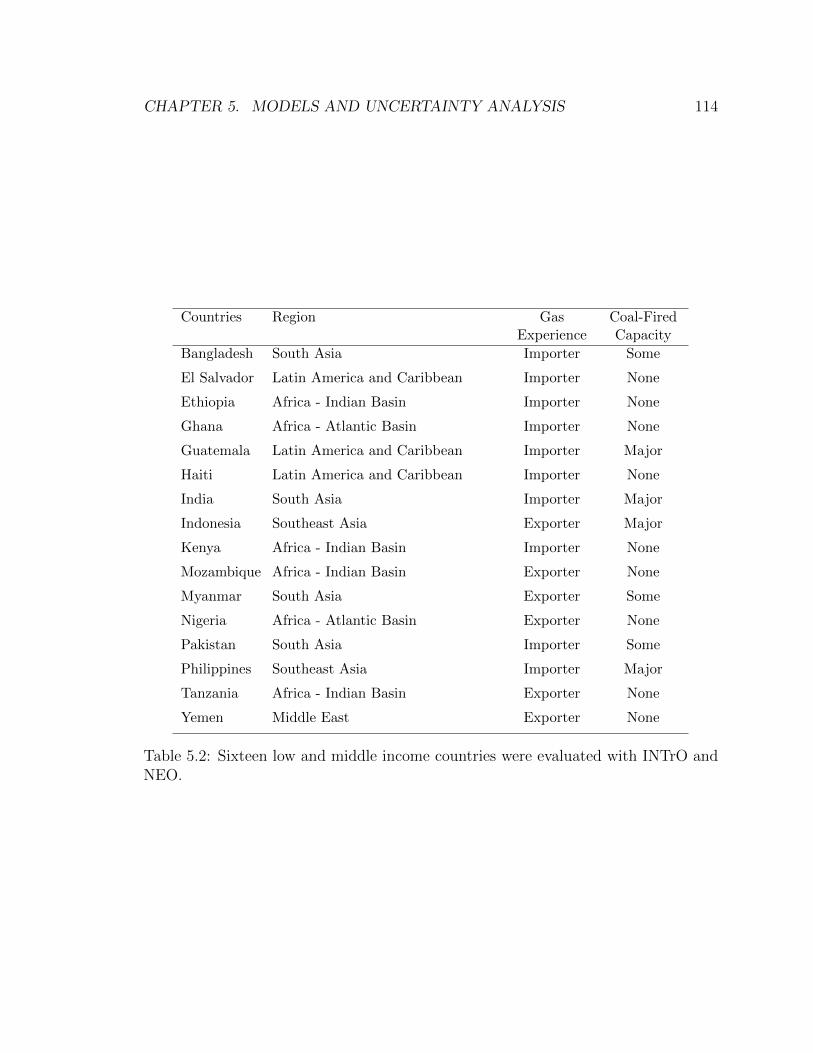
CHAPTER 5. MODELS AND UNCERTAINTY ANALYSIS 114
Countries Region GasExperience
Coal-FiredCapacity
Bangladesh South Asia Importer Some
El Salvador Latin America and Caribbean Importer None
Ethiopia Africa - Indian Basin Importer None
Ghana Africa - Atlantic Basin Importer None
Guatemala Latin America and Caribbean Importer Major
Haiti Latin America and Caribbean Importer None
India South Asia Importer Major
Indonesia Southeast Asia Exporter Major
Kenya Africa - Indian Basin Importer None
Mozambique Africa - Indian Basin Exporter None
Myanmar South Asia Exporter Some
Nigeria Africa - Atlantic Basin Exporter None
Pakistan South Asia Importer Some
Philippines Southeast Asia Importer Major
Tanzania Africa - Indian Basin Exporter None
Yemen Middle East Exporter None
Table 5.2: Sixteen low and middle income countries were evaluated with INTrO andNEO.
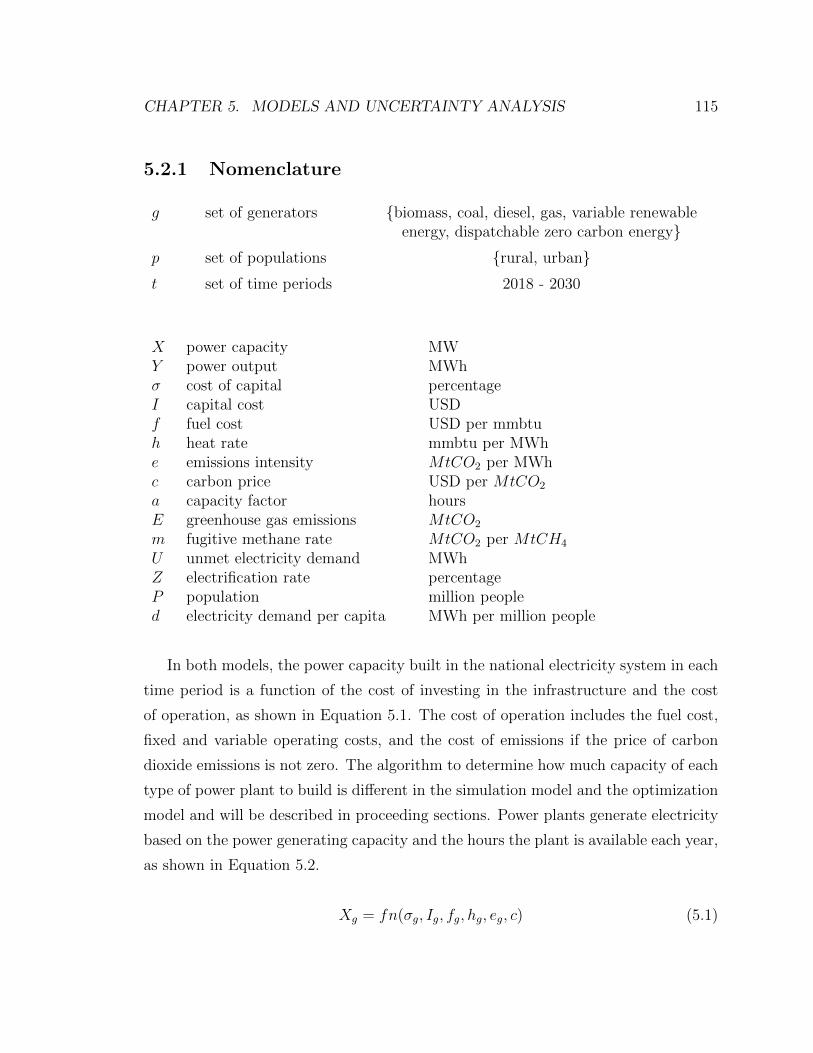
CHAPTER 5. MODELS AND UNCERTAINTY ANALYSIS 115
5.2.1 Nomenclature
g set of generators {biomass, coal, diesel, gas, variable renewableenergy, dispatchable zero carbon energy}
p set of populations {rural, urban}t set of time periods 2018 - 2030
X power capacity MWY power output MWhσ cost of capital percentageI capital cost USDf fuel cost USD per mmbtuh heat rate mmbtu per MWhe emissions intensity MtCO2 per MWhc carbon price USD per MtCO2
a capacity factor hoursE greenhouse gas emissions MtCO2
m fugitive methane rate MtCO2 per MtCH4
U unmet electricity demand MWhZ electrification rate percentageP population million peopled electricity demand per capita MWh per million people
In both models, the power capacity built in the national electricity system in each
time period is a function of the cost of investing in the infrastructure and the cost
of operation, as shown in Equation 5.1. The cost of operation includes the fuel cost,
fixed and variable operating costs, and the cost of emissions if the price of carbon
dioxide emissions is not zero. The algorithm to determine how much capacity of each
type of power plant to build is different in the simulation model and the optimization
model and will be described in proceeding sections. Power plants generate electricity
based on the power generating capacity and the hours the plant is available each year,
as shown in Equation 5.2.
Xg = fn(σg, Ig, fg, hg, eg, c) (5.1)
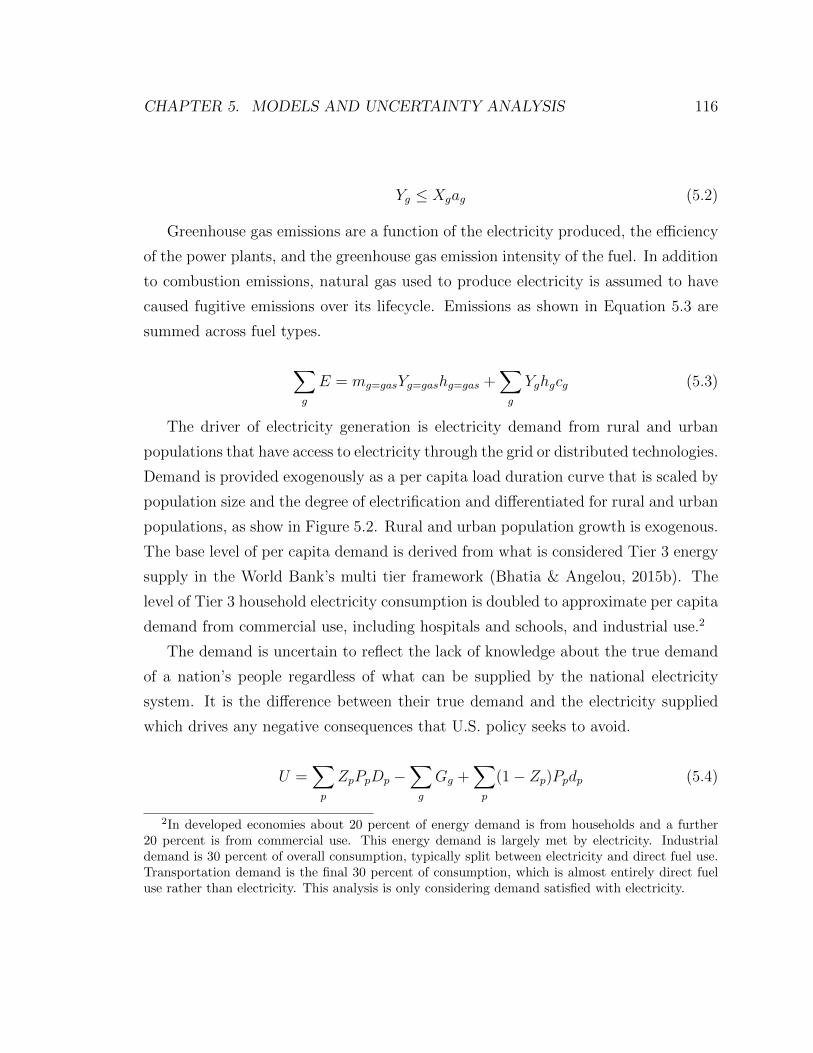
CHAPTER 5. MODELS AND UNCERTAINTY ANALYSIS 116
Yg ≤ Xgag (5.2)
Greenhouse gas emissions are a function of the electricity produced, the efficiency
of the power plants, and the greenhouse gas emission intensity of the fuel. In addition
to combustion emissions, natural gas used to produce electricity is assumed to have
caused fugitive emissions over its lifecycle. Emissions as shown in Equation 5.3 are
summed across fuel types.
∑g
E = mg=gasYg=gashg=gas +∑g
Yghgcg (5.3)
The driver of electricity generation is electricity demand from rural and urban
populations that have access to electricity through the grid or distributed technologies.
Demand is provided exogenously as a per capita load duration curve that is scaled by
population size and the degree of electrification and differentiated for rural and urban
populations, as show in Figure 5.2. Rural and urban population growth is exogenous.
The base level of per capita demand is derived from what is considered Tier 3 energy
supply in the World Bank’s multi tier framework (Bhatia & Angelou, 2015b). The
level of Tier 3 household electricity consumption is doubled to approximate per capita
demand from commercial use, including hospitals and schools, and industrial use.2
The demand is uncertain to reflect the lack of knowledge about the true demand
of a nation’s people regardless of what can be supplied by the national electricity
system. It is the difference between their true demand and the electricity supplied
which drives any negative consequences that U.S. policy seeks to avoid.
U =∑p
ZpPpDp −∑g
Gg +∑p
(1− Zp)Ppdp (5.4)
2In developed economies about 20 percent of energy demand is from households and a further20 percent is from commercial use. This energy demand is largely met by electricity. Industrialdemand is 30 percent of overall consumption, typically split between electricity and direct fuel use.Transportation demand is the final 30 percent of consumption, which is almost entirely direct fueluse rather than electricity. This analysis is only considering demand satisfied with electricity.
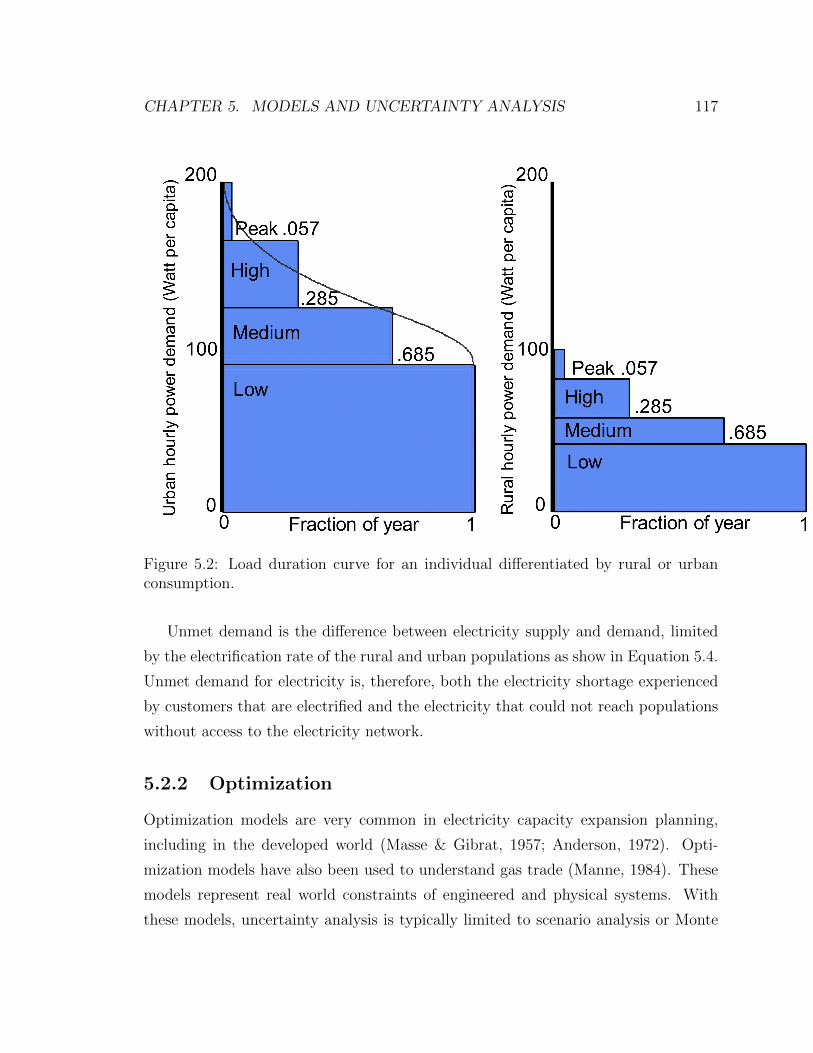
CHAPTER 5. MODELS AND UNCERTAINTY ANALYSIS 117
Figure 5.2: Load duration curve for an individual differentiated by rural or urbanconsumption.
Unmet demand is the difference between electricity supply and demand, limited
by the electrification rate of the rural and urban populations as show in Equation 5.4.
Unmet demand for electricity is, therefore, both the electricity shortage experienced
by customers that are electrified and the electricity that could not reach populations
without access to the electricity network.
5.2.2 Optimization
Optimization models are very common in electricity capacity expansion planning,
including in the developed world (Masse & Gibrat, 1957; Anderson, 1972). Opti-
mization models have also been used to understand gas trade (Manne, 1984). These
models represent real world constraints of engineered and physical systems. With
these models, uncertainty analysis is typically limited to scenario analysis or Monte
CHAPTER 5. MODELS AND UNCERTAINTY ANALYSIS 118
Carlo analysis. More sophisticated uncertainty analysis, like stochastic optimization,
requires a completely different mathematical expression and a less detailed model.
An optimization framework, which calculates the set of inputs which optimize
the desired objective, is used in this research as the basis for the predictive scenario
analysis and the Monte Carlo analysis.The optimization model links two separate
optimization programs. The first sub-model, the International Natural gas TRade
Optimization model, or INTrO, is a partial-equilibrium representation of the global
gas market. INTrO maximizes producer and consumer surplus across the time horizon
in each market, less transportation costs, subject to mass balancing constraints and
regasification, liquefaction, and pipeline capacity constraints. The model solves in
two year increments from 2018 - 2030 in fourteen regions, shown in Figure 5.3.
North America
South America &Caribbean
Africa - AtlanticBasin
Africa - IndianBasin
Mediterranean
Europe
MiddleEast
Russia & Central Asia
China
South Asia
Sakhalin
East Asia
Southeast Asia
Oceania
Figure 5.3: Regions of natural gas trade in the International Natural gas TRadeOptimization model.
The equilibrium price of natural gas is passed from INTrO to NEO, the National
Electricity Optimization model, the second sub-model. NEO is solved separately for
each of the countries in Table 5.2 in two year increments from 2018-2030. The vector
of natural gas prices for a particular country is based on its region and whether it is a
gas importer or a gas exporter. It is assumed that each country is a price taker on the

CHAPTER 5. MODELS AND UNCERTAINTY ANALYSIS 119
international gas market so that the natural gas and electricity markets can be solved
separately. While this is a necessary simplification, it has consequences. Because
of the global nature of both the energy sector and the construction sector, a wave
of natural gas investment in many countries simultaneously could change investment
strategies as prices for the commodity and construction rise. This interconnectedness
will not be captured in the modeling, therefore, the result could overestimate the
competitiveness of electricity from natural gas.
NEO determines the least cost strategy of generation capacity expansion and
electricity generation to meet demand based on the prices of fuels and technology.
While there are only two mechanisms for creating unmet demand in the simulation
model, unelectrified customers and electricity shortages, the optimization model has a
third mechanism. Electricity demand does not need to be met by accepting a penalty
for not serving demand that is electrified.
Detail on both INTro and NEO is provided for interested readers.
International Natural gas Trade Optimization
The International Natural gas Trade Optimization model is as follows.
t time stepss supply regionsd demand regions
Over all time steps, t, for all regions of supply and demand, s and d, maximize
the sum of producer and consumer welfare minus the cost of transportation.
Maximize C + P − T (5.5)
where consumer welfare is a function of the citygate price and the elasticity of demand
and producer welfare is a function of the wellhead prices and the elasticity of supply
as shown in Equation 5.6 and Equation 5.7.
C =
∫d
c( DD0
) 1εd (5.6)

CHAPTER 5. MODELS AND UNCERTAINTY ANALYSIS 120
C consumer welfare USDP producer welfare USDT transportation cost USDS supply McfS0 initial supply McfD demand McfD0 initial demand Mcfεd elasticity of demandεs elasticity of supplyc citygate price USD per Mcfw wellhead price USD per Mcfp pipeline gas Mcfl liquefied natural gas Mcfλ liquefaction capacity Mcf per annumρ regasification capacity Mcf per annumφ international pipeline capacity Mcf per annumπ processing and delivery cost USD per Mcfδ distribution USD per Mcfn shipping cost from liquefaction to regasification USD per Mcfn shipping cost from liquefaction to regasification USD per Mcfr regasification and distribution cost USD per Mcfq liquefaction cost and well to market cost USD per Mcft pipeline transportation cost and well to market cost USD per Mcf
P =
∫s
w( SS0
) 1εs
(5.7)
Transport costs for LNG include the cost of delivery, liquefaction, shipping, regasi-
fication, and distribution, and the costs for pipeline gas include the cost of delivery,
pipeline transportation, and distribution.
T =∑sd
(πsd + nsd + rd + qs + δsd)lsd + (πsd + tsd + δsd)psd (5.8)
Optimization is subject to supply of LNG and pipeline gas equaling demand (Equa-
tions 5.9 and 5.10), and capacity constraints for liquefaction, regasification, and
pipeline transportation (Equations 5.11 - 5.13). All volumes of gas are positive.
CHAPTER 5. MODELS AND UNCERTAINTY ANALYSIS 121
Ss =∑d
psd + lsd (5.9)
Dd =∑s
psd + lsd (5.10)
∑d
lsd ≤ λs (5.11)
∑s
lsd ≤ ρd (5.12)
psd ≤ φsd (5.13)
S,D, p, l ≥ 0
National Electricity Optimization model
The National Electricity Optimization model is as follows.
t time steps 2018, 2020, 2022, 2024, 2026, 2028, 2030s supply regionsd demand regions
In each time period, the model will choose how much capacity of each fuel type
to build, X,and how much electricity to generate of each fuel type, Y .
The optimization will minimize the discounted total cost over all the time periods.
The total cost is the sum of the investment costs, the operating costs, and the penalty
for unmet demand, as shown in Equations 5.14 - 5.17. Optimization is subject to
constraints that power output cannot exceed available capacity (5.18), electricity
produced must be greater than demand served and unserved (5.19), an unelectified
demand is equal to the demand of the population not electrified (5.20).
Minimize∑t
1
(1 + δ)t(St +Ot + Ut) (5.14)
CHAPTER 5. MODELS AND UNCERTAINTY ANALYSIS 122
X power capacity MWY power output MWZ power output MWδ discount rate percentageS capital investment USDO operating cost USDU cost of unmet demand USDσ cost of capital percentageI investment capital cost per unit of capacity USD per MWf fuel cost USD per mmbtuh heat rate mmbtu per MWhe emissions intensity MtCO2 per MWhc carbon price USD per MtCO2
θb hours in load block b hoursα unit cost of unmet demand USD per MWhN unelectrified demand for power MWW unserved demand for power MWa availability hoursP population million peopled instantaneous power demand MWh per million people
where,
St =∑gv
σg
T∑v=1
IjvXjv (5.15)
Ot =∑gv
((fgvthgv + ctegvt)∑b
θbYgvbt) (5.16)
Ut = α∑b
θb(Nbt +Wbt) (5.17)
subject to,
∑b
Ygvtp ≤ agvXgv (5.18)
∑gv
Ygvbt ≥∑c
dbctPcZct −Wbt (5.19)
CHAPTER 5. MODELS AND UNCERTAINTY ANALYSIS 123
Nbt =∑c
dbctPc(1− Zct) (5.20)
where,
X, Y,N,W ≥ 0
0 ≤ Z ≤ 1
5.2.3 Simulation
A simulation energy model, which calculates outputs based on given inputs, is at the
center of decision analysis and the exploratory analysis. The underlying structure of
the simulation model is described below.
National Electricity System Simulation
In contrast to the optimization framework just described, the simulation framework
does not have a gas market module. A vector of natural gas prices for each country
is provided exogenously along with prices for biomass, coal, and diesel.
In each time period, the share of generation from variable renewable electricity
and dispatchable zero carbon electricity is equal to the capacity that is available
limited by the capacity factor. Thermal generators produces the rest of the needed
electricity, each in proportion to the market shares determined by a modified logit,
shown in Equation 5.21.
sg′ =αg′p
γg′∑
g′ αg′pγg′
(5.21)
where s is the share of capacity of each fuel, p is the heat rate times the fuel price
α is the share weight, γ is the logit exponent, and g′ is a subset of generators which
only includes the thermal generators (biomass, coal, diesel, gas). The modified logit
responds quickly to changes in p, which reflects the flexibility of electricity dispatch.
The carbon free generation will produce with all available capacity and electricity from
thermal generators will be restricted so that total generation does not exceed total
CHAPTER 5. MODELS AND UNCERTAINTY ANALYSIS 124
demand if based on available capacity factors and installed capacity total generation
is more than total demand, as shown in 5.22:
∑g
Yg ≤∑p
ZpPpdp (5.22)
In each time period, the share of investment in power generating capacity of
each type is determined by a discrete choice function based on the levelized cost of
electricity from each type of generator. This investment becomes available in the
subsequent period. The logit function in Equation 5.23 moderates the switch from
one type of power plant to another as prices change (Clarke & Edmonds, 1993).
sg =αgexp(βpg)∑f αgexp(βpg)
(5.23)
where s is the share of investment in each fuel, p is the levelized cost of electricity α
is the share weight, β is the logit coefficient, and g is the set of generators (biomass,
coal, diesel, gas, variable renewable energy, dispatchable zero carbon energy).
The logit coefficient, β, was calibrated to make biomass and dispatchable renew-
able energy (geothermal, nuclear, and large hydro) take a smaller share of the market
than their price would dictate because of the resource limitations common to these
technologies. In contrast, the β for variable renewable electricity and diesel gener-
ation was calibrated to treat investment more favorably than they would on price
alone. This modification was made to capture the additional value these technolo-
gies provide in countries that rely on distributed electricity generation because of the
limitations of the central electricity grid.
Because no limit was placed on the share of generation from variable renewable
electricity and it was assumed that all available renewable generators would produce
electricity, investment in additional variable renewable energy was artificially slowed.
When the share of variable generation exceeds the threshold, 20 percent rising to 50
percent from 2018 to 2030, the levelized cost of electricity is artificially increased.
Without this modification investment in variable renewable energy would increase
beyond what could economically be handled with current technology. Investment in
CHAPTER 5. MODELS AND UNCERTAINTY ANALYSIS 125
variable renewable electricity does not stop, but the gain in market share is slowed.
This formulation can be interpreted as the additional cost of electricity storage being
born by the new variable renewable energy investments.
The discrete choice formulation was employed to prevent the winner take all in-
vestment strategy common to optimization frameworks, where the technology with
the lowest price gains all of the market share. However, the competition between
coal and natural gas in the power sector is very sensitive to price. To make the fuel
commitment between gas and coal more pronounced the levelized cost of electricity
from gas or coal was artificially increased when making investment decisions.
Countries were given a gas propensity score and a coal propensity score. Countries
with no infrastructure for the fuel were given a propensity score of 0. Countries
with existing infrastructure but without domestic resources were given a score of 5.
Countries with existing infrastructure and domestic production were given a 10. A
propensity score of 10 in favor of one fuel disadvantages the other fuel with a penalty
on the order of USD 0.01 per kWh added to the levelized cost of electricity. For
example, if Yemen were faced with an uncorrected choice between USD 0.05 per kWh
gas and USD 0.05 per kWh coal, coal and gas would win equal market share. But
accounting for Yemen’s domestic gas production and no existing infrastructure for
coal, the correction would change the market share decision to a choice between USD
0.05 per kWh gas and USD 0.06 per kWh coal, pushing the market share towards
gas.
5.3 Uncertainty analysis: The role of natural gas
In this section, four different types of uncertainty analysis are conducted on the two
energy models described in the previous section: predictive scenario analysis, Monte
Carlo analysis, decision analysis, and exploratory modeling and analysis. Each sub-
section will begin with a description of the representation of the uncertain variables.
Figure 5.4 depicts the fundamantal difference between the representation of uncer-
tainty. Predictive scenario analysis uses a point estimate. Exploratory modeling
and analysis uses a range. Monte Carlo uses a continuous probability distribution.
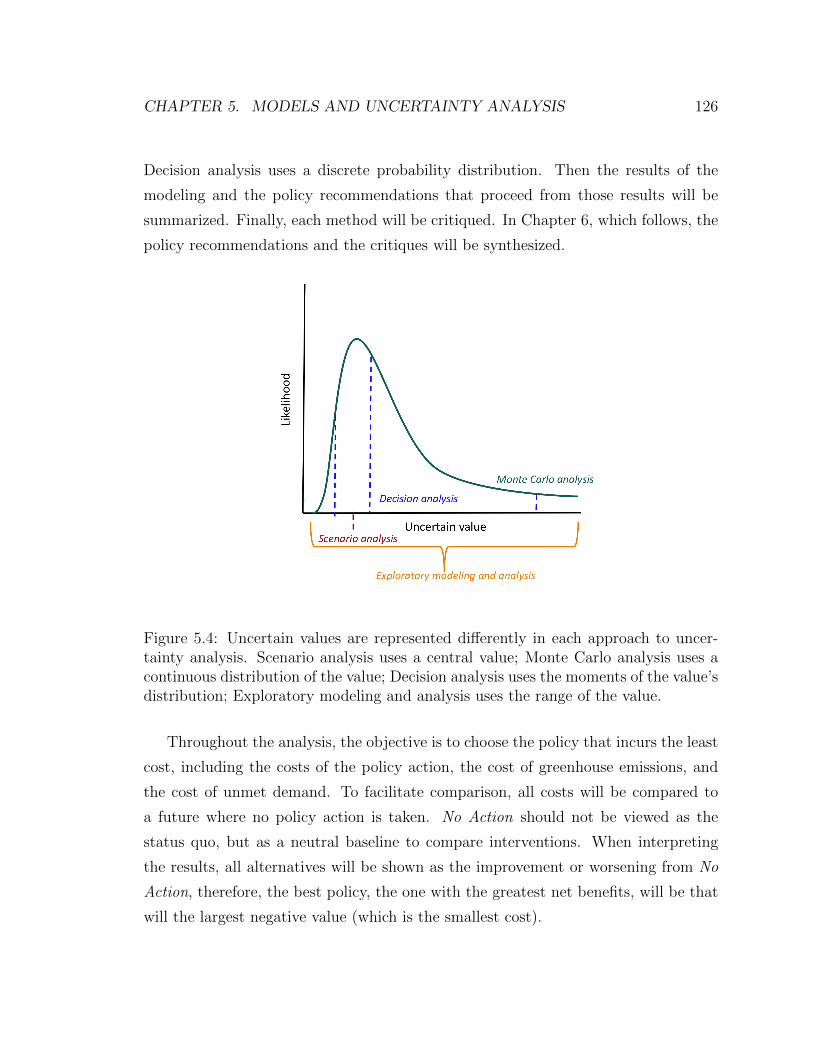
CHAPTER 5. MODELS AND UNCERTAINTY ANALYSIS 126
Decision analysis uses a discrete probability distribution. Then the results of the
modeling and the policy recommendations that proceed from those results will be
summarized. Finally, each method will be critiqued. In Chapter 6, which follows, the
policy recommendations and the critiques will be synthesized.
Figure 5.4: Uncertain values are represented differently in each approach to uncer-tainty analysis. Scenario analysis uses a central value; Monte Carlo analysis uses acontinuous distribution of the value; Decision analysis uses the moments of the value’sdistribution; Exploratory modeling and analysis uses the range of the value.
Throughout the analysis, the objective is to choose the policy that incurs the least
cost, including the costs of the policy action, the cost of greenhouse emissions, and
the cost of unmet demand. To facilitate comparison, all costs will be compared to
a future where no policy action is taken. No Action should not be viewed as the
status quo, but as a neutral baseline to compare interventions. When interpreting
the results, all alternatives will be shown as the improvement or worsening from No
Action, therefore, the best policy, the one with the greatest net benefits, will be that
will the largest negative value (which is the smallest cost).
CHAPTER 5. MODELS AND UNCERTAINTY ANALYSIS 127
Sixteen countries were evaluated, and results from four of those sixteen countries
will be presented here: Ghana, Guatemala, Mozambique, and Pakistan. The four
presented were chosen because of the diversity of behavior each demonstrate.
5.3.1 Predictive scenario analysis
There are three types of scenario analysis: normative, explorative, and predictive.
While these different techniques look similar cosmetically, they have very different
purposes and interpretations. In normative scenario analysis a desirable future state
is identified and a model is used to back calculate the system conditions that are
necessary to achieve that future. Explorative scenario analysis is a highly partici-
patory process that brings analysts and decision makers together to challenge the
conventional wisdom and explore plausible futures and their implications for policy
and business decisions today. Predictive scenario analysis contrives futures based
on variations in one or a few parameters believed to be highly uncertain or highly
impactful. Predictive scenario analysis is by far the most commonly practiced uncer-
tainty analysis in energy modeling because of its simplicity. This section presents a
predictive scenario analysis using INTrO-NEO, the optimization model presented in
Section 5.2.2.
Representation of uncertainty
In INTrO, four variables are treated as uncertain over the time horizon. The shipping
cost of LNG, the cost of regasifiying LNG, gas consumption in China and the Middle
East, and gas production in North America and China. In NEO, ten variables are
treated as uncertain which broadly affect the total amount of electricity demanded,
the price of fuels, the price of technologies, and emissions intensity of fuels.
Three scenarios are developed: abundance, clean, and growth. These scenarios
were designed to be qualitatively and quantitatively different, but plausible. Table
5.3 summarizes the set of fourteen values for the uncertain variables used in the
scenario analysis. The values are expressed as a percentage of the base value. In
Abundance technological progress reduces the cost of producing natural gas and the

CHAPTER 5. MODELS AND UNCERTAINTY ANALYSIS 128
capital cost of renewable energy. The abundance of gas allows the formation of a
liquid natural gas market which breaks the oil price indexation. Both urban and
rural demand rise over current levels. In Clean the declines recently observed in the
cost of renewable energy are sustained for another decade while the price of fossil fuels
rise only slightly. Energy efficient appliances keep demand in the developing world
low. Electrification is equal to the historical rate of electrification and the capacity
addition rate is twice its historical level. In Growth, low prices for coal and oil spur
global economic growth that raises the fortunes of low income countries resulting in
high demand and faster rates of electrification than average.
Uncertain variable Abundance Clean Growth
Natural gas supply 150 100 100Natural gas demand 100 50 150LNG shipping cost 50 100 150Global coal price 130 130 90Global diesel price 230 130 80Regasification cost 100 80 120Fugitive emission rate 40 100 200Capacity addition rate 100 200 50Rural demand per capita 30 10 100Urban demand per capita 130 50 300Rural electrification rate 90 100 110Urban electrification rate 99 100 101Oil indexation No Yes YesVariable renewable capital cost 92 96 96
Table 5.3: Values of uncertain variables in three scenarios presented as percentage ofbase value. For example, if the capacity addition rate is 0.05%, then it equals 0.05%,0.1%, and 0.025% in the abundance, clean, and growth scenarios respectively.
Results and policy insights
The five policies, detailed in Chapter 4, are applied to each of these three scenarios:
a price ceiling on natural gas, technical assistance to institute a carbon price in the
electricity sector, technical assistance to reduce fugitive methane emissions, conces-
sional finance for gas power plants, and concessional finance for variable renewable
CHAPTER 5. MODELS AND UNCERTAINTY ANALYSIS 129
energy. Figure 5.5 shows the greenhouse gas emissions and the unmet demand for
electricity for each policy relative to no action in three scenarios. Points to the left
and below the origin indicate that emissions and unmet demand are reduced. Points
at the origin indicate that the policy intervention had no effect on either emissions
or unmet demand.
None of the four countries presented exhibit similar behavior. Guatemala responds
most to intervention in the abundance scenario. Concessional finance for gas lowers
unmet demand the most, but reduces emissions less than either the carbon price or
finance for renewables. Ghana responds most to intervention in a Clean scenario. In
this future, support for renewables dominates the other policies in both dimensions.
Mozambique responds to policy in both the abundance and growth scenarios, but
different policies have net benefits. In abundance concessional finance for gas reduces
unmet demand, but at the cost of raising emissions. Renewables and carbon pricing
reduce emissions but increase unmet demand. In growth fugitive emissions reductions
are more than half the emissions benefit of a carbon price. In Pakistan, it can be seen
that in one scenario renewables and carbon pricing lower emissions substantially with
no adverse effect on unmet demand, while in another those same policies increase
unmet demand with comparatively little reduction in emissions.
Table 5.4 summarizes the policy with the greatest net benefit in each country
and scenario. The best policy has the greatest cost improvement over no action after
summing the cost of the policy, the cost of the increase or decrease in emissions,
and the cost of the increase or decrease of unmet demand. Generalizing from this
summary, concessional finance has net benefits in a clean scenario and a carbon price
has net benefits in a growth scenario. No conclusions can be drawn about the best
policy in an abundance scenario.
Table 5.5 shows the policy with the largest net benefits in each country, in each
scenario, for three different sets of preferences. The 10:1 value preference ratio pri-
oritizes climate change over reducing unmet demand, and the 1:10 ratio prioritizes
meeting demand for electricity over reducing emissions. In clean and growth, different
preferences have little effect on the policies that deliver net benefits. In abundance,

CHAPTER 5. MODELS AND UNCERTAINTY ANALYSIS 130
(a) Guatemala (b) Ghana
(c) Mozambique (d) Pakistan
Figure 5.5: Impact of policies on tradeoff between unmet demand and emissions.Note axes on difference scales. Results from scenario analysis.
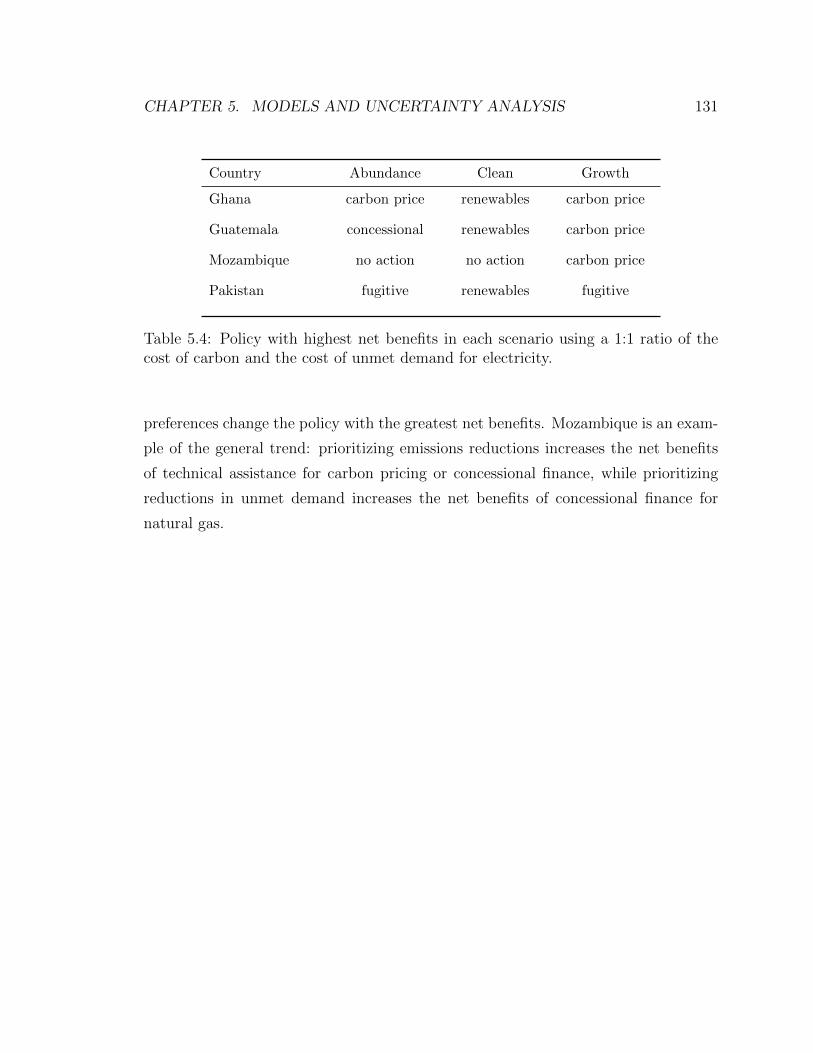
CHAPTER 5. MODELS AND UNCERTAINTY ANALYSIS 131
Country Abundance Clean Growth
Ghana carbon price renewables carbon price
Guatemala concessional renewables carbon price
Mozambique no action no action carbon price
Pakistan fugitive renewables fugitive
Table 5.4: Policy with highest net benefits in each scenario using a 1:1 ratio of thecost of carbon and the cost of unmet demand for electricity.
preferences change the policy with the greatest net benefits. Mozambique is an exam-
ple of the general trend: prioritizing emissions reductions increases the net benefits
of technical assistance for carbon pricing or concessional finance, while prioritizing
reductions in unmet demand increases the net benefits of concessional finance for
natural gas.

CHAPTER 5. MODELS AND UNCERTAINTY ANALYSIS 132
Ab
un
dan
ceC
lean
Gro
wth
Cou
ntr
y10
:11:
11:1
010:1
1:1
1:1
010:1
1:1
1:1
0
Gh
ana
carb
onca
rbon
carb
on
ren
ewable
sca
rbon
ceil
ing
ren
ewab
les
carb
on
ceil
ing
ren
ewab
les
carb
on
carb
on
carb
on
carb
on
Gu
atem
ala
carb
onco
nce
ssio
nal
con
cess
ion
alca
rbon
ceil
ing
con
cess
ion
al
carb
on
ren
ewab
les
ren
ewab
les
ren
ewab
les
ren
ewab
les
carb
on
carb
on
carb
on
Moz
amb
iqu
eca
rbon
ren
ewab
les
no
acti
onco
nce
ssio
nal
no
act
ion
no
act
ion
no
act
ion
carb
on
fugit
ive
carb
on
fugit
ive
carb
on
fugit
ive
Pak
ista
nca
rbon
ren
ewab
les
fugi
tive
fugi
tive
carb
onfu
git
ive
ren
ewab
les
carb
on
ceil
ing
fugit
ive
ren
ewab
les
carb
on
ceil
ing
fugit
ive
ren
ewab
les
carb
on
ceil
ing
fugit
ive
fugit
ive
carb
on
fugit
ive
carb
on
fugit
ive
carb
on
Tab
le5.
5:P
olic
ies
wher
eb
enefi
tsou
twei
ghco
sts
inor
der
ofpre
fere
nce
.R
esult
sof
scen
ario
anal
ysi
s.
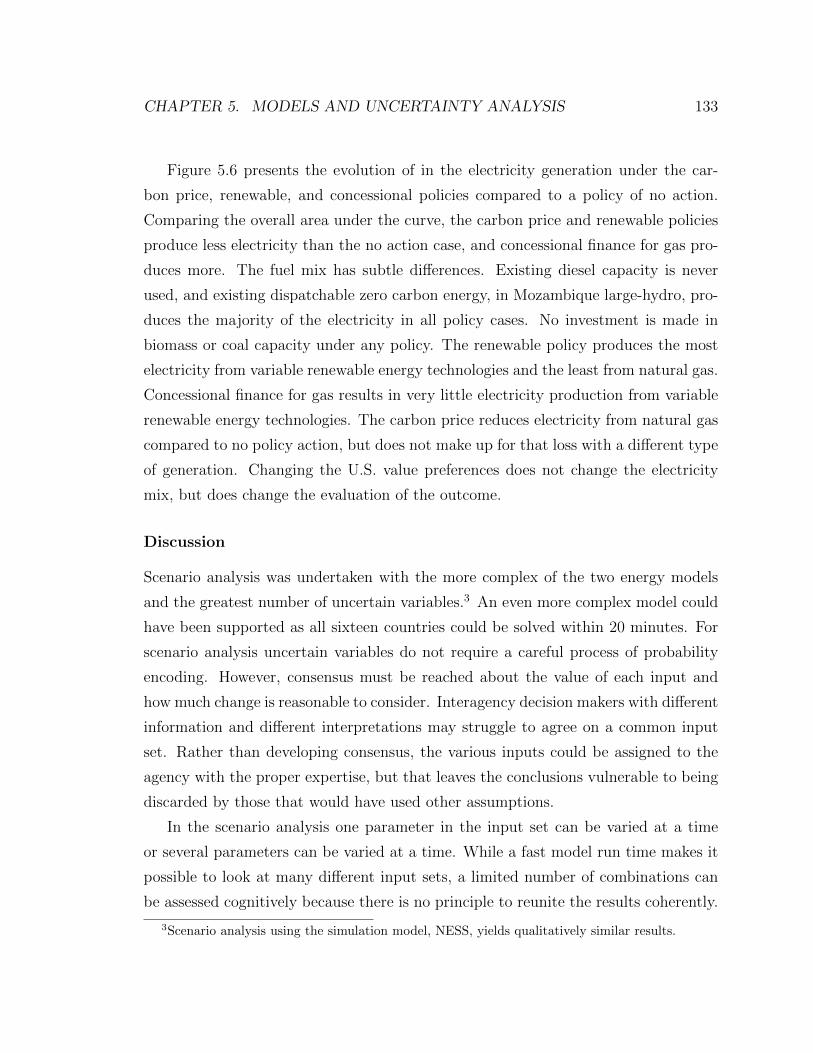
CHAPTER 5. MODELS AND UNCERTAINTY ANALYSIS 133
Figure 5.6 presents the evolution of in the electricity generation under the car-
bon price, renewable, and concessional policies compared to a policy of no action.
Comparing the overall area under the curve, the carbon price and renewable policies
produce less electricity than the no action case, and concessional finance for gas pro-
duces more. The fuel mix has subtle differences. Existing diesel capacity is never
used, and existing dispatchable zero carbon energy, in Mozambique large-hydro, pro-
duces the majority of the electricity in all policy cases. No investment is made in
biomass or coal capacity under any policy. The renewable policy produces the most
electricity from variable renewable energy technologies and the least from natural gas.
Concessional finance for gas results in very little electricity production from variable
renewable energy technologies. The carbon price reduces electricity from natural gas
compared to no policy action, but does not make up for that loss with a different type
of generation. Changing the U.S. value preferences does not change the electricity
mix, but does change the evaluation of the outcome.
Discussion
Scenario analysis was undertaken with the more complex of the two energy models
and the greatest number of uncertain variables.3 An even more complex model could
have been supported as all sixteen countries could be solved within 20 minutes. For
scenario analysis uncertain variables do not require a careful process of probability
encoding. However, consensus must be reached about the value of each input and
how much change is reasonable to consider. Interagency decision makers with different
information and different interpretations may struggle to agree on a common input
set. Rather than developing consensus, the various inputs could be assigned to the
agency with the proper expertise, but that leaves the conclusions vulnerable to being
discarded by those that would have used other assumptions.
In the scenario analysis one parameter in the input set can be varied at a time
or several parameters can be varied at a time. While a fast model run time makes it
possible to look at many different input sets, a limited number of combinations can
be assessed cognitively because there is no principle to reunite the results coherently.
3Scenario analysis using the simulation model, NESS, yields qualitatively similar results.
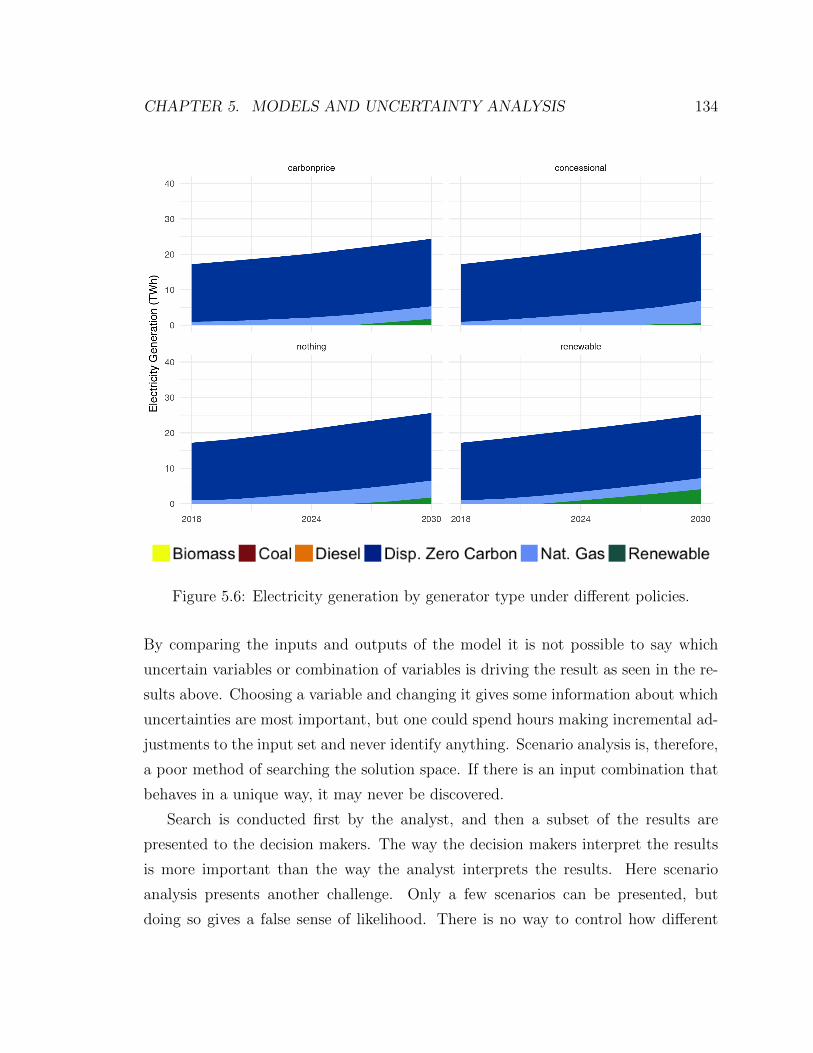
CHAPTER 5. MODELS AND UNCERTAINTY ANALYSIS 134
Figure 5.6: Electricity generation by generator type under different policies.
By comparing the inputs and outputs of the model it is not possible to say which
uncertain variables or combination of variables is driving the result as seen in the re-
sults above. Choosing a variable and changing it gives some information about which
uncertainties are most important, but one could spend hours making incremental ad-
justments to the input set and never identify anything. Scenario analysis is, therefore,
a poor method of searching the solution space. If there is an input combination that
behaves in a unique way, it may never be discovered.
Search is conducted first by the analyst, and then a subset of the results are
presented to the decision makers. The way the decision makers interpret the results
is more important than the way the analyst interprets the results. Here scenario
analysis presents another challenge. Only a few scenarios can be presented, but
doing so gives a false sense of likelihood. There is no way to control how different
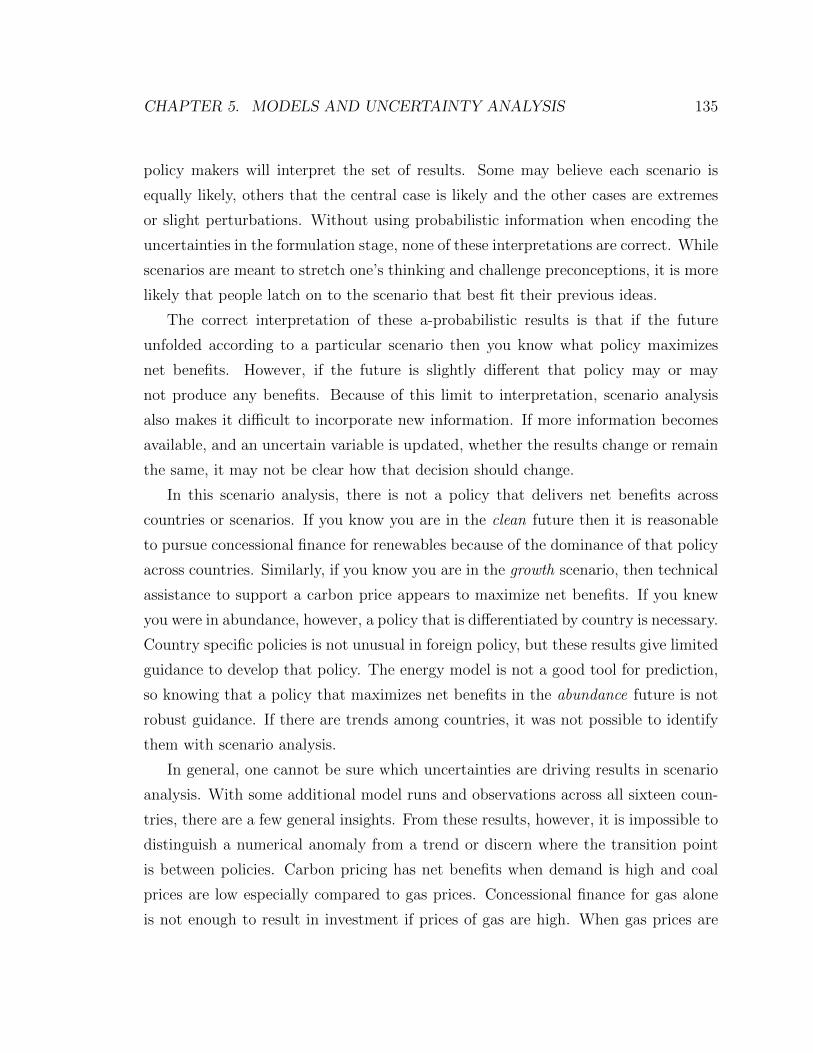
CHAPTER 5. MODELS AND UNCERTAINTY ANALYSIS 135
policy makers will interpret the set of results. Some may believe each scenario is
equally likely, others that the central case is likely and the other cases are extremes
or slight perturbations. Without using probabilistic information when encoding the
uncertainties in the formulation stage, none of these interpretations are correct. While
scenarios are meant to stretch one’s thinking and challenge preconceptions, it is more
likely that people latch on to the scenario that best fit their previous ideas.
The correct interpretation of these a-probabilistic results is that if the future
unfolded according to a particular scenario then you know what policy maximizes
net benefits. However, if the future is slightly different that policy may or may
not produce any benefits. Because of this limit to interpretation, scenario analysis
also makes it difficult to incorporate new information. If more information becomes
available, and an uncertain variable is updated, whether the results change or remain
the same, it may not be clear how that decision should change.
In this scenario analysis, there is not a policy that delivers net benefits across
countries or scenarios. If you know you are in the clean future then it is reasonable
to pursue concessional finance for renewables because of the dominance of that policy
across countries. Similarly, if you know you are in the growth scenario, then technical
assistance to support a carbon price appears to maximize net benefits. If you knew
you were in abundance, however, a policy that is differentiated by country is necessary.
Country specific policies is not unusual in foreign policy, but these results give limited
guidance to develop that policy. The energy model is not a good tool for prediction,
so knowing that a policy that maximizes net benefits in the abundance future is not
robust guidance. If there are trends among countries, it was not possible to identify
them with scenario analysis.
In general, one cannot be sure which uncertainties are driving results in scenario
analysis. With some additional model runs and observations across all sixteen coun-
tries, there are a few general insights. From these results, however, it is impossible to
distinguish a numerical anomaly from a trend or discern where the transition point
is between policies. Carbon pricing has net benefits when demand is high and coal
prices are low especially compared to gas prices. Concessional finance for gas alone
is not enough to result in investment if prices of gas are high. When gas prices are

CHAPTER 5. MODELS AND UNCERTAINTY ANALYSIS 136
low, then concessional finance for gas is unnecessary and is just an added expense.
Similarly, if the capital cost of renewable energy is low, then concessional finance to
support variable renewable energy adds costs but no benefits. Concessional finance
for renewable have net benefits when demand is low and fossil fuel prices are high.
There is no insight into conditions that support a gas price ceiling because it ap-
peared infrequently. Large countries that are gas producers benefit from technical
assistance to reduce emissions. Small gas producers do not appear to benefit because
the cost of the technical assistance is large relative to the gains to be made.4 Support
for reducing fugitive emissions lowers greenhouse gas emissions, but has no effect on
unmet demand.
5.3.2 Monte Carlo analysis
Monte Carlo analysis, is an approach to uncertainty analysis centered around sam-
pling from a probability distribution. A typical application of standard Monte Carlo
analysis includes specifying a joint probability distribution for uncertain variables,
sampling of the probability functions, and analyzing the output distributions.
Representation of uncertainty
As in the scenario analysis, fourteen variables are treated as uncertain in the Monte
Carlo analysis. Each uncertain variable is represented as a probability distribution
based on historical data or subjective probability form expert elicitation.6 Using the
INTrO-NEO model, 1000 input sets were drawn from distributions for each uncertain
value, listed in Table 5.6.
Results and policy insights
Figure 5.7 shows the relative change in emissions and unmet demand for each policy
relative to taking no policy action. Whereas in the scenario analysis each country
4This analysis did not scale the size of the technical assistance budget based on the size of thecountry which would be reasonable in a more targeted analysis of a specific country.
6The authors beliefs were used for subjective probabilities in this analysis.

CHAPTER 5. MODELS AND UNCERTAINTY ANALYSIS 137
Uncertain variable Distribution Alpha Beta
Natural gas supply Normal 1 0.4Natural gas demand Normal 1 0.4LNG shipping cost Normal 1 0.4Global coal price Inverse gamma 3 0.5Global diesel price Inverse gamma 3 1Regasification cost Inverse gamma 2.25 0.5Fugitive emission rate Inverse gamma 2 0.25Capacity addition rate Inverse gamma 4.5 0.025Rural demand per capita Inverse gamma 1.5 0.25Urban demand per capita Inverse gamma 3 0.5Rural electrification rate Symmetrical gamma 0.5 2Urban electrification rate Symmetrical gamma 2 8Oil indexation5 Discrete Y = 0.6 N = 0.4Variable renewable capital cost Inverse gamma 4 0.1
Table 5.6: Distributions of uncertain variables used in the Monte Carlo analysis. Forthe normal distributions, alpha is the mean and beta is the standard deviation.
appeared to behave very differently to each policy, these figures show great consistency
among countries.
There is no policy that dominates the lower left quadrant, so all policies involve
some tradeoff between the attributes of interest. A carbon price consistently reduces
emissions and increases unmet demand. Renewables have a similar, but less extreme
effect. Emissions are reduced and unmet demand may increase or decrease. Technical
assistance to reduce fugitive emissions reduces emissions but has no effect on unmet
demand. A price ceiling for gas decreases unmet demand, but may come with a high
or low cost of additional emissions.
Concessional finance for gas exhibits a similar behavior in Guatemala, Ghana, and
Pakistan, but a slightly different trend in Mozambique. In these countries, unmet
demand is unchanged or reduced compared to no policy action. In some futures
emissions increase by a modest amount, while in others, emissions decrease. There
is a high concentration of points at the origin, suggesting that for many futures
these policies may have no effect either because the policy is not strong enough to
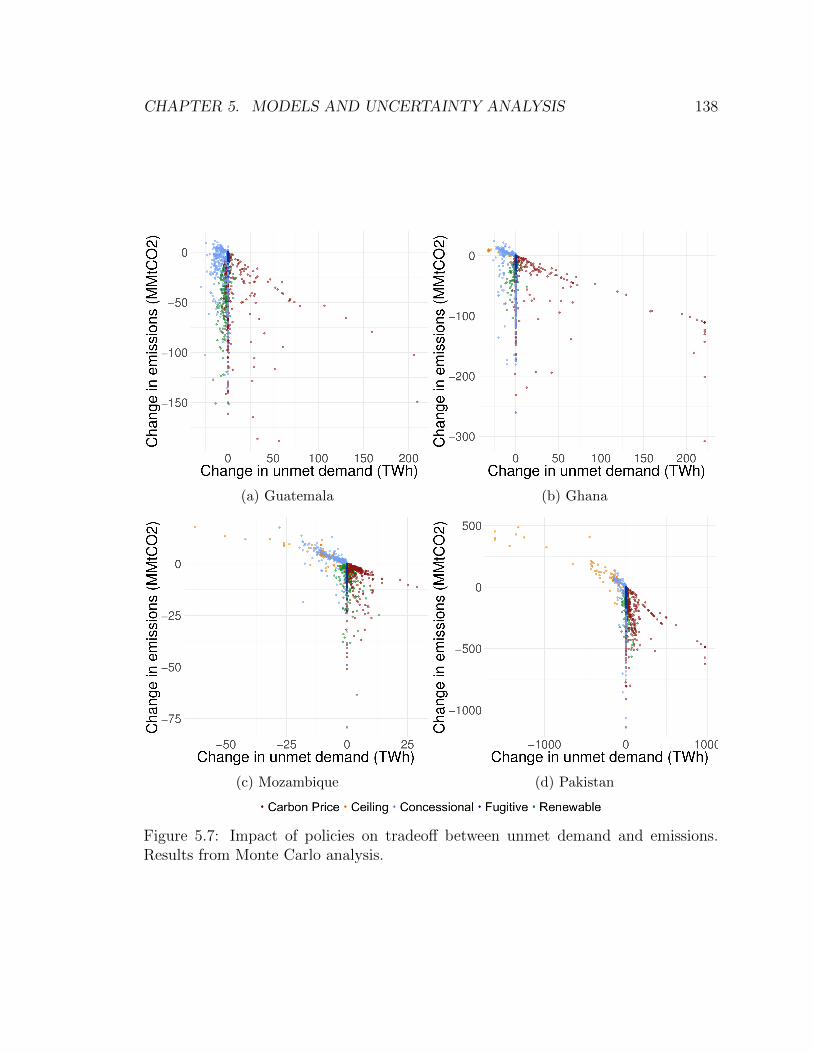
CHAPTER 5. MODELS AND UNCERTAINTY ANALYSIS 138
(a) Guatemala (b) Ghana
(c) Mozambique (d) Pakistan
Figure 5.7: Impact of policies on tradeoff between unmet demand and emissions.Results from Monte Carlo analysis.
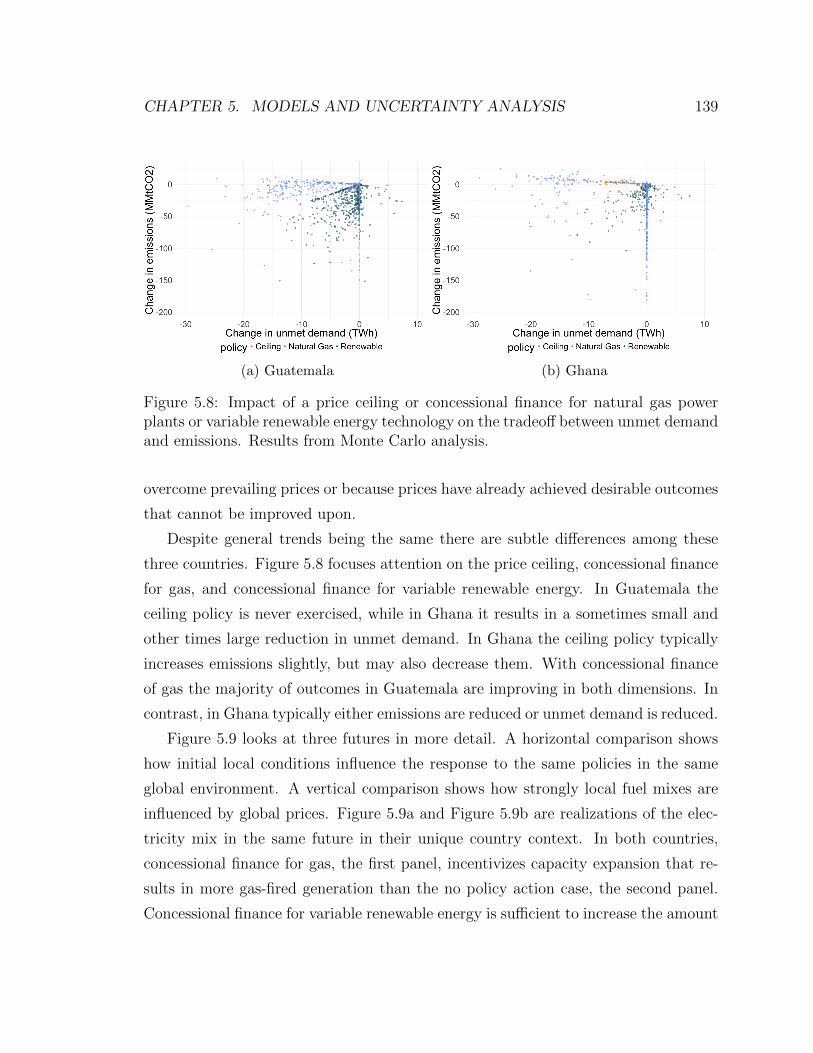
CHAPTER 5. MODELS AND UNCERTAINTY ANALYSIS 139
(a) Guatemala (b) Ghana
Figure 5.8: Impact of a price ceiling or concessional finance for natural gas powerplants or variable renewable energy technology on the tradeoff between unmet demandand emissions. Results from Monte Carlo analysis.
overcome prevailing prices or because prices have already achieved desirable outcomes
that cannot be improved upon.
Despite general trends being the same there are subtle differences among these
three countries. Figure 5.8 focuses attention on the price ceiling, concessional finance
for gas, and concessional finance for variable renewable energy. In Guatemala the
ceiling policy is never exercised, while in Ghana it results in a sometimes small and
other times large reduction in unmet demand. In Ghana the ceiling policy typically
increases emissions slightly, but may also decrease them. With concessional finance
of gas the majority of outcomes in Guatemala are improving in both dimensions. In
contrast, in Ghana typically either emissions are reduced or unmet demand is reduced.
Figure 5.9 looks at three futures in more detail. A horizontal comparison shows
how initial local conditions influence the response to the same policies in the same
global environment. A vertical comparison shows how strongly local fuel mixes are
influenced by global prices. Figure 5.9a and Figure 5.9b are realizations of the elec-
tricity mix in the same future in their unique country context. In both countries,
concessional finance for gas, the first panel, incentivizes capacity expansion that re-
sults in more gas-fired generation than the no policy action case, the second panel.
Concessional finance for variable renewable energy is sufficient to increase the amount
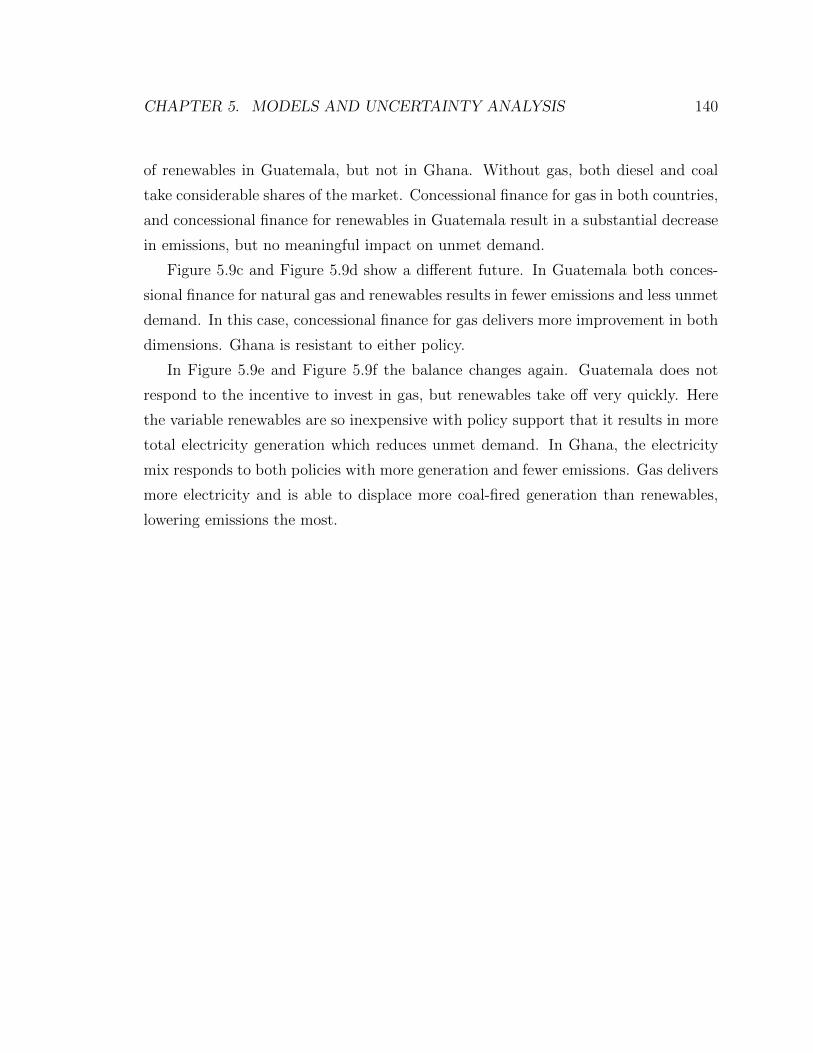
CHAPTER 5. MODELS AND UNCERTAINTY ANALYSIS 140
of renewables in Guatemala, but not in Ghana. Without gas, both diesel and coal
take considerable shares of the market. Concessional finance for gas in both countries,
and concessional finance for renewables in Guatemala result in a substantial decrease
in emissions, but no meaningful impact on unmet demand.
Figure 5.9c and Figure 5.9d show a different future. In Guatemala both conces-
sional finance for natural gas and renewables results in fewer emissions and less unmet
demand. In this case, concessional finance for gas delivers more improvement in both
dimensions. Ghana is resistant to either policy.
In Figure 5.9e and Figure 5.9f the balance changes again. Guatemala does not
respond to the incentive to invest in gas, but renewables take off very quickly. Here
the variable renewables are so inexpensive with policy support that it results in more
total electricity generation which reduces unmet demand. In Ghana, the electricity
mix responds to both policies with more generation and fewer emissions. Gas delivers
more electricity and is able to displace more coal-fired generation than renewables,
lowering emissions the most.
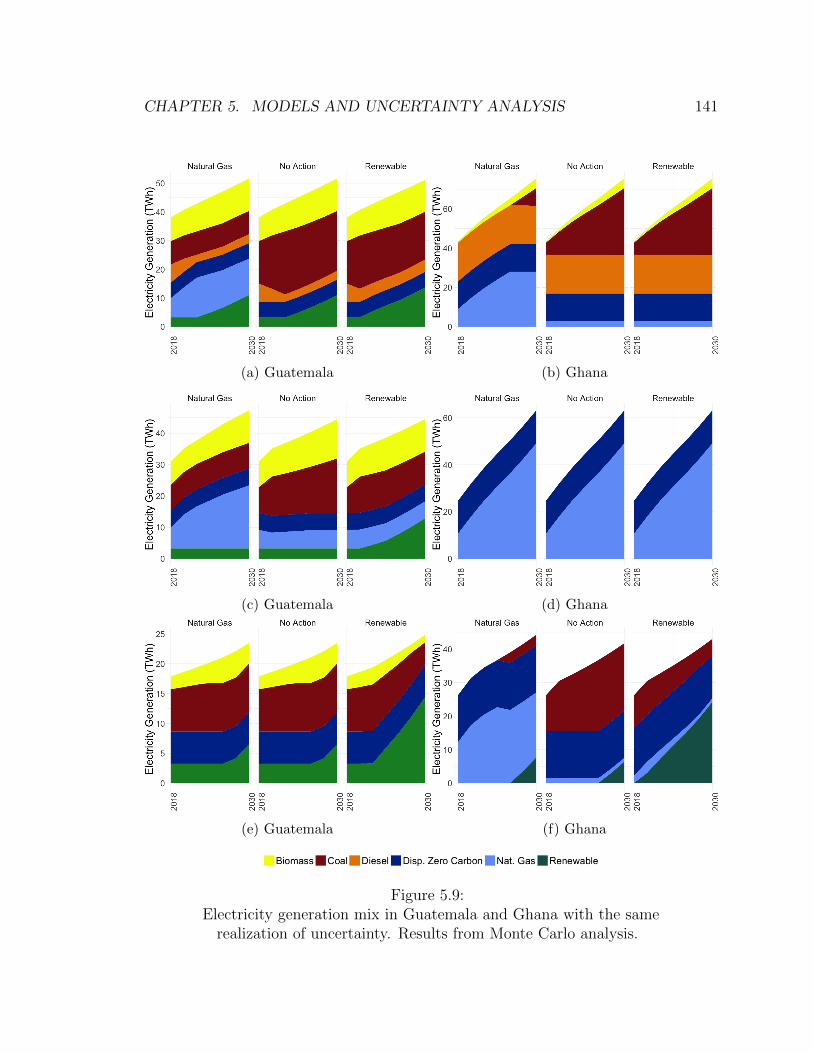
CHAPTER 5. MODELS AND UNCERTAINTY ANALYSIS 141
(a) Guatemala (b) Ghana
(c) Guatemala (d) Ghana
(e) Guatemala (f) Ghana
Figure 5.9:Electricity generation mix in Guatemala and Ghana with the same
realization of uncertainty. Results from Monte Carlo analysis.
CHAPTER 5. MODELS AND UNCERTAINTY ANALYSIS 142
In contrast to Ghana, Guatemala, and Pakistan, in Mozambique concessional
finance for gas predominately raises emissions. Mozambique is the only gas exporter
of the countries presented. Mozambique currently exports small amounts of gas by
pipeline to South Africa, but may in the near future may produce significant volumes
of gas for export via LNG. The apparent poor performance of concessional finance
for natural gas as an emissions reduction policy is because the baseline, no policy
action case, invests heavily in natural gas because of the presumed access to low cost
natural gas. To see this, Mozambique as an exporter is compared to Mozambique as
an importer in Figure 5.10.
Figure 5.10a and 5.10c present the same information that is in 5.7c, and next to
it are the results if Mozambique was an importer instead of an exporter. Focusing
on the effect of unmet concessional finance of gas on unmet demand, there is more
weight below the axis in 5.10b. Similarly, concessional finance for gas has a longer
negative tail in 5.10d. The correct interpretation of the role of gas in Mozambique is,
therefore, that access to cheap gas is a win-win for climate and development. In this
and similar cases, the U.S. should prioritize realizing their domestic resources and
ensuring adequate production is available for domestic consumption.
This model result is replicated in the other gas exporting countries analyzed:
Nigeria, Indonesia, Myanmar, Tanzania, and Yemen. In these countries realizing an
upstream project is not always the barrier. The insight, however, is the same. There
is value to the U.S. to intervene in the value chain, wherever there is an obstacle, to
ensure low cost gas is available and accessible for domestic use.
The comparisons so far have been done without consideration of the policy cost
or preferences for reducing emissions over increase electricity supply. Figure 5.11
shows the outcomes after preferences have been applied and the cost of implementing
each policy is included. The costs are presented net of the outcome that would
have occurred without any U.S. policy support. Therefore, any weight below the
axis is a beneficial policy, and any weight above the axis means the cost outweighed
the benefits. A policy completely below the axis is always desirable, and a policy
completely above the axis is always undesirable.

CHAPTER 5. MODELS AND UNCERTAINTY ANALYSIS 143
(a) Mozambique (b) Mozambique (importer)
(c) Mozambique (d) Mozambique (importer)
Figure 5.10: Distribution of unmet demand for electricity and emissions. Resultsfrom Monte Carlo analysis.
CHAPTER 5. MODELS AND UNCERTAINTY ANALYSIS 144
There is a general trend among the four countries presented here and the full
list of sixteen countries. Technical assistance for a carbon policy has a long positive
tail because of the increase in unmet demand and a long negative tail because of
the significant decreases in emissions. The more populous a country, the more net
benefits arise from promoting a carbon price.
A price ceiling commonly has either no effect, as in Guatemala, or a long positive
tail because of the high cost of supplying fuel when the international price exceeds
the ceiling. Though the ceiling can substantially reduce unmet demand by allowing
a generator to operate even in a high price environment, typically the volume of gas
that needs to be purchased makes the policy cost prohibitive. A ceiling is more likely
to deliver net benefits in a small country.
Technical assistance to reduce fugitive emissions is most beneficial for populous
countries and more so for those that produce gas domestically, and therefore, have
a relatively high penetration of natural gas to begin with. A fugitive emissions pol-
icy does not typically provide net benefits for small countries whether they are gas
producers or not.
Concessional finance for natural gas fired power generation and for variable re-
newable energy technologies exhibit similar behavior: typically some weight in the
tails above and below the axis, but rarely as extreme as that for the carbon price.
The Monte Carlo analysis results plainly suggest the best policy choice based on
the highest expected net benefits. More interestingly it shows that in most countries
more than one policy has net benefits in some futures, net costs in others, and often
has no affect. What cannot be discerned from this information is whether policies
have net benefits in the same futures or in different ones.
Parsing the data shows how many times a policy provides net benefits uniquely,
and with significant time it begins to become clear which input variables are associated
with net benefits for particular policies. The next two methods of uncertainty analysis
facilitate this process.
Table 5.7 summarizes the policies with net benefits, those whose mean is less than
or equal to zero. The cost of carbon and the cost of unmet demand assumed control
the weighting of emissions and unmet demand in the comparison of total cost. When
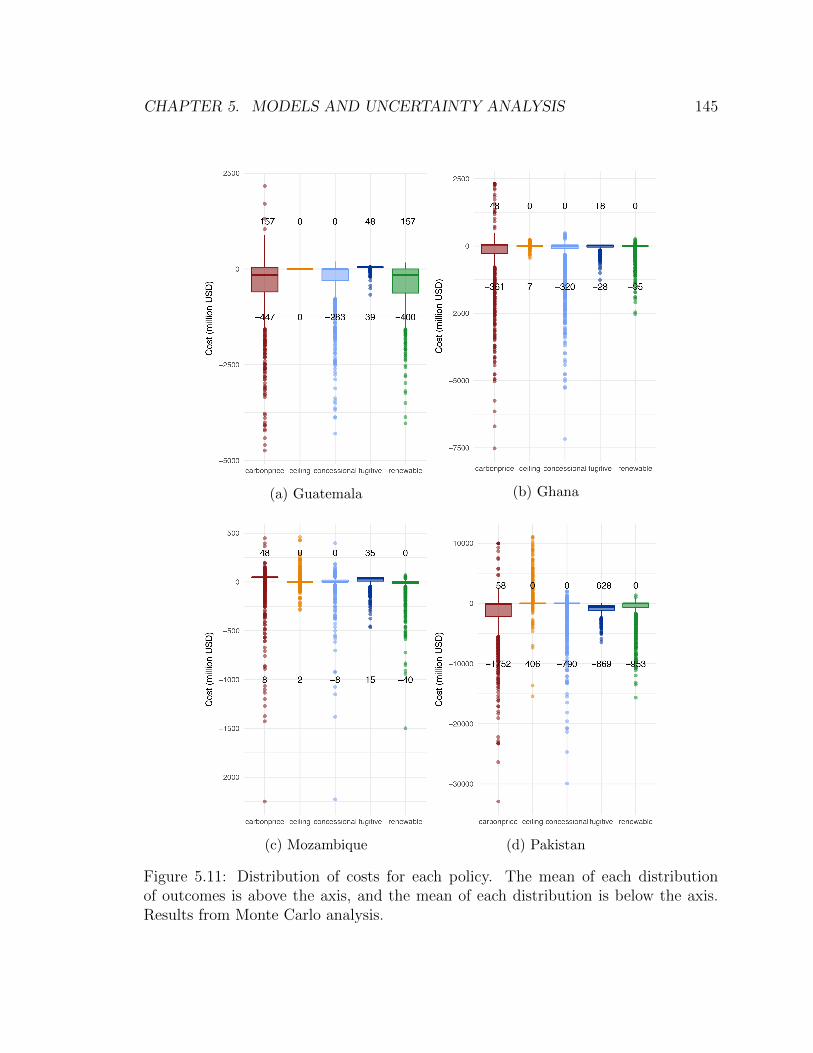
CHAPTER 5. MODELS AND UNCERTAINTY ANALYSIS 145
(a) Guatemala (b) Ghana
(c) Mozambique (d) Pakistan
Figure 5.11: Distribution of costs for each policy. The mean of each distributionof outcomes is above the axis, and the mean of each distribution is below the axis.Results from Monte Carlo analysis.
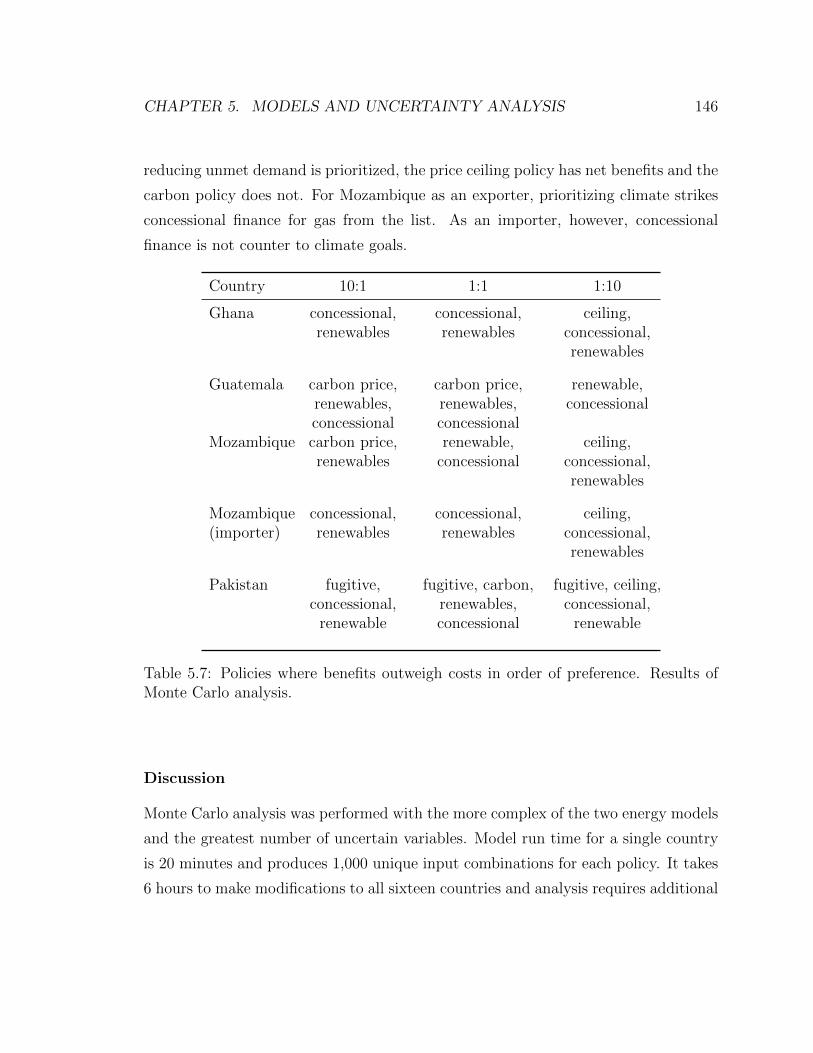
CHAPTER 5. MODELS AND UNCERTAINTY ANALYSIS 146
reducing unmet demand is prioritized, the price ceiling policy has net benefits and the
carbon policy does not. For Mozambique as an exporter, prioritizing climate strikes
concessional finance for gas from the list. As an importer, however, concessional
finance is not counter to climate goals.
Country 10:1 1:1 1:10
Ghana concessional,renewables
concessional,renewables
ceiling,concessional,renewables
Guatemala carbon price,renewables,concessional
carbon price,renewables,concessional
renewable,concessional
Mozambique carbon price,renewables
renewable,concessional
ceiling,concessional,renewables
Mozambique(importer)
concessional,renewables
concessional,renewables
ceiling,concessional,renewables
Pakistan fugitive,concessional,
renewable
fugitive, carbon,renewables,concessional
fugitive, ceiling,concessional,
renewable
Table 5.7: Policies where benefits outweigh costs in order of preference. Results ofMonte Carlo analysis.
Discussion
Monte Carlo analysis was performed with the more complex of the two energy models
and the greatest number of uncertain variables. Model run time for a single country
is 20 minutes and produces 1,000 unique input combinations for each policy. It takes
6 hours to make modifications to all sixteen countries and analysis requires additional
CHAPTER 5. MODELS AND UNCERTAINTY ANALYSIS 147
time.7 Eliciting probability distributions for each of the uncertain variables is very
time consuming. If each interagency decision maker provides input on each uncertain
variable, rather than distributing the task according to expertise, this author believes
it would take a week of the modeling team’s time, an hour on each policy maker’s
schedule, and another hour or more in a group convening to come to consensus.
Considering the short policy making cycle, this approach to uncertainty analysis
would rarely be viable.
While the long model run time limits the number of times the model can be
modified and re-run, Monte Carlo analysis facilitates policy search because of the
built in iterations over input space. When the results are calculated there is both a
clear sense of the best policy, the one that maximizes expected net benefits, and the
risk associated with it and there are hundreds of scenarios to compare.
In addition to providing rich results for the analyst, the output of a Monte Carlo
analysis is intuitive to interpret correctly because the probabilistic information is
embedded. By just looking at the scatter plot, it is easy to detect trends in the effects
of each policy on unmet demand and emissions. Anomalies are easy to identify and
can be more thoroughly investigated. For example, examining the installed capacity
of several scenarios revealed why lower capital costs for variable renewable energy
caused concessional finance for variable renewable energy to have no net benefits.
The optimization model has perfect forecast and the algorithm is looking to minimize
costs over the entire time horizon. If the model knows that renewables will be very
cheap at the end of the time horizon, it will delay investment in renewables and
focus on building dispatchable power. In the final time period most or all of the new
capacity will be with renewables. Since the renewables are being built based on price
alone, concessional finance does not incentivize additional capacity and, therefore,
adds cost but does not provide additional benefit.
The box plot shows both which policies have net benefits and when a policy
dominates. When there is no dominant policy, as in this analysis, it is helpful to see
the distribution of net benefits. What is still difficult to see is whether policies are
7Monte Carlo analysis using the simulation model, NESS, yields qualitatively similar results anda faster run time.

CHAPTER 5. MODELS AND UNCERTAINTY ANALYSIS 148
failing and succeeding at the same time or at complementary times. The analyst can
carefully parse the data to find how frequently one policy succeeds and the others
fail, but it is still difficult to assess which uncertain inputs or combinations of inputs
is responsible for the behavior.
Another advantage of Monte Carlo analysis, because of its probabilistic nature,
is it is easy to incorporate new information with Bayesian updating and see the
shift in the distributions of results. Unlike scenario analysis, new information can
meaningfully change a decision.
The results of the Monte Carlo analysis correctly convey the policy and that one
policy will not always be beneficial. It requires additional, time-consuming analysis
by the analyst to more specifically identify the input set that drives net benefits of a
particular policy.
5.3.3 Decision analysis
Decision analysis is a probabilistic method of uncertainty analysis that combines ap-
plied decision theory with system analysis. It requires discrete probability distribu-
tions for all uncertain variables, and joint probability distributions in the event that
uncertainties are not independent. Decision analysis is appropriate for investigating
decisions under uncertainty when alternatives can be enumerated finitely without be-
coming cumbersome and when there is a single decision maker who holds a belief
about the probability of events given relevant information from previous decisions
and uncertainties (Howard 1988).
The decision analysis algorithm works backwards from the value of prospects,
through a decision tree which enumerates the marginal probability of each degree of
an uncertain variable. The model is solved deterministically for each combination of
uncertain variables and then the likelihood of that prospect is aggregated to identify
the decision with the highest expected net benefits. The outcome of the model with
the assumptions is calculated for every combination of parameters and the value of
the outcome is recursively rolled back to identify the strategy that best suits the
decision makers’goals.

CHAPTER 5. MODELS AND UNCERTAINTY ANALYSIS 149
The principal drawback of all dynamic Bayesian networks, including decision anal-
ysis, is the curse of dimensionality. The number of computations exponentially in-
creases as the model becomes more detailed forcing one to limit the number of vari-
ables and the degrees of those variables included. For this reason, analysis is typically
done with a very small number of uncertainties. Analysts must choose a subset of
uncertainties to incorporate in their models using methods that identify the variables
responsible for the greatest variance (Howard & Abbas, 2015). Those uncertainties
that contribute little are “pruned” from the tree. In energy modeling, this limitation
feels very constricting.
In the analysis done here, this approach would have eliminated all of the global
energy market uncertainties. While local uncertainties, such as demand and the
capacity expansion rate are extremely influential, it was necessary to explore the
interaction between global and local uncertainties. To accommodate this, a new tool
was developed for this research to rapidly adapt the decision tree. The number of
uncertainties considered can be scaled from zero to twelve, each of which can repeated
in time for each of the twelve time steps. Additionally, any time step can become
a decision period, easily facilitating a switch between single period and sequential
period decision making. While the overall size of the tree must be limited, there
is no limit to the combinations of trees that can be explored. These modifications
significantly improve the agility of this uncertainty analysis method.
Representation of uncertainty
Table 5.8 summarizes nine uncertain variables used in the decision analysis. They
are a discretization by method of moments of the continuous probability distributions
used in the Monte Carlo analysis. These variables were used in a decision tree as
depicted in Figure 5.12.
Results and policy insights
Table 5.9 summarizes the policies with net benefits for each set of preferences, with the
policy that maximizes net benefits listed first. Despite using a simplified model and a

CHAPTER 5. MODELS AND UNCERTAINTY ANALYSIS 150
Value Probability
Uncertain variable Low Base High Low Base High
Global coal price 90 130 - 0.196 0.804 -Regasification cost 0.35 0.6 - 0.239 0.761 -Fugitive emission rate 0.01 0.03 0.06 0.185 0.565 0.196Capacity addition rate 80 100 130 0.185 0.565 0.196Rural demand per capita 0.1 0.3 1 0.185 0.565 0.196Urban demand per capita 0.5 1.3 3 0.185 0.565 0.196Rural electrification rate 90 100 110 0.185 0.63 0.185Oil indexation No Yes - 0.6 0.4 -Variable renewable capital cost 92 96 - 0.1 0.9 -
Table 5.8: Distribution of uncertain variables used in decision analysis
different approach to uncertainty analysis, the results are qualitatively similar to those
from the Monte Carlo analysis. A carbon price performs well except in the smallest
country, Mozambique. A fugitive emissions policy performs well in Pakistan, which
is both populous and a domestic gas producer that has historically used gas in its
electricity mix. Elevating the importance of emissions causes concessional finance for
renewables to have net benefits in Pakistan, though still not the alternative with the
greatest net benefits. Prioritizing a reduction in unmet demand for electricity causes
concessional finance for natural gas to have net benefits in Ghana and Pakistan.
Country 10:1 1:1 1:10
Ghana carbon pricerenewables
carbon pricerenewables
concessional
Guatemala carbon pricerenewables
ceiling
carbon pricerenewables
ceiling renewables
Mozambique no action no action no action
Pakistan fugitive carbonprice renewables
fugitive carbonprice
fugitiveconcessional
Table 5.9: Policies where benefits outweigh costs for each ratio of value preferences.Results of decisions analysis.

CHAPTER 5. MODELS AND UNCERTAINTY ANALYSIS 151
2018 2024
Policies Priceof coal
2030Capacityadditionrate
Urbandemand
Ruraldemand
Ruralelectrification
rate
Fugitivemethaneemissionrate
Oilindexation
Regasificationcost
Variablerenewablecapacitycost
Priceceiling
Concessionalgas
Fugitiveemissionsreduced
High
Base
Low
High
Base
Low
High
Base
Low
Yes
No
High
Low
Base
Low
Base
Low
Tier 5
Tier 3
Tier 1
Tier 5
Tier 3
Tier 1
Carbonprice
Concessionalrenewables
Figure 5.12: The decision tree analyzed is the product of several iterations of pruningexercises to find the smallest tree that resulted in the most varied results.
Decision analysis allows the calculation of the value of information, or the maxi-
mum amount of money one should be willing to spend to reduce a particular uncer-
tainty. Based on intuition it is not obvious which uncertainty might cause net benefits
for one policy over another. Calculating the value of information for each uncertain
variable can identify the information that is of most value to collect. Table 5.10 sum-
marizes the value of information. In Pakistan, as an example, it would be worth USD
4.2 million to know how quickly Pakistan would continue to build power generation
capacity in the future. If it was possible to refine this judgment it could influence
the best policy to support. In contrast, in Ghana, Guatemala, and Mozambique even
knowing exactly what the capacity addition rate would be would not change the best
policy decision, so it is not worth any effort to try to refine the estimate.
While the analysis so far gives very clear guidance about the best policy it does not
provide much insight into what is driving the answer. There are two ways to better
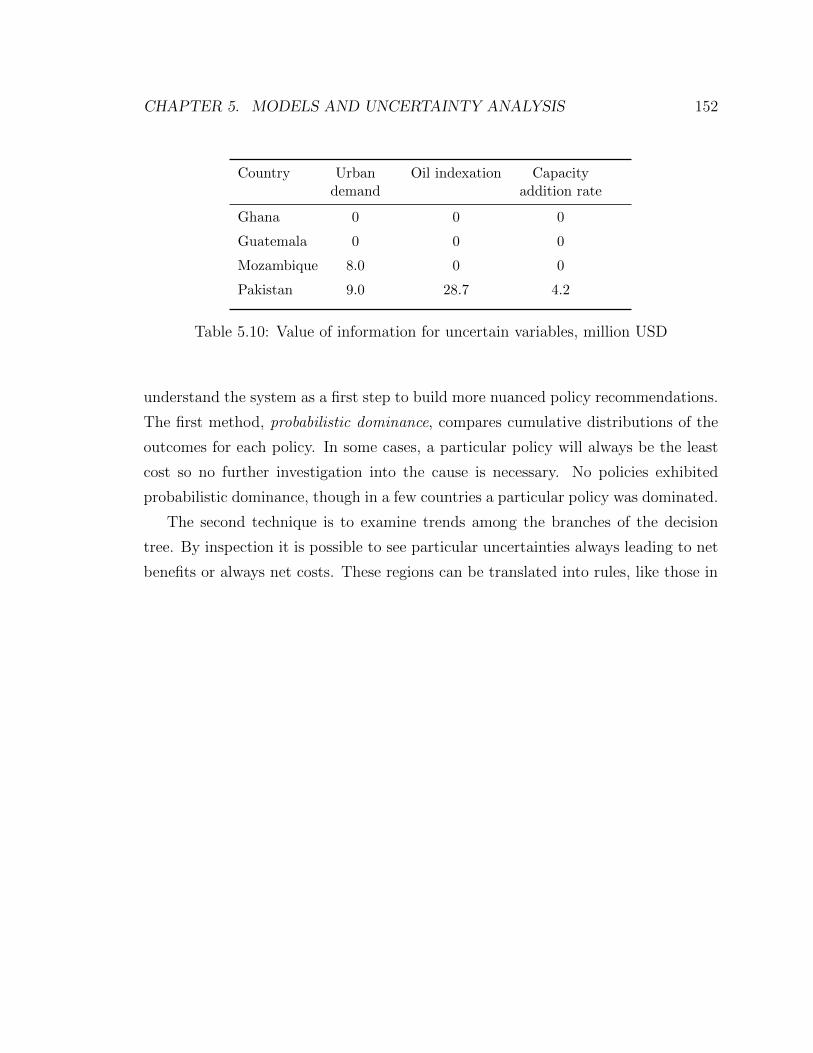
CHAPTER 5. MODELS AND UNCERTAINTY ANALYSIS 152
Country Urbandemand
Oil indexation Capacityaddition rate
Ghana 0 0 0
Guatemala 0 0 0
Mozambique 8.0 0 0
Pakistan 9.0 28.7 4.2
Table 5.10: Value of information for uncertain variables, million USD
understand the system as a first step to build more nuanced policy recommendations.
The first method, probabilistic dominance, compares cumulative distributions of the
outcomes for each policy. In some cases, a particular policy will always be the least
cost so no further investigation into the cause is necessary. No policies exhibited
probabilistic dominance, though in a few countries a particular policy was dominated.
The second technique is to examine trends among the branches of the decision
tree. By inspection it is possible to see particular uncertainties always leading to net
benefits or always net costs. These regions can be translated into rules, like those in

CHAPTER 5. MODELS AND UNCERTAINTY ANALYSIS 153
Policy Rule
Gh
an
a ceiling no policies with net benefits
concessional no policies with net benefits
renewable Urban demand must be at low/base. If the capacity addition rate is at alow/base and urban demand is at base, then rural demand must be at low.Among policies with net benefits, benefits improve if the cost of coal is low,the cost of variable renewable capacity is base, regasification cost is high,and gas is priced by oil indexation.
Gu
atem
ala ceiling Urban demand must be at low/base with oil indexation. If the capacity
addition rate is at base/high, then coal must be high cost. Among policieswith net benefits, lower rural electrification improves the benefits.
concessional no policies with net benefits
renewable If urban demand is high, the capacity addition rate must be high. If thereis oil indexation and variable renewable capital costs are low, rural demandmust be base/low with high urban demand and a high capacity additionrate. Among policies with net benefits, a low coal price and a high gasifi-cation price are better. Higher rates of fugitive methane emissions increasethe benefit.
Moz
amb
iqu
e ceiling no policies with net benefits
concessional Urban demand for electricity must be at base with no oil indexation. Ruralelectrification must be base/high. Among policies with net benefits, a lowregasification price and a low cost of variable renewable capacity improveperformance. High fugitive methane emissions are not always a problem,but lower emissions raise benefits.
renewable Urban demand must be low/base. If urban demand is low, rural demandmust be high.
Pak
ista
n ceiling no policies with net benefits
concessional Urban demand for electricity must be base with no oil indexation. Ruralelectrification must be base/high. A low regasification price and a low costof variable renewable capacity improve benefits. High fugitive methaneemissions are not always a problem, but lower emissions raise benefits.
renewable Urban demand must be low/base. If urban demand is low, rural demand,rural electrification, and the capacity addition rate must be high. If urbandemand is base, rural demand must be low. A high coal price and a baseprice for variable renewable capacity improves benefits. If the capacity costof variable renewable technology is at base, high regasification costs arebest, and if low, then low regasification costs are best.
Table 5.11: Rules for policies with net benefits identified from decision tree.
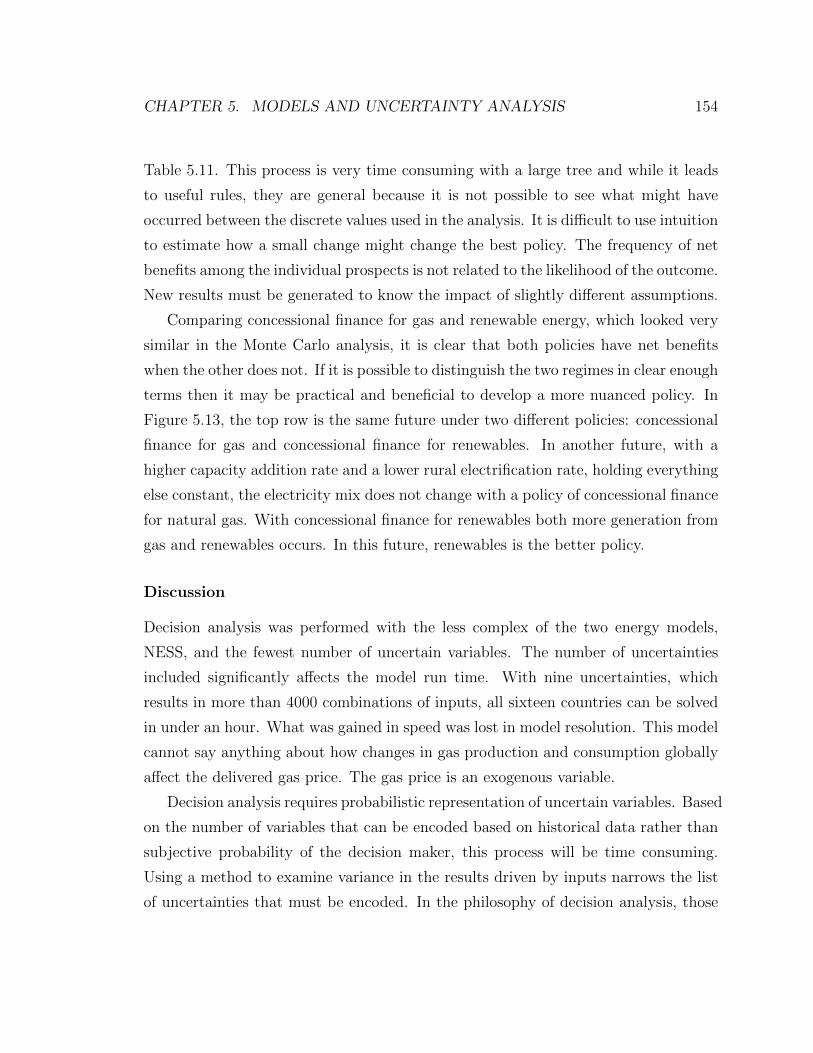
CHAPTER 5. MODELS AND UNCERTAINTY ANALYSIS 154
Table 5.11. This process is very time consuming with a large tree and while it leads
to useful rules, they are general because it is not possible to see what might have
occurred between the discrete values used in the analysis. It is difficult to use intuition
to estimate how a small change might change the best policy. The frequency of net
benefits among the individual prospects is not related to the likelihood of the outcome.
New results must be generated to know the impact of slightly different assumptions.
Comparing concessional finance for gas and renewable energy, which looked very
similar in the Monte Carlo analysis, it is clear that both policies have net benefits
when the other does not. If it is possible to distinguish the two regimes in clear enough
terms then it may be practical and beneficial to develop a more nuanced policy. In
Figure 5.13, the top row is the same future under two different policies: concessional
finance for gas and concessional finance for renewables. In another future, with a
higher capacity addition rate and a lower rural electrification rate, holding everything
else constant, the electricity mix does not change with a policy of concessional finance
for natural gas. With concessional finance for renewables both more generation from
gas and renewables occurs. In this future, renewables is the better policy.
Discussion
Decision analysis was performed with the less complex of the two energy models,
NESS, and the fewest number of uncertain variables. The number of uncertainties
included significantly affects the model run time. With nine uncertainties, which
results in more than 4000 combinations of inputs, all sixteen countries can be solved
in under an hour. What was gained in speed was lost in model resolution. This model
cannot say anything about how changes in gas production and consumption globally
affect the delivered gas price. The gas price is an exogenous variable.
Decision analysis requires probabilistic representation of uncertain variables. Based
on the number of variables that can be encoded based on historical data rather than
subjective probability of the decision maker, this process will be time consuming.
Using a method to examine variance in the results driven by inputs narrows the list
of uncertainties that must be encoded. In the philosophy of decision analysis, those
CHAPTER 5. MODELS AND UNCERTAINTY ANALYSIS 155
(a) Electricity generation withconcessional finance for gas.Maximizes net benefits.
(b) Electricity generation withconcessional finance for renewables.
(c) Electricity generation withconcessional finance for gas.
(d) Electricity generation withconcessional finance for renewables.Maximizes net benefits.
Figure 5.13: Change in electricity generation in 2030 in Pakistan from no policyaction. Results from decision analysis.
CHAPTER 5. MODELS AND UNCERTAINTY ANALYSIS 156
uncertainties that do not affect the decision are unnecessary noise. With fewer un-
certainties, the encoding process may take half as much time as needed for Monte
Carlo.
Using decision analysis for policy search is typically limited for two reasons. First,
with traditional tools, the structure of the decision tree is fairly inflexible so it takes
time to reconstruct it to consider new policy ideas. With the tool developed for
this research, this problem is largely mitigated. Changing assumptions to broaden
the search or respond to requests of decision makers can be done quickly. Second,
the input space searched is limited. Although a continuous distribution for each
uncertainty may be encoded, that distribution is discretized before it is used in the
decision analysis. This discretization often hides the tails of each distribution. So
while search is much improved over scenario analysis because of the sheer number
of input combinations calculated and aggregated in a digestible way, the coverage
of input space may not identify anomalies as Monte Carlo analysis does and will be
blind to extremes.
The results of decision analysis are easy to interpret to identify a single best policy,
but do not lend themselves to developing intuition. Decision analysis applies the
axioms of subjective expected utility theory. When uncertainty is well characterized
and the value preferences are clear, this expected utility approach yields the best
answer. However, to the extent there was not full consensus on uncertainty or value
preferences, as may often be the case, a simple evaluation of the results will not give
any insights into the dynamics of the system.
The analyst can interrogate the results more deeply and look not only at cost,
but at the emissions and unmet demand, associated with every prospect. Breaking
the tree down branch by branch will show some uncertain variables that strongly
influence the net benefits. Still it is difficult to use this information to develop a
nuanced policy based on uncertainties because the frequency of the result is not
probabilistic in decision analysis as it was in Monte Carlo. For example, a scatter
plot of the results of each prospect cannot be directly interpreted as some points are
more likely than others.

CHAPTER 5. MODELS AND UNCERTAINTY ANALYSIS 157
One advantage of the decision analysis method is not only the ability to use
Bayesian updating to incorporate new information, but the ability to calculate the
value of obtaining any new information. U.S. foreign policy agencies have a particular
strength to collect specific pieces of information when it is clear what information is
needed.
Decision analysis also facilitates decisions with learning by allowing multi-stage
resolution of uncertainty. In sequential decision analysis, the decision maker has re-
course to make different decisions in the future time periods. These may be a different
selection among the same alternatives or a completely different set of alternatives to
consider. Learning allows the development of hedging strategies like delaying actions
until more information is available. With the tool developed for this research, the
number of stages to consider can be altered instantly. Results of a sequential decision
analysis are not presented here because for this particular policy problem a few early
uncertainty revelations overwhelmed future resolutions of uncertainty. This would
not be the case for all policy problems.
5.3.4 Exploratory modeling and analysis
Exploratory modeling and analysis is a sampling technique developed for policy anal-
ysis when there is deep uncertainty (Bankes, 1993; Lempert et al., 2003; Agusdinata,
2008; Kwakkel & Pruyt, 2013). Level 5 uncertainty, also known as deep uncertainty,
arises when there is no basis for describing uncertainty probabilistically either because
of insufficient or conflicting information (Lempert et al., 2003; Walker et al., 2003).
The analytical approach combines sampling techniques according to experimental
design to perform computational “experiments” with a deterministic model.
Each model outcome is associated with the combination of input values that pro-
duced it and the results are investigated with a variety of data analysis techniques.
The data analytic tools employed identify trends in the input set that are associated
with similar outcomes. These trends can characterize the robustness of a policy across
uncertainty space and can isolate regions of uncertainty space that separate policies
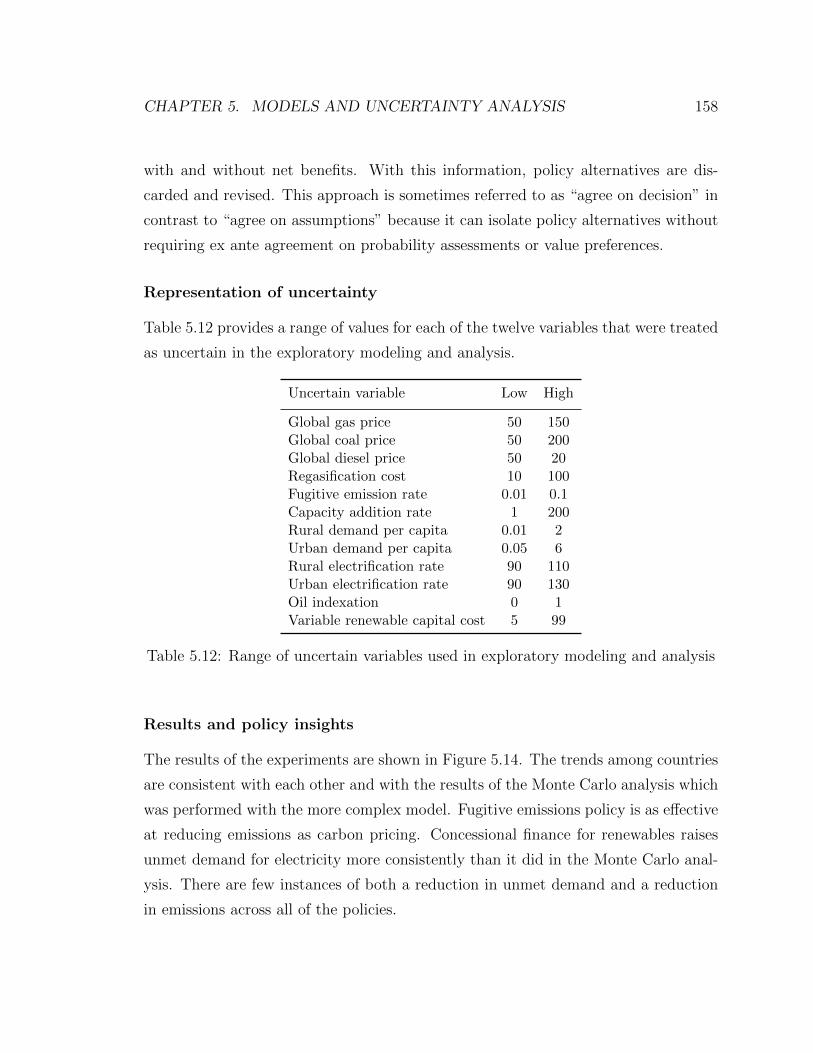
CHAPTER 5. MODELS AND UNCERTAINTY ANALYSIS 158
with and without net benefits. With this information, policy alternatives are dis-
carded and revised. This approach is sometimes referred to as “agree on decision” in
contrast to “agree on assumptions” because it can isolate policy alternatives without
requiring ex ante agreement on probability assessments or value preferences.
Representation of uncertainty
Table 5.12 provides a range of values for each of the twelve variables that were treated
as uncertain in the exploratory modeling and analysis.
Uncertain variable Low High
Global gas price 50 150Global coal price 50 200Global diesel price 50 20Regasification cost 10 100Fugitive emission rate 0.01 0.1Capacity addition rate 1 200Rural demand per capita 0.01 2Urban demand per capita 0.05 6Rural electrification rate 90 110Urban electrification rate 90 130Oil indexation 0 1Variable renewable capital cost 5 99
Table 5.12: Range of uncertain variables used in exploratory modeling and analysis
Results and policy insights
The results of the experiments are shown in Figure 5.14. The trends among countries
are consistent with each other and with the results of the Monte Carlo analysis which
was performed with the more complex model. Fugitive emissions policy is as effective
at reducing emissions as carbon pricing. Concessional finance for renewables raises
unmet demand for electricity more consistently than it did in the Monte Carlo anal-
ysis. There are few instances of both a reduction in unmet demand and a reduction
in emissions across all of the policies.
CHAPTER 5. MODELS AND UNCERTAINTY ANALYSIS 159
Interpreting the graphs beyond this is likely to mislead. Since the inputs did
not contain any probabilistic information, the frequency of each outcome does not
correspond to its likelihood. Some points may result under conditions that are highly
unlikely, and points that are highly likely may be under represented. Using a range
of input values and a factorial sampling method causes the extreme values to be over
sampled.
Table 5.15 summarizes the number of policies with net benefits, those whose ben-
efits in terms of reductions in unmet demand and emissions outweigh the costs of
policy action. The table shows the number of futures in which a policy has net ben-
efits in 1000 experiments for each of the three value preference ratios. As in other
approaches, prioritizing emissions results in concessional finance for renewables pro-
viding net benefits, and prioritizing electricity generation increases the net benefits
of a price ceiling or concessional finance for gas and decreases the net benefits of a
carbon policy.
Like in Figure 5.14, frequency is not a proxy for the best policy. For example,
in Guatemala the price ceiling has net benefits a modest number of times across
all of the value preference ratios. Based on frequency one might expect this policy
to be unviable. In decision analysis, however, with a probabilistic representation
of uncertainty, the ceiling policy is has net benefits in two out of the three value
preferences. The low frequency is not a predictor of net benefits in a probabilistic
world and the consistency of the net benefits in experiments across value preferences
did not suggest that the 1:1 ratio would be the one unsuccessful case.
Because of the disconnect between frequency and probability, Exploratory model-
ing and analysis cannot be used to clarify the best policy, however, it is very helpful
to identify rules that distinguish a future in which a policy will have net benefits and
one in which it will not. Using a classification tree, suggests that when the coal price
is above 125 percent of the base value that a price ceiling will have net benefits. In the
decision analysis, the likelihood of this occurring was 80 percent, which explains the
apparent discrepancy between the two methods and highlights the error of associating
the frequency of a experiments with net benefits with likelihood in the system.

CHAPTER 5. MODELS AND UNCERTAINTY ANALYSIS 160
(a) Guatemala (b) Ghana
(c) Mozambique (d) Pakistan
Figure 5.14: Impact of policies on tradeoff between unmet demand and emissions.Results from exploratory modeling and analysis.

CHAPTER 5. MODELS AND UNCERTAINTY ANALYSIS 161
Figure 5.15: Count of policies with benefits greater than costs out of 1000. Resultsof exploratory analysis.
Using the patient rule-induction method, the different circumstances under which
concessional finance for renewables or concessional finance for natural gas has net
benefits can be identified. Using the PRIM algorithm on the results of the renewable
experiments, a rule can be chosen that maximizes coverage, the ratio of successes that
follow the rule to the total number of successes, and density, the ratio of successes
that follow the rule to the total number of outcomes captured by the rule. In this
case, low urban demand and rural demand are significant predictors of successful
renewable support, as shown in Figure 5.16.
The uncertainties that drive net benefits for concessional finance for renewables
are not the same as those that drive net benefits of concessional finance for gas, as
shown in Figure 5.17. These results are extremely helpful for building intuition in the
policymaking process. Oil indexation is identified as the most powerful lever. The
fugitive emission rate does not eliminate the benefit of natural gas except at very high
rates. And increases in the price of gas are tolerable except at the highest and lowest
levels. High gas prices work against lower costs of capital for natural gas fired power
plants; low gas prices make the expense of U.S. financing greater than the benefit
because investment in gas fired power would have been made anyway.
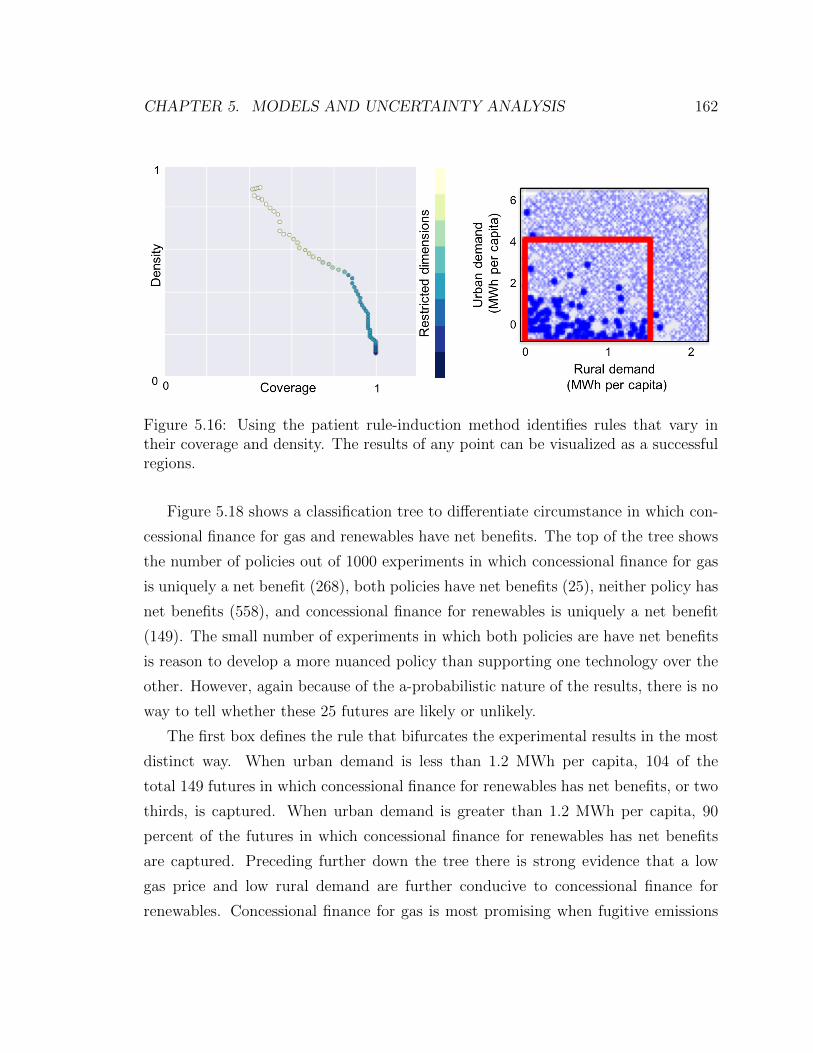
CHAPTER 5. MODELS AND UNCERTAINTY ANALYSIS 162
Figure 5.16: Using the patient rule-induction method identifies rules that vary intheir coverage and density. The results of any point can be visualized as a successfulregions.
Figure 5.18 shows a classification tree to differentiate circumstance in which con-
cessional finance for gas and renewables have net benefits. The top of the tree shows
the number of policies out of 1000 experiments in which concessional finance for gas
is uniquely a net benefit (268), both policies have net benefits (25), neither policy has
net benefits (558), and concessional finance for renewables is uniquely a net benefit
(149). The small number of experiments in which both policies are have net benefits
is reason to develop a more nuanced policy than supporting one technology over the
other. However, again because of the a-probabilistic nature of the results, there is no
way to tell whether these 25 futures are likely or unlikely.
The first box defines the rule that bifurcates the experimental results in the most
distinct way. When urban demand is less than 1.2 MWh per capita, 104 of the
total 149 futures in which concessional finance for renewables has net benefits, or two
thirds, is captured. When urban demand is greater than 1.2 MWh per capita, 90
percent of the futures in which concessional finance for renewables has net benefits
are captured. Preceding further down the tree there is strong evidence that a low
gas price and low rural demand are further conducive to concessional finance for
renewables. Concessional finance for gas is most promising when fugitive emissions
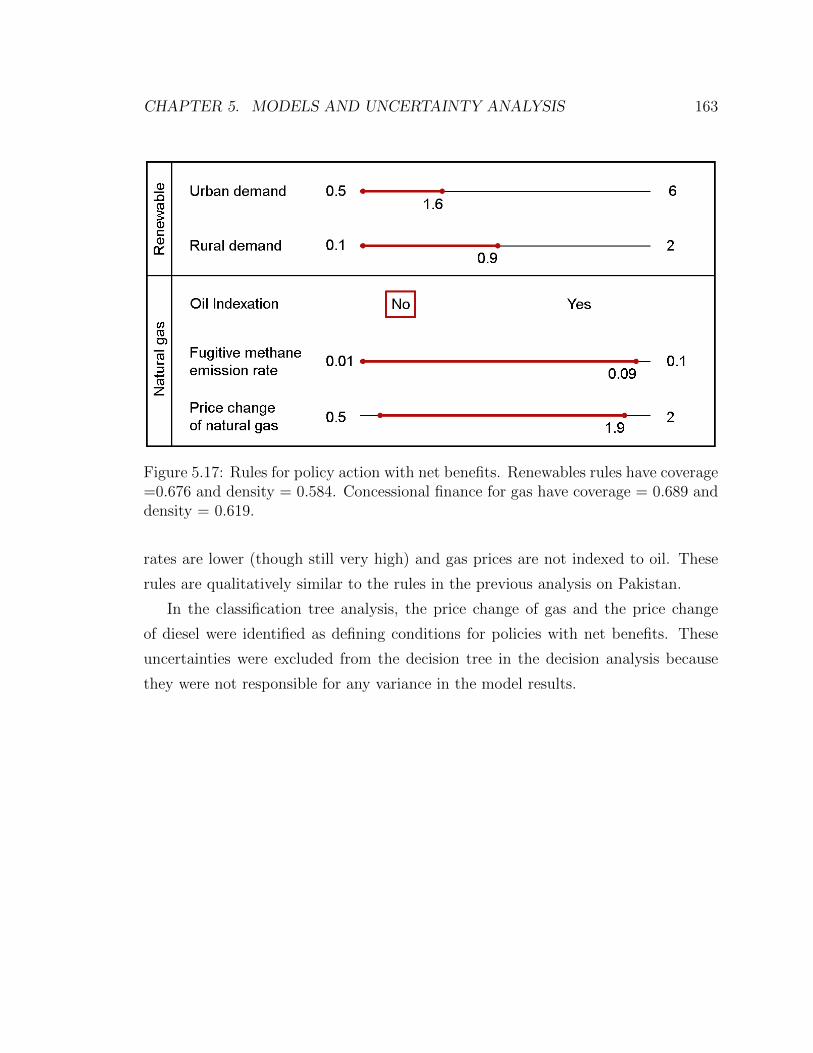
CHAPTER 5. MODELS AND UNCERTAINTY ANALYSIS 163
Figure 5.17: Rules for policy action with net benefits. Renewables rules have coverage=0.676 and density = 0.584. Concessional finance for gas have coverage = 0.689 anddensity = 0.619.
rates are lower (though still very high) and gas prices are not indexed to oil. These
rules are qualitatively similar to the rules in the previous analysis on Pakistan.
In the classification tree analysis, the price change of gas and the price change
of diesel were identified as defining conditions for policies with net benefits. These
uncertainties were excluded from the decision tree in the decision analysis because
they were not responsible for any variance in the model results.
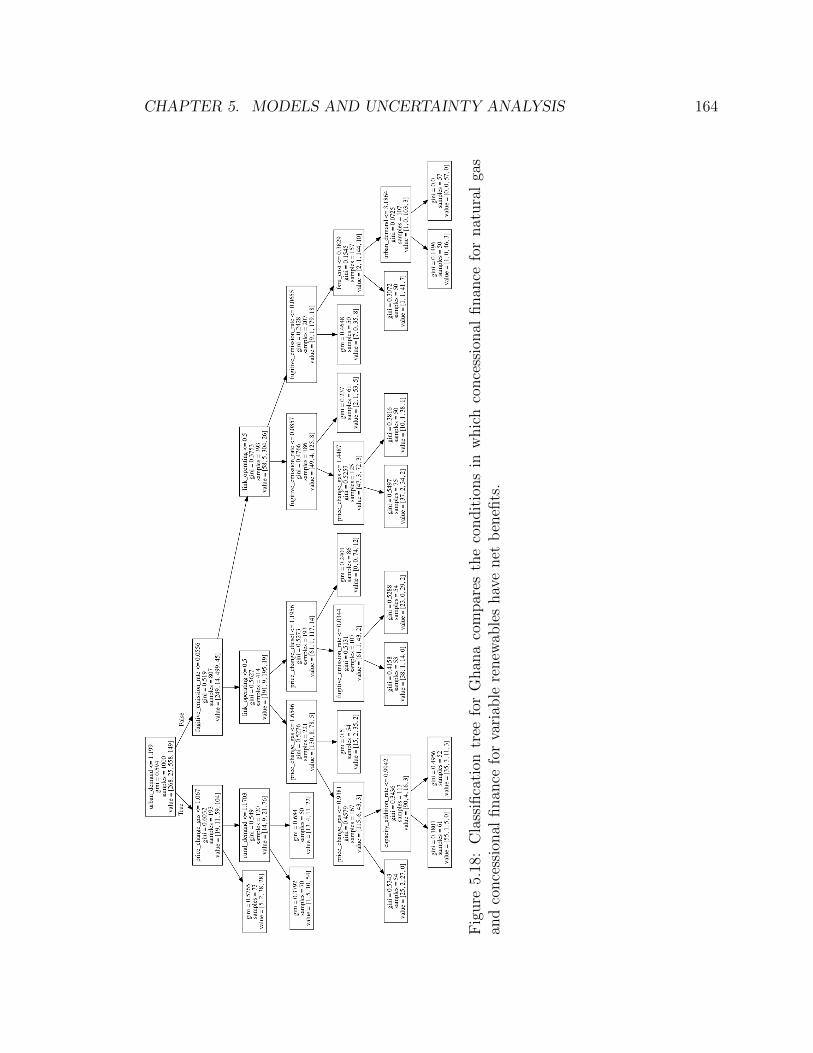
CHAPTER 5. MODELS AND UNCERTAINTY ANALYSIS 164
Fig
ure
5.18
:C
lass
ifica
tion
tree
for
Ghan
aco
mpar
esth
eco
ndit
ions
inw
hic
hco
nce
ssio
nal
finan
cefo
rnat
ura
lga
san
dco
nce
ssio
nal
finan
cefo
rva
riab
lere
new
able
shav
enet
ben
efits
.
CHAPTER 5. MODELS AND UNCERTAINTY ANALYSIS 165
Exploratory modeling and analysis can be helpful for identifying artifacts of mod-
eling choices in the decision analysis in other ways as well. Table 5.13 summarizes the
results of a classification tree analysis of all five policies in Mozambique. With the
exception of a price ceiling, each policy has a reasonable number of futures with net
benefits. While frequency is misleading, the results starkly contrast with the results
of decision analysis in which no policy action was the best alternative regardless of
value preferences. Comparing the rules in the Table 5.13 to the discretization used in
Table 5.8 explains the discrepancy. In the decision analysis, the price of gas does not
increase above the base and rural demand for electricity never exceeds 110 percent of
the base, so the circumstances for net benefits through technical assistance to develop
a carbon pricing system are never met. The ceiling policy is never has net benefits
because in decision analysis the price of coal never exceeds 140 percent of its base
level and the cost of regasification never rises above 1 USD per mmbtu. Concessional
finance for gas is does not provide net benefits because the gas price never rises above
120 percent of the base, and the fugitive emission policy does not provide net benefits
because the fugitive methane emission rate does not exceed 6 percent. This means
that the no policy action recommendation in the decision analysis is an artifact of
discretization and tree pruning, and not of belief about what could be in the future.
Discussion
Exploratory modeling and analysis was performed with the less complex of the two
energy models, NESS. More uncertain variables were incorporated than in the decision
analysis as the number of uncertainties does not significantly affect model run time.
Like scenario analysis and decision analysis, all sixteen countries can be calculated in
20 minutes. Also like scenario analysis this approach does not require specification of
probability distributions for the uncertain variables. As uncertainties are represented
by a lower and upper bound rather than a point estimate, consensus on the input
variables is not necessary. This is a major advantage for the approach, but also the
cause of the methods’ shortcomings.
Search of the input space and the number of policies that can be considered is
broad and fast. Inputs are sampled from the entire range of possible values for each
CHAPTER 5. MODELS AND UNCERTAINTY ANALYSIS 166
uncertainty. Combinations of extreme inputs are assessed. Considering different
policies or simultaneous policies is easy to do without a significant penalty in run
time facilitating search by the analyst and responsiveness to any requests from the
policymakers.
A serious deficiency of exploratory modeling and analysis, is it generates outputs
with a false sense of likelihood. The frequency of an outcome in this experiment does
not correspond to the likelihood of observing that future. An outcome that occurs
frequently may be very unlikely, and an outcome that occurs infrequently could be
very likely. It is, therefore, not possible to choose a best policy unless the goal is to
plan for a worst case scenario. New information cannot be integrated in a way that
meaningfully affects the decision process. If the input range of an uncertain variable
is broadened or narrowed, it would only be by coincidence that the policy choice
would become clear.
While the approach is not explicit about a the policy that is likely yo maximize
net benefits, it very usefully builds intuition about what circumstances are necessary
for a particular policy to have net benefits and how robust a policy is to different
futures. Compared to the other approaches it is very easy to develop nuanced rules
based on country conditions and changes in the energy system. Classification trees
quickly identify the variables and their thresholds that characterize policies with net
benefits. It is easy to interpret in broad brush strokes which uncertainties are most
influential, but will not identify anomalous regions that might be the result of a
unique combination of less influential uncertainties. Insights from classification can
be more deeply investigated with the Patient Rule -Induction Method (PRIM). PRIM
requires hands on iterative interrogation of the data, so is not as quick, but is easy
to interpret and can find local anomalies. Used together one or the other is likely to
produce a set of rules that are intuitive.
The practitioners of this approach are aware of the interpretation challenges pre-
sented and focus on the insights for analysts not for policy makers (Agusdinata, 2008).
Their focus has been on improving visualization rather than integrating probability.
They assert that all uncertainties cannot be represented with probability, even sub-
jectively. Foreign policy decision makers are generally comfortable making decisions

CHAPTER 5. MODELS AND UNCERTAINTY ANALYSIS 167
based on subjective probability, though they probably would not label it as such. A
relatively small number of foreign policy decisions are based on data. Rather deci-
sions are based on the belief of decision makers that has been influenced by many
different types of qualitative and quantitative information. For energy and foreign
policy questions, therefore, an appropriate modification of this approach would be to
first identify the combinations of inputs that produce worrying outcomes and then
to assess the likelihoods of those inputs to understand the likelihood of the trou-
bling outcomes. This approach would narrow the total number of uncertain variables
probabilistically assessed.

CHAPTER 5. MODELS AND UNCERTAINTY ANALYSIS 168
Policy Rule Futureswith netbenefitscaptured
Carbon price(Total = 206)
Capacity addition rate > 1.8, Price change of gas < 1.2,Urban demand < 1.3
108
Capacity addition rate > 1.8, Price change of gas < 1.2,Oil indexation
43
Capacity addition rate 0.9-1.8, Rural electrification rate> 1.06
26
Ceiling(Total = 3)
Regasification cost > 1 2
Concessional(Total = 98)
Fugitive methane emission rate < 0.06, Price change ofgas > 1.2, No oil indexation
63
Fugitive methane emission rate < 0.06, Price change ofgas > 1.2, Oil indexation, Price change of diesel <1.2
15
Fugitive(Total = 433)
Fugitive methane emission rate > 0.06, Urban demand> 2.3
257
Fugitive methane emission rate 0.05 - 0.06, Urbandemand < 2.3
48
Fugitive methane emission rate 0.05 - 0.06, Urbandemand > 2.3
41
Fugitive methane emission rate < 0.03, Urban demand> 3.6
33
Renewable(Total = 208)
Oil indexation, Rural electrification rate > 1.1, Urbandemand < 1.8
49
Oil indexation, Rural electrification rate < 1.1, Urbandemand 1-3.2
36
Urban demand < 3.2, Oil indexation, Price change ofgas > 1.3, Price change of coal < 1.3
29
Table 5.13: Rules that distinguish conditions in which policies have net benefits asidentified by classification.
Chapter 6
Conclusions
History is written through a
rearview mirror but it unfolds
through a foggy windshield.
Samuel Berger, 2004
The purpose of this chapter is to synthesize the results of the modeling in Chapter
5 and to assess their relevance for the questions raised in previous chapters. The first
section in this chapter will make a policy recommendation on the role for natural
gas to balance energy poverty and climate change to resolve the questions opened in
Chapter 3 and 4. The second section in this chapter will contrast the approaches to
uncertainty analysis from Chapter 5 to draw conclusions about their appropriateness
for policy problems at the intersection of energy and foreign policy.
6.1 Natural gas in U.S. foreign policy
Chapter 3 deconstructed debates about the electricity needs of low income countries
and identified uncertainties that will determine the viability of natural gas as a fuel
to balance energy poverty reduction and climate mitigation. There is no clear policy
on the role of natural gas. Without a clear statement, investment in new power
169
CHAPTER 6. CONCLUSIONS 170
generation capacity is hindered. This is counter to U.S. energy poverty and climate
change interests.
In Chapter 5, four approaches to uncertainty analysis were used to answer the
question, “When and where is it in the national interest of the United States to use
existing policy tools to promote natural gas-fired power to balance the cost of unmet
demand for electricity and the cost of climate change?” The analysis in Chapter 5
showed many and sometimes conflicting conclusions about when to intervene in the
electricity system of low income countries.
The most important take away from the four different analyses is that supporting
natural gas in the fuel mix can be a beneficial policy. It can be beneficial both to
provide electricity to reduce unmet demand and to reduce emissions below a more
emissions intensive counterfactual. U.S. policy should explicitly acknowledge this to
give private investors a clear signal to move forward on investment in all forms of
low-carbon electricity and to give pause to continued investment in coal and diesel
fired power capacity.
A one size fits all policy is not the best route forward, nor is it sufficient to group
countries into categories like income level. Some countries will benefit from gas more
than others. A blanket no-gas policy leaves gains on the table, and a blanket pro-gas
policy risks unnecessary emissions. In this section, a policy recommendation is made
followed by a synthesis of insights to the policy problem that resulted from the four
different analyses.
6.1.1 Policy recommendation
The United States should clarify its support for natural gas as an important part of the
electricity mix in low income countries. Supporting natural gas is consistent with U.S.
interests to promote economic development globally and mitigate climate change to
promote prosperity and security in the United States. Compared to alternative types
of electricity production, natural gas-fired power is both low carbon and dispatchable.
Expanding the amount of electricity provided by natural gas in low income countries
CHAPTER 6. CONCLUSIONS 171
can both reduce greenhouse gas emissions and reduce the amount of demand for
electricity that goes unmet.
There are three types of actions the United States should pursue to support the
benefits of natural gas in the electricity sector. Any single action will deliver benefits,
but all three can work together for an even larger impact.
First, the United States should engage natural gas producers to increase invest-
ment in their natural gas infrastructure to protect against fugitive methane emissions.
A technical assistance program to reduce these emissions is the most impactful way to
support climate change mitigation without sacrificing development because reducing
fugitive methane emissions does not reduce the amount of electricity that can be gen-
erated affordably. Programs to reduce fugitive methane emissions can lead to higher
levels of infrastructure investment and local employment. Producer engagement on
fugitive emissions should be coupled with diplomatic support to improve the efficiency
of upstream operations to expand and extend the availability of inexpensive domestic
gas. The United States can facilitate information exchange between governments and
industry to negotiate a balance between the volumes of gas available for domestic and
international markets.
Second, the United States should use its resources to encourage an end to oil
indexed gas prices. Oil indexation is an impediment to the low natural gas prices
necessary to effectively take future or current market share from coal. There are
investment, contractual, and regulatory impediments to a system of gas pricing based
on the supply and demand of natural gas. Industry has real concerns about making
large capital investments without oil indexation. A variety of U.S. agencies should
engage on these topics to support a transition away from oil indexation.
Third, the United States should make available concessional loans and other risk
and loan products that can lower the cost of new gas-fired power generation. While re-
newable energy should continue to be a major part of U.S. support for energy projects
in low income countries, it should not be at the exclusion of natural gas projects. In
some circumstances concessional finance for natural gas can reduce emissions more
than the same support for variable renewables. In other circumstances concessional
CHAPTER 6. CONCLUSIONS 172
finance can more effectively reduce unmet demand for electricity, while the same sup-
port for variable renewable energy would increase an electricity shortage. A case by
case evaluation of every project will consider local and global factors such as the gas
pricing mechanism, the percentage of electricity coming from dispatchable electricity
generators, the expected level of rural and urban demand per capita, and the abil-
ity of the country to support high rates of generating capacity additions. Discretion
should be left with implementing agencies to make country by country, project by
project decisions.
Low income countries that import natural gas should be prioritized for conces-
sional finance for gas as the difference it creates in the economics of those projects is
more significant than countries that have access to their own inexpensive resources.
Policy should support what is otherwise not competitive.
A pro-gas policy stance will be welcomed by low income countries, but other
developed countries, predominately in Europe, may disapprove. In the coming years,
as the need to increase the ambition of climate mitigation commitments grows, there
will be pressure to eliminate support for all fossil fuels. Given the U.S. dual interest
in development and climate because of their connections to global prosperity and
stability, support for natural gas should not be sidelined.
6.1.2 Policy insights
In addition to the recommendation above, the modeling produced a number of impor-
tant insights pertaining to the sensitivity of the policy problem to value preferences,
the importance of certain uncertainties, and the implications of individual policies.
Preferences
In Chapter 4, value preferences were established and monetized using the U.S. inter-
agency social cost of carbon and three levels of cost of unmet demand for electricity.
The value preferences, while defensible, are not verifiable. Nevertheless, being explicit
about how the costs of unmet demand for electricity in a foreign country and global
climate emissions are monetized revealed the tradeoffs implicit in each fuel choice.
CHAPTER 6. CONCLUSIONS 173
While arguably not the “right” monetization, it was necessary and helpful. Even
without a verifiable preference valuation, there are three important conclusions.
First, a sizable value of either cost is necessary to justify the cost of any policy
action. At a lower social cost of carbon, like the USD 11 per MtCO2 no policy reduced
emissions sufficiently to warrant the cost. The magnitude of the cost of carbon was
the primary driver of whether any policy action would deliver net benefits. The
magnitude of the cost of unmet demand, changed the policy alternative that delivered
net benefits.
Second, the level of the cost of unmet demand for electricity changed which policy
have net benefits. If the cost of unmet demand was an order of magnitude lower than
the cost of carbon, then policies that reduced emissions even if they raised unmet
demand had net benefits. If the cost of unmet demand was an order of magnitude
larger than the cost of carbon, then concessional finance for natural gas, a gas price
ceiling, or fugitive methane emission reductions had greater benefits.
Uncertainties
One of the most important products of the modeling was identifying variables with
a strong influence on the whether a policy has net benefits. Realizing benefits from
concessional finance of natural gas relies on certain global factors: oil indexation, the
price of natural gas, and fugitive methane emission rate.
Without an end to the practice of oil indexation support for increasing invest-
ment in natural gas may not overcome the relative price difference with coal. There
are opportunities for U.S. foreign policy makers to advance a switch toward gas on
gas pricing, including working with industry bodies to design standardized contract
agreements as is common in oil markets, facilitating transparent data exchange, and
working with both major gas consumers and gas producers to build confidence in
a gas on gas price signal especially in Asia where oil indexation is most common.
There are abundant natural gas resources, but producers must have confidence in
their investment to unlock that supply.
With an end to oil indexation, the price of natural gas influences the benefit
from concessional finance for natural gas power plants. The results show where U.S.

CHAPTER 6. CONCLUSIONS 174
support for natural gas is beneficial, but there are other countries where though U.S.
support is not warranted, gas plays a role in the fuel mix. If prices are low, investment
would have been made without policy action, so providing financial support adds costs
but no additional benefits. The policy is most effective for reducing emissions when
the relative prices of fuels are such that concessional finance is just the additional
incentive needed to make natural gas competitive. If a country already has significant
coal or diesel assets, then the concessional policy will only reduce emissions when gas
prices are low. If gas prices rise, then a country with significant capacity will just
switch back to burning coal and diesel. If, however, a country invested in gas because
of the concessional finance and has few thermal alternatives, the emissions will be
significantly lower than they would have been because there is no other thermal
capacity to use even if gas prices rise. This gas lock-in is not necessarily a positive
outcome. If it leads to unused assets or extremely high prices it may itself become
the reason for political instability. There are several examples of diesel-fired power
generators being the subject of ire when global oil prices rose to record highs and
caused power prices to be untenable for impoverished populations. The cost of floating
storage and regasification units (FSRUs) is also an important component of the gas
price for importing countries. There may be risk mitigation products that can lower
the unit cost of that infrastructure
The rate of fugitive methane emissions was the deciding factor across all coun-
tries in some futures. High rates of fugitive emissions reduced the net benefits of
concessional finance for natural gas.
Policies
Five different U.S. policy alternatives have been considered: price ceiling, technical
assistance for a carbon price, technical assistance to reduce fugitive methane emis-
sions, concessional finance for renewable energy, and concessional finance for natural
gas. The results show that each policy may have a roll to play in reducing emissions
and unmet demand for electricity. Each policy results in a unique tradeoff of the two
objectives. Whether the policy results in net benefits is strongly influenced by the
energy system and the national context in the foreign country.
CHAPTER 6. CONCLUSIONS 175
Natural gas price ceiling
Sponsoring a gas price ceiling in a low income country would likely be a politically
difficult policy for the United States. Though not without precedent, using U.S. aid
to buy fuel is controversial. Nevertheless, the unique circumstances under which
this policy is effective is cause for further consideration. Unlike the other policies, a
price ceiling would not always have a policy cost. If international prices are low, and
therefore, below the ceiling, the payout is zero. The policy only pays out when gas
prices are high, either because oil indexation is maintained and the oil price rises or
because gas prices rise. As time passes and there is more information about these
uncertainties, the risk associated with the price ceiling policy will decline.
For small countries, with little absolute gas consumption, the policy can be the
least cost option. It acts as a hedge against high gas prices allowing gas-fired gener-
ation to run when it otherwise would not. In an electricity system that relies on coal
or diesel, the emissions benefit justifies the policy. In implementing the policy it is
important to calibrate the ceiling level so as not to crowd out investment in renewable
energy that would otherwise be competitive, while making the ceiling low enough to
make the cost of electricity comparable to coal or diesel fired generation. It would also
be important to consider the moral hazard that might be created if foreign countries
no longer had an incentive to negotiate for the lowest gas prices possible.
Technical assistance for carbon price
Employing a carbon price, unsurprisingly, results in the most comprehensive re-
duction in emissions. It incentivizes both investment in less carbon intensive power
plants and fuel switching among existing power assets. However, that reduction in
emissions comes with higher unmet demand. Two different mechanisms for this result
were demonstrated in the modeling. First, the carbon policy makes variable renewable
energy more cost competitive and incentivizes more investment. For a country with
insufficient power generating capacity and a modest growth rate in capacity expan-
sion, the increased market share for renewables exacerbates the electricity shortage
as variable renewable capacity results in less generation per unit of capacity because
of its intermittency. It is common in low income countries for there to be limits
CHAPTER 6. CONCLUSIONS 176
to investment because of limited public budgets, insolvency of utilities, difficulties
attracting finance, and regulatory and siting challenges.
Second, increasing the carbon price increased the cost of electricity produced by
all of the thermal generators, which sometimes incentivized power generators to shut
down rather than produce electricity. Given the financial challenges many utilities in
the developing world face, it is easy to imagine generators not producing electricity
despite the impact on the population. Because of the increase in unmet demand
caused by higher prices, it is counterproductive to support a carbon price unless a
direct subsidy program is in place to mitigate the rising energy costs for the poor. If
the same entity has the burden to electrify and must pay a carbon cost, a perverse
incentive is created. Deliberately slowing electrification would lower the carbon cost.
Technical assistance to reduce fugitive methane emissions
In contrast to the carbon price, a policy to reduce fugitive emissions decreases
greenhouse emissions without increasing unmet demand for electricity. The policy
does not directly change investment or dispatch in the electricity sector, therefore,
the policy will result in the same electricity generation as if no policy action were
taken. While a carbon price is likely to be resisted by a foreign government, they
are likely to welcome U.S. support and investment associated with inspecting and
repairing leaks. Reducing unaccounted for gas lost from leaks would increase revenue
and could result in local employment opportunities.
A fugitive emissions policy delivers net benefits in countries that consume sig-
nificant quantities of gas, which are often countries that produce gas domestically.
Domestic production provides even greater opportunity to reduce fugitive releases
that come from upstream super emitters.
Neither a fugitive policy nor a carbon price necessarily provides net benefit. The
net benefit strongly depends on the social cost of carbon assumed and the pro-
gram cost assumed. The United States should not oppose a carbon price or a fugi-
tive methane emission reduction scheme, but they should be circumspect about the
amount of U.S. resources invested to bring them about.
The performance of the fugitive methane emission and carbon price policies in the
model results should not be interpreted literally for two reasons. First, as described
CHAPTER 6. CONCLUSIONS 177
in Chapter 4, the costs of these policies is the cost to the United States to support
implementation of a national policy within a low income country through technical
assistance. Technical assistance is a very small fraction of the cost assessed on the
owners and operators of infrastructure. Second, the parameterization of the technical
assistance cost was simple; the cost was constant across time and across countries.
In reality the costs of technical assistance would depend on the size of the country,
the number of firms, the number of physical sites, and the current level of regulatory
sophistication. The U.S. Agency for International Development and other agencies
could estimate a unique cost for each country. While the cost effectiveness of the
fugitive methane emission and carbon price policies cannot be taken literally, the
results still provide several legitimate insights into the implications of both policies.
Concessional finance for variable renewable electricity
The renewables policy, which provides concessional finance to variable renewable
electricity generators strongly affects investment and generation. Renewable tech-
nologies do not have fuel costs and have relatively high capital costs, so an incentive
that lowers the capital cost is more powerful than the same policy supporting nat-
ural gas-fired power capacity. The absolute policy cost of the concessional finance
for renewables is overstated in the model results because of modeling simplifications
that charges the U.S. as if all variable renewable energy capacity was financed by the
United States rather than a subset of projects.
The renewables policy reduces emissions, but in many cases increases unmet de-
mand for electricity. Like the carbon policy when there is both a shortage of electricity
and investment in additional power capacity is limited, either by budget, or as in the
model here, because of a limit to the rate at which capacity can be added, then
adding variable renewable electricity capacity increases unmet demand over what
would have happened if no policy were in effect. Since electricity from variable re-
newable electricity has a lower capacity factor than thermal generators, the same
amount of investment in MW results in less electricity, which is a particular concern
for any system that already has a deficit. Coupling concessional finance for renew-
able energy with a policy to improve a country’s governance capacity to increase the

CHAPTER 6. CONCLUSIONS 178
annual rate of successful investment in power plants would help mitigate this increase
in unmet demand, but will not change the underlying dynamic.
Some amount of variable renewable electricity can be added to the grid without
additional costs. Without specialized technical modeling, that percentage of total
electricity is difficult to estimate. Whatever percentage is assumed, the remainder of
the supply must come from dispatchable generators. Dispatchable generation may
be zero carbon, as in large hydro, geothermal, or nuclear energy or it may be ther-
mal generation for fossil fuels or biomass. The amount of dispatchable zero carbon
electricity varies by country. In the near term, until there are significant technol-
ogy solutions to enable high penetration of variable electricity supply, countries must
have sufficient dispatchable power available. Looking to 2030, some technologies not
available today could be available. But available globally, does not mean competitive
in low income economies.
For a low income country that is already short on electricity supply or is likely
to be near the end of the 2030 time horizon, this has interesting implications for the
timing of renewable energy investment. The uptake of renewables will be limited
by a combination of the amount of dispatchable power available in a system and
affordable advances in grid integration technology. Renewable energy technologies
will continue to decline in price. One strategy to lower the overall cost of power
capacity is to invest in the needed dispatchable power in the near term while other
countries drive the costs of renewable energy down. Toward the end of the time
period, the same amount of investment in renewable energy in dollar terms will buy
more, and there will already be sufficient dispatchable generation in the system. If a
strategy of postponing renewable is taken, then the choice of dispatchable generation
is very important. The countries that may be poor candidates for gas are those
with adequate dispatchable zero carbon alternatives to fossil fuels or a viable path to
significantly increasing that power source.
While it is true that part of the cause of recent cost declines is deployment today,
it is not obvious that the buy down in cost should happen in the developing world.
In the developed world where electricity networks can integrate variable renewable
the incremental cost of a MW today vs a MW tomorrow is negligible in the overall
CHAPTER 6. CONCLUSIONS 179
system cost. Postponing investment in renewable energy would not be a responsible
policy globally, but given inequities in wealth it might be a reasonable compromise.
Concessional finance for natural gas-fired power generation
Providing concessional finance for natural gas power plants is an incentive that
could tip the scale if relative prices of coal and diesel are similar. The cost of electricity
from natural gas is dominated by the fuel cost, not the capital cost. Therefore,
concessional finance is a very subtle tool and cannot overcome dramatic differences
in relative cost among biomass, coal, diesel, and gas. Concessional finance for gas
primarily affects investment. Dispatch is affected to the extent that the lower debt
rate lowers the average cost of electricity generation. Lower electricity prices means
more electricity demand is served profitably.
The net emissions impact of of raising investment in natural gas generation de-
pends on the competitiveness of renewable energy without policy support. If the cost
of renewable electricity is lower than the cost of gas-fired electricity, as is the case
when variable renewable electricity technology capacity costs decline more rapidly
than expected, then gas does not take market share from renewables. Cheap renew-
able energy is a reason to support natural gas. Similarly, cheap gas is a reason to
support renewables. Concessional finance should support technology that tis just out
of economic viability.
Like concessional finance for renewables, the policy cost of concessional finance
cannot be taken literally. The models overestimate the absolute policy cost because
of the simplification that provides a loan for all gas-fired investment. In reality, there
are limits to how many projects could be supported simultaneously.
The results of the models with all four uncertainty approaches showed little benefit
to promoting natural gas in countries that are domestic producers of gas. While at
first this is a surprise, it highlights the importance of using model results for insight
and not for literal interpretation. In theory, countries with domestic production have
access to cheap natural gas. Often times this is because of bad government policies
like subsidies or regulations that require the gas to be sold at cost. But even in the
absence of distortionary policies, domestic producers need only pay the opportunity
CHAPTER 6. CONCLUSIONS 180
cost of selling gas on international markets, which is the international price less the
cost of liquefaction and transportation.
With a low gas price, investment in gas for power will be made without U.S.
policy support.This very reasonably causes concessional finance for renewable energy
to provide more net benefits in these countries because the impact is additional. The
net benefits of concessional finance for renewables is predicated on the natural gas
generation the model assumes would be built. However, what is not taken into account
in the model, that must be taken account in policy formulation is whether domestic
gas producing countries are realizing low prices across their value chain. Experience
shows this cannot be taken for granted. Therefore, while concessional finance may
not be cost effective policies in a gas producing state, other assistance to make sure
that projects that support production of low cost gas should be considered.
Support for countries with domestic supplies could also take the form of making
current operations more efficient and to improve the investment climate for additional
upstream investment. The current low price environment is an opportunity to develop
economically viable domestic markets while there is less pressure for export. Examples
include, Mozambique and Tanzania.If domestic production in countries like Indonesia
and Myanmar declines, coal consumption in those countries will rise and the price of
natural gas will rise globally causing coal to win out in more places. In countries like
Nigeria and Ghana, improvements in the existing gas supply chains will increase the
number of people with electricity, albeit with rising emissions.
The results of this work also provide some insight into prioritizing countries for
concessional finance for natural gas-fired generators. If emissions and unmet demand
are the most important attributes of a policy outcome, as they have been in this work,
then a country that has both gas and coal resources should be a target of support
for gas development over a country that has gas resources, but no coal resources.
Similarly, a country with power deficits, but adequate electrification would benefit
from reductions in unmet demand compared to a country that has high unmet demand
largely because of poor electrification.
CHAPTER 6. CONCLUSIONS 181
6.2 Uncertainty analysis for energy and foreign
policy decision support
Chapter 2 reviewed the scholarship on foreign policy decision making which exposed
challenges for using energy models for decision support in foreign policy. Despite
widespread success in domestic energy policy making, energy modeling has not been
common in policy making at the intersection of energy and foreign policy. Although,
the policy problems are similarly characterized by complex systems, uncertain futures,
and multiple objectives, models are not an essential part of decision making. The lack
of a clear articulation of the philosophy for interpreting model results for energy and
foreign policy decision making, inattention to the unique context of the foreign policy
decision making process, and structural misalignment in the models themselves are
barriers to energy model use. Chapter 5 contrasted approaches to uncertainty analysis
with different tradeoffs with model complexity to provide evidence for advancing
structural changes that could be made. This section will draw conclusions about the
philosophy and alignment which has implications for the tradeoff between complexity
and sophistication of the uncertainty analysis. And then combines this insight with
the results in Chapter 5 to recommend an appropriate framework for modeling at the
intersection of energy and foreign policy.
6.2.1 Articulating a philosophy and aligning the process
Models are useful in a multiple decision maker context because the modeling process
itself deconstructs the problem to make it more tractable and better suited to dis-
tributed information gathering by members of the interagency. Models force policy
makers to be explicit about the information and evaluation of the objectives that
are behind their conclusions. Making qualitative judgments quantitative prevents
jumping to the wrong conclusions. Models provide discipline for the conversation by
enforcing a specific structure of relationships among variables in a complex system
and a logic of preferences to compare outcomes. Models support reasoning about
many possible futures and the implications of what is known. All of these advantages
CHAPTER 6. CONCLUSIONS 182
help policy makers discard preconceptions formed when the energy system was much
different than it is today.
These co-benefits of modeling are as important as the results themselves. Yet,
the results are typically the raison d’etre for energy modeling. But results should
not be presented to policy makers without a clear explanation of what the results
are, a philosophy of model interpretation. All models have an underlying philosophy.
Statistical prediction models are focused on prediction accuracy, regardless of whether
the results are interpretable. Energy models are poor tools for prediction and have
their value in the insights they offer rather than a literal interpretation of the numbers
(Huntington et al., 1982; Peace & Weyant, 2008; Weyant, 2009).
Just as energy models are not tools for prediction, they are also not a means to
scientific discovery as models are in some disciplines. The model is not a “truth ma-
chine”(B.Wynne & Shackley, 1994). The results of these models are highly sensitive
to noNational Security Councilientific preferences. The detail of models, the precision
of data, and an output with many significant figures is misleading. This vulnerability
should be counteracted with an explicit warning to avoid misinterpretation.
Among energy models there are different philosophies used to interpret the num-
bers and draw insight. The U.S. Energy Information Administration refers to their
results as conditional forecasts to deliberately inform consumers that prediction is not
the goal of their work and, therefore, not the metric for evaluation. The International
Energy Agency’s results are “plausible pathways to a desired end state” designed to
help decision makers think about transitioning the energy system.
Policy making is an intuitive judgment based on “postulated probabilities” and
“culturally-dependent judgments (Schneider, 1997).” Model results are not a “right
answer ”or a replacement for judgment. Results are an input to judgement. The
standard for energy and foreign policy models for decision support should be clarity
about what actions are rational and a more full understanding of the implications
of things already known. A valid model is one that exposes a relationship between
variables or a dynamic in the system that once illuminated becomes obvious. The
results should be taken seriously, but not literally (Schneider, 1997).

CHAPTER 6. CONCLUSIONS 183
While perhaps this is well understood within the modeling community, it is poorly
understood among lay people. Interagency policy makers have diverse experience
with models, which makes it important for the analyst to consider thoroughly the
interpretation of the model results. It must be made explicit that the results of the
model are not the answer. Not only will this articulation shift the focus to the insights
and away from the numbers, this calibration should alleviate fears that modeling
results may box in the decision maker.
There are three immediate implications of this philosophy. First, if information
does not change the decision, it should be left out. The relationship might be real, but
it may not be influential. Second, the focus should be on agreement on the decisions
even when there may be disagreement about the assumptions. Third, insights must
accrue to the decision maker.
If the policymakers are to understand what is driving the results and their impli-
cations to “re-enter to make the value judgments that are their franchise(Schneider,
1997),”then the model insight must accrue to the policy maker not the analyst. It
is not uncommon to hear that the analyst is the one who learns the most from a
modeling process. The analyst, however, is often distanced from the political pulse.
To be useful to a decision maker, the results must provide both clear guidance, and
nuance to produce new intuition. The ease of interpretation of model results is two
dimensional. It is not enough to know what to do, it must also be clear why a certain
course of action results in net benefits and what conditions might change the conclu-
sion. In order to disrupt mental models, the decision maker must see the result for
himself. The analyst, therefore, should make every effort to present analysis that is
easy to interpret correctly. This has implications for the complexity of the model, the
representation of preferences, and the approach to uncertainty analysis, which will be
explored in the following section.
In addition to providing a clear philosophy, the uniqueness of the interagency
foreign policy decision making process, described in Chapter 2, must be a primary
consideration in a modeling effort. First, it is important to consider the alignment

CHAPTER 6. CONCLUSIONS 184
between the policy making cycle and the modeling cycle. Foreign policy decision mak-
ing typically occurs on short time cycles, those measured in weeks and not months.1
Second, the diversity of the information, alternatives, and preferences of each mem-
ber of the interagency need to be used as an advantage and not fuel for bureaucratic
politics. These process considerations also have implications for the model structure.
6.2.2 Structure
Each uncertainty analysis demonstrated in Chapter 5 provided insight into the pol-
icy problem that would not have been possible without a mathematical modeling
aid. The purpose of this research has been to reveal opportunities to intentionally
structure energy models to better support decisions at the intersection of energy and
foreign policy specifically by looking at tradeoffs in the management of complexity,
uncertainty, and multiple objectives.
Complexity
There is a tendency in the energy modeling community to build large models with
technical detail to capture the complexity of the real world system (DeCarolis, 2011;
Morgan & Henrion, 1990). Some attribute this behavior of ever growing models to
institutional inertia and incentives (DeCarolis et al., 2012). Others see the root in a
false belief that the more details in a model the better the accuracy (Bankes, 1993).
Whatever the reason, this research reinforces the idea that models should be as simple
as possible. A comparison of the insights derived from the two models of differing
complexity built in Chapter 5 shows that additional model complexity comes at the
expense of run time to the detriment of uncertainty analysis, which was the source of
important insights.
The only clear benefit of additional complexity in this policy problem was the
examination of each country uniquely. The results of the analysis varied by country,
1The case study examined in this research, the role of natural gas to balance climate and de-velopment goals, was chosen because it is an exception within the energy and foreign policy areawhen it comes to policy cycle time. An urgent matter would not have been appropriate for themethodological investigation done here.

CHAPTER 6. CONCLUSIONS 185
while each country was sensitive to different uncertainties. Foreign countries were
differentiated based on their population demographics, their historical capacity and
electrification growth rates, and the initial state of their power generation fleet. Even
this simple differentiation, which does not try to represent differences in national
energy policies, results in very different conclusions. These differences would be more
pronounced with changes to the likelihood of outcomes that would be expected for
countries with differing levels of governance and different history with each fuel. All
of this highlights how important it is for energy and foreign policy modeling to be
done on a country by country basis. This will come as no surprise to foreign policy
or development practitioners, but is often ignored in economic and energy modeling.
The two models differed in complexity most in their representations of the inter-
national gas market.2 In the National Electricity Sector Simulation (NESS) model,
the gas market was a single price in the initial time period that could rise and fall in
subsequent time steps. In contrast, the International Natural gas Trade Optimiza-
tion (INTrO) model, calculated the prevailing price based on elasticities of supply and
demand and the transportation cost by LNG or pipeline in 14 geographic regions, dif-
ferentiated by exporters and importers. The latter model required significantly more
data to be collected and increased the model run time in a way that limited either
search or responsiveness, as will be discussed later in this section. In the end, the
fluctuations of other fuel prices and the rates of growth of each countries’ electrifica-
tion and installed capacity swamped the nuanced price changes that the gas model
provided.
Model complexity should be adjusted to accommodate sophisticated uncertainty
analysis. Reducing complexity has other benefits. First, a less complex model is faster
to build. Modeling for foreign policy will require new model development to fit each
policy concern. Models need to be tailored to the situation: time horizon, system
boundaries, foreign country, geopolitical circumstances etc.. Yet, in the short time
2By this analysis I am not intending to say anything about the suitability of optimization versussimulation. In this work the optimization model was the more detailed, but there are many simpleoptimization models just as there are many very detailed simulation models. In fact, if a problemis suited to optimization, that is can be cleanly represented by an objective function and constraintfunctions, it may be much easier to construct than a similar simulation model. The decision on whatkind of model to use should be driven by the problem.

CHAPTER 6. CONCLUSIONS 186
allotted for gathering evidence to bring to the interagency policy decision making, the
most value will come from performing uncertainty analysis not building the model.
Therefore, reducing complexity will make it more likely that model-based analysis
will fit within the often short policy making cycle. A second, related matter, is that
a more detailed model requires more data. While U.S. foreign policy agencies are in
a unique position to collect specific data, their strength is not large data sets.
Second, a less complex model is easier to communicate. A model that is simple to
communicate facilitates collaboration across agencies with different types of expertise
that will be involved in the analysis process. It can prevent an imbalance of power
among decision makers from different agencies that may have more or less comfort
with mathematical modeling.
Third, a simple model could accelerate model evaluation. As prospective energy
models cannot be validated in the way statistical or scientific models are, validation
may be done by establishing an expert review (Hodges et al., 1992; DeCarolis et al.,
2012; Strachan et al., 2016). It is unrealistic to expect oversight in a foreign policy
context as there are very few foreign policy decisions that are opened up to public
scrutiny not only because of the sensitivity of the subject matter, but because of
the nature of a subjective decision based on quantitative and qualitative information.
However, one can imagine modelers, from within the government or on certain occa-
sions those outside, could review the code for sound structural assumptions. The less
complexity, the more likely the review effort can be conducted within the short time
cycle of the decision making process.
Multiple objectives
One dominant character of policy questions at the intersection of energy and for-
eign policy is the centrality of the national interest as a driver of preferences. The
national interest is a malleable, value judgment that does not lend itself to straight-
forward quantification. Nevertheless, to be used within an energy model, some form
of quantification is necessary whether the analysis is multi-attribute to accommodate
outcomes in their native units or whether a common monetization scheme can be
developed. Quantifying and further monetizing pieces of the national interest should
CHAPTER 6. CONCLUSIONS 187
clarify what is at stake by making the tradeoffs in a policy decision explicit rather
than obscure value-laden judgments.
Chapter 4 concluded with the monetization of the costs to the United States of
greenhouse gas emissions and unmet demand for electricity in a foreign country. The
codification of preferences, while logical, can never be validated.
Encoding preferences will be one of the most difficult barriers to overcome to see
more use of energy models in foreign policy decision making. There is a deep litera-
ture on best practices and pitfalls for eliciting preferences, but they apply mainly to
situations with single decision makers. In energy and foreign policy multiple decision
makers is the norm. Differences in preferences among these decision makers stem
from both different belief systems and different organizational interests. Differences
in fundamental values will be particularly difficult to drive to consensus since there
is no right answer. On the occasion when the President takes the prerogative person-
ally, or delegates it to another, it is unlikely either would participate in an elicitation
process.
While not ideal, in practice, an analysis can experiment with explicit though un-
verifiable monetizations of outcome attributes to compare policies. In which case, the
National Security Council staff can direct a process to forge consensus on the national
objective at the beginning of the process that can be stress tested to understand how
they change the decision if they have any effect at all.
Uncertainty
Each of the four approaches to uncertainty analysis used in Chapter 5 can be con-
trasted by their strengths and benefits in five parts of the model-based policy analysis
process. The best approach to uncertainty analysis in the context of energy and for-
eign policy makes encoding as easy as possible, facilitates thorough search of the
policy space, lends itself to clear interpretation by the policy makers, is responsive to
the policy makers requests for additional analysis, and incorporates new information.
Encoding
At the beginning of the model cycle, uncertain variables must be encoded, that
is assumptions must be made about which variables are uncertain and how they
CHAPTER 6. CONCLUSIONS 188
should be represented. For the probabilistic approaches, uncertain variables must
be encoded by summarizing historical data or characterizing the decision maker’s
belief about the likelihood of an event through an interview process. An encoded
uncertainty is represented mathematically as a continuous or a discrete distribution.
Encoding beliefs about uncertain variables for an individual, much less a group, is a
time consuming process. Monte Carlo analysis requires all of the uncertain variables
to be encoded. In contrast, decision analysis isolates the most influential uncertainties,
those that are responsible for the majority of the variance in the results, so that fewer
uncertainties must be encoded.
Scenario analysis and exploratory analysis avoid probability encoding. In the
formulation phase this is an advantage, but as will be discussed has consequences
during the interpretation phase. In scenario analysis only point estimates are need
for each uncertain variable. Unfortunately, consensus on those point estimates is
necessary to do the analysis. If someone does not agree on the assumptions in one
scenario, there is a risk they will throw out the result even if the assumption they were
concerned about is not the primary driver of the result. Exploratory modeling and
analysis, by contrast, uses a range of values for each uncertain variable. As agencies
often have different sources of information because of their different relationships with
different industries, non-governmental organizations, and academic circles, asking the
interagency group to agree on a range of values to be explored will be easier than
agreeing on input sets of central values.
Search
The next part of the modeling process is search, which is also an important part
of the policy process. Uncertainty analysis can improve or limit search in two ways:
coverage of input space and iteration time. The breadth of input space can be explored
by a method that casts a large net or by a method that allows many iterations. Some
methods facilitate both. There are an unfathomable number of different input sets to
a model. Any analysis that leaves input space unexplored may mean there is solution
space that has not been considered to test hypotheses or generate new ideas. The
more the analyst can proceed through the iterative process of changing assumptions
and analyzing new results to identify creative alternatives, the better. The model run

CHAPTER 6. CONCLUSIONS 189
Uncertainty analysis Model run time(minutes)
Futurescalculated foreach policy
Predictive scenario analysis 20 3
Monte Carlo analysis 360 1000
Decision analysis 20 4000
Exploratory modeling and analysis 20 1000
Table 6.1: Model run time for different approaches to uncertainty analysis
time and the number of futures in a run, summarized in Table 6.1, are indicators of
how well the analysis facilitates search.
Scenario analysis chooses a small number of sets, generally three or four, which
may differ by one variable or by all variables. The input sets may or may not be
designed to include the extremes. The speed of scenario analysis is relatively quick,
however, using scenario analysis as a search tool is time consuming and arbitrary.
Decision analysis also chooses a small number of inputs values to vary, but through
the decision tree calculates the result of every combination of every degree of each
uncertainty. This increases the thoroughness of search, but often omits the extreme
values obscured by discretizing a continuous distribution into a few points. Even
though many combinations of uncertain variables are made, they are rigidly structured
so they may prevent discovering any anomalous regions.
In contrast to scenario and decision analysis, both Monte Carlo and exploratory
modeling and analysis consider possible futures that include extreme values. Monte
Carlo samples input values from the entire distribution of an uncertain variable and
exploratory modeling and analysis samples from the plausible range. The two meth-
ods differ in their iteration speed. Monte Carlo analysis is considerably slower than
exploratory modeling limiting search.
Interpretation
Each uncertainty analysis produces many different outputs that must be inter-
preted first by the analysts and then by the decision makers.The primary concern
CHAPTER 6. CONCLUSIONS 190
here is the decision makers’ interpretation. It is not enough for results to be inter-
pretable to the “priesthood of model cognoscenti (Bankes, 1993).” In order for the
varied expertise of the interagency to be brought to bear on the matter, each must
be able to interpret the results, recalibrate their own intuition, and ask for additional
modeling to follow their hunches. The decision maker must internalize the results to
incorporate them with other types of judgment they must exercise (Schneider, 1997;
George, 2006).
Results lend themselves to interpretation when they 1) clearly distinguish the
best course of action and 2) develop a decision maker’s intuition. If an approach
gives a clean result, but provides little intuition about the mechanisms that produce
that result, then the analysis is not going to play a role in the decision making. An
approach that provides a messy answer, but that builds intuition may be useful since
the information can be integrated with other considerations. An approach that gives
a clear result and presents a digestible logic is the most useful.
The primary output of decision analysis is identifying a policy that maximizes
the expected value of the outcome. Decision analysis provides the most clarity on a
single best alternative, but this method is not very helpful for building intuition. The
dominance plot provides additional information about how different policies compare,
but it does not explain how different uncertainties drove the outcome. Examination of
branches of the decision tree will only uncover some relationships, is time consuming,
and provides obtuse rules for understanding the circumstances that lead a policy to
produce net benefits.
The results of a Monte Carlo analysis clearly present a visual summarization
of the distribution of outcomes, either as a probability distribution, a cumulative
distribution function, or a box plot. The strength of this presentation is that it
quickly and accurately communicates both the policy that maximizes expected net
benefits and the dominance of the policy. By showing the range of outcomes, it
is clear how the alternatives compare to each other on average and over the entire
range of possible futures. Like decision analysis, though, it is difficult to infer which
uncertainties might be most responsible net benefits. And in contrast to decision
CHAPTER 6. CONCLUSIONS 191
analysis, in which the combinations of uncertainty are structured in a tree, it is very
difficult to visually identify these trends in the results of a Monte Carlo analysis.
The best method to develop insight is exploratory modeling and analysis. Indeed
that is the motivation behind the algorithmic tools that make up the approach. This
exploration of the data can identify the boundary conditions that result in net benefits
and dissimilar input sets that result in the same benefits. Using the data science
tools, results from a particular policy can be interrogated to identify the variable or
combination of variables that are associated with a particular outcome and the policy
can be iteratively redesigned to be more robust.
Scenario analysis is on the other end of the insight spectrum, providing informa-
tion only a few specific possible futures with no way of extrapolating the meaning
beyond what has been explicitly calculated. The shallowness of intuition from sce-
nario analysis, however, is not its biggest flaw. Scenario analysis and exploratory
modeling and analysis share a common flaw, that I describe as shifting the burden of
probability to decision makers.
Interagency decision makers are likely to have diverse understanding of proba-
bility, which is not intuitive even for the most proficient mathematician. Scenario
analysis and exploratory modeling and analysis avoided encoding probability in the
model formulation stage, but cannot ignore the probabilistic reality of the world.
The decision not to overcome the challenges of probability in the formulation phase
shifts the task of thinking correctly about probability from the analyst to the decision
maker.
People are not in the habit of thinking a-probabilistically. When faced with three
scenarios, they are likely to either consider all three equally likely or to consider one
most likely and the others as extreme. Fixating on a single outcome may obscure
the big picture. Leaving interpretation of a-probabilistic results to policy makers
reinforces cognitive biases that will be especially counterproductive in the interagency.
Policy makers will naturally be drawn to the scenario that fits their existing world
view and discount the others. Rather than broadening one’s thinking about about the
future, focusing on three specific narratives anchors thinking (Tversky & Kahneman,
1974; Morgan & Keith, 2008). These mistakes in interpretation arise because of

CHAPTER 6. CONCLUSIONS 192
the limitations of the techniques irregardless of whether the scenarios are computer
generated or generated through a creative, participatory process (DeCarolis, 2011).
Exploratory modeling and analysis is subject to these same criticisms. The fre-
quency of results still has no meaning when interpreting the model results. While
in scenario analysis there may be three results to reason about a-probabilistically,
in exploratory modeling and analysis, there are thousands of results. The statistical
techniques used make it easy to draw baseless conclusions. If a decision maker can
continue to remember that frequency is not likelihood, then at best you are looking
at a thousand scenarios and trying to ward off cognitive bias. The results of the
“experiments” are not random observations, a necessary assumption for statistical
analysis.
The defense for scenario analysis and the premise for exploratory modeling and
analysis is that there may not be reliable probabilistic information. While it may
be true that a decision maker does not have a strong, scientific underpinning for
probabilistic information, some belief about likelihood is imbedded in their mental
model. The use of probabilistic information, including subjective probabilities, can at
least integrate the views of experts and allow methodical investigation into the con-
sequences of different beliefs. When interpreting the consequences of certain futures
it is more helpful to test different subjective beliefs about uncertainties to see how
robust conclusions are than to fight the natural frequentist interpretation of numbers
that are not independent, identically distributed random observations from a real
world system.
Responsiveness
For model results to be useful for decision support the model must be easily
modified to accommodate requests of different policymakers and results must be re-
generated quickly. Both scenario analysis and exploratory modeling and analysis are
easy to modify and quick to recalculate. Monte Carlo is also easy to modify, but
calculation time can be quite long if the model is detailed. The insights Monte Carlo
analysis produced are not unique enough to justify the additional computation time
to a decision maker when there is an urgent matter.
CHAPTER 6. CONCLUSIONS 193
Traditionally, decision analysis is more difficult to modify than the other three
approaches because the structure of the decision tree must be reconstructed anytime
there is a change to the time step, the number of decision periods, or the uncertain-
ties included. The tool developed for this research helpfully removes this barrier to
responsiveness. However, unlike the other approaches, the size of the decision anal-
ysis problems grow exponentially with every new uncertainty, time step, or decision
period, so there is an inherent tension between responsiveness and search.
Information
The final important characteristic with which to compare uncertainty analyses is
the treatment of new information. An important part of the foreign policy decision
making process is deciding how much time and resources to devote to finding a more
precise answer including by obtaining new information (George, 2006). Decision
analysis has an added methodological benefit of facilitating the calculation of the value
of information that could be gathered. The probabilistic approaches to uncertainty
analysis, Monte Carlo and decision analysis, can employ Bayesian updating. Bayesian
updating can be used to integrate intelligence or new understanding into the original
analysis and determine whether the policy comparison is changed. In contrast, it is
not clear how new information would affect the results or interpretation of scenario
analysis or exploratory modeling and analysis. The practitioners of those techniques
correctly point out that new information does not always increase certainty, but it
incorrect to conclude that new information is meaningless.
Recommendation
No single approach to uncertainty analysis meets the ideals of encoding, search, inter-
pretation, responsiveness, or new information. However, it is not practical to perform
all methods for every policy problem. Based on the characteristic strengths and weak-
nesses of each approach and the experience with each method, the most appropriate
technique for energy and foreign policy is to pair decision analysis and exploratory
modeling and analysis. This pairing takes advantage of the strength of decision anal-
ysis in clearly presenting the implications of a decision maker’s belief and the value of
new information. If there is a prejudice against decision analysis in energy modeling

CHAPTER 6. CONCLUSIONS 194
because the system models are simple, this work has shown that should not the case
especially when many details of a model do not change the decision.
This combination of approaches exploits the strength of exploratory analysis to
find uncertainty space that leads to good or bad extremes, while overcoming the
dubious challenge of interpreting experiments that are not random observations and,
therefore, cannot be understood probabilistically. Using both approaches does not
significantly increase the analysis time as it makes use of the same energy model.
After the model is built, exploratory modeling should be used to characterize
the combinations of input values that are associated with net benefits. Simultane-
ously, the uncertainties that contribute to the greatest variance in the output can be
identified. These may not be the same uncertainties. After limiting the set of uncer-
tain variables as much as possible, they must be encoded with historical information
where relevant and otherwise with subjective judgment of the decision makers or their
experts.
This conclusion is a recommendation to avoid predictive scenario analysis for de-
cision support at the intersection of energy and foreign policy. This critique is not the
first, but predictive scenario analysis remains the most common form of uncertainty
analysis in energy policy. While scenario analysis avoids encoding uncertainties and
model times can be short, search is unproductive, interpretation is dubious, and there
is no way to integrate new information. Monte Carlo analysis could be suitable if the
model is simple enough that it has few uncertain variables to encode and can compute
quickly.
6.2.3 Practical considerations
After adapting the structure of modeling to suit this policy space, there are several
practical concerns that will determine the effectiveness of the whole endeavor. Model-
based policy analysis as a way to frame a problem and coordinate the expertise of the
interagency must take into consideration where the model lives, who is on the team,
and how the team is presented to the interagency.
CHAPTER 6. CONCLUSIONS 195
A first practical concern, is when to incorporate model-based uncertainty analysis
into decision making. Not all interagency policy matters at the intersection of energy
and foreign policy will be suited to this type of analysis. There must be enough time
to perform the work and tradeoffs to balance. If the matter is urgent and requires
significant action in less than a month, it would be extremely difficult to complete a
full analysis cycle unless a model had been previously built for the same or a similar
purpose. Also, not all energy and foreign policy questions involve complex tradeoffs
between geopolitical, political, economic, financial, and environmental systems. Often
times one attribute of the decision dominates qualitatively, rendering any quantitative
analysis moot.
As a second practical matter, interagency resources should be combined for this
effort to produce a single model. Each agency with their own model, based on their
own assumptions is likely to add to confusion rather than clarify the situation.
Third, it is extremely important to think through which organization will manage
the model construction and the analysis. In forming a modeling team, the objective
should be to prevent the model itself from being captured by the bureaucratic poli-
tics or the organizational mindsets of a particular agency. This may be the biggest
challenge to using energy models effectively in foreign policy. To balance compet-
ing interests, the National Security Council staff is a natural choice to manage the
process. However, given staffing limitations and the unpredictable work load, this is
untenable.
Considering breadth of expertise in energy and geopolitics and existing analyti-
cal strength, the intelligence community is a possibility. The National Intelligence
Council (NIC) is a bridge between the intelligence and policy communities and is a
trusted source of analysis for the interagency. Unfortunately, most of the NICs work
is classified. The culture of secrecy characteristic of the intelligence community is a
serious obstacle. Without an appropriate way to handle access to information and
results, which would in most cases be unclassified, interagency collaboration will not
succeed.
Though many agencies have the analytical expertise, among the Departments of
State, Energy, Defense, and the Treasury, there is no single, best choice. Expertise
CHAPTER 6. CONCLUSIONS 196
will always come at the expense of bias. Concentrating the effort in Defense risks
the further militarization of foreign policy. A team from Energy is likely to lead to
technically dominated solutions to a policy issue. It could be worth considering a
solution that allocates leadership, expertise, and physical location among agencies,
but staffing this could be a challenge. Without a way to build more trust between
agencies, developing and using a modeling competence will not be effective.
Analysts from within the government are the best choice. The pace of research in
institutions outside of the government, for example in universities and national labs,
is not aligned with the short policy making process of most matters of energy and
foreign policy. Analysts from within the government have the benefit of access to
sensitive information and more importantly are in proximity to the decision making
which allows the analysis to be better aligned to the political tone of the policy
decision. An analyst that is aligned with the policy and geopolitical landscape will
know which insights are most salient to bring to the decision maker’s attention.
Though the National Security Council should not conduct the modeling work, it is
important that they commission the effort. They play an important role in setting the
tone for the debate. “Effective problem identification, solution, and implementation
cannot be achieved by dividing task and delegating parts; A framework for intellectual
and analytical interaction among specialized agencies is needed (George, 1980).”
In addition to different values and different information, the agencies also have
interesting interdependencies and imbalances of power that will be evident in the
interagency decision process. Influence within the interagency dialogue is not dis-
tributed evenly. Influence can stem from both the alignment of the policy issue with
the agency’s mission and from relative positions of power that are implied within the
interagency. For example, while Defense has interests in the consequences of poverty
and climate change, neither are its core competence. However, Defense is a power-
ful actor in the interagency and its opinion carries considerable weight. In contrast,
while USAID does not have much intrinsic interagency clout, its core strength in
development and history of working with governments on both energy and climate
is recognized. The informality of the rules of the National Security Council process
mean that personal relationships between the meeting chair and a participant or
CHAPTER 6. CONCLUSIONS 197
among participants can influence how the decision evaluated. Personal affiliations or
a history of cooperation between agencies can allow one perspective undue influence
or encourage strategic behavior that links the outcomes in parallel policy issues.
Participatory analysis is always preferable to separation between analysts and
policy makers. Greater participation allows decision makers to build intuition and
helps the analyst know the most salient priorities and interests. Realistically, more
senior decision makers do not have the time required to participate in the encoding
of uncertainties, information, and preferences, and iterations of presentation of the
results. A possible process is introducing senior decision makers to the analysis early
and providing them the opportunity to raise their primary concerns. A proxy for
the decision maker can be more involved during the model development and analysis
until the appropriate time to reintegrate the senior policy makers. Participation at the
senior working level may be the best balance between deep subject matter expertise
within agencies and the political goals of the Administration.
6.3 Connection to energy security
It may be surprising that thus far in a dissertation on energy and foreign policy that
energy security has not been a focus. In this section, I provide a few thoughts about
energy security when modeling energy and foreign policy questions. Energy security
is multifaceted and is defined and quantified in numerous ways. Energy security
is the availability, affordability, and accessibility of energy. The best definitions of
energy security capture both the economic and the political dimension of the concept
and focus on energy security as a direction of travel and not an end point. Threats
to energy security can be from coercive suppliers, fickle markets, and inadequate
infrastructure. Energy insecurity is a loss of economic value and sovereignty.
The cost of energy security depends on the nature of the threat and the options
for mitigating the threat. The economic value side is straightforward to estimate.
It is the cost of adapting to a physical disruption or market dislocation or the lost
economic value. When the power goes out or a pipeline is shut down or the price of
a fuel rises, one can calculate the foregone economic value or the cost of coping as
CHAPTER 6. CONCLUSIONS 198
in shifting to an alternative energy solution or more expensive supply options. But
with energy security there is a fate worse than not having energy: being vulnerable to
coercion. Energy insecurity can take on a cost beyond its direct economic cost when
it jeopardizes sovereignty or political legitimacy.
Energy security is a subset of energy and security. It is the broader set of energy
and security issues that are at stake in decision making at the intersection of energy
and foreign policy. Energy and security is a larger set of concerns connected to the
central role that energy plays in economic prosperity and geopolitical power. Climate
change for example is an energy issue with significant security implications, only
occasionally is climate change an issue of energy security. In some energy and foreign
policy decisions, energy security stands alone as the motivation for action. In other
cases, energy security is a first order attribute that must be balanced with other
attributes. In still other decisionss, energy security is a second order attribute that
may be incorporated to tip the scale in a decision.
In this dissertation energy security could have been discussed explicitly in terms of
import dependence, supplier relationships, fuel diversity, or the balance of distributed
versus centralized electricity generation. However, energy security was not treated as
a first order objective. There are several underlying assumptions. First, this assumes
that liquid gas markets allow gas importers to increase the share of gas in their fuel mix
without developing an imbalanced relationship with a particular supplier. Security of
gas supply has been particularly acute when the gas is supplied by pipeline from one
supplier. To the extent that natural gas is supplied by LNG, insecurity from supplier
relationships is diminished. Second, while diversification of fuels is important, the
assumption is that the advantage of diversifying among thermal generators is less
than the costs of greenhouse gas emissions. While maintaining coal plants as backup
to hedge against a sudden loss of gas supply would improve energy security, allowing
those plants to run to be profitable would result in damage to the climate. The third
assumption is that indigenous resources are used where possible.
When energy security is on equal footing with other attributes such as the policy
cost, the impact on the environment, and the economic impact, it is helpful to quantify
the cost of energy security. When quantifying energy security so that it can balanced
CHAPTER 6. CONCLUSIONS 199
against other objectives, it is helpful to make distinctions about whose energy security
is at stake.
In the United States self-energy security is mostly conceived of in economic terms.
This is true whether the energy insecurity is a situation where energy is unavailable
because of market conditions or when physical supplies cannot be acquired because
of intentional or accidental damage to infrastructure. The United States has shown
commitment to promote liquid markets and market rules is to maintain geopolitical
independence from suppliers.
When considering others-energy security there is a distinction between countries
to which the U.S. has a political commitment and others. The distinction is important
because these are countries for whom inaction in the face of energy insecurity is not an
option. If the energy security of a foreign nation were threatened, the country could
do without those supplies, shift to another fuel source, or buy fuel from another
supplier possibly at a premium. If the United States has a political commitment to
the country then the cost of restoring physical supply or shouldering excessive cost
can be included in a bottom up analysis of the cost of others-energy security. In
cases where a political crisis might compound on the economic crisis and military
or political intervention is needed, that cost can be incorporated into a bottom up
analysis as well.
For others-energy security, when the U.S. is not necessarily committed to reme-
dying the problem, it is more difficult to quantify the cost to the United States of
their energy security. A low income country may have little utilitarian value to the
United States like a military presence or a strong trade relationship. Such a country’s
energy insecurity may hinder another U.S. interest or lay the ground work for unnec-
essary risk in the future. Unlike in the previous two examples, bottom up analysis is
difficult. Options for quantifying includes aggregating the loss of economic growth in
the country attenuated by trade relationship and the loss of political stability that
might spill over and require military, political intervention. Alternatively, economic
and military aid budgets could serve as a proxy.
This others-energy security is the same as the cost of unmet demand for electricity
used in this analysis. The results show that alternatives can be evaluated with out
CHAPTER 6. CONCLUSIONS 200
validated value preferences. If the monetization is enough to build intuition about
the consequences of policy options, the results have value even when they are not
being interpreted literally.
6.4 Conclusions and future research
6.4.1 Summary of findings
While energy models have been successfully used for domestic policy making in the
United States to support logical reasoning about a complex energy system, these
models are not a common part of energy and foreign policy decisions. This dissertation
began by asking how energy system modeling could be adapted to support policy
making at the intersection of energy and U.S. foreign policy. Decision support must
take into account valuable lessons from political science, behavioral economics, and
cognitive psychology. A holistic understanding of how a decision maker may try and
fail to be rational, reinforces the need for models to enforce a logic.
If energy models are to be more widely used to support decision making, a few
things are needed. There needs to be an explicit articulation of the nature of knowl-
edge conveyed in model results, a philosophy of model interpretation. And models
must also be adapted to better support the interagency decision making process and
the dual nature of an energy and foreign policy problem. The structural decisions
typically made in model development are out of proportion with the policy problem
and the foreign policy making process. Supporting the interagency decision making
process means aligning the model cycle time with the policy making cycle time and
the politics of the process. Both of these have implications for the tradeoff between
model complexity and the sophistication of uncertainty analysis.
A current policy problem facing U.S. foreign policy makers was used as an ex-
emplar for the full modeling cycle from building a system model through analysis.
Two different system models, of differing complexity, but meant to approximate each
other were described. These models were then analyzed with four different approaches
to uncertainty analysis: predictive scenario analysis, Monte Carlo analysis, decision
CHAPTER 6. CONCLUSIONS 201
analysis, and exploratory modeling and analysis. The policy recommendations and
the insights from the analysis from each method were presented.
Each approach to uncertainty analysis has different strengths and weaknesses.
Choosing the best approach for energy and foreign policy means taking into consid-
eration the importance of interpretation and the interagency process. The strengths
and weaknesses of each approach to uncertainty analysis is driven by the representa-
tion of uncertainty. How uncertainty is represented affects the how uncertain variables
are encoded, policy search, interpretability of results, responsiveness, and how new
information is incorporated.
In the context of foreign policy the results of an energy model are not truth,
but an input to judgment. The results are a reflection of the interaction of value
preferences and beliefs about the future. Since results should be taken seriously but
not literally, it is not enough to pass the insight of the analyst to the decision maker.
The decision maker must be able to interpret the results correctly on his own in
order to rewrite existing mental models and build intuition about relationships in the
system. The need for a decision maker to interpret the results limits the usefulness of
some approaches to uncertainty analysis. If the burden of reasoning about probability
is avoided by the analyst during themodel building, then the decision maker is likely
to be mislead by the results during interpretation.
An integration of decision analysis and exploratory modeling analysis was found
to be the best approach to uncertainty analysis. The two approaches can use the same
model. The techniques can be used in concert to narrow the uncertain variables that
must be encoded probabilistically. Used together these methods support breadth and
speed of policy search without a loss of responsiveness and will provide both clear
guidance of the best policy choice as well as the intuition behind the choice.
6.4.2 What is the ultimate application or use of the research?
While the analysis on natural gas was from the perspective of the United States,
it has wider relevance. As the international community shifts their thinking from
“energy access” to energy for development, this analysis on natural gas should affect
CHAPTER 6. CONCLUSIONS 202
their thinking. Many low income countries seek the assistance of the United States,
other donor countries, and international finance institutions when planning and im-
plementing energy projects. As global goals of climate change mitigation and poverty
reduction come into conflict, policymakers will need to provide advice about invest-
ment that will be robust to global market and technological changes and aligned with
both the client country and global goals.
There are implications for private markets as well. Public finance will not be
sufficient to meet the world’s investment needs in energy. Green bonds have taken
off in the last five years as a mechanism to attract private investment to energy and
other projects. While there are voluntary guidelines for what constitutes as “green”
investment eligible for green bond support, there is currently considerable flexibility.
The place for natural gas in the definition of green requires nuance.
Using models to support decision making under uncertainty at the intersection of
energy and foreign policy has promise. The comparison of approaches to uncertainty
analysis suggests modest redesign of current energy models is required along with
some shift in mindset for both the model designers and the consumers of model
results.
6.5 Future research directions
The recommendations on using energy models for foreign policy can only be confirmed
by experimenting. Succeeding in an interagency context may be a big first step. There
may be value in conducting the modeling process first within a single agency though
it would quickly need to move out to avoid organizational capture.
Future work could focus on a deeper treatment of eliciting and representing pref-
erences. The focus here has been limited to the best way to handle the preferences of
the interagency. However, in the U.S. system the President has the authority to dis-
regard advice. This work made no mention of the role of Congress or public opinion
in shaping the conception of the national interest.

CHAPTER 6. CONCLUSIONS 203
The analysis on gas narrowly addressed whether the U.S. should promote natural
gas through its foreign policy. These results must be coupled with an approach to do
a project by project evaluations that consider financial and institutional constraints.
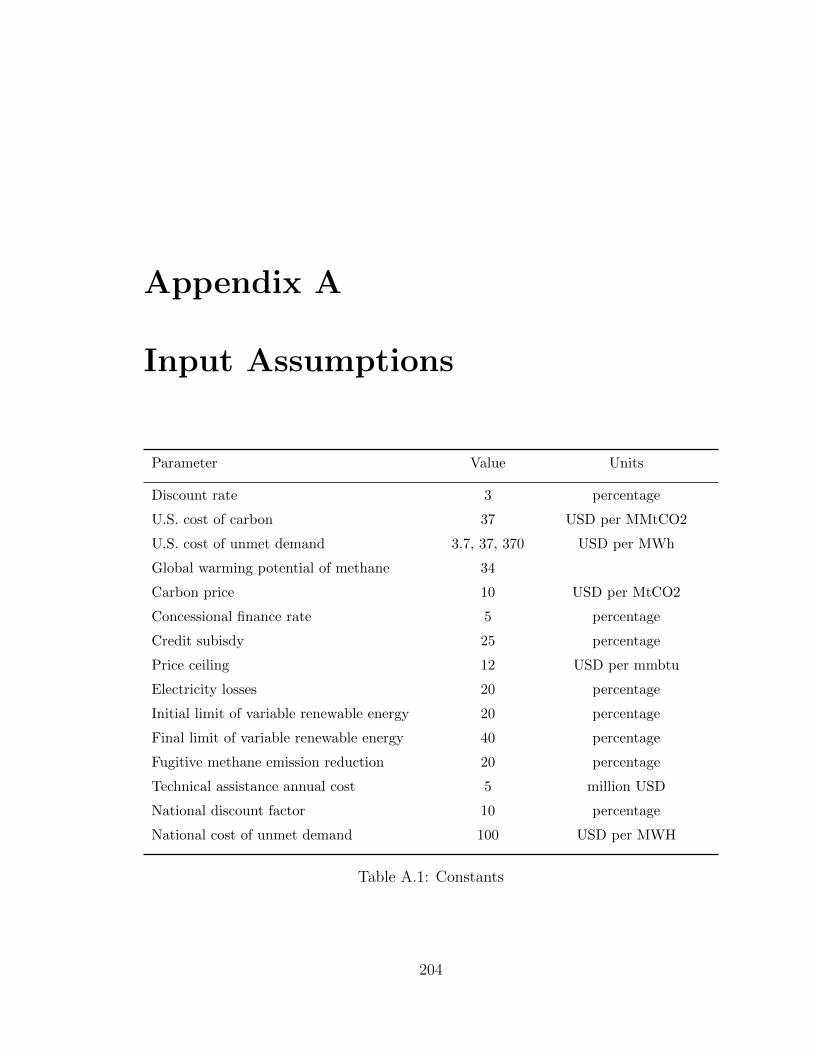
Appendix A
Input Assumptions
Parameter Value Units
Discount rate 3 percentage
U.S. cost of carbon 37 USD per MMtCO2
U.S. cost of unmet demand 3.7, 37, 370 USD per MWh
Global warming potential of methane 34
Carbon price 10 USD per MtCO2
Concessional finance rate 5 percentage
Credit subisdy 25 percentage
Price ceiling 12 USD per mmbtu
Electricity losses 20 percentage
Initial limit of variable renewable energy 20 percentage
Final limit of variable renewable energy 40 percentage
Fugitive methane emission reduction 20 percentage
Technical assistance annual cost 5 million USD
National discount factor 10 percentage
National cost of unmet demand 100 USD per MWH
Table A.1: Constants
204
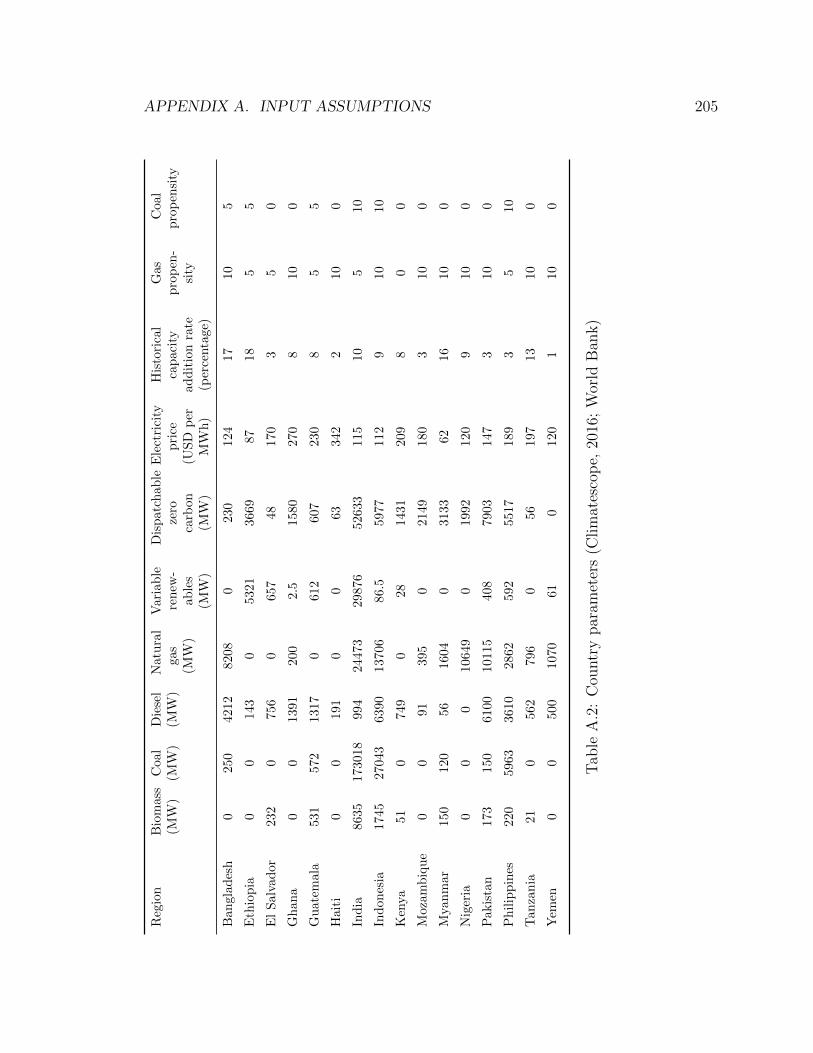
APPENDIX A. INPUT ASSUMPTIONS 205
Reg
ion
Bio
mas
s(M
W)
Coa
l(M
W)
Die
sel
(MW
)N
atu
ral
gas
(MW
)
Vari
ab
lere
new
-ab
les
(MW
)
Dis
patc
hab
leze
roca
rbon
(MW
)
Ele
ctri
city
pri
ce(U
SD
per
MW
h)
His
tori
cal
cap
aci
tyad
dit
ion
rate
(per
centa
ge)
Gas
pro
pen
-si
ty
Coal
pro
pen
sity
Ban
glad
esh
025
042
128208
0230
124
17
10
5
Eth
iop
ia0
014
30
5321
3669
87
18
55
El
Sal
vad
or23
20
756
0657
48
170
35
0
Gh
ana
00
1391
200
2.5
1580
270
810
0
Gu
atem
ala
531
572
1317
0612
607
230
85
5
Hai
ti0
019
10
063
342
210
0
Ind
ia86
3517
3018
994
24473
29876
52633
115
10
510
Ind
ones
ia17
4527
043
6390
13706
86.5
5977
112
910
10
Ken
ya51
074
90
28
1431
209
80
0
Moz
amb
iqu
e0
091
395
02149
180
310
0
Mya
nm
ar15
012
056
1604
03133
62
16
10
0
Nig
eria
00
010649
01992
120
910
0
Pak
ista
n17
315
061
0010115
408
7903
147
310
0
Ph
ilip
pin
es22
059
6336
102862
592
5517
189
35
10
Tan
zan
ia21
056
2796
056
197
13
10
0
Yem
en0
050
01070
61
0120
110
0
Tab
leA
.2:
Cou
ntr
ypar
amet
ers
(Clim
ates
cop
e,20
16;
Wor
ldB
ank)

APPENDIX A. INPUT ASSUMPTIONS 206
Gen
erat
orM
arke
tP
rice
(US
Dp
erm
mb
tu)
Cap
acit
yfa
ctor
(per
centa
ge)
Hea
tra
te(m
mb
tup
erM
Wh
)
Em
issi
on
sin
ten
sity
(MT
CO
2p
erm
mb
tu)
Cap
ital
cost
(mil
lion
US
D)
Fix
edO
M(t
hou
san
dU
SD
per
MW
)
Vari
ab
leO
M(U
SD
per
MW
h)
Lif
etim
e(y
ears
)
Bio
mas
s2
8013.5
0.0
96
1.5
40
3.5
20
Coa
l3
8011.6
0.0
95
1.4
40
3.0
30
Die
sel
1080
11.1
0.0
73
1.2
10
3.5
20
Nat
ura
lG
as6
806.6
0.0
53
1.9
10
3.5
25
Var
iab
lere
new
able
030
00
2.0
20
025
Dis
pat
chab
leze
roca
rbon
050
00
4.0
20
3.0
40
Tab
leA
.3:
Fuel
par
amet
ers
(EIA
AE
O,
2016
)
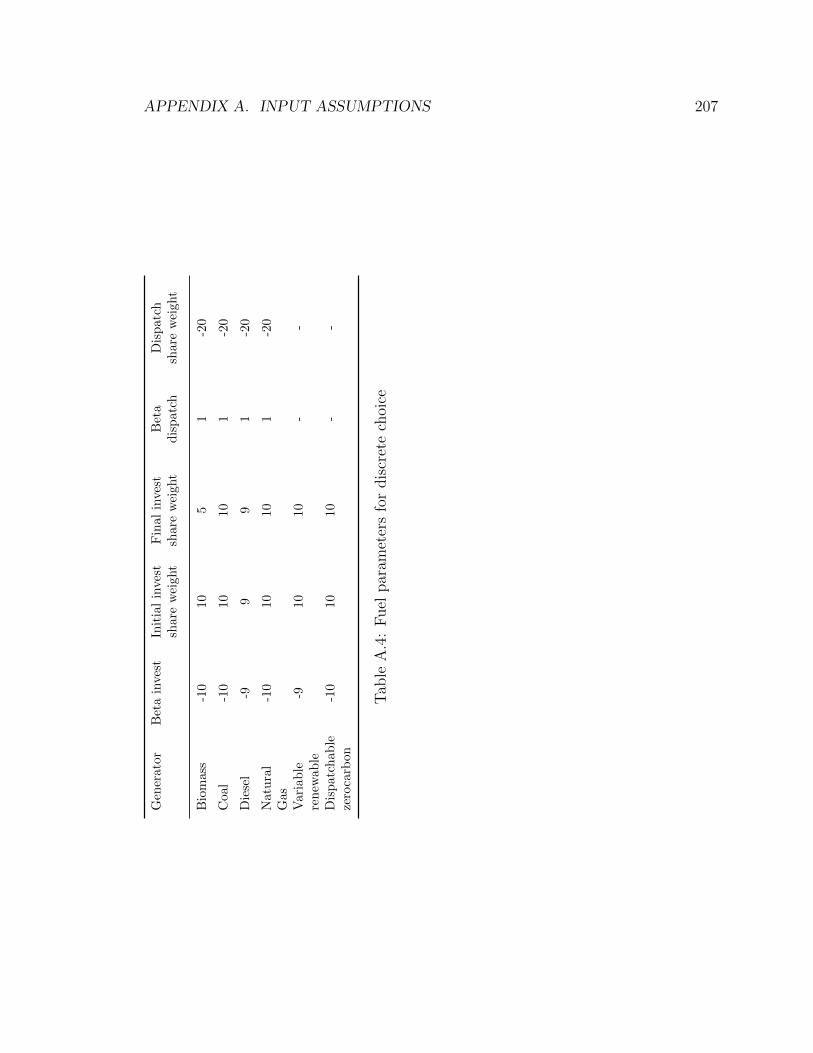
APPENDIX A. INPUT ASSUMPTIONS 207
Gen
erat
orB
eta
inve
stIn
itia
lin
vest
share
wei
ght
Fin
al
inves
tsh
are
wei
ght
Bet
ad
isp
atc
hD
isp
atc
hsh
are
wei
ght
Bio
mas
s-1
010
51
-20
Coa
l-1
010
10
1-2
0
Die
sel
-99
91
-20
Nat
ura
lG
as-1
010
10
1-2
0
Var
iab
lere
new
able
-910
10
--
Dis
pat
chab
leze
roca
rbon
-10
10
10
--
Tab
leA
.4:
Fuel
par
amet
ers
for
dis
cret
ech
oice
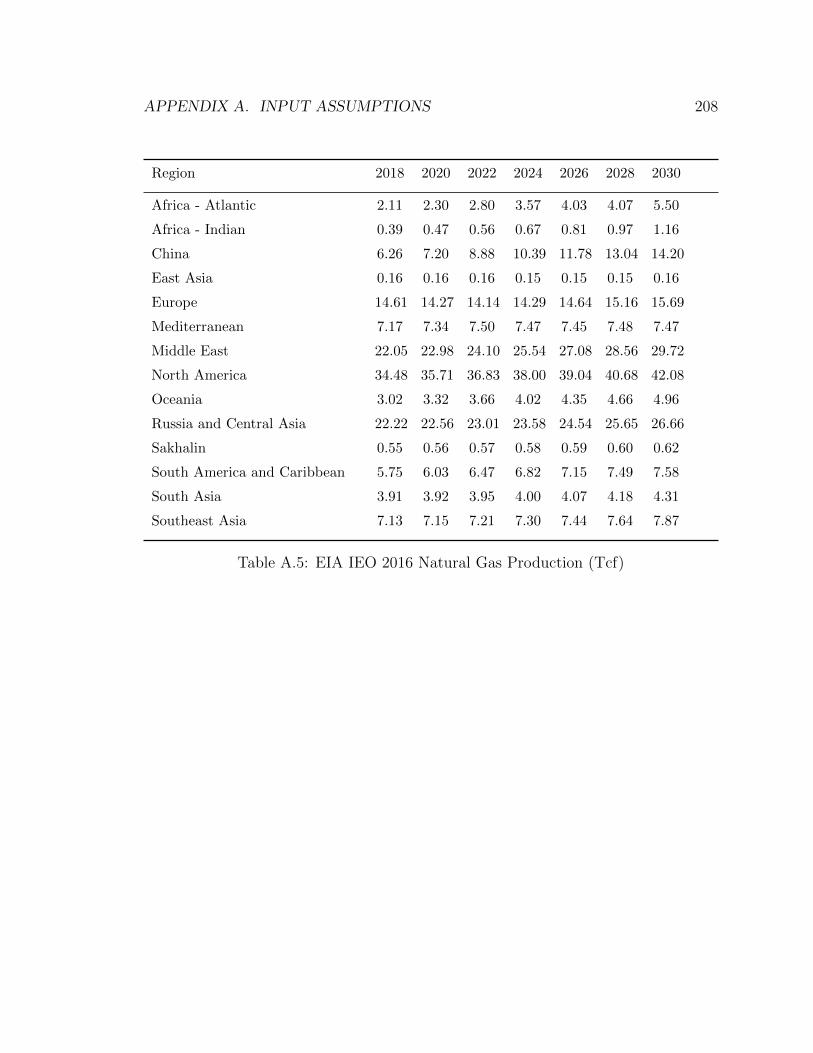
APPENDIX A. INPUT ASSUMPTIONS 208
Region 2018 2020 2022 2024 2026 2028 2030
Africa - Atlantic 2.11 2.30 2.80 3.57 4.03 4.07 5.50
Africa - Indian 0.39 0.47 0.56 0.67 0.81 0.97 1.16
China 6.26 7.20 8.88 10.39 11.78 13.04 14.20
East Asia 0.16 0.16 0.16 0.15 0.15 0.15 0.16
Europe 14.61 14.27 14.14 14.29 14.64 15.16 15.69
Mediterranean 7.17 7.34 7.50 7.47 7.45 7.48 7.47
Middle East 22.05 22.98 24.10 25.54 27.08 28.56 29.72
North America 34.48 35.71 36.83 38.00 39.04 40.68 42.08
Oceania 3.02 3.32 3.66 4.02 4.35 4.66 4.96
Russia and Central Asia 22.22 22.56 23.01 23.58 24.54 25.65 26.66
Sakhalin 0.55 0.56 0.57 0.58 0.59 0.60 0.62
South America and Caribbean 5.75 6.03 6.47 6.82 7.15 7.49 7.58
South Asia 3.91 3.92 3.95 4.00 4.07 4.18 4.31
Southeast Asia 7.13 7.15 7.21 7.30 7.44 7.64 7.87
Table A.5: EIA IEO 2016 Natural Gas Production (Tcf)
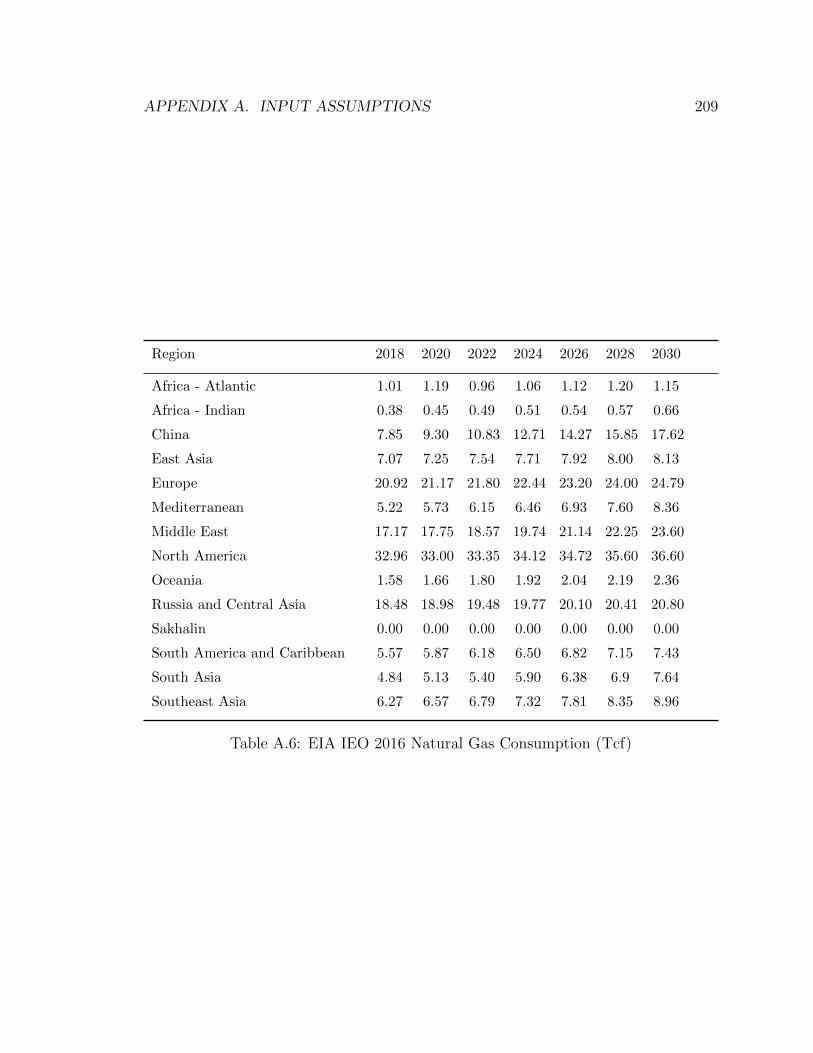
APPENDIX A. INPUT ASSUMPTIONS 209
Region 2018 2020 2022 2024 2026 2028 2030
Africa - Atlantic 1.01 1.19 0.96 1.06 1.12 1.20 1.15
Africa - Indian 0.38 0.45 0.49 0.51 0.54 0.57 0.66
China 7.85 9.30 10.83 12.71 14.27 15.85 17.62
East Asia 7.07 7.25 7.54 7.71 7.92 8.00 8.13
Europe 20.92 21.17 21.80 22.44 23.20 24.00 24.79
Mediterranean 5.22 5.73 6.15 6.46 6.93 7.60 8.36
Middle East 17.17 17.75 18.57 19.74 21.14 22.25 23.60
North America 32.96 33.00 33.35 34.12 34.72 35.60 36.60
Oceania 1.58 1.66 1.80 1.92 2.04 2.19 2.36
Russia and Central Asia 18.48 18.98 19.48 19.77 20.10 20.41 20.80
Sakhalin 0.00 0.00 0.00 0.00 0.00 0.00 0.00
South America and Caribbean 5.57 5.87 6.18 6.50 6.82 7.15 7.43
South Asia 4.84 5.13 5.40 5.90 6.38 6.9 7.64
Southeast Asia 6.27 6.57 6.79 7.32 7.81 8.35 8.96
Table A.6: EIA IEO 2016 Natural Gas Consumption (Tcf)
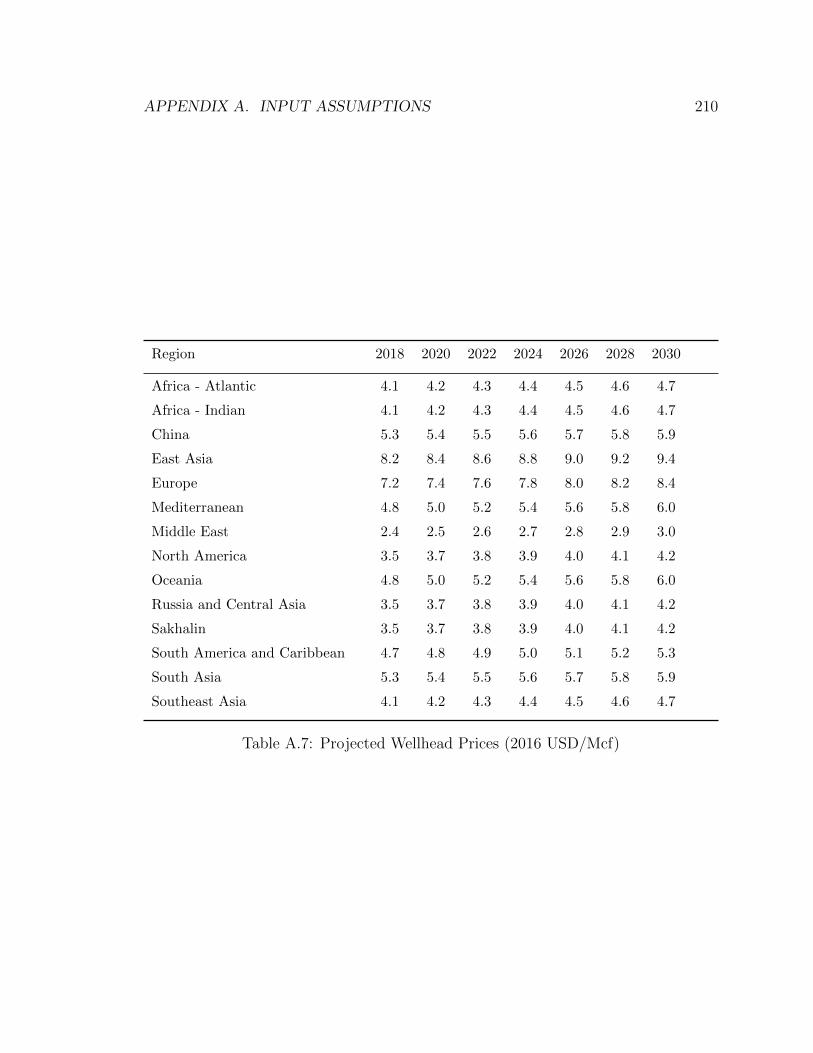
APPENDIX A. INPUT ASSUMPTIONS 210
Region 2018 2020 2022 2024 2026 2028 2030
Africa - Atlantic 4.1 4.2 4.3 4.4 4.5 4.6 4.7
Africa - Indian 4.1 4.2 4.3 4.4 4.5 4.6 4.7
China 5.3 5.4 5.5 5.6 5.7 5.8 5.9
East Asia 8.2 8.4 8.6 8.8 9.0 9.2 9.4
Europe 7.2 7.4 7.6 7.8 8.0 8.2 8.4
Mediterranean 4.8 5.0 5.2 5.4 5.6 5.8 6.0
Middle East 2.4 2.5 2.6 2.7 2.8 2.9 3.0
North America 3.5 3.7 3.8 3.9 4.0 4.1 4.2
Oceania 4.8 5.0 5.2 5.4 5.6 5.8 6.0
Russia and Central Asia 3.5 3.7 3.8 3.9 4.0 4.1 4.2
Sakhalin 3.5 3.7 3.8 3.9 4.0 4.1 4.2
South America and Caribbean 4.7 4.8 4.9 5.0 5.1 5.2 5.3
South Asia 5.3 5.4 5.5 5.6 5.7 5.8 5.9
Southeast Asia 4.1 4.2 4.3 4.4 4.5 4.6 4.7
Table A.7: Projected Wellhead Prices (2016 USD/Mcf)
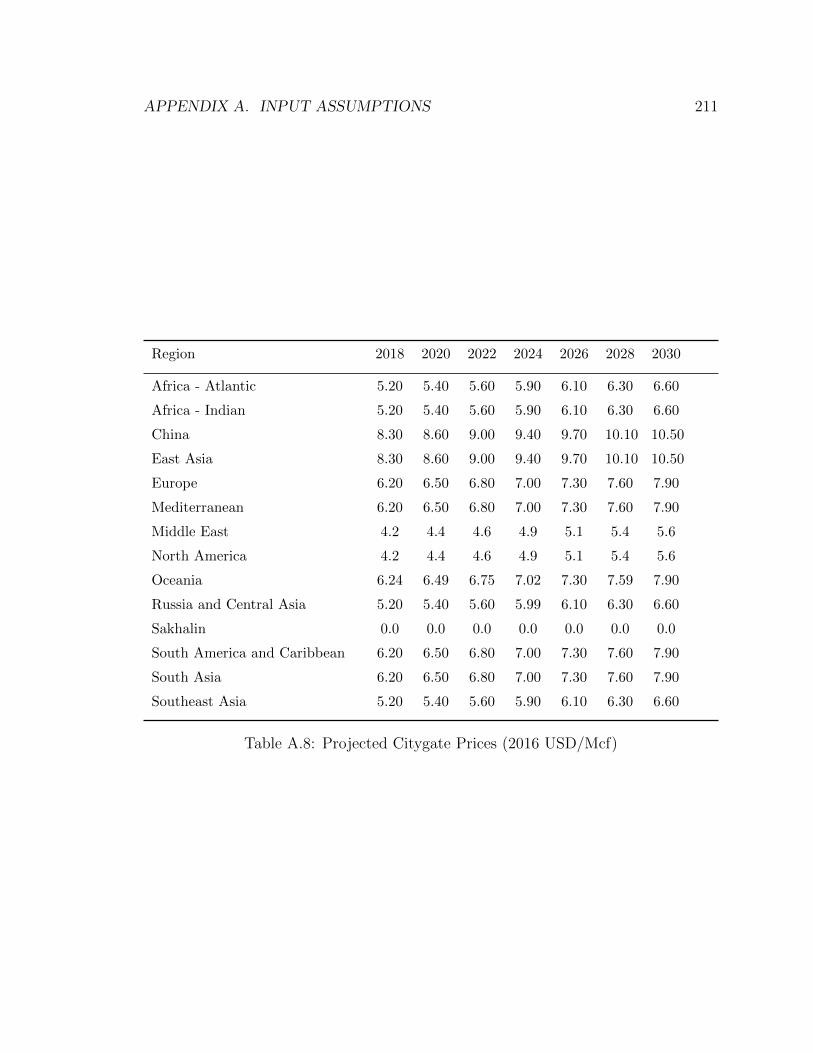
APPENDIX A. INPUT ASSUMPTIONS 211
Region 2018 2020 2022 2024 2026 2028 2030
Africa - Atlantic 5.20 5.40 5.60 5.90 6.10 6.30 6.60
Africa - Indian 5.20 5.40 5.60 5.90 6.10 6.30 6.60
China 8.30 8.60 9.00 9.40 9.70 10.10 10.50
East Asia 8.30 8.60 9.00 9.40 9.70 10.10 10.50
Europe 6.20 6.50 6.80 7.00 7.30 7.60 7.90
Mediterranean 6.20 6.50 6.80 7.00 7.30 7.60 7.90
Middle East 4.2 4.4 4.6 4.9 5.1 5.4 5.6
North America 4.2 4.4 4.6 4.9 5.1 5.4 5.6
Oceania 6.24 6.49 6.75 7.02 7.30 7.59 7.90
Russia and Central Asia 5.20 5.40 5.60 5.99 6.10 6.30 6.60
Sakhalin 0.0 0.0 0.0 0.0 0.0 0.0 0.0
South America and Caribbean 6.20 6.50 6.80 7.00 7.30 7.60 7.90
South Asia 6.20 6.50 6.80 7.00 7.30 7.60 7.90
Southeast Asia 5.20 5.40 5.60 5.90 6.10 6.30 6.60
Table A.8: Projected Citygate Prices (2016 USD/Mcf)
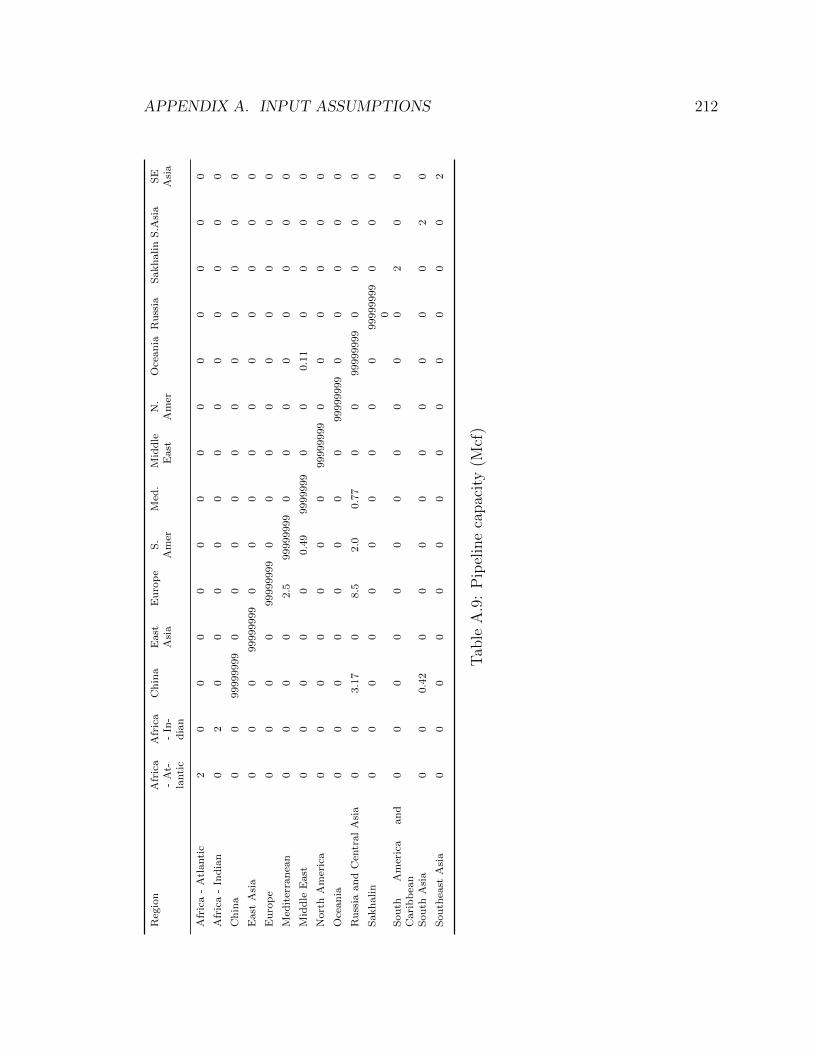
APPENDIX A. INPUT ASSUMPTIONS 212
Reg
ion
Africa
-At-
lantic
Africa
-In-
dian
China
East
Asia
Europe
S.
Amer
Med
.Middle
East
N.
Amer
Oceania
Russia
SakhalinS.A
sia
SE
Asia
Africa-Atlantic
20
00
00
00
00
00
00
Africa-Indian
02
00
00
00
00
00
00
China
00
99999999
00
00
00
00
00
0
East
Asia
00
099999999
00
00
00
00
00
Europe
00
00
99999999
00
00
00
00
0
Med
iterranea
n0
00
02.5
99999999
00
00
00
00
Middle
East
00
00
00.49
9999999
00
0.11
00
00
NorthAmerica
00
00
00
099999999
00
00
00
Oceania
00
00
00
00
99999999
00
00
0
Russia
andCen
tralAsia
00
3.17
08.5
2.0
0.77
00
99999999
00
00
Sakhalin
00
00
00
00
00
99999999
00
00
South
America
and
Caribbea
n0
00
00
00
00
00
20
0
South
Asia
00
0.42
00
00
00
00
02
0
South
east
Asia
00
00
00
00
00
00
02
Tab
leA
.9:
Pip
elin
eca
pac
ity
(Mcf
)
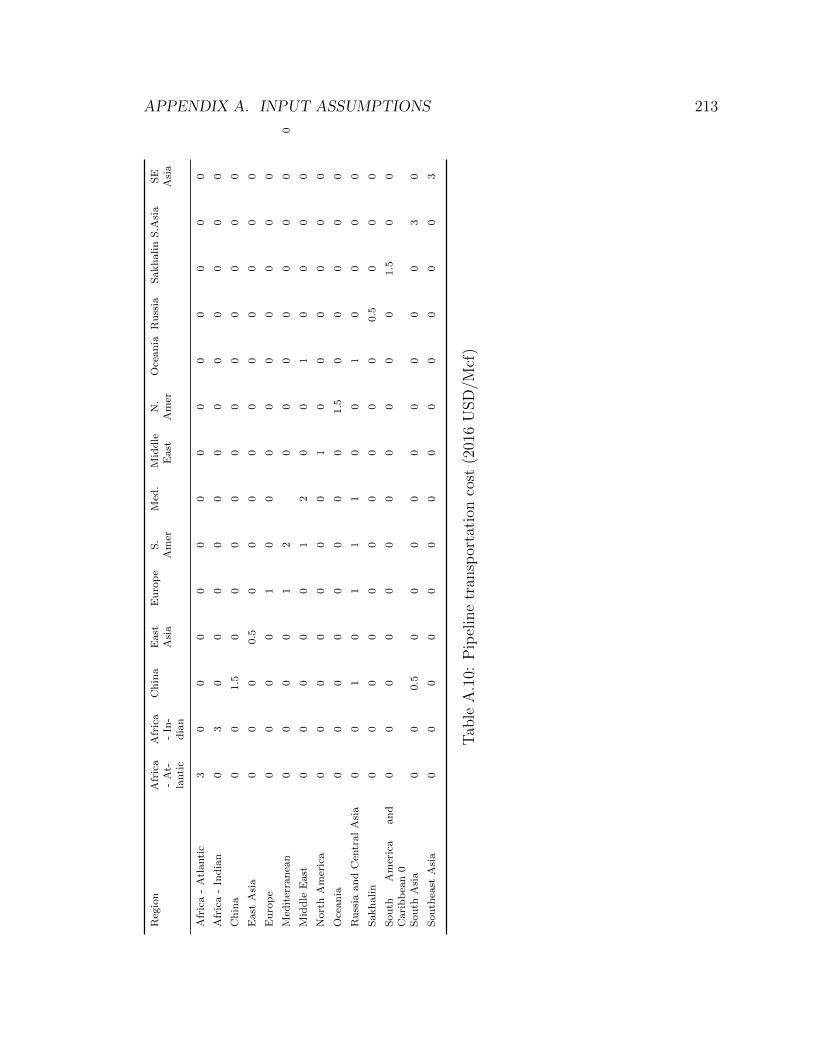
APPENDIX A. INPUT ASSUMPTIONS 213
Reg
ion
Africa
-At-
lantic
Africa
-In-
dian
China
East
Asia
Europe
S.
Amer
Med
.Middle
East
N.
Amer
Oceania
Russia
SakhalinS.A
sia
SE
Asia
Africa-Atlantic
30
00
00
00
00
00
00
Africa-Indian
03
00
00
00
00
00
00
China
00
1.5
00
00
00
00
00
0
East
Asia
00
00.5
00
00
00
00
00
Europe
00
00
10
00
00
00
00
Med
iterranea
n0
00
01
20
00
00
00
0
Middle
East
00
00
01
20
01
00
00
NorthAmerica
00
00
00
01
00
00
00
Oceania
00
00
00
00
1.5
00
00
0
Russia
andCen
tralAsia
00
10
11
10
01
00
00
Sakhalin
00
00
00
00
00
0.5
00
0
South
America
and
Caribbea
n0
00
00
00
00
00
01.5
00
South
Asia
00
0.5
00
00
00
00
03
0
South
east
Asia
00
00
00
00
00
00
03
Tab
leA
.10:
Pip
elin
etr
ansp
orta
tion
cost
(201
6U
SD
/Mcf
)
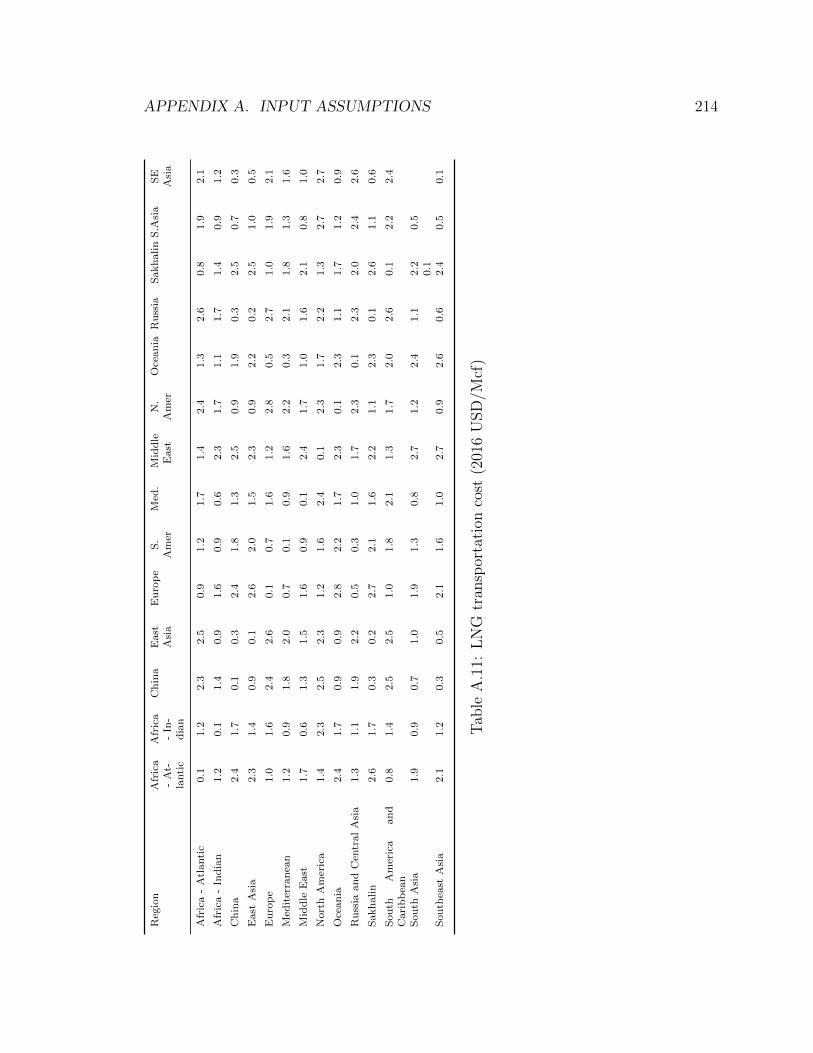
APPENDIX A. INPUT ASSUMPTIONS 214
Reg
ion
Africa
-At-
lantic
Africa
-In-
dian
China
East
Asia
Europe
S.
Amer
Med
.Middle
East
N.
Amer
Oceania
Russia
SakhalinS.A
sia
SE
Asia
Africa-Atlantic
0.1
1.2
2.3
2.5
0.9
1.2
1.7
1.4
2.4
1.3
2.6
0.8
1.9
2.1
Africa-Indian
1.2
0.1
1.4
0.9
1.6
0.9
0.6
2.3
1.7
1.1
1.7
1.4
0.9
1.2
China
2.4
1.7
0.1
0.3
2.4
1.8
1.3
2.5
0.9
1.9
0.3
2.5
0.7
0.3
East
Asia
2.3
1.4
0.9
0.1
2.6
2.0
1.5
2.3
0.9
2.2
0.2
2.5
1.0
0.5
Europe
1.0
1.6
2.4
2.6
0.1
0.7
1.6
1.2
2.8
0.5
2.7
1.0
1.9
2.1
Med
iterranea
n1.2
0.9
1.8
2.0
0.7
0.1
0.9
1.6
2.2
0.3
2.1
1.8
1.3
1.6
Middle
East
1.7
0.6
1.3
1.5
1.6
0.9
0.1
2.4
1.7
1.0
1.6
2.1
0.8
1.0
NorthAmerica
1.4
2.3
2.5
2.3
1.2
1.6
2.4
0.1
2.3
1.7
2.2
1.3
2.7
2.7
Oceania
2.4
1.7
0.9
0.9
2.8
2.2
1.7
2.3
0.1
2.3
1.1
1.7
1.2
0.9
Russia
andCen
tralAsia
1.3
1.1
1.9
2.2
0.5
0.3
1.0
1.7
2.3
0.1
2.3
2.0
2.4
2.6
Sakhalin
2.6
1.7
0.3
0.2
2.7
2.1
1.6
2.2
1.1
2.3
0.1
2.6
1.1
0.6
South
America
and
Caribbea
n0.8
1.4
2.5
2.5
1.0
1.8
2.1
1.3
1.7
2.0
2.6
0.1
2.2
2.4
South
Asia
1.9
0.9
0.7
1.0
1.9
1.3
0.8
2.7
1.2
2.4
1.1
2.2
0.1
0.5
South
east
Asia
2.1
1.2
0.3
0.5
2.1
1.6
1.0
2.7
0.9
2.6
0.6
2.4
0.5
0.1
Tab
leA
.11:
LN
Gtr
ansp
orta
tion
cost
(201
6U
SD
/Mcf
)
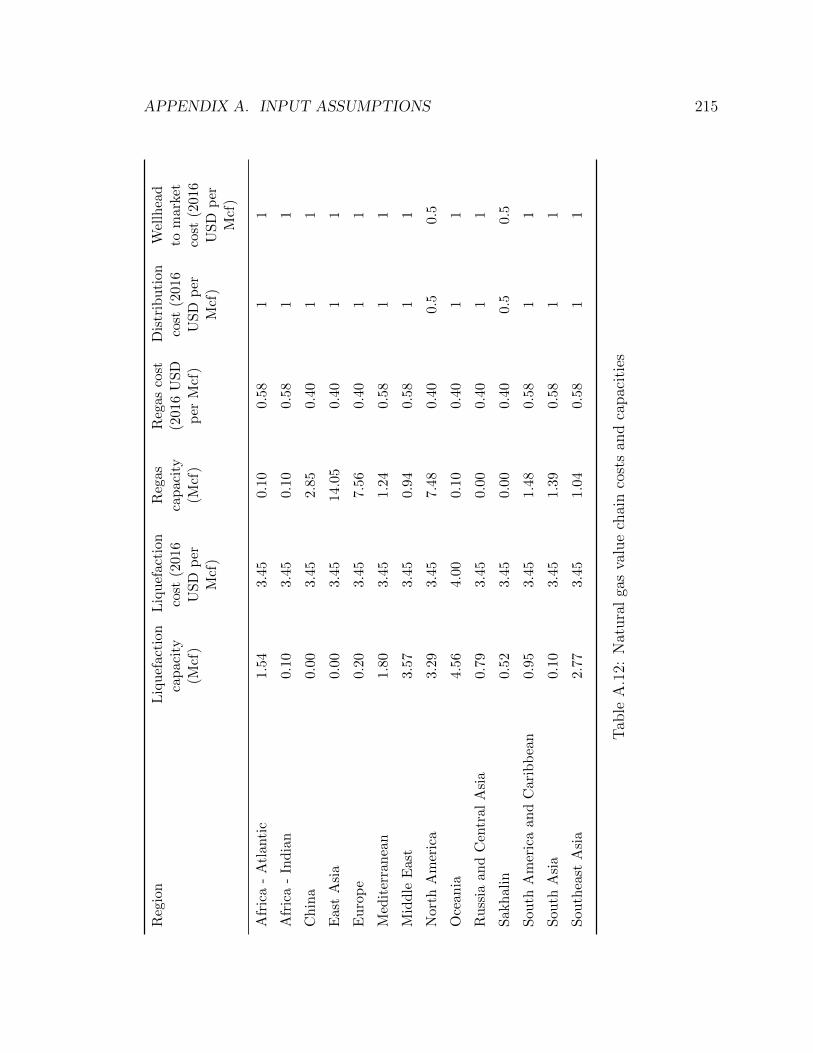
APPENDIX A. INPUT ASSUMPTIONS 215
Reg
ion
Liq
uef
acti
onca
pac
ity
(Mcf
)
Liq
uef
acti
onco
st(2
016
US
Dp
erM
cf)
Reg
asca
pac
ity
(Mcf
)
Reg
asco
st(2
016
US
Dp
erM
cf)
Dis
trib
uti
on
cost
(201
6U
SD
per
Mcf
)
Wel
lhea
dto
mark
etco
st(2
016
US
Dp
erM
cf)
Afr
ica
-A
tlan
tic
1.54
3.45
0.10
0.58
11
Afr
ica
-In
dia
n0.
103.
450.
100.
581
1
Ch
ina
0.00
3.45
2.85
0.40
11
Eas
tA
sia
0.00
3.45
14.0
50.
401
1
Eu
rop
e0.
203.
457.
560.
401
1
Med
iter
ran
ean
1.80
3.45
1.24
0.58
11
Mid
dle
Eas
t3.
573.
450.
940.
581
1
Nor
thA
mer
ica
3.29
3.45
7.48
0.40
0.5
0.5
Oce
ania
4.56
4.00
0.10
0.40
11
Ru
ssia
and
Cen
tral
Asi
a0.
793.
450.
000.
401
1
Sak
hal
in0.
523.
450.
000.
400.
50.5
Sou
thA
mer
ica
and
Car
ibb
ean
0.95
3.45
1.48
0.58
11
Sou
thA
sia
0.10
3.45
1.39
0.58
11
Sou
thea
stA
sia
2.77
3.45
1.04
0.58
11
Tab
leA
.12:
Nat
ura
lga
sva
lue
chai
nco
sts
and
capac
itie
s

APPENDIX A. INPUT ASSUMPTIONS 216
Reg
ion
2018
2020
2022
2024
2026
2028
2030
Afr
ica
-A
tlan
tic
0.27
0.29
0.31
0.33
0.35
0.3
70.3
9
Afr
ica
-In
dia
n0.
270.
290.
310.
330.
350.3
70.3
9
Ch
ina
Eas
tA
sia
0.10
0.10
0.10
0.10
0.10
0.1
00.1
0
Eu
rop
e0.
100.
100.
100.
100.
100.1
00.1
0
Med
iter
ran
ean
0.27
0.29
0.31
0.33
0.35
0.3
70.3
9
Mid
dle
Eas
t0.
270.
290.
310.
330.
350.3
70.3
9
Nor
thA
mer
ica
0.33
0.36
0.39
0.42
0.45
0.4
80.5
1
Oce
ania
0.27
0.29
0.31
0.33
0.35
0.3
70.3
9
Ru
ssia
and
Cen
tral
Asi
a0.
270.
290.
310.
330.
350.3
70.3
9
Sak
hal
in0.
270.
290.
310.
330.
350.3
70.3
9
Sou
thA
mer
ica
and
Car
ibb
ean
0.27
0.29
0.31
0.33
0.35
0.3
70.3
9
Sou
thA
sia
0.27
0.29
0.31
0.33
0.35
0.3
70.3
9
Sou
thea
stA
sia
0.27
0.29
0.31
0.33
0.35
0.3
70.3
9
Tab
leA
.13:
Ela
stic
ity
ofSupply
(201
6U
SD
/Mcf
)
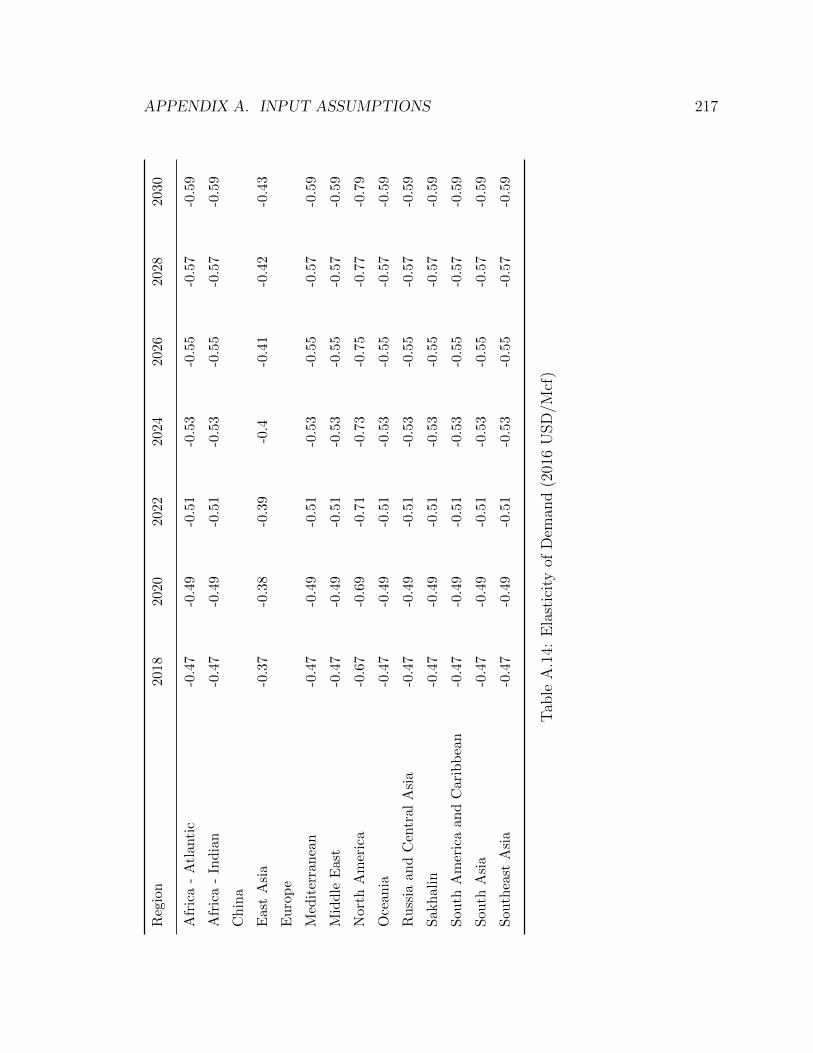
APPENDIX A. INPUT ASSUMPTIONS 217
Reg
ion
2018
2020
2022
2024
2026
2028
2030
Afr
ica
-A
tlan
tic
-0.4
7-0
.49
-0.5
1-0
.53
-0.5
5-0
.57
-0.5
9
Afr
ica
-In
dia
n-0
.47
-0.4
9-0
.51
-0.5
3-0
.55
-0.5
7-0
.59
Ch
ina
Eas
tA
sia
-0.3
7-0
.38
-0.3
9-0
.4-0
.41
-0.4
2-0
.43
Eu
rop
e
Med
iter
ran
ean
-0.4
7-0
.49
-0.5
1-0
.53
-0.5
5-0
.57
-0.5
9
Mid
dle
Eas
t-0
.47
-0.4
9-0
.51
-0.5
3-0
.55
-0.5
7-0
.59
Nor
thA
mer
ica
-0.6
7-0
.69
-0.7
1-0
.73
-0.7
5-0
.77
-0.7
9
Oce
ania
-0.4
7-0
.49
-0.5
1-0
.53
-0.5
5-0
.57
-0.5
9
Ru
ssia
and
Cen
tral
Asi
a-0
.47
-0.4
9-0
.51
-0.5
3-0
.55
-0.5
7-0
.59
Sak
hal
in-0
.47
-0.4
9-0
.51
-0.5
3-0
.55
-0.5
7-0
.59
Sou
thA
mer
ica
and
Car
ibb
ean
-0.4
7-0
.49
-0.5
1-0
.53
-0.5
5-0
.57
-0.5
9
Sou
thA
sia
-0.4
7-0
.49
-0.5
1-0
.53
-0.5
5-0
.57
-0.5
9
Sou
thea
stA
sia
-0.4
7-0
.49
-0.5
1-0
.53
-0.5
5-0
.57
-0.5
9
Tab
leA
.14:
Ela
stic
ity
ofD
eman
d(2
016
USD
/Mcf
)
Appendix B
INTrO Documentation
$Title International Gas Market
$Ontext
Lauren Culver
August 2017
Adapted from NERA Consulting Global Natural Gas Model
and from the Stanford Energy Modeling Forum
$Offtext
Sets
t time steps
r regions
f futures scenarios
z uncertain variables
alias (r, rr)
Parameters
218

APPENDIX B. INTRO DOCUMENTATION 219
pr(r,t) Natural Gas Production (Tcf)
cons(r,t) Natural Gas Consumption (Tcf)
wp(r,t) Projected Wellhead Prices (2016 USD per Mcf)
cp(r,t) Projected City Gate Prices (2016 USD per Mcf)
es(r,t) Regional Supply Elasticity
ed(r,t) Regional Demand Elasticity
rc(r,t) Regasification Costs(2016 USD per Mcf)
lc(r,t) Liquefaction Costs (2016 USD per Mcf)
dc(r,t) Transportation cost from Regasification to City Gate
(2016 USD per Mcf)
wtm(r,t) Transportation cost from Wellhead to Liquefaction
(2016 USD per Mcf)
pc(r,rr) Transportation cost via Pipelines through Regional
Pipelines (USD per Mcf)
sc(r,rr) Shipping Costs (2016 USD per Mcf)
pcap(r,rr) Pipeline Capacity Initial (Mcf)
lcap(r) Liquefaction Capacity Initial (Mcf)
rcap(r) Regasification Capacity Initial (Mcf)
mult(f,z) Scenario Multipliers;
Scalar
i discount rate;
* Scenarios
* growth, abundance, clean
$if not set gdxincname $abort ’no include file name for data
file provided’
$gdxin %gdxincname%
$load r t f z pr cons wp cp es ed pc sc rc lc dc wtm pcap lcap
rcap mult
APPENDIX B. INTRO DOCUMENTATION 220
$gdxin
Sets
zdr(r) zero demand regions /Sakhalin/
zt ignore 2016 /2016/
Parameters
supa(r,t) supply constant a
supb(r,t) supply constant b
dema(r,t) demand constant a
demb(r,t) demand constant b
lcapt liquefaction capacity at t
rcapt regasification capacity at t
pcapt pipeline capacity at t
sgrowth(r,t) supply growth
dgrowth(r,t) demand growth
pct pipeline cost at t
sct shipping cost at t
pr_change scenario parameter for production
cons_change scenario parameter for consumption
rc_change scenario parameter for regasification cost
sc_change scenario parameter for shipping cost
store0 original value for shipping cost
store1a original value for NorthAmerica production
store1b original value for China production
store2 original value for FSRU price
store3a original value for China demand
store3b original value for South Asia demand
store3c original value for Middle Eastx demand;
supb(r,t) = 1/es(r,t) + 1;
APPENDIX B. INTRO DOCUMENTATION 221
supa(r,t) = wp(r,t)/supb(r,t)/ pr(r,t)**(supb(r,t)-1);
demb(r,t) = 1/ed(r,t) + 1;
dema(r,t)$(cons(r,t) NE 0) = cp(r,t)/demb(r,t)/cons(r,t)**(demb(r,t)-1);
sgrowth(r,t) = pr(r,t)/pr(r,’2016’);
dgrowth(r,t)$(cons(r,’2016’) ne 0) = cons(r,t)/cons(r,’2016’);
lcapt(r,t) = lcap(r)* 5 * sgrowth(r,t);
rcapt(r,t) = rcap(r)* 5 * dgrowth(r,t);
pcapt(r,rr,t) = pcap(r,rr);
dc(r,t) = dc(r,’2016’);
wtm(r,t) = wtm(r,’2016’);
pct(r,rr,t) = pc(r,rr);
pr_change = 1;
rc_change = 1;
cons_change = 1;
sc_change = 1;
store0(r,rr) = sc(r,rr);
store1a(’NorthAmerica’,t) = pr(’NorthAmerica’,t);
store1b(’China’,t) = pr(’China’,t);
store2(r,t) = rc(r,t);
store3a(’China’,t)= cons(’China’,t);
store3b(’SouthAsia’,t)= cons(’SouthAsia’,t);
store3c(’MiddleEast’,t)= cons(’MiddleEast’,t);
pr(’NorthAmerica’,t)$(not zt(t)) = pr_change*pr(’NorthAmerica’,t);
pr(’China’,t)$(not zt(t)) = pr_change*pr(’China’,t);
cons(’China’,t)$(not zt(t)) = cons_change*pr(’China’,t);
cons(’SouthAsia’,t)$(not zt(t)) = cons_change*pr(’SouthAsia’,t);

APPENDIX B. INTRO DOCUMENTATION 222
cons(’MiddleEast’,t)$(not zt(t)) = cons_change*pr(’MiddleEast’,t);
rc(r,t) = rc_change*rc(r,t);
sct(r,rr,t) = sc_change * sc(r,rr);
Variables
S(r,t) regional supply (tcf)
D(r,t) regional demand (tcf)
PG(r,rr,t) pipeline gas from S to D (tcf)
LNG(r,rr,t) LNG transported from S to D (tcf)
benefit consumer and producer surplus minus transportation costs;
Positive Variables S, D, PG, LNG;
Equations
sb(r,t) Supply
db(r,t) Demand
lcapacity(r,t) Liquefaction capacity
rcapacity(r,t) Regasification capacity
pcapacity(r,rr,t) Pipeline capacity
obj Objective function in million dollars;
sb(r,t).. S(r,t) =G= Sum(rr, PG(r,rr,t)+ LNG(r,rr,t));
db(rr,t).. D(rr,t) =L= Sum(r, PG(r,rr,t)+ LNG(r,rr,t));
lcapacity(r,t).. Sum(rr, LNG(r,rr,t)) =l= lcapt(r,t);
rcapacity(rr,t).. Sum(r, LNG(r,rr,t)) =l= rcapt(rr,t);
pcapacity(r,rr,t).. PG(r,rr,t) =l= pcapt(r,rr,t);

APPENDIX B. INTRO DOCUMENTATION 223
obj.. benefit =e= Sum(t, [1/(1+i)**(ord(t)*5)] * {
Sum( r, dema(r,t)*D(r,t)**demb(r,t) )
- Sum( r, supa(r,t)*S(r,t)**supb(r,t) )
- Sum( (r,rr), wtm(r,t) * LNG(r,rr,t) )
- Sum( (r,rr), lc(r,t) * LNG(r,rr,t) )
- Sum( (r,rr), sct(r,rr,t) * LNG(r,rr,t) )
- Sum( (r,rr), rc(rr,t) * LNG(r,rr,t) )
- Sum( (r,rr), dc(rr,t)* LNG(r,rr,t) )
- Sum( (r,rr), wtm(r,t) * PG(r,rr,t) )
- Sum( (r,rr), pct(r,rr,t) * PG(r,rr,t) )
- Sum( (r,rr), dc(rr,t)* PG(r,rr,t) )
}) /10e3;
d.lo(r,t)$(not zdr(r)) = 0.000001;
Model gngm global natural gas market / sb, db, lcapacity,
rcapacity, pcapacity, obj/ ;
* reporting parameters
Parameters
cprice(r,t) consumer price
wprice(r,t) producer price
importerprice(f,r,t) importer price
exporterprice(f,r,t) exporter price
consumption(f,r,t) consumption
production(f,r,t) production
lngas(f,r,rr,t) lng
pipegas(f,r,rr,t) pipegas;
loop(f,
pr(’NorthAmerica’,t) = store1a(’NorthAmerica’,t);
APPENDIX B. INTRO DOCUMENTATION 224
pr(’China’,t) = store1b(’China’,t);
rc(r,t) = store2(r,t);
cons(’China’,t) = store3a(’China’,t);
cons(’SouthAsia’,t) = store3b(’SouthAsia’,t);
cons(’MiddleEast’,t) = store3c(’MiddleEast’,t);
sc(r,rr) =store0(r,rr);
sc_change = mult(f,’z0’);
pr_change = mult(f,’z1’);
rc_change = mult(f,’z2’);
cons_change = mult(f,’z3’);
pr(’NorthAmerica’,t)$(not zt(t)) = pr_change*pr(’NorthAmerica’,t);
pr(’China’,t)$(not zt(t)) = pr_change*pr(’China’,t);
cons(’China’,t)$(not zt(t)) = cons_change*pr(’China’,t);
cons(’SouthAsia’,t)$(not zt(t)) = cons_change*pr(’SouthAsia’,t);
cons(’MiddleEast’,t)$(not zt(t)) = cons_change*pr(’MiddleEast’,t);
supb(r,t) = 1/es(r,t) + 1;
supa(r,t) = wp(r,t)/supb(r,t)/ pr(r,t)**(supb(r,t)-1);
demb(r,t) = 1/ed(r,t) + 1;
dema(r,t)$(cons(r,t) NE 0) = cp(r,t)/demb(r,t)/cons(r,t)**(demb(r,t)-1);
i = 0.05;
sgrowth(r,t) = pr(r,t)/pr(r,’2016’);
dgrowth(r,t)$(cons(r,’2016’) ne 0) = cons(r,t)/cons(r,’2016’);
lcapt(r,t) = lcap(r)* 3 * sgrowth(r,t);
rcapt(r,t) = rcap(r)* 3 * dgrowth(r,t);
dc(r,t) = dc(r,’2016’);
wtm(r,t) = wtm(r,’2016’);
pct(r,rr,t) = pc(r,rr);
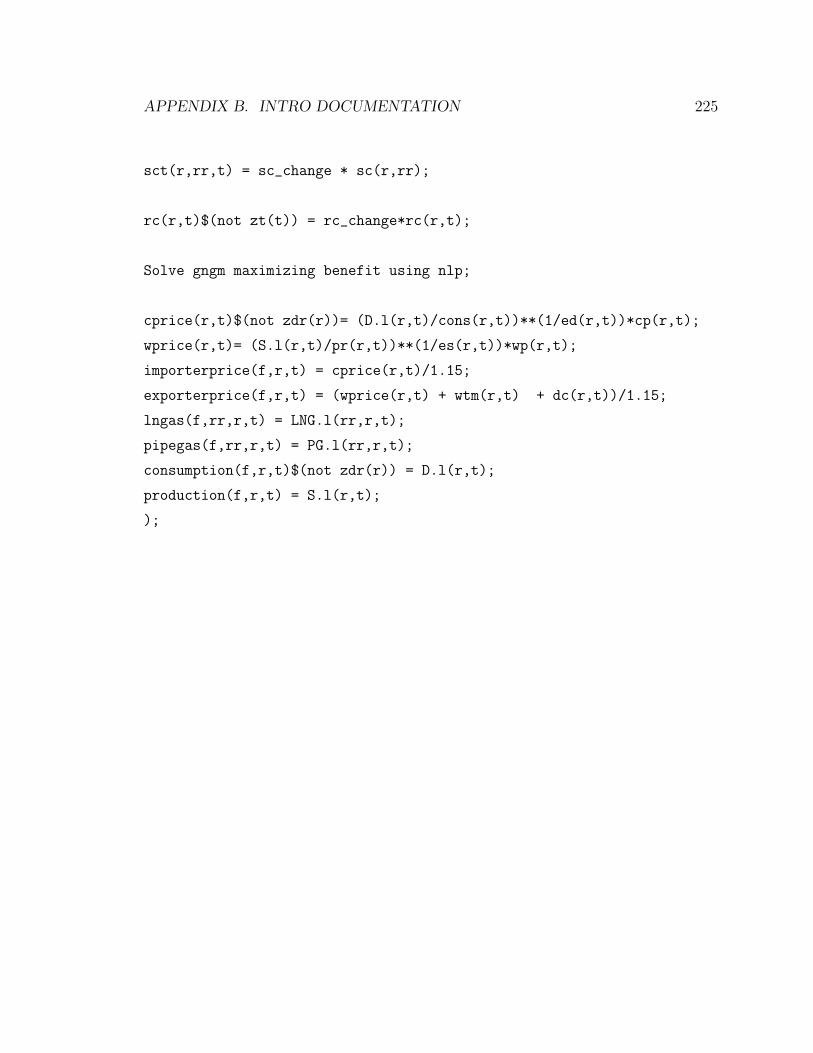
APPENDIX B. INTRO DOCUMENTATION 225
sct(r,rr,t) = sc_change * sc(r,rr);
rc(r,t)$(not zt(t)) = rc_change*rc(r,t);
Solve gngm maximizing benefit using nlp;
cprice(r,t)$(not zdr(r))= (D.l(r,t)/cons(r,t))**(1/ed(r,t))*cp(r,t);
wprice(r,t)= (S.l(r,t)/pr(r,t))**(1/es(r,t))*wp(r,t);
importerprice(f,r,t) = cprice(r,t)/1.15;
exporterprice(f,r,t) = (wprice(r,t) + wtm(r,t) + dc(r,t))/1.15;
lngas(f,rr,r,t) = LNG.l(rr,r,t);
pipegas(f,rr,r,t) = PG.l(rr,r,t);
consumption(f,r,t)$(not zdr(r)) = D.l(r,t);
production(f,r,t) = S.l(r,t);
);

Appendix C
NEO Documentation
$Title National Electricity Optimization
$Ontext
Lauren Culver
Stanford University
Last Updated August 2017
This is an investment planning model for a generic national power sector
to determine the least cost expansion plan. The decision variables are
investment in capacity, dispatching generation, and investing to expand
electrification. Four policies are run. 10 variables are
altered by a monte carlo or scenario analysis.
Model adapted from Turvey, R, and Anderson, D 1977.
$Offtext
Set
time time periods / 2016*2030 /
226

APPENDIX C. NEO DOCUMENTATION 227
te(time) extended time horizon
t(te) time periods excluding base year
f future scenarios
z zees
g plant types
gv(g) thermal units - with vintage
sc scalr indices
ld load indices
b load blocks / peak, high, medium, low /
p policy indices / p0*p4 /
pn policy names / renewable, carbonprice,
ceiling, concessional,
fugitive, nothing /
alias (t,v),(b,bp);
Parameter
fl(g,te) fuel price
pr(f,te) fuel price from igm for gas only
scalrs(sc) scalrs
initcap(g) initial capacity of a country
load(b,ld) load
nmult(f,z) scenario multipliers;
$if not set gdxincname $abort ’no include file name for data file’
$gdxin %gdxincname%
$load te t g gv fl f z nmult pr sc scalrs initcap ld load
$gdxin
$Stitle data:
Set labels for plant data

APPENDIX C. NEO DOCUMENTATION 228
/ initcap initial capacities (MW)
avail operational availability (percentage)
opcost operating costs (USD per MW -yr)
capcost capital costs (million USD per MW)
capcost-g annual rate of decrease in capital costs (percentage)
life life of units (years)
maxcap maximum capacity - on total new capacity (MW)
rho cost of captial (percentage)
hr heat rate (mmbtu per MWh)
ec emissions intensity (MtCO2 per mmbtu)
ful fuel cost (USD per mmbtu)
varop variable operating cost (USD per MWh) /
Table gdata(g,labels) data for generators
initcap avail opcost capcost capcost-g life maxcap rho hr ec ful varop
biomass 0 .8 .04 1.5 -.01 20 10000 .13 13.5 0.096 0 3.5
coal 0 .8 .04 1.4 -.01 30 +inf .13 11.6 0.095 0 3
diesel 0 .8 .01 1.2 -.01 20 +inf .13 11.1 0.073 0 3.5
gas 0 .8 .01 1 -.01 25 +inf .13 6.6 0.053 0 3.5
vre 0 .3 .02 2 -.05 25 +inf .13 0 0 0 0
dzc 0 .5 .02 4 -.01 40 100000 .13 0 0 0 3
Table policy(pn,p) policy flags
p0 p1 p2 p3 p4
renewable 1 0 0 0 0
carbonprice 0 0 0 0 1
ceiling 0 1 0 0 0
concessional 0 0 1 0 0
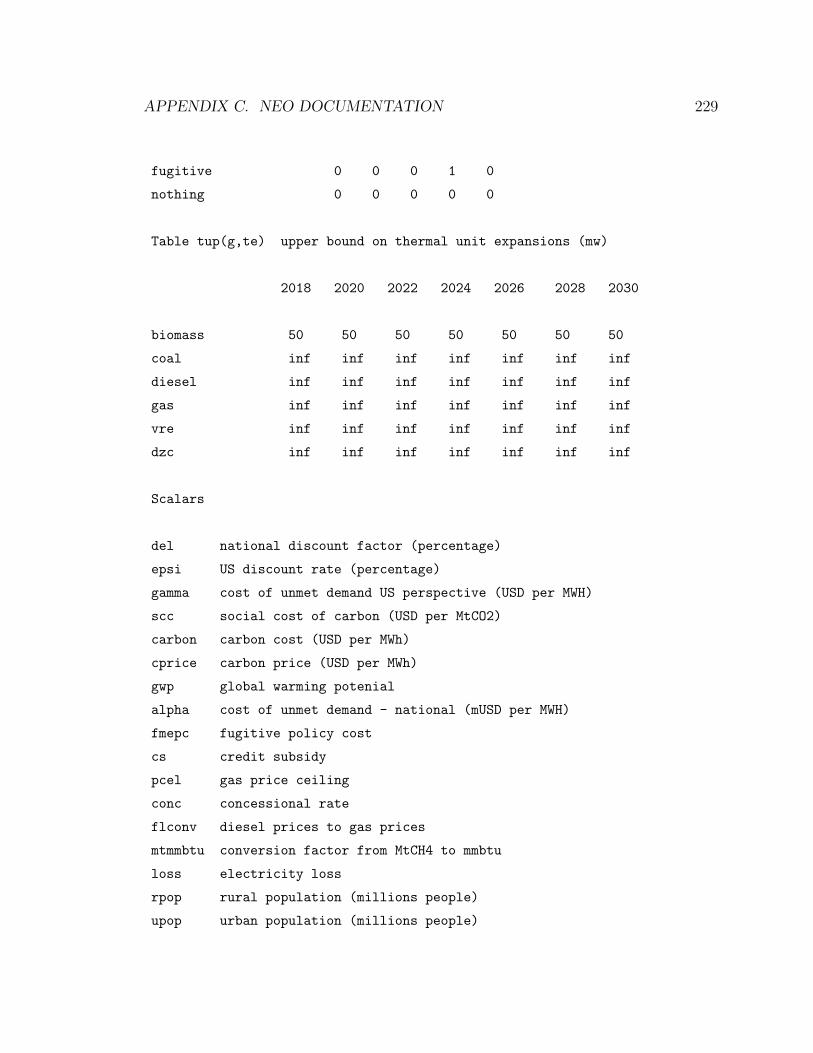
APPENDIX C. NEO DOCUMENTATION 229
fugitive 0 0 0 1 0
nothing 0 0 0 0 0
Table tup(g,te) upper bound on thermal unit expansions (mw)
2018 2020 2022 2024 2026 2028 2030
biomass 50 50 50 50 50 50 50
coal inf inf inf inf inf inf inf
diesel inf inf inf inf inf inf inf
gas inf inf inf inf inf inf inf
vre inf inf inf inf inf inf inf
dzc inf inf inf inf inf inf inf
Scalars
del national discount factor (percentage)
epsi US discount rate (percentage)
gamma cost of unmet demand US perspective (USD per MWH)
scc social cost of carbon (USD per MtCO2)
carbon carbon cost (USD per MWh)
cprice carbon price (USD per MWh)
gwp global warming potenial
alpha cost of unmet demand - national (mUSD per MWH)
fmepc fugitive policy cost
cs credit subsidy
pcel gas price ceiling
conc concessional rate
flconv diesel prices to gas prices
mtmmbtu conversion factor from MtCH4 to mmbtu
loss electricity loss
rpop rural population (millions people)
upop urban population (millions people)
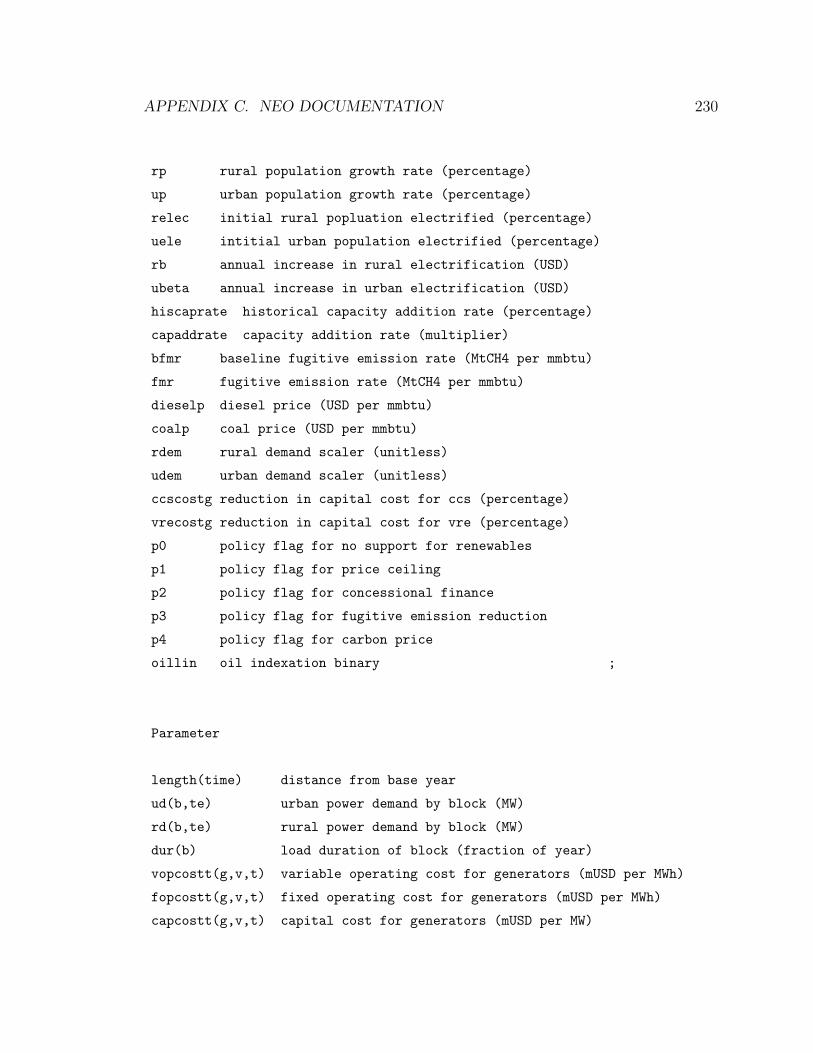
APPENDIX C. NEO DOCUMENTATION 230
rp rural population growth rate (percentage)
up urban population growth rate (percentage)
relec initial rural popluation electrified (percentage)
uele intitial urban population electrified (percentage)
rb annual increase in rural electrification (USD)
ubeta annual increase in urban electrification (USD)
hiscaprate historical capacity addition rate (percentage)
capaddrate capacity addition rate (multiplier)
bfmr baseline fugitive emission rate (MtCH4 per mmbtu)
fmr fugitive emission rate (MtCH4 per mmbtu)
dieselp diesel price (USD per mmbtu)
coalp coal price (USD per mmbtu)
rdem rural demand scaler (unitless)
udem urban demand scaler (unitless)
ccscostg reduction in capital cost for ccs (percentage)
vrecostg reduction in capital cost for vre (percentage)
p0 policy flag for no support for renewables
p1 policy flag for price ceiling
p2 policy flag for concessional finance
p3 policy flag for fugitive emission reduction
p4 policy flag for carbon price
oillin oil indexation binary ;
Parameter
length(time) distance from base year
ud(b,te) urban power demand by block (MW)
rd(b,te) rural power demand by block (MW)
dur(b) load duration of block (fraction of year)
vopcostt(g,v,t) variable operating cost for generators (mUSD per MWh)
fopcostt(g,v,t) fixed operating cost for generators (mUSD per MWh)
capcostt(g,v,t) capital cost for generators (mUSD per MW)

APPENDIX C. NEO DOCUMENTATION 231
sigma(g) capital recovery factor
delta(t) national discount factor
epsilon(t) US discount factor
capacitylimit(t) maximum capacity built each year (MW)
bs(b,b) load order matrix
vs(t,v) vintage time matrix
kit(g,v) initial capacity for thermal units (MW)
store1 initial cost of capital for gas (percentage)
effectiveprice effective price of gas to US
uz(t) urban electrification rate (percentage)
rz(t) rural electrification rate (percentage);
* store the original values
store1("gas","rho") = gdata("gas","rho");
store1("vre","rho") = gdata("vre","rho");
* policy overwrites
gdata("vre","rho") = conc * (p0) + store1("vre","rho") * (1-p0);
gdata("gas","rho") = conc * p2 + store1("gas","rho") * (1-p2);
fmr = bfmr * 0.8 * p3 + bfmr * (1 - p3);
carbon = p4 * cprice + 0 * (1-p4);
* scenario overwrites
gdata("vre","capcost-g") = vrecostg;
gdata("ccscoal", "capcost-g") = ccscostg;
* price overwrites
fl("diesel",te)= dieselp * 60 * flconv;
fl("coal",te) = coalp * 60 * .05;
effectiveprice("gas",te) = fl("diesel",te) * oillink + 8 * (1 - oillink);
fl("gas",te) = p1 * min(effectiveprice("gas",te),pcel)
+ effectiveprice("gas",te) * (1-p1);
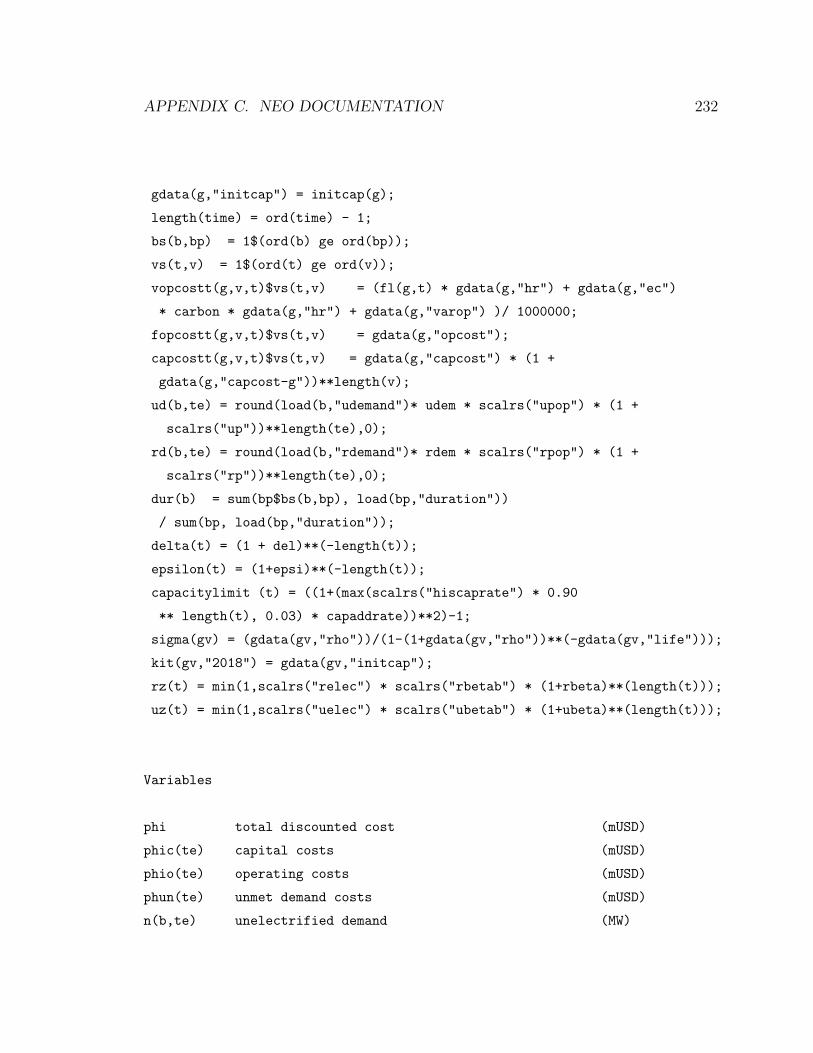
APPENDIX C. NEO DOCUMENTATION 232
gdata(g,"initcap") = initcap(g);
length(time) = ord(time) - 1;
bs(b,bp) = 1$(ord(b) ge ord(bp));
vs(t,v) = 1$(ord(t) ge ord(v));
vopcostt(g,v,t)$vs(t,v) = (fl(g,t) * gdata(g,"hr") + gdata(g,"ec")
* carbon * gdata(g,"hr") + gdata(g,"varop") )/ 1000000;
fopcostt(g,v,t)$vs(t,v) = gdata(g,"opcost");
capcostt(g,v,t)$vs(t,v) = gdata(g,"capcost") * (1 +
gdata(g,"capcost-g"))**length(v);
ud(b,te) = round(load(b,"udemand")* udem * scalrs("upop") * (1 +
scalrs("up"))**length(te),0);
rd(b,te) = round(load(b,"rdemand")* rdem * scalrs("rpop") * (1 +
scalrs("rp"))**length(te),0);
dur(b) = sum(bp$bs(b,bp), load(bp,"duration"))
/ sum(bp, load(bp,"duration"));
delta(t) = (1 + del)**(-length(t));
epsilon(t) = (1+epsi)**(-length(t));
capacitylimit (t) = ((1+(max(scalrs("hiscaprate") * 0.90
** length(t), 0.03) * capaddrate))**2)-1;
sigma(gv) = (gdata(gv,"rho"))/(1-(1+gdata(gv,"rho"))**(-gdata(gv,"life")));
kit(gv,"2018") = gdata(gv,"initcap");
rz(t) = min(1,scalrs("relec") * scalrs("rbetab") * (1+rbeta)**(length(t)));
uz(t) = min(1,scalrs("uelec") * scalrs("ubetab") * (1+ubeta)**(length(t)));
Variables
phi total discounted cost (mUSD)
phic(te) capital costs (mUSD)
phio(te) operating costs (mUSD)
phun(te) unmet demand costs (mUSD)
n(b,te) unelectrified demand (MW)
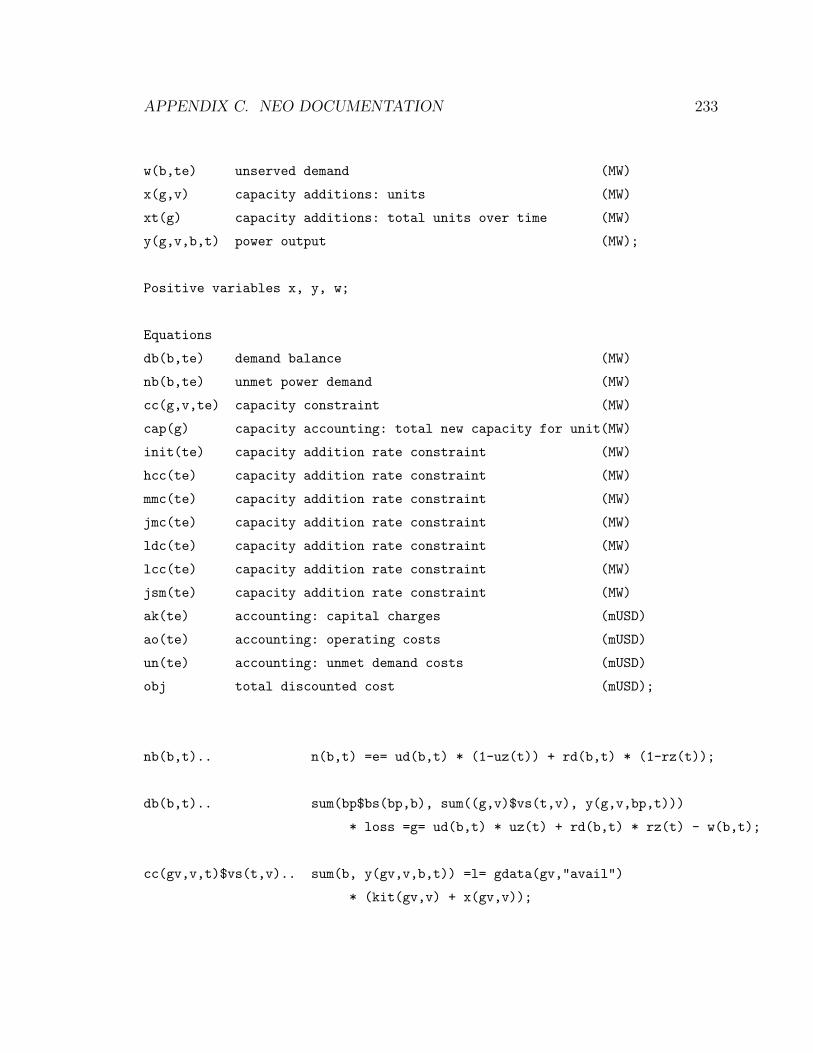
APPENDIX C. NEO DOCUMENTATION 233
w(b,te) unserved demand (MW)
x(g,v) capacity additions: units (MW)
xt(g) capacity additions: total units over time (MW)
y(g,v,b,t) power output (MW);
Positive variables x, y, w;
Equations
db(b,te) demand balance (MW)
nb(b,te) unmet power demand (MW)
cc(g,v,te) capacity constraint (MW)
cap(g) capacity accounting: total new capacity for unit(MW)
init(te) capacity addition rate constraint (MW)
hcc(te) capacity addition rate constraint (MW)
mmc(te) capacity addition rate constraint (MW)
jmc(te) capacity addition rate constraint (MW)
ldc(te) capacity addition rate constraint (MW)
lcc(te) capacity addition rate constraint (MW)
jsm(te) capacity addition rate constraint (MW)
ak(te) accounting: capital charges (mUSD)
ao(te) accounting: operating costs (mUSD)
un(te) accounting: unmet demand costs (mUSD)
obj total discounted cost (mUSD);
nb(b,t).. n(b,t) =e= ud(b,t) * (1-uz(t)) + rd(b,t) * (1-rz(t));
db(b,t).. sum(bp$bs(bp,b), sum((g,v)$vs(t,v), y(g,v,bp,t)))
* loss =g= ud(b,t) * uz(t) + rd(b,t) * rz(t) - w(b,t);
cc(gv,v,t)$vs(t,v).. sum(b, y(gv,v,b,t)) =l= gdata(gv,"avail")
* (kit(gv,v) + x(gv,v));
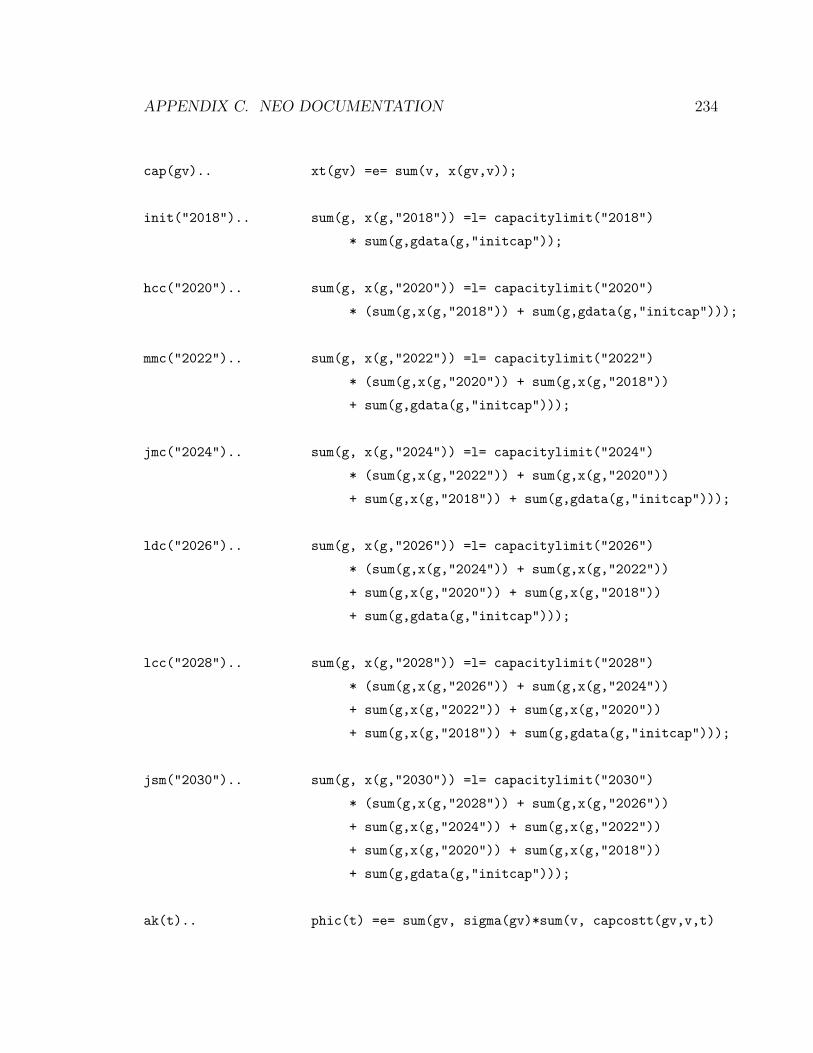
APPENDIX C. NEO DOCUMENTATION 234
cap(gv).. xt(gv) =e= sum(v, x(gv,v));
init("2018").. sum(g, x(g,"2018")) =l= capacitylimit("2018")
* sum(g,gdata(g,"initcap"));
hcc("2020").. sum(g, x(g,"2020")) =l= capacitylimit("2020")
* (sum(g,x(g,"2018")) + sum(g,gdata(g,"initcap")));
mmc("2022").. sum(g, x(g,"2022")) =l= capacitylimit("2022")
* (sum(g,x(g,"2020")) + sum(g,x(g,"2018"))
+ sum(g,gdata(g,"initcap")));
jmc("2024").. sum(g, x(g,"2024")) =l= capacitylimit("2024")
* (sum(g,x(g,"2022")) + sum(g,x(g,"2020"))
+ sum(g,x(g,"2018")) + sum(g,gdata(g,"initcap")));
ldc("2026").. sum(g, x(g,"2026")) =l= capacitylimit("2026")
* (sum(g,x(g,"2024")) + sum(g,x(g,"2022"))
+ sum(g,x(g,"2020")) + sum(g,x(g,"2018"))
+ sum(g,gdata(g,"initcap")));
lcc("2028").. sum(g, x(g,"2028")) =l= capacitylimit("2028")
* (sum(g,x(g,"2026")) + sum(g,x(g,"2024"))
+ sum(g,x(g,"2022")) + sum(g,x(g,"2020"))
+ sum(g,x(g,"2018")) + sum(g,gdata(g,"initcap")));
jsm("2030").. sum(g, x(g,"2030")) =l= capacitylimit("2030")
* (sum(g,x(g,"2028")) + sum(g,x(g,"2026"))
+ sum(g,x(g,"2024")) + sum(g,x(g,"2022"))
+ sum(g,x(g,"2020")) + sum(g,x(g,"2018"))
+ sum(g,gdata(g,"initcap")));
ak(t).. phic(t) =e= sum(gv, sigma(gv)*sum(v, capcostt(gv,v,t)
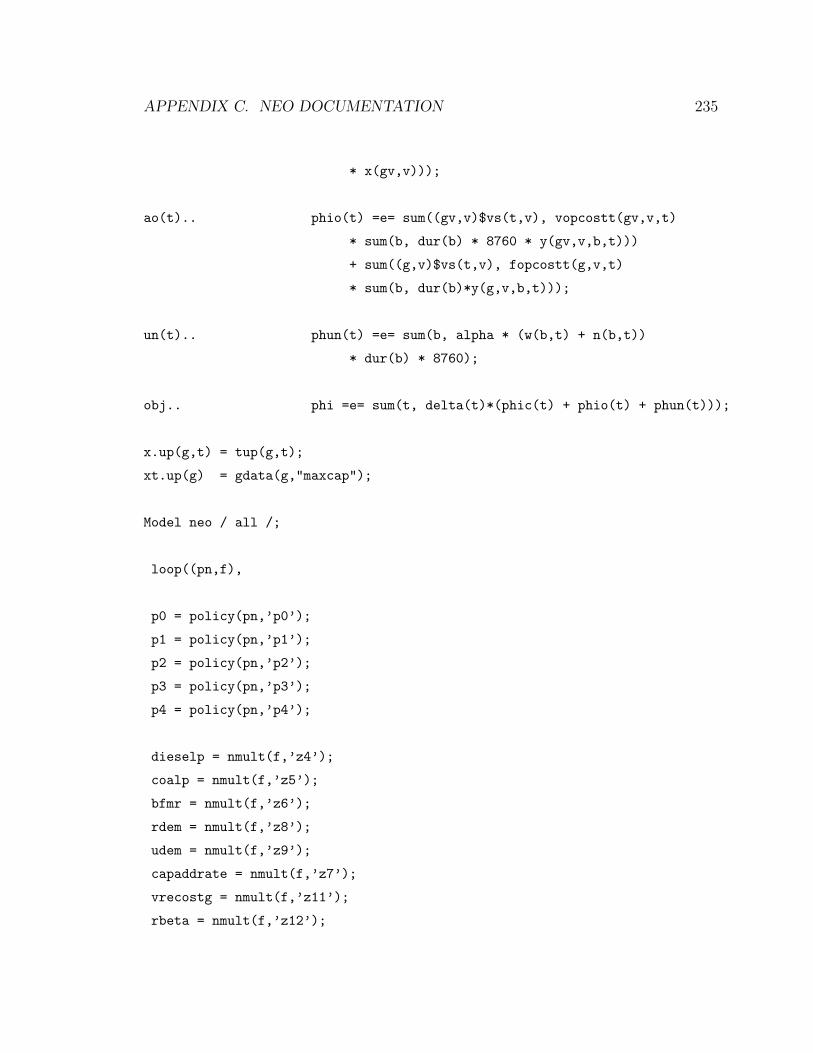
APPENDIX C. NEO DOCUMENTATION 235
* x(gv,v)));
ao(t).. phio(t) =e= sum((gv,v)$vs(t,v), vopcostt(gv,v,t)
* sum(b, dur(b) * 8760 * y(gv,v,b,t)))
+ sum((g,v)$vs(t,v), fopcostt(g,v,t)
* sum(b, dur(b)*y(g,v,b,t)));
un(t).. phun(t) =e= sum(b, alpha * (w(b,t) + n(b,t))
* dur(b) * 8760);
obj.. phi =e= sum(t, delta(t)*(phic(t) + phio(t) + phun(t)));
x.up(g,t) = tup(g,t);
xt.up(g) = gdata(g,"maxcap");
Model neo / all /;
loop((pn,f),
p0 = policy(pn,’p0’);
p1 = policy(pn,’p1’);
p2 = policy(pn,’p2’);
p3 = policy(pn,’p3’);
p4 = policy(pn,’p4’);
dieselp = nmult(f,’z4’);
coalp = nmult(f,’z5’);
bfmr = nmult(f,’z6’);
rdem = nmult(f,’z8’);
udem = nmult(f,’z9’);
capaddrate = nmult(f,’z7’);
vrecostg = nmult(f,’z11’);
rbeta = nmult(f,’z12’);
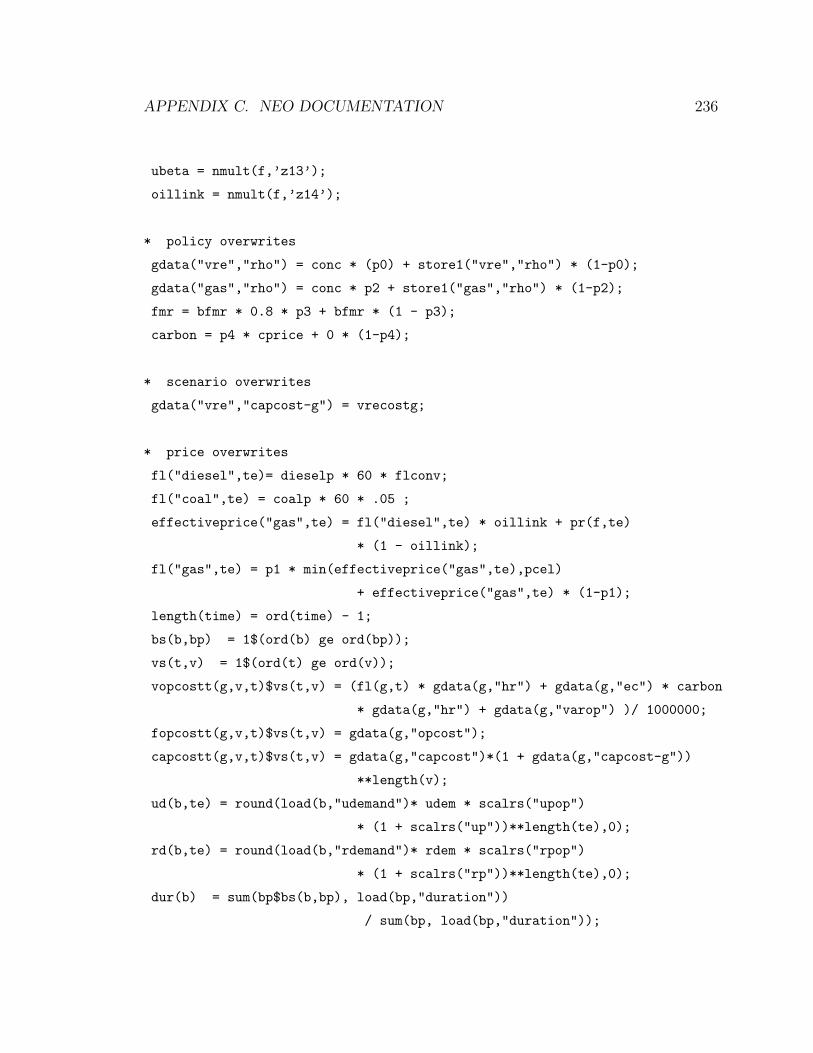
APPENDIX C. NEO DOCUMENTATION 236
ubeta = nmult(f,’z13’);
oillink = nmult(f,’z14’);
* policy overwrites
gdata("vre","rho") = conc * (p0) + store1("vre","rho") * (1-p0);
gdata("gas","rho") = conc * p2 + store1("gas","rho") * (1-p2);
fmr = bfmr * 0.8 * p3 + bfmr * (1 - p3);
carbon = p4 * cprice + 0 * (1-p4);
* scenario overwrites
gdata("vre","capcost-g") = vrecostg;
* price overwrites
fl("diesel",te)= dieselp * 60 * flconv;
fl("coal",te) = coalp * 60 * .05 ;
effectiveprice("gas",te) = fl("diesel",te) * oillink + pr(f,te)
* (1 - oillink);
fl("gas",te) = p1 * min(effectiveprice("gas",te),pcel)
+ effectiveprice("gas",te) * (1-p1);
length(time) = ord(time) - 1;
bs(b,bp) = 1$(ord(b) ge ord(bp));
vs(t,v) = 1$(ord(t) ge ord(v));
vopcostt(g,v,t)$vs(t,v) = (fl(g,t) * gdata(g,"hr") + gdata(g,"ec") * carbon
* gdata(g,"hr") + gdata(g,"varop") )/ 1000000;
fopcostt(g,v,t)$vs(t,v) = gdata(g,"opcost");
capcostt(g,v,t)$vs(t,v) = gdata(g,"capcost")*(1 + gdata(g,"capcost-g"))
**length(v);
ud(b,te) = round(load(b,"udemand")* udem * scalrs("upop")
* (1 + scalrs("up"))**length(te),0);
rd(b,te) = round(load(b,"rdemand")* rdem * scalrs("rpop")
* (1 + scalrs("rp"))**length(te),0);
dur(b) = sum(bp$bs(b,bp), load(bp,"duration"))
/ sum(bp, load(bp,"duration"));

APPENDIX C. NEO DOCUMENTATION 237
delta(t) = (1+del)**(-length(t));
epsilon(t) = (1+epsi)**(-length(t));
capacitylimit (t) = ((1+(max(scalrs("hiscaprate") * 0.90
** length(t), 0.03) *capaddrate))**2)-1;
sigma(gv) = (gdata(gv,"rho"))/(1-(1+gdata(gv,"rho"))**(-gdata(gv,"life")));
kit(gv,"2018") = gdata(gv,"initcap");
rz(t) = min(1,scalrs("relec") * scalrs("rbetab") * (1+rbeta)**(length(t)));
uz(t) = min(1,scalrs("uelec") * scalrs("ubetab") * (1+ubeta)**(length(t)));
Solve neo minimizing phi using lp;
);
Bibliography
Advisory Group on Energy and Climate Change. 2010. Energy for a Sustainable
Future. Tech. rept. United Nations, New York.
Agusdinata, Buyung. 2008. Exploratory modeling and analysis: A promising method
to deal with deep uncertainty. Ph.D. thesis, Technical Univeristy of Delft.
Allison, G T. 1971. Essence of Decision. Brown, Boston.
Alvarez, Ramon, Pacala, Stephen W, Winebrake, James J, Chameides, William L, &
Hamburg, Steven P. 2012. Greater focus needed on methane leakage from natural
gas infrastructure. Proceedings of the National Academy of Sciences of the United
States of America, 109(17), 6435–6440.
Anderson, Craig A, Lepper, Mark R, & Ross, Lee. 1980. Perseverance of social
theories: The role of explanation in the persistence of discredited information.
Journal of personality and social psychology, 39(6), 1037.
Anderson, Dennis. 1972. Models for Determining Least-Cost Investments in Elec-
tricity Supply. The Bell Journal of Economics and Management Science, 3(1),
267–299.
Art, Robert J. 1973. Bureaucratic politics and American foreign policy: A critique.
Policy Sci, 4(4), 467–490.
Asafu-Adjaye, J. 2000. The relationship between energy consumption, energy prices
and economic growth: time series evidence from Asian developing countries. Energy
Economics, 22, 615–625.
238
BIBLIOGRAPHY 239
Bahgat, Gawdat. 2011. Energy security: an interdisciplinary approach. John Wiley
& Sons.
Bankes, Steve. 1993. Exploratory Modeling for Policy Analysis. Operations Research,
41(3), 435–449.
Barilleaux, Ryan J. 1984. Kennedy, the Bay of Pigs, and the Limits of Collegial
Decision Making. Pages 207–222 of: The Presidency and National Security Policy,
r. gordon edn. New York: Center for the Study of the Presidency.
Bazilian, Morgan, & Chattopadhyay, Debabrata. 2016. Considering power system
planning in fragile and conflict states. Energy for Sustainable Development, 32,
110–120.
Bazilian, Morgan, & Pielke, Roger. 2013. Making Energy Access Meaningful. Issues
in Science and Technology, Summer 201, 74–79.
Bazilian, Morgan, Nussbaumer, Patrick, Cabraal, Anil, Centurelli, Raffaella,
Detchon, Reid, Gielen, Dolf, Rogner, Holger, Howells, Mark, McMahon, Hilary,
Modi, Vijay, Nakicenovic, Nebojsa, O’Gallachoir, Brian, Radka, Mark, Rijal, Ka-
mal, Takada, Minoru, & Ziegler, Florian. 2010a. Measuring Energy Access: Sup-
porting a Global Target. Tech. rept. The Earth Institute, Columbia University.
Bazilian, Morgan, Sagar, Ambuj, Detchon, Reid, & Yumkella, Kandeh. 2010b. More
heat and light. Energy Policy, 38(10), 5409–5412.
Bazilian, Morgan, Nussbaumer, Patrick, Rogner, Hans Holger, Brew-Hammond,
Abeeku, Foster, Vivien, Pachauri, Shonali, Williams, Eric, Howells, Mark, Niy-
ongabo, Philippe, Musaba, Lawrence, Gallachoir, Brian o, Radka, Mark, & Kam-
men, Daniel M. 2012. Energy access scenarios to 2030 for the power sector in
sub-Saharan Africa. Utilities Policy, 20(1), 1–16.
Bazilian, Morgan, Economy, Ryan, Haites, Erik, Nussbaumer, Patrick, Yumkella,
Kandeh K., Howells, Mark, Takada, Minoru, Rothman, Dale S., & Levi, Michael.
2014. Beyond Basic Access: The Scale of Investment Required for Universal Energy
BIBLIOGRAPHY 240
Access. In: Halff, Antoine, Sovacool, Benjamin K., & Rozhon, Jon (eds), Energy
Poverty: Global Challenges and Local Solutions. Oxford University Press.
Beccue, Phil, Huntington, Hillard, & Weyant, John. 1997. Quantifying Oil Disruption
Risks Through Expert Judgement. Energy Modeling Forum.
Bendor, Jonathan, & Hammond, Thomas H. 1992. Rethinking Allison’s Models. The
American Political Science Review, 86(2), 301–322.
Bendor, Jonathan, & Hammond, Thomas H. 2010. ChoiceTheoretic Approaches to
Bureaucratic Structure. The Oxford Handbook of American Bureaucracy, 638–665.
Bhatia, Mikul, & Angelou, Nicolina. 2015a. Beyond Connections Energy Access Re-
defined. Tech. rept. Energy Sector Management Assistance Program, World Bank
Group, Washington, D.C.
Bhatia, Mikul, & Angelou, Nicolina. 2015b. Beyond Connections Energy Access Re-
defined, Technical Report 008/15. Tech. rept. World Bank, Washington, D.C.
Billinton, R, & Huang, D. 2008. Aleatory and Epistemic Uncertainty Considera-
tions in Power System Reliability Evaluation. Proceedings of the 10th International
Conference on Probablistic Methods Applied to Power Systems.
Birge, John R, & Louveaux, Francois. 2011. Introduction to stochastic programming.
Springer Science & Business Media.
Birol, Fatih. 2014. Achieving Energy for All Will Not Cost the Earth. Chap. 1, pages
1–13 of: Halff, Antoine, Sovacool, Benjamin K., & Rozhon, Jon (eds), Energy
Poverty: Global Challenges and Local Solutions. Oxford University Press.
Blum, David M, & Pate-Cornell, Elisabeth. 2015. Probabilistic Warnings in National
Security Crises : Pearl Harbor Revisited. Decision Analysis, 1–25.
Borjeson, Lena, Hojer, Mattias, Dreborg, Karl-Henrik, Ekvall, Tomas, & Finnveden,
Goran. 2006. Scenario types and techniques: towards a user’s guide. Futures, 38(7),
723–739.

BIBLIOGRAPHY 241
BP. 2016. BP Statistical Review of World Energy. Tech. rept. BP.
Brams, Steven J, & Bramj, Steven J. 1985. Superpower games: Applying game theory
to superpower conflict. Yale University Press New Haven.
Brams, Steven J, & Kilgour, D Marc. 1988. Game theory and national security.
Blackwell New York.
Brandt, AR, Heath, GA, Kort, EA, & O’Sullivan, F. 2014. Methane leaks from North
American natural gas systems. Science, 343(6172), 7330735.
Brock, Horace W, & Nesbitt, Dale M. 1977. Large-scale energy planning models: a
methodological analysis. Final report. Tech. rept. Stanford Research Institute.
Buskirk, Robert Van. 2015. Doubling the Global Pace of Progress for Energy Effi-
ciency. Tech. rept. CLASP.
B.Wynne, & Shackley, S. 1994. Environmental models: Truth machines or social
heuristics. The Globe, 21, 6–8.
Caldwell, Dan. 1977. Bureaucratic Foreign Policy-Making. The American Behavioral
Scientist, 21(1), 87–110.
Calvin, Katherine, Pachauri, Shonali, De Cian, Enrica, & Mouratiadou, Ioanna. 2013.
The effect of African growth on future global energy, emissions, and regional de-
velopment. Climatic Change, 1–17.
Casillas, CE, & Kammen, DM. 2010. The Energy-Poverty-Climate nexus. Renewable
energy, 330(November), 1181–1182.
Chakravarty, Shoibal, & Tavoni, Massimo. 2013. Energy poverty alleviation and
climate change mitigation: Is there a trade off? Energy Economics, 40, S67–S73.
Chattopadhyay, D., Spyrou, E., Mukhi, N., Bazilian, M., & Vogt-Schilb, A. 2016.
Building climate resilience into power systems plans: Reflections on potential ways
forward for Bangladesh. The Electricity Journal, 29(7), 32–41.
BIBLIOGRAPHY 242
Chyong, Chi-kong, & Hobbs, Benjamin F. 2011. Strategic Eurasian Natural Gas
Model for Energy Security and Policy Analysis. Tech. rept. March. Electricity
Policy Reserach Group.
Clarke, Jf, & Edmonds, Ja. 1993. Modelling energy technologies in a competitive
market. Energy Economics, 123–129.
Clinton, Hillary. 2010. The First Quadrennial Diplomacy and Development Review
(QDDR): Leading Through Civilian Power.
Clinton, H.R. 2012. Energy Diplomacy, Georgetown University, October 18, 2012.
Coady, David, Parry, Ian, Sears, Louis, & Shang, Baoping. 2015a. How Large are
Global Energy Subsidies? Tech. rept. International Monetary Fund.
Coady, David, Flamini, Valentina, & Sears, Louis. 2015b. The Unequal Benefits of
Fuel Subsidies Revisited: Evidence for Developing Countries. Tech. rept. Interna-
tional Monetary Fund.
Cohen, Michael D., March, James G., & Olsen, Johan P. 1972. A Garbage Can Model
of Organizational Choice. Administrative Science Quarterly,, 17(1), 1–25.
Corbeau, Anne-Sophie, & Ledesma, David. 2016. LNG Markets in Transition - The
Great Reconfiguration. Oxford University Press.
Craine, Stewart, Mills, Evan, & Guay, Justin. 2014. Clean Energy Services for All:
Financing Universal Electrification. Tech. rept. June 2014. Sierra Club.
Culver, Lauren. 2017. Energy Poverty: What you measure matters. Tech. rept.
Natural Gas Initiative, Stanford Unversity.
Dantzig, George B. 1963. Linear Programming and Extensions. Princeton landmarks
in mathematics and physics.
de Mesquita, Bruce Bueno. 2011. Applications of game theory in support of intelli-
gence analysis. Intelligence Analysis: Behavioral and Social Scientific Foundations,
57–82.
BIBLIOGRAPHY 243
DeCarolis, Joseph F. 2011. Using modeling to generate alternatives (MGA) to expand
our thinking on energy futures. Energy Economics, 33(2), 145–152.
DeCarolis, Joseph F., Hunter, Kevin, & Sreepathi, Sarat. 2012. The case for repeat-
able analysis with energy economy optimization models. Energy Economics, 34(6),
1845–1853.
Deichmann, Uwe, Meisner, Craig, Murray, Siobhan, & Wheeler, David. 2011. The
economics of renewable energy expansion in rural Sub-Saharan Africa. Energy
Policy, 39(1), 215–227.
Demierre, Jonathan, Bazilian, Morgan, Carbajal, Jonathan, Sherpa, Shaky, & Modi,
Vijay. 2014. Potential For Regional Use Of East Africa’s Natural Gas. Tech. rept.
May. Columbia University.
Desai, Deval, & Jarvis, Michael. 2012. Governance and Accountability in Extractive
Industries: Theory and Practice at the World Bank. Journal of Energy & Natural
Resources Law, 30(2), 101–128.
DoD. 2014. Quadrennial Defense Review. Tech. rept. U.S. Department of Defense.
Dunn, William N. 1981. An introduction to public policy analysis. Englewood Cliffs,
NI: Rentice Hall.
Durix, Laurent, Carlsson Rex, Helene, & Mendizabal, Veronica. 2016. Contextual
Design and Promotion of Clean Biomass Stoves : The Case of the Indonesia Clean
Stove Initiative. Livewire, 64, 1–12.
Eberhard, Anton, Rosnes, Orvika, Shkaratan, Maria, & Vennemo, Haakon. 2011.
Africa’s power infrastructure: investment, integration, efficiency. World Bank Pub-
lications.
Egging, Rudolf. 2010. Multi-Period Natural Gas Market Modeling Applications,
Stochastic Extensions and Solution Approaches. Ph.D. thesis, University of Mary-
land.

BIBLIOGRAPHY 244
EIA. 2016. Annual Energy Outlook 2016. Tech. rept. Energy Information Adminis-
tration, Washington, D.C.
EIA. 2017. Annual Energy Outlook. Tech. rept. Energy Information Agency.
Elias, Rebecca J, & Victor, David G. 2005. Energy Transitions in Developing Coun-
tries: a Review of Concepts and Literature. Tech. rept. June 2005. Program on
Energy and Sustainable Development, Stanford University, Stanford, CA.
EPA. 2016. Inventory of U.S. Greenhouse Gas Emissions and Sinks: 1990 to 2014.
Tech. rept. U.S. Environmental Protection Agency.
ESMAP. 2007a. Technical and Economic Assessment of Off-Grid, Mini- Grid and
Grid Electrification Technologies. Tech. rept. Energy Sector Management Assis-
tance Programme, World Bank Group, Washington, D.C.
ESMAP. 2007b. Technical and economic assessment of off-grid, Mini-grid and grid
electrification technologies. ESMAP technical paper 121/07, 324.
et al. Dhand, SG. 2014. Review of the Direct Benefit Transfer for LPG Scheme. Tech.
rept. Committee to the Ministry of Petroleum and Natural Gas, New Delhi.
Ferreira, Francisco H. G, Chen, Shaohua, Dabalen, Andrew L., Dikhanov, Yuri M.,
Hamadeh, Nada, Jolliffe, Dean Mitchell, Narayan, Ambar, Prydz, Espen Beer,
Revenga, Ana L., Sangraula, Prem, Serajuddin, Umar, & Yoshida, Nobuo. 2015.
A global count of the extreme poor in 2012: data issues, methodology and initial
results. Tech. rept. World Bank Group.
Flouri, Maria, Karakosta, Charikleia, Kladouchou, Charikleia, & Psarras, John. 2015.
How does a natural gas supply interruption affect the EU gas security? A Monte
Carlo simulation. Renewable and Sustainable Energy Reviews, 44.
Fox, Craig R., & Tversky, Amos. 1995. Ambiguity Aversion and Comparative Igno-
rance. The Quarterly Journal of Economics, 110(3), 585–603.
BIBLIOGRAPHY 245
G8 Energy Ministers. 2009. Africa Energy Poverty May 24 and 25. Tech. rept. World
Bank Group, Rome.
Gabriel, Steven a., Conejo, Antonio J., Fuller, J. David, Hobbs, Benjamin F., & Ruiz,
Carlos. 2013. Complementarity Modeling in Energy Markets. International Series
in Operations Research & Management Science, vol. 180. New York, NY: Springer
New York.
Gell-Mann, Murray. 1995. The Quark and the Jaguar: Adventures in the Simple and
the Complex. Macmillan.
George, Alexander L. 1972. The Case for Multiple Advocacy in Making Foreign
Policy. American Political Science Review, 66(3), 751–785.
George, Alexander L. 1980. Presidential decision-making in foreign policy: The ef-
fective use of information and advice. Westview Pr.
George, Alexander L. 1987. Ideology and international relations: A conceptual anal-
ysis. Jerusalem Journal of International Relations, 9(1), 1–21.
George, Alexander L. 2006. On Foreign Policy Unfinished Business.
Gertler, Paul, Shelef, Orie, Wolfram, Catherine, & Fuchs, Alan. 2016. The Demand
for Energy-Using Assets among the World’s Rising Middle Classes. American Eco-
nomic Review, 106(6), 1366–1401.
Geurts, Jac L A, & Joldersma, Cisca. 2001. Methodology for participatory policy
analysis. European Journal of Operational Research, 128(2), 300–310.
Global LEAP. 2015. Off-Grid Appliance Market Survey. Tech. rept. Global LEAP
Lighting and Energy Access Partnership, Washington, D.C.
Global LEAP. 2016. The State of the Global Off-Grid Appliance Market. Tech. rept.
Global LEAP Lighting and Energy Access Partnership.
BIBLIOGRAPHY 246
Granoff, Ilmi, Eis, Jason, Hoy, Chris, Watson, Charlene, Granoff, Ilmi, Eis, Jason,
Mcfarland, Will, Watson, Charlene, & Grist, Natasha. 2015. Zero poverty, zero
emissions: Eradicating extreme poverty in the climate crisis. Tech. rept. September
2015. Overseas Develoment Institute, London.
Greening, Lorna a, & Bernow, Steve. 2004. Design of coordinated energy and en-
vironmental policies: use of multi-criteria decision-making. Energy Policy, 32(6),
721–735.
Greenstone, Michael, Kopits, Elizabeth, & Wolverton, Ann. 2013. Developing a so-
cial cost of carbon for US regulatory analysis: A methodology and interpretation.
Review of Environmental Economics and Policy, 7(1), 23–46.
Haasnoot, Marjolijn, Kwakkel, Jan H., Walker, Warren E., & ter Maat, Judith. 2013.
Dynamic adaptive policy pathways: A method for crafting robust decisions for a
deeply uncertain world. Global Environmental Change, 23(2), 485–498.
Hallegatte, Stephane, Shah, Ankur, Lempert, Robert, Brown, Casey, & Gill, Stuart.
2012. Investment decision-making under deep uncertaintyApplication to climate
change. Tech. rept. September. World Bank, Washington, D.C.
Halperin, Morton H, & Clapp, Priscilla. 2007. Bureaucratic politics and foreign policy.
Brookings Institution Press.
Hamalainen, Raimo P., & Karjalainen, Risto. 1992. Decision support for risk analysis
in energy policy. European Journal of Operational Research, 56(2), 172–183.
Hayhoe, Katharine, Kheshgi, Haroon S., Jain, Atul K., & Wuebbles, Donald J. 2002.
Substitution of natural gas for coal: Climatic effects of utility sector emissions.
Climatic Change, 54, 107–139.
Heath, Chip, & Tversky, Amos. 1991. Preference and belief: Ambiguity and compe-
tence in choice under uncertainty. Journal of risk and uncertainty, 4(1), 5–28.
Heath, Garvin, Warner, Ethan, Steinberg, Daniel, & Brandt, Adam. 2015. Esti-
mating U.S. methane emissions from the natural gas supply chain : Approaches
BIBLIOGRAPHY 247
, uncertainties , current estimates , and future studies. Tech. rept. August 2015.
NREL/TP-6A50-62820.
Heath, Garvin a, O’Donoughue, Patrick, Arent, Douglas J, & Bazilian, Morgan. 2014.
Harmonization of initial estimates of shale gas life cycle greenhouse gas emissions
for electric power generation. Proceedings of the National Academy of Sciences of
the United States of America, 111(31), E3167–76.
Herbst, Andrea, Toro, Felipe, Reitze, Felix, & Jochem, Eberhard. 2012. Introduction
to energy systems modelling. Swiss journal of economics and statistics, 148(2),
111–135.
Hertwich, Edgar G., & Hammitt, James K. 2001. A Decision-Analytic Framework for
Impact Assessment Part I : LCA and Decision Analysis \ J. International Journal
of Life Cycle Assessment, 6(1), 5–12.
Hilsman, Roger. 2011. The politics of policy making in defense and foreign affairs:
conceptual models and bureaucratic politics. London: Prentice-Hall International.
Hitch, Charles Johnston, & McKean, Roland N. 1960. The economics of defense in
the nuclear age. London: Oxford University Press.
Hobbs, Benjamin F, & Meier, Peter. 2000. Energy decisions and the environment: a
guide to the use of multicriteria methods. Springer Science & Business Media.
Hobbs, Benjamin F., & Meier, Peter M. 1994. Multicriteria methods for resource
planning: an experimental comparison. IEEE Transactions on Power Systems,
9(4), 1811–1817.
Hodges, James S, Dewar, James A, & Center, Arroyo. 1992. Is it you or your model
talking?: A framework for model validation. Rand Santa Monica, CA.
Hogan, William W. 1975. Energy policy models for project independence. Computers
& Operations Research, 2(3-4), 251–271.
BIBLIOGRAPHY 248
Hogan, William W. 2002. Energy Modeling for Policy Studies. Operations Research,
50(December 2014), 89–95.
Hoppe, Robert. 1999a. Argumentative turn. Science and Public Policy, 26(3), 201–
210.
Hoppe, Robert. 1999b. Policy analysis, science and politics: from speaking truth to
power’to making sense together’. Science and public policy, 26(3), 201–210.
Howard, Ronald a. 1988. Decision Analysis: Practice And Promise. Management
Science, 34(6), 679–695.
Howard, Ronald A, & Abbas, Ali E. 2015. Foundations of decision analysis. Prentice
Hall.
Howarth, Robert W., Santoro, Renee, & Ingraffea, Anthony. 2011. Methane and the
greenhouse-gas footprint of natural gas from shale formations. Climatic Change,
106(4), 679–690.
Hudson, Valerie M. 2013. Foreign policy analysis: classic and contemporary theory.
Rowman & Littlefield.
Huntington, Hillard G, Weyant, John P, & Sweeney, James L. 1982. Modeling for
insights, not numbers: the experiences of the energy modeling forum. International
Journal of Management Science, 10(5), 449–462.
Hutchins, Thomas, & Morgan, Kinder. 2016. Rising Risk: Improving Methane Dis-
closure. Tech. rept. Enviromental Defense Fund.
Huurdeman, Lex, Chikkatur, Ananth, & Crook, Leonard. 2013. Planning and Mod-
eling Under Uncertainty - Development of the Mozambique Natural Gas Master
Plan. Tech. rept. World Bank.
IEA. 2011. Energy for All: Financing access for the poor. Tech. rept. International
Energy Agency, Paris.
BIBLIOGRAPHY 249
IEA. 2015. World Energy Outlook 2015: Methodology for Energy Access Analysis.
Tech. rept. International Energy Agency, Paris.
IEA. 2016a. WEO Energy Access Database. Tech. rept. International Energy Agency.
IEA. 2016b. World Energy Investment Outlook 2016. Tech. rept. International Energy
Agency, Paris.
IEA and World Bank. 2015. Sustainable Energy for All 2015 Progress Toward Sus-
tainable Energy. Tech. rept. Washington, D.C.
International Energy Agency. 2011. The Model of Short-Term Energy Security
(MOSES). Paris: International Energy Agency.
IPCC. 2014. Climate Change 2014: Mitigation of Climate Change. Contribution
of Working Group III to the Fifth Assessment Report of the Intergovernmental
Panel on Climate Change. Tech. rept. Intergovernmental Panel on Climate Change,
Cambridge.
Isley, Steven C., Lempert, Robert J., Popper, Steven W., & Vardavas, Raffaele. 2015.
The effect of near-term policy choices on long-term greenhouse gas transformation
pathways. Global Environmental Change, 34, 147–158.
Jackson, Robert B, Down, Adrian, Philips, Nathan G, Ackley, Robert C, Cook,
Charles W, Plata, Desiree L, Zhao, Kaiguang, & Phillips, Nathan G. 2014. Natural
gas pipeline leaks across Washington, DC. Environmental Science and Technology,
48(3), 2051–8.
Jaiswal, Narendar Kumar. 2012. Military operations research: Quantitative decision
making. Vol. 5. Springer Science & Business Media.
Jebaraj, S., & Iniyan, S. 2006. A review of energy models. Renewable and Sustainable
Energy Reviews, 10(4), 281–311.
Jervis, Robert. 1968. Hypotheses on misperception. World Politics, 20(03), 454–479.

BIBLIOGRAPHY 250
Johnson, Richard Tanner. 1974. Managing the White House: An intimate study of
the presidency. HarperCollins Publishers.
Kahneman, Daniel, & Tversky, Amos. 1979. Prospect theory: An analysis of decision
under risk. Econometrica: Journal of the econometric society, 263–291.
Kalicki, Jan H, & Goldwyn, David L. 2005. Energy and security: toward a new foreign
policy strategy. Johns Hopkins Univ Pr.
Kalra, Nidhi, Hallegatte, Stephane, Lempert, Robert, Brown, Casey, Fozzard, Adrian,
Gill, Stuart, & Shah, Ankur. 2014. Agreeing on Robust Decisions New Processes for
Decision Making Under Deep Uncertainty. World Bank Policy Research Working
Paper, No. 6906(June).
Kann, Antje, & Weyant, John P. 2000. Approaches for performing uncertainty anal-
ysis in large-scale energy / economic policy models. Environmental Modeling and
Assessment, 5(1), 29.
Kaplan, Edward H, Fischhoff, B, & Chauvin, C. 2011. Operations research and intelli-
gence analysis. Intelligence Analysis: Behavioral and Social Scientific Foundations,
The National Academies Press, Washington, DC, 31–56.
Kaplan, Stan. 1992. ’Expert information’ versus ’expert opinions’. Another approach
to the problem of eliciting/ combining/using expert knowledge in PRA. Reliability
Engineering and System Safety, 35(1), 61–72.
Karlan, Dean, Osei, Robert, Osei-akoto, Isaac, & Udry, Christopher. 2014. Agricul-
tural Decions After Relaxing Credit and Risk Constraints. Quarterly Journal of
Economics, 129(2), 597–652.
Kavrakolu, . 1987. Energy policy: modelling and analysis. Mathematical Modelling,
9(9), 659–667.
Keeney, Ralph L, & Raiffa, Howard. 1976. Decisions with multiple objectives: prefer-
ences and value trade-offs. Cambridge university press.

BIBLIOGRAPHY 251
Keeney, Ralph L, & Von Winterfeldt, Detlof. 1989. On the uses of expert judgment
on complex technical problems. IEEE Transactions on engineering management,
36(2), 83–86.
Keller, Klaus. 2012. Bayesian Decision Theory and Climate Change. 1 edn. Elsevier
Inc.
Kissinger, Henry. 1977. American Foreign Policy. New York, NY: Norton & Company.
Krasner, Stephen D. 1972. Are Bureaucracies Important? (or Allison Wonderland).
Foreign Policy, 7, 159–179.
Kugler, Richard L . 2006. Policy Analysis in National Security Affairs: New Methods
for a New Era. Washington, D.C.: National Defense University.
Kwakkel, Jan H., & Pruyt, Erik. 2013. Exploratory Modeling and Analysis, an ap-
proach for model-based foresight under deep uncertainty. Technological Forecasting
and Social Change, 80(3), 419–431.
Kwakkel, Jan H., Haasnoot, Marjolijn, & Walker, Warren E. 2015. Developing
dynamic adaptive policy pathways: a computer-assisted approach for developing
adaptive strategies for a deeply uncertain world. Climatic Change, 132(3), 373–386.
Lee, Kenneth, Miguel, Edward, & Wolfram, Catherine. 2016. Appliance Ownership
and Aspirations among Electric Grid and Home Solar Households in Rural Kenya.
American Economic Review, 106(5), 89–94.
Lempert, Robert J., Popper, Steven W, & Bankes, Steven C. 2003. Shaping the Next
One Hundred Years: New Methods for Quantitative, Long-Term Policy Analysis.
Rand Corporation.
Levin, Todd, & Thomas, Valerie M. 2016. Can developing countries leapfrog the
centralized electrification paradigm? Energy for Sustainable Development, 31,
97–107.

BIBLIOGRAPHY 252
Levy, Jack S . 1992. Prospect Theory and International Relations : Theoretical
Applications and Analytical Problems. Political Psychology, 13(2), 283–310.
Levy, Jack S . 1994. Learning and Foreign Policy : Sweeping a Conceptual Minefield.
International Organization, 48(2), 279–312.
Lindblom, Charles E. 1959. The Science of Muddling Through. Public Administration
Review, 19(2), 79–88.
Loken, E. 2007. Use of multicriteria decision analysis methods for energy planning
problems. Renewable and Sustainable Energy Reviews, 11(7), 1584–1595.
Lucas, Paul L., Nielsen, Jens, Calvin, Katherine, McCollum, David L., Marangoni,
Giacomo, Strefler, Jessica, van der Zwaan, Bob C C, & van Vuuren, Detlef P. 2015.
Future energy system challenges for Africa: Insights from Integrated Assessment
Models. Energy Policy, 86, 705–717.
Lynn, Laurence E. 1999. A Place at the Table : Policy Analysis , Its the Future of
Practice and Postpositive Critics ,. Journal of Policy Analysis and Management,
18(3), 411–425.
Lyon, David R., Alvarez, Ramon A., Zavala-Araiza, Daniel, Brandt, Adam R., Jack-
son, Robert B., & Hamburg, Steven P. 2016. Aerial Surveys of Elevated Hydro-
carbon Emissions from Oil and Gas Production Sites. Environmental Science and
Technology, 50(9), 4877–4886.
Manne, Alan S. 1984. GTM: An International Gas Trade Model. Stanford Univ.
Manne, AS, & Richels, RG. 1978. A Decision Analysis of the U.S. Breeder Reactor
Program. Energy, 3, 747–767.
Manne, AS, Richels, RG, & Weyant, John P. 1979. Energy Policy Modeling: A
Survey. Operations Research, 27(1), 1–36.
Manson, Steven M. 2001. Simplifying complexity: a review of complexity theory.
Geoforum, 32(3), 405–414.

BIBLIOGRAPHY 253
March, JG, & Olsen, JP. 2006. Elaborating the new institutionalism.
Masse, P., & Gibrat, R. 1957. Application of Linear Programming to Investments in
the Electric Power Industry. Management Science, 3(October), 149–166.
Mayer, Igor S, van Daalen, C Els, & Bots, Pieter W G. 2013. Perspectives on policy
analysis: A framework for understanding and design. Pages 41–64 of: Public Policy
Analysis. Springer.
McCollum, David L. 2012. The IIASA EnergyMulti Criteria Analysis Tool (ENE-
MCA). Tech. rept. IIASA.
McCollum, David L., Krey, Volker, Riahi, Keywan, Kolp, Peter, Grubler, Arnulf,
Makowski, Marek, & Nakicenovic, Nebojsa. 2013. Climate policies can help resolve
energy security and air pollution challenges. Climatic Change, 119(2), 479–494.
Medlock, Kb, Jaffe, Am, & Hartley, Pr. 2011. Shale gas and US national security.
Tech. rept. 49. Baker Institute Policy Report.
Merrick, James. 2017. No Title. Ph.D. thesis, Stanford University.
Messner, S., Golodnikov, a., & Gritsevskii, a. 1996. A stochastic version of the
dynamic linear programming model MESSAGE III. Energy, 21(9), 775–784.
Metcalf, GE, & Stock, James. 2017. Integrated Assessment Models and the Social
Cost of Carbon: A Review and Assessment. Review of Environmental Economics
and Policy, 11(1), 80–99.
Mintz, Alex, & DeRouen Jr, Karl. 2010. Understanding foreign policy decision mak-
ing. Cambridge University Press.
Mintz, Alex, Geva, Nehemia, & Derouen Jr, Karl. 1994. Mathematical Models of
Foreign Policy Decision- Making: Compensatory vs Noncompensatory. Synthese:
An International Journal for Epistemology, Methodology and Philosophy of Science,
100(3), 441–460.
BIBLIOGRAPHY 254
Modi, Vijay, McDade, Susan, Lallement, Dominique, & Saghir, Jamal. 2005. Energy
Services for the Millennium Development Goals. Tech. rept. Millenium Project,
United Nations Development Programme, World Bank Group, Energy Sector Man-
agement Assistance Programme.
Moreno, Alejandro, & Bareisaite, Asta. 2015. Scaling Up Access to Electricity: Pay-
as-You-Go Plans in Off-Grid Energy Services. Livewire, 1–8.
Morgan, M Granger. 2003. Characterizing and dealing with uncertainty: insights
from the integrated assessment of climate change. Integrated Assessment, 4(1),
46–55.
Morgan, M Granger, & Henrion, M. 1990. Uncertainty: a Guide to dealing with un-
certainty in quantitative risk and policy analysis. New York, New York: Cambridge
University Press.
Morgan, M. Granger, & Keith, David W. 2008. Improving the way we think about
projecting future energy use and emissions of carbon dioxide. Climatic Change,
90(3), 189–215.
Munson, Richard. 2004. Predicting Energy Futures. The Electricity Journal, 70–79.
Murphy, Frederic, Pierru, Axel, Smeers, Yves, Murphy, Frederic, Pierru, Axel,
& Smeers, Yves. 2016. A Tutorial on Building Policy Models as Mixed-
Complementarity Problems. Interfaces, Articles i(May), 1–17.
Nakata, Toshihiko. 2004. Energy-economic models and the environment. Progress in
Energy and Combustion Science, 30(4), 417–475.
National Research Council. 2011. Intelligence analysis: Behavioral and social scien-
tific foundations. National Academies Press.
New Climate Economy. 2014. Better Growth Better Climate. Tech. rept. New Climate
Economy.

BIBLIOGRAPHY 255
Newell, Peter. 2011. The Governance of Energy Finance: The Public, the Private
and the Hybrid. Global Policy, 2(SUPPL.1), 94–105.
Nordhaus, William D. 2014. The perils of the learning model for modeling endogenous
technological change. Energy Journal, 35(1), 1–13.
Nussbaumer, Patrick, Bazilian, Morgan, & Modi, Vijay. 2012. Measuring energy
poverty: Focusing on what matters. Renewable and Sustainable Energy Reviews,
16(1), 231–243.
O’Donoughue, Patrick R., Heath, Garvin A., Dolan, Stacey L., & Vorum, Martin.
2014. Life Cycle Greenhouse Gas Emissions of Electricity Generated from Conven-
tionally Produced Natural Gas: Systematic Review and Harmonization. Journal
of Industrial Ecology, 18(1), 125–144.
Pachauri, Shonali. 2011. Reaching an international consensus on defining modern
energy access. Current Opinion in Environmental Sustainability, 3(4), 235–240.
Pachauri, Shonali, & Spreng, Daniel. 2011. Measuring and monitoring energy poverty.
Energy Policy, 39(12), 7497–7504.
Pachauri, Shonali, van Ruijven, Bas J, Nagai, Yu, Riahi, Keywan, van Vuuren,
Detlef P, Brew-Hammond, Abeeku, & Nakicenovic, Nebojsa. 2013. Pathways to
achieve universal household access to modern energy by 2030. Environmental Re-
search Letters, 8(2), 8.
Pascual, Carlos. 2015. The New Geopolitics of Energy. Foreign Policy, September,
37.
Pascual, Carlos, & Elkind, Jonathan. 2010. Energy security: economics, politics,
strategies, and implications. Brookings Institution Press.
Peace, Janet, & Weyant, John P. 2008. Insights Not Numbers: The Appropriate Use
of Economic Models. Tech. rept. April. Pew Center.

BIBLIOGRAPHY 256
Phadke, Amol, Jacobson, Arne, Park, Won Young, Lee, Ga Rick, Alstone, Peter, &
Khare, Amit. 2015. Powering a Home with Just 25 Watts of Solar PV: Super-
Efficient Appliances Can Enable Expanded Off-Grid Energy Service Using Small
Solar Power Systems. Tech. rept. April 2015. Lawrence Brekeley National Labora-
tory, Berkeley, CA.
Pidd, Michael. 1999. Just modeling through: A rough guide to modeling. Interfaces,
29(2), 118–132.
Pindyck, Robert S. 2017. The Use and Misuse of Models for Climate Policy. Review
of Environmental Economics and Policy, 11(1), 100–114.
Pohekar, S.D., & Ramachandran, M. 2004. Application of multi-criteria decision
making to sustainable energy planningA review. Renewable and Sustainable Energy
Reviews, 8(4), 365–381.
Powell, Robert. 1999. In the shadow of power: States and strategies in international
politics. Princeton University Press.
Powell, W B, George, A, Simao, H, Scott, W, Lamont, A, & Stewart, J. 2012. SMART:
A Stochastic Multiscale Model for the Analysis of Energy Resources, Technology,
and Policy. Informs Journal on Computing, 24(4), 665–682.
Powell, Wb. 2014. Clearing the Jungle of Stochastic Optimization. Informs TutORi-
als, 1–37.
Power Africa. 2015. A Guide to Reaching 30,000 Megawatts and 60 Million Connec-
tions. Tech. rept. U.S. Agency for International Development.
Power Africa. 2016. Understanding Natural Gas and LNG Options. Tech. rept. U.S.
Agency for International Development.
Practical Action. 2010. Poor People’s Energy Outlook 2010. Tech. rept. Practical
Action, Rugby, UK.

BIBLIOGRAPHY 257
Practical Action. 2013. Poor People’s Energy Outlook 2013. Tech. rept. Practical
Action.
Practical Action. 2014. Poor People’s Energy Outlook 2014. Tech. rept. Practical
Action.
Quade, Edward S, & Carter, Grace M. 1989. Analysis for public decisions. MIT
Press.
Quade, E.S. 1964. Analysis for Military Decisions. Tech. rept. RAND.
Quade, E.S., & I.Boucher, W. 1968. Systems Analysis and Policy Planning: Appli-
cations in Defense. Tech. rept. RAND.
Quist, Jaco. 2007. Backcasting for a sustainable future: the impact after 10 years.
Eburon Uitgeverij BV.
Ramachandran, Vijaya, Gelb, Alan H, & Shah, Manju Kedia. 2009. Africa’s Private
Sector: What’s Wrong with the Business Environment and what to Do about it.
CGD Books.
Rawlings, Laura B., & Rubio, Gloria M. 2005. Evaluating the impact of conditional
cash transfer programs. World Bank Research Observer, 20(1), 29–55.
Rhodes, Edward. 1994. Do bureaucratic politics matter? Some disconfirming findings
from the case of the US Navy. World Politics, 47(01), 1–41.
Richter, Philipp M., & Holz, Franziska. 2015. All quiet on the eastern front? Disrup-
tion scenarios of Russian natural gas supply to Europe. Energy Policy, 80.
Rogner, Hans-Holger, Aguilera, Roberto F, Archer, Christina, Bertani, Ruggero,
Bhattacharya, S C, Dusseault, Maurice B, Gagnon, Luc, Haberl, Helmut, Hoogwijk,
Monique, Johnson, Arthur, Rogner, Mathis Leung, Wagner, Horst, & Yakushev,
Vladimir. 2012. Chapter 7 - Energy Resources and Potentials. Pages 423–512 of:
Global Energy Assessment - Toward a Sustainable Future. Cambridge University
Press, Cambridge, UK and New York, NY, USA and the International Institute for
Applied Systems Analysis, Laxenburg, Austria: IIASA.

BIBLIOGRAPHY 258
Rosenau, James N. 1968. National interest. International encyclopedia of the social
sciences, 11, 34–40.
Sanchez, T. 2010. The Hidden Energy Crisis: How Policies are Failing the World’s
Poor. Rugby, UK: Practical Action Publishing.
Savage, Sam L, & Markowitz, Harry M. 2009. The flaw of averages: Why we under-
estimate risk in the face of uncertainty. John Wiley & Sons.
Schneider, Stephen H. 1997. Integrated assessment modeling of global climate change:
Transparent rational tool for policy making or opaque screen hiding value-laden
assumptions? Environmental Modeling and Assessment, 2(4), 229–249.
Schwartz, Peter. 1996. The art of the long view: paths to strategic insight for yourself
and your company. Random House LLC.
Schwartz, Peter, & Randall, Doug. 2003. An Abrupt Climate Change Scenario and Its
Implications for United States National Security. Tech. rept. October. Jet Propul-
sion Laboratory, Pasadena, CA.
SE4ALL. 2015. Scaling Up Finance for Sustainable Energy Investments. Tech. rept.
Report of SE4ALL Advisory Board’s Finance Committee.
Shearer, Christine, Bistline, John, Inman, Mason, & Davis, Steven J. 2014. The effect
of natural gas supply on US renewable energy and CO 2 emissions. Environmental
Research Letters, 9(9), 1–8.
Simon, Herbert A. 1957. Models of man; social and rational. Wiley.
Simon, Herbert A. 1959. Theories of decision-making in economics and behavioral
science. The American economic review, 49(3), 253–283.
Skone, Timothy J. 2014. Life cycle greenhouse gas perspective on exporting lique-
fied natural gas from the United States. Tech. rept. National Energy Technology
Laboratory, PITTSBURGH.

BIBLIOGRAPHY 259
Smil, V, & Knowland, W E (eds.). 1980. Energy in the developing world: the real
energy crisis. New York: Oxford University Press.
Snyder, Glenn, & Diesing, Paul. 1977. Conict among nations. Bargaining, decision
making, and system.
Snyder, Richard Carlton. 1954. Decision-making as an Approach to the Study of
International Politics. Organizational Behavior Section, Princeton University.
Snyder, Richard Carlton, Bruck, Henry W, Sapin, Burton, Hudson, Valerie M, Chol-
let, Derek H, & Goldgeier, James M. 2002. Foreign Policy Decision Making.
Springer.
Sovacool, Benjamin K. 2014. Defining, Measuring, and Tackling Energy Poverty.
Chap. 2 of: Halff, Antoine, Sovacool, Benjamin K., & Rozhon, Jon (eds), Energy
Poverty: Global Challenges and Local Solutions. Oxford University Press.
Sovacool, Benjamin K., & Mukherjee, Ishani. 2011. Conceptualizing and measuring
energy security: A synthesized approach. Energy, 36(8), 5343–5355.
Sovacool, Benjamin K., Valentine, Scott Victor, Jain Bambawale, Malavika, Brown,
Marilyn A., de Fatima Cardoso, Terezinha, Nurbek, Sayasat, Suleimenova,
Gulimzhan, Li, Jinke, Xu, Yang, Jain, Anil, Alhajji, A. F., & Zubiri, Andrew.
2012a. Exploring propositions about perceptions of energy security: An interna-
tional survey. Environmental Science and Policy, 16, 44–64.
Sovacool, Benjamin K., Cooper, Christopher, Bazilian, Morgan, Johnson, Katie,
Zoppo, David, Clarke, Shannon, Eidsness, Jay, Crafton, Meredith, Velumail, Thiya-
garajan, & Raza, Hilal A. 2012b. What moves and works: Broadening the consid-
eration of energy poverty. Energy Policy, 42, 715–719.
Stokes, David, & Spinks, Olly. 2016. Timera Energy.
Strachan, Neil, Fais, Birgit, & Daly, Hannah. 2016. Reinventing the energy mod-
ellingpolicy interface. Nature Energy, 1(February), 16012.
BIBLIOGRAPHY 260
Szabo, S., Bodis, K., Huld, T., & Moner-Girona, M. 2013. Sustainable energy plan-
ning: Leapfrogging the energy poverty gap in Africa. Renewable and Sustainable
Energy Reviews, 28, 500–509.
Tetlock, Philip. 2005. Expert political judgment: How good is it? How can we know?
Princeton University Press.
Thissen, Wil A. H., & Walker, Warren E. 2013. Public Policy Analysis. Vol. 179.
Springer.
Torgerson, Douglas. 1986. Between Knowledge and Politics : Three Faces of Policy
Analysis. Policy Sciences, 19(1), 33–59.
Trimble, Chris. 2016. Financial Viability of Electricity Sectors in Sub-Saharan Africa
Quasi-Fiscal Deficits and Hidden Costs. Tech. rept. 7788. World Bank Group.
Trutnevyte, Evelina. 2016. Does cost optimization approximate the real-world energy
transition? Energy, 106, 182–193.
Tversky, Amos, & Kahneman, Daniel. 1974. Judgment under Uncertainty : Heuristics
and Biases. Science, 185, 1124–1131.
Tversky, Amos, & Kahneman, Daniel. 1992. Advances in prospect theory: Cumulative
representation of uncertainty. Journal of Risk and uncertainty, 5(4), 297–323.
UNDP. 2007. Human Development Report Fighting Climate Change: Human Soli-
darity in a Divided World. Tech. rept. United Nations Development Programme,
New York.
UNDP and WHO. 2009. The Energy Access Situation in Developing Countries. Tech.
rept. United National Development Programme and the World Health Organiza-
tion, New York.
UNGA. 2012. International Year of Sustainable Energy for All, 2012 Report of the
Secretary-General. Tech. rept. United Nations General Assemby, New York.
BIBLIOGRAPHY 261
UNGA. 2014. United Nations Decade of Sustainable Energy for All. Tech. rept.
United Nations General Assemby, New York.
UNGA. 2015. Resolution adopted by the General Assembly on 25 September 2015.
Tech. rept. United Nations General Assemby, New York.
van der Heijden, Kees. 1996. Scenarios: The Art of Strategic Conversation. Wiley.
Vaughan, Diane. 1996. The Challenger Launch Decision. University of Chicago Press.
Victor, David G. 2009. The Politics of Fossil-Fuel Subsidies. Tech. rept. Global
Subsidies Initiative and International Instiute for Sustainable Development.
von Neumann, J, & Morgenstern, Oskar. 1944. Theory of games and economic be-
havior.
Wack, Pierre. 1985a. Scenarios: shooting the rapids. Harvard Business Review, 63,
139–150.
Wack, Pierre. 1985b. Scenarios: uncharted waters ahead. Harvard Business Review,
63, 73–89.
Walker, Warren E, Harremoes, Poul, Rotmans, Jan, van der Sluijs, Jeroen P, van
Asselt, Marjolein B A, Janssen, Peter, & Krayer von Krauss, Martin P. 2003.
Defining uncertainty: a conceptual basis for uncertainty management in model-
based decision support. Integrated assessment, 4(1), 5–17.
Wang, Jiang-Jiang, Jing, You-Yin, Zhang, Chun-Fa, & Zhao, Jun-Hong. 2009. Re-
view on multi-criteria decision analysis aid in sustainable energy decision-making.
Renewable and Sustainable Energy Reviews, 13(9), 2263–2278.
Washburn, Alan. 1994. Chapter 4 Military operations research. Handbooks in Oper-
ations Research and Management Science, 6, 67–106.
Webster, Mort, Santen, Nidhi, & Parpas, Panos. 2012. An approximate dynamic pro-
gramming framework for modeling global climate policy under decision-dependent
uncertainty. Computational Management Science, 9(3), 339–362.

BIBLIOGRAPHY 262
Weyant, John. 2017. Some Contributions of Integrated Assessment Models of Global
Climate Change. Review of Environmental Economics and Policy, 11(1), 115–137.
Weyant, John P. 2004. Introduction and overview. Energy Economics, 26(4), 501–
515.
Weyant, John P. 2009. A perspective on integrated assessment. Climatic Change,
95(3-4), 317–323.
Weyant, John P, Weyant, John P, Olavson, Thomas, Olavson, Thomas, Modeling,
Energy, Modeling, Energy, Working, Forum, Working, Forum, Modeling, Environ-
mental, & Modeling, Environmental. 1999. Issues in Modeling Induced Technolog-
ical Change in Energy, Environment, and Climate Policy. Environmental Modeling
and Assessment, 4, 67–85.
WHO. 2006. Fuel for Life. Tech. rept. World Health Organization, Geneva.
Wigley, Tom M L. 2011. Coal to gas: The influence of methane leakage. Climatic
Change, 108(3), 601–608.
Wilkinson, Angela, & Kupers, Roland. 2013. Living in the Futures. Harvard Business
Review, 91(5), 118–127.
Winzer, Christian. 2012. Conceptualizing energy security. Energy Policy, 46, 36–48.
Wolfram, Catherine, Shelef, Orie, & Gertler, Paul. 2012. How Will Energy Demand
Develop in the Developing World? The Journal of Economic Perspectives, 26(1),
119–138.
World Bank. 2008. World Development Report 2008: Agriculture for Development.
Tech. rept. World Bank Group, Washington, D.C.
World Bank. 2010. Addressing the Electricity Access Gap. Tech. rept. June. World
Bank Group, Washington, D.C.
Youngs, Richard. 2009. Energy security: Europe’s new foreign policy challenge. Rout-
ledge.
BIBLIOGRAPHY 263
Zavala-Araiza, Daniel, Lyon, David R, Alvarez, Ramon A, Davis, Kenneth J, Har-
riss, Robert, Herndon, Scott C, Karion, Anna, Kort, Eric Adam, Lamb, Brian K,
Lan, Xin, Marchese, Anthony J, Pacala, Stephen W, Robinson, Allen L, Shepson,
Paul B, Sweeney, Colm, Talbot, Robert, Townsend-Small, Amy, Yacovitch, Tara I,
Zimmerle, Daniel J, & Hamburg, Steven P. 2015. Reconciling divergent estimates
of oil and gas methane emissions. Proceedings of the National Academy of Sciences,
112(51), 15597–15602.
Zegart, Amy. 2011. Implementing change: Organizational challenges. National Re-
search Council, Intelligence Analysis for Tomorrow: Behavioral and Social Scien-
tific Foundations, 309–329.
Zegart, Amy B. 2005. September 11 and the Adaptation Failure of U.S. Intelligence
Agencies. International Security, 29(4), 78–111.
Zegart, Amy B. 2007. Spying Blind: The CIA, the FBI, and the Origins of 9/11.
Princeton University Press.
Zhang, Xiaochun, Myhrvold, Nathan P, & Caldeira, Ken. 2014. Key factors for assess-
ing climate benefits of natural gas versus coal electricity generation. Environmental
Research Letters, 9(11), 1–8.
Zhou, P, Ang, B, & Poh, K. 2006. Decision analysis in energy and environmental
modeling: An update. Energy, 31(14), 2604–2622.