Embed Size (px)
Citation preview

RESEARCH ARTICLE
Modeling enamel matrix secretion in
mammalian teeth
Teemu J. Hakkinen1,2*, S. Susanna Sova1,3, Ian J. Corfe1, Leo TjaderhaneID4,
Antti Hannukainen2, Jukka JernvallID1*
1 Developmental Biology Program, Institute of Biotechnology, University of Helsinki, Helsinki, Finland,
2 Department of Mathematics and Systems Analysis, Aalto University, Espoo, Finland, 3 Department of
Geosciences and Geography, University of Helsinki, Helsinki, Finland, 4 Department of Oral and Maxillofacial
Diseases, Helsinki University Hospital, University of Helsinki, Helsinki, Finland
* [email protected] (TJH); [email protected] (JJ)
Abstract
The most mineralized tissue of the mammalian body is tooth enamel. Especially in species
with thick enamel, three-dimensional (3D) tomography data has shown that the distribution
of enamel varies across the occlusal surface of the tooth crown. Differences in enamel thick-
ness among species and within the tooth crown have been used to examine taxonomic affili-
ations, life history, and functional properties of teeth. Before becoming fully mineralized,
enamel matrix is secreted on the top of a dentine template, and it remains to be explored
how matrix thickness is spatially regulated. To provide a predictive framework to examine
enamel distribution, we introduce a computational model of enamel matrix secretion that
maps the dentine topography to the enamel surface topography. Starting from empirical
enamel-dentine junctions, enamel matrix deposition is modeled as a diffusion-limited free
boundary problem. Using laboratory microCT and synchrotron tomographic data of pig
molars that have markedly different dentine and enamel surface topographies, we show
how diffusion-limited matrix deposition accounts for both the process of matrix secretion and
the final enamel distribution. Simulations reveal how concave and convex dentine features
have distinct effects on enamel surface, thereby explaining why the enamel surface is not a
straightforward extrapolation of the dentine template. Human and orangutan molar simula-
tions show that even subtle variation in dentine topography can be mapped to the enamel
surface features. Mechanistic models of extracellular matrix deposition can be used to pre-
dict occlusal morphologies of teeth.
Author summary
Teeth of most mammals are covered by a layer of highly mineralized enamel that cannot
be replaced or repaired. The enamel layer is not uniform over the underlying dentine, and
spatial regulation of enamel formation is critical for making a functional tooth. To explore
which kind of mechanisms could underlie the complex patterns of enamel distribution,
we present a computational model. Starting from tomography-imaged teeth from which
enamel has been digitally removed, enamel is restored on dentine surfaces by simulating
PLOS Computational Biology | https://doi.org/10.1371/journal.pcbi.1007058 May 29, 2019 1 / 12
a1111111111
a1111111111
a1111111111
a1111111111
a1111111111
OPEN ACCESS
Citation: Hakkinen TJ, Sova SS, Corfe IJ,
Tjaderhane L, Hannukainen A, Jernvall J (2019)
Modeling enamel matrix secretion in mammalian
teeth. PLoS Comput Biol 15(5): e1007058. https://
doi.org/10.1371/journal.pcbi.1007058
Editor: Qing Nie, University of California Irvine,
UNITED STATES
Received: February 5, 2019
Accepted: April 29, 2019
Published: May 29, 2019
Copyright: © 2019 Hakkinen et al. This is an open
access article distributed under the terms of the
Creative Commons Attribution License, which
permits unrestricted use, distribution, and
reproduction in any medium, provided the original
author and source are credited.
Data Availability Statement: All relevant data are
within the manuscript, its Supporting Information
files, and at https://github.com/tjhakkin/biomatrix.
Funding: This work was supported by the
Academy of Finland (http://www.aka.fi/en, 307421)
to JJ and Vilho, Yrjo and Kalle Vaisala Foundation
to TJH. The funders had no role in study design,
data collection and analysis, decision to publish, or
preparation of the manuscript.
Competing interests: The authors have declared
that no competing interests exist.

diffusion-limited secretion of enamel matrix. Our simulations show how the combination
of subtle features of dentine and diffusion-limited secretion of the enamel matrix can sub-
stantially increase the complexity of the enamel surface. We propose that the strength of
the diffusion-limited process is a key factor in determining enamel distribution among
mammalian species.
Introduction
Most mammalian species have their teeth covered by a layer of highly mineralized enamel.
The thickness of the enamel layer relative to the tooth size ranges from thin to very thick.
These differences among species, and also increasingly within the tooth crown, have been
informative in studies focused on functional properties of teeth, taxonomy, and life history [1–
9]. Even though mutations in genes required for enamel matrix secretion and maturation are
known to affect the enamel thickness in mammals [10], relatively little is known about the reg-
ulatory changes that might underlie the variation in enamel thickness among populations or
species [1, 11, 12]. Even less is known about the regulation of enamel thickness variation
within the tooth crown, which contrasts with the increasing availability of 3D tomography
data on various species. Analyses of such tomography data show that even though the enamel
surface topography reflects the enamel-dentine junction (EDJ) topography, the enamel surface
is not a simple extrapolation of the EDJ shape [13–15]. Because enamel distribution is not
developmentally remodeled after formation, and because the internal structure of mineralized
enamel retains developmental information, tomography data of fully formed teeth can be used
to examine mechanisms underlying variation in enamel thickness. To provide mechanistic
insights into the regulation of enamel thickness, here we combine tomography data on enamel
distribution with a computational approach and introduce a model to simulate enamel matrix
secretion.
Results
The model principles and simulation of artificial shapes
The enamel matrix is secreted by specialized epithelial cells, the ameloblasts. When the matrix
secretion begins, ameloblasts detach from the EDJ and advance as a front secreting the enamel
matrix that will later mineralize into the enamel (Fig 1A). The EDJ is defined by the mesenchy-
mal dentine matrix, whose secretion begins first (Fig 1A). For empirical tests, we used EDJs of
real teeth as the starting point to simulate matrix secretion. Matrix deposition is modeled as a
diffusion-limited free boundary problem, motivated by the classical Stefan problem that mod-
els phase transition of undercooled liquid by assuming that the rate of phase transition from
liquid to solid is limited by a diffusion process (see Methods and S1 Appendix) [16, 17]. Here
we similarly assume that the growth of the matrix front is a diffusion-limited process: The
advancement of the ameloblast layer is assumed to be limited by the diffusion of nutrients, by
which we refer collectively to all the factors that ameloblasts require for the secretion of the
matrix (Fig 1B). Biologically, both the extracellular milieu and capillary networks present in
the enamel organ during matrix secretion [18, 19] can be hypothesized to limit the supply of
nutrients in a diffusion-limited fashion. The model parameters adjust the nutrient diffusion
rate, the amount of nutrients required for growth, and the interfacial tension or stiffness of the
advancing ameloblast layer (Methods). Model equations are solved using the finite element
method, and the matrix interface (the ameloblast layer) is tracked using the level set method
Enamel matrix secretion in teeth
PLOS Computational Biology | https://doi.org/10.1371/journal.pcbi.1007058 May 29, 2019 2 / 12

Fig 1. Modeling tooth enamel matrix secretion. (A) A schematic illustration of a cross section of enamel matrix
being secreted on the top of dentine. In real teeth (a pig molar on the right), the enamel surface is not a linear
representation of the dentine template (EDJ). (B) In a diffusion-limited model, differences in surface topography lead
to ridges (black circle) receiving more nutrients (dashed arrows) than valleys (white circle). (C) Starting from a
synthetic EDJ shape, diffusion-limited matrix deposition advances faster in convex than concave features. (D) Excess
production of nutrients overcomes diffusion-limited effects and produces a uniform distribution of matrix. (E)
Reducing interfacial tension of the simulation in (C) results in a crenulated matrix surface. For details of the model, see
Methods, and parameters used in simulation are in S1 Table.
https://doi.org/10.1371/journal.pcbi.1007058.g001
Fig 2. Diffusion-limited simulations approximate complex patterns of enamel thickness in the pig molar. (A) A
heat map and a horizontal section of 3D tomography reconstruction of a pig molar shows the variable enamel
thickness. (B) Using a horizontal EDJ section of a pig molar as an empirical template (A), diffusion-limited simulations
of matrix secretion produce deep fissures present in concave surfaces. (C) Geometric extrapolation shows how the
fissures are filled-in. In contrast, convex slopes are relatively similar between the simulations. Note how the enamel is
redirected and remains separated between the buccal and lingual cusps in the real tooth (A) and diffusion-limited
simulation (B). All images show occlusal views of the left lower first molar. Simulations run until the lateral matrix
thicknesses approximate the empirical enamel thicknesses, see Methods, and for parameters S1 Table. Scale bar, 5 mm.
https://doi.org/10.1371/journal.pcbi.1007058.g002
Enamel matrix secretion in teeth
PLOS Computational Biology | https://doi.org/10.1371/journal.pcbi.1007058 May 29, 2019 3 / 12
(S1 Appendix). The source code of the MATLAB implementation of the model is freely avail-
able (Methods). For computational efficiency, the model is implemented in 2D and 3D recon-
structions are obtained by simulating multiple sections that are combined into volumes.
The fundamental component of the model is the assumption that the growth of the
matrix requires a net influx of a diffusing nutrient substance. At the initial stage nutrients
are present exterior to the dentine, which in real teeth, acts as an internal nutrient barrier
[18]. The nutrients are further replenished over time by a constant background source exte-
rior to the dentine (Methods). By controlling the relative amount of background produc-
tion, we examine two hypothetical matrix secretion processes. The primary process tested is
a diffusion-limited secretion in which concave surfaces are progressively exaggerated as the
features protruding into the nutrient-rich domain receive more nutrients than the concavi-
ties (Fig 1C). An alternative process assumes excess availability of nutrients through strong
background production, leading to a moving boundary of uniform thickness (Fig 1D). This
latter process in fact closely approximates a simple geometric extrapolation of matrix thick-
ness from the EDJ, which we use as a null hypothesis to demonstrate the non-linearity of
the matrix deposition. Simulations of matrix secretion using a synthetic EDJ shape show
that whereas convex EDJ surfaces result in relatively linear extrapolation of the enamel sur-
face in both simulations (Fig 1C and 1D), concave surfaces of diffusion-limited simulations
behave nonlinearly (Fig 1C). Additionally, reducing interfacial tension in the simulations
increases small undulations in the moving front (Fig 1E), suggesting that lowered stiffness
of the ameloblast layer may underlie crenulated enamel found in taxa such as Chiropotes(saki monkeys) with relatively smooth EDJ [14]. Next we applied the model to real teeth
with convex and concave features (Fig 2A).
Diffusion-limited simulations predict enamel distribution on pig molar
teeth
To simulate enamel matrix secretion in real teeth, first we focused on domestic pig molar teeth
which exhibit substantial variation in enamel thickness and EDJ topography (Figs 1A and 2A)
[20]. EDJ and enamel surface shapes were reconstructed from microCT scans of first lower
molars (Fig 2A, Methods). From the data, horizontal slices of cusps were extracted (Fig 2A)
and the EDJs were used as the starting point for the simulations. The horizontal plane repre-
sents a relatively synchronous front of enamel matrix secretion and captures the complex EDJ
morphology of the pig molars [20]. The simulations show that the diffusion-limited process
reproduces the deep narrow furrows or fissures present on the concave sides of the real cusps
(Fig 2A and 2B). In contrast, these features are lost when the enamel matrix is geometrically
extrapolated from the EDJ, or when modeling with excess background nutrients (Fig 2C).
These results support the role of a diffusion-limited-like process in the regulation of enamel
matrix secretion, and underscore the distinct effects that the convex and concave EDJ features
impose on the enamel distribution. Indeed, whereas the overall distribution of convex and
concave features is conserved among molars of individual pigs, small differences in EDJ shape
correspond to large differences in enamel features (Fig 3).
Next we simulated the matrix secretion in a whole cusp with both convex and concave fea-
tures (Methods). A 3D reconstruction of these simulations show that the diffusion-limited
model captures the overall enamel thickness patterns in which concavities show reduced
enamel thickness whereas ridges show increased enamel thickness (Fig 4 and S1 Fig). A small
ridge present in the middle of an EDJ concavity results in a local thickening of the enamel
within an otherwise deep fissure (arrow heads in Fig 4), a feature completely lost in geometri-
cally extrapolated surfaces (Fig 4D).
Enamel matrix secretion in teeth
PLOS Computational Biology | https://doi.org/10.1371/journal.pcbi.1007058 May 29, 2019 4 / 12

Diffusion-limited simulations reproduce the progression of matrix
secretion
In addition to the distribution of enamel in fully formed teeth, the diffusion-limited simula-
tions can be used to examine the progression of the matrix secretion process itself. The succes-
sive positions of the matrix-secreting front during development is recorded in teeth by
Fig 3. Small differences in EDJ shape produce large differences in diffusion-limited simulations. Horizontal slices
of three different entoconid cusps of pig first lower molars and their diffusion-limited simulations using the same
parameter values. Small differences in the size of EDJ ridges (arrowheads) correspond to large differences in enamel
surface shape both in empirical and simulated enamel surfaces. The cusp in the center is 3D-simulated with the same
parameters in Fig 4. Scale bar, 1 mm.
https://doi.org/10.1371/journal.pcbi.1007058.g003
Fig 4. 3D distribution of enamel is predicted by the diffusion-limited model. (A) The EDJ of the pig entoconid cusp
(arrowhead in Fig 2B) has four ridges and only the buccal slope is convex whereas the other slopes are concave. (B) The
enamel surface is thickest around the ridges and the EDJ concavities correspond to deep fissures with thinner enamel.
The enamel cap, which has no EDJ, has been removed from the 3D data. (C) The diffusion-limited matrix simulation,
matched to have the enamel thickness of the convex lateral slope, captures the enamel distribution patterns of the pig
cusp (mean distance to the real surface is 61 μm, maximum difference = 362 μm, s.d. = 66.4). The small ridge present
in the mesial slope of the cusp (arrowhead in the oblique views) corresponds to the narrow ridge of the empirical
enamel surface (4B) and small ridge in an EDJ concavity (4A). (D) Geometric extrapolation from the EDJ results in
relatively uniform 3D matrix thickness (mean distance to the real surface is 80 μm, maximum difference = 467 μm, s.d.
= 92.0). The diffusion-limited simulations were done from 51 individual EDJ slices using the same parameter values
(S1 Table). The thinner enamel in the lower parts of the lingual cusp ridge of the real cusp (towards the bottom in
occlusal view) is due to the vicinity of the adjacent hypoconid cusp. Scale bar, 1 mm.
https://doi.org/10.1371/journal.pcbi.1007058.g004
Enamel matrix secretion in teeth
PLOS Computational Biology | https://doi.org/10.1371/journal.pcbi.1007058 May 29, 2019 5 / 12

incremental lines (laminations or striae of Retzius, [9]) that are broadly analogous to growth
rings in trees [21]. These are preserved in mature enamel and can be observed from thin sec-
tions or through phase contrast synchrotron imaging [22]. We obtained synchrotron data
from a pig molar and compared the positions of individual incremental lines in convex cusp
ridges with the lines in cusp concavities (Fig 5A). Both the virtual incremental lines of diffu-
sion-limited simulations and empirical incremental lines show initially relatively uniform dis-
tances from the EDJ, but this uniformity disappears and the differences between ridges and
valleys become progressively larger as the secretion accelerates in the ridges and slows down in
the valleys (Fig 5). These results suggest that in addition to the final patterns of enamel distri-
bution, the diffusion-limited model captures aspects of the actual secretion process.
Subtle EDJ concavities are sufficient to produce complex enamel surface
features
Domestic pigs are an example of species with relatively pointed molar cusps, allowing the sim-
ulation of matrix secretion in the horizontal plane. In contrast, molars of primates with thick
enamel, including humans, typically have relatively low cusp relief. Therefore, to capture
matrix secretion of human molar morphology, we run the diffusion-limited simulations verti-
cally. Because the enamel secretion period is shorter towards the base of the tooth and the
enamel is therefore thinner, we implemented a nutrient sink at the base to simulate the shorter
secretion period (Methods). The sink decreases the rate of matrix formation towards the base
of the crown (Fig 6A), thereby approximating crown formation and the apical decline in
matrix secretion before the initiation of root development [9]. Biologically, the sink implemen-
tation can be considered a simplification of the crown-tip-to-base growth of the capillaries
providing nutrients [18]. The simulations show the subtle waviness of the human EDJ, with
mainly concave ripple-like features, is enough to produce the characteristic undulations of the
enamel surface (Fig 6B and 6C). These features are further refined by simulations using lateral
braces mimicking the presence of adjacent teeth and alveolar bone (Fig 6B), in agreement with
the suggested role of the surrounding tissues in the regulation of tooth shape and mineraliza-
tion [23, 24]. Taken together, these simulations indicate that even subtle EDJ features present
in many hominids are important for the functional surface morphology of the tooth.
Fig 5. Incremental lines in pig molar tooth show comparable patterns to diffusion-limited matrix lines. (A) Incremental lines (arrowheads) are visible in
a synchrotron imaged fully formed but unerupted cusp of the second lower molar. (B) Diffusion-limited simulation and (C) geometric extrapolation of
matrix show contrasting patterns. The different shades of grey correspond to progressive steps in simulations (every fourth) and geometric extrapolation. (D)
The arrows in Fig 5A, 5B and 5C) show the lines that are used to measure the progression of matrix secretion in the valleys (concave EDJ regions) and ridges
(convex EDJ regions). Both the empirical and diffusion-limited simulations produce progressively thicker matrix in the ridges relative to the valleys (mean
lines shown, error bars denote s.d.). The border size (0.79) was set to produce the empirical enamel thickness using the same number of iterations as in Figs 3
and 4. The target enamel thickness for the simulations was measured from the left side of the cusp. Because the cusp was physically trimmed for synchrotron
imaging, the section is missing the lower side. Scale bar, 1 mm.
https://doi.org/10.1371/journal.pcbi.1007058.g005
Enamel matrix secretion in teeth
PLOS Computational Biology | https://doi.org/10.1371/journal.pcbi.1007058 May 29, 2019 6 / 12
Diffusion-limited matrix secretion increases surface complexity
The hallmark of diffusion-limited aggregation, which is closely related to the present model, is
the fractal geometry, or self-similarity of the outcome [e.g. 25]. Although both the interfacial
tension approximating the stiffness of the ameloblast layer and the background nutrient pro-
duction weaken the fractal-like outcomes in our model, it is still interesting to explore the
fractal nature of the enamel distribution, as it provides a quantitative measure of surface com-
plexity. We contrasted complexities of the contours [26] of human and orangutan molars, the
latter being a species with highly complex enamel distribution (Fig 7A) [14]. Box-counting
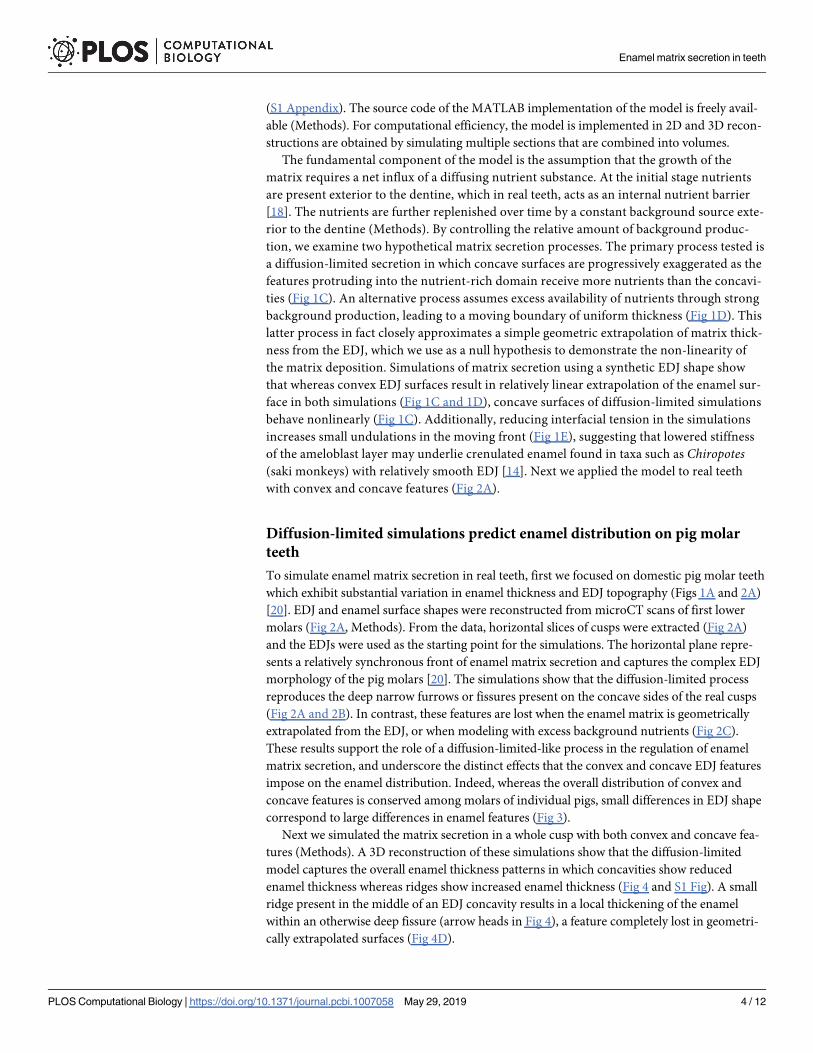
Fig 6. The subtle EDJ topography of human molars is sufficient to produce enamel surface features in diffusion-
limited simulations. (A) To simulate the thick enamel of human molars that also have a low cusp relief, we combined
vertically oriented simulations with a basal nutrient sink. The sink is used to simulate the shorter time of matrix
secretion in the lower parts of the crown. (B) Diffusion-limited simulations reproduce the surface features that are lost
in excess nutrient simulations and geometric extrapolations. Braces mimicking adjacent teeth and bone constrain
lateral expansion of enamel matrix. (C) Obliquely lingual views of empirical and simulated enamel surfaces with a half
of the EDJ (yellow) visible. The diffusion-limited simulations were done from 27 individual EDJ slices using the same
parameter values (S1 Table). The tooth shown is a human third lower molar. Scale bar, 5 mm.
https://doi.org/10.1371/journal.pcbi.1007058.g006
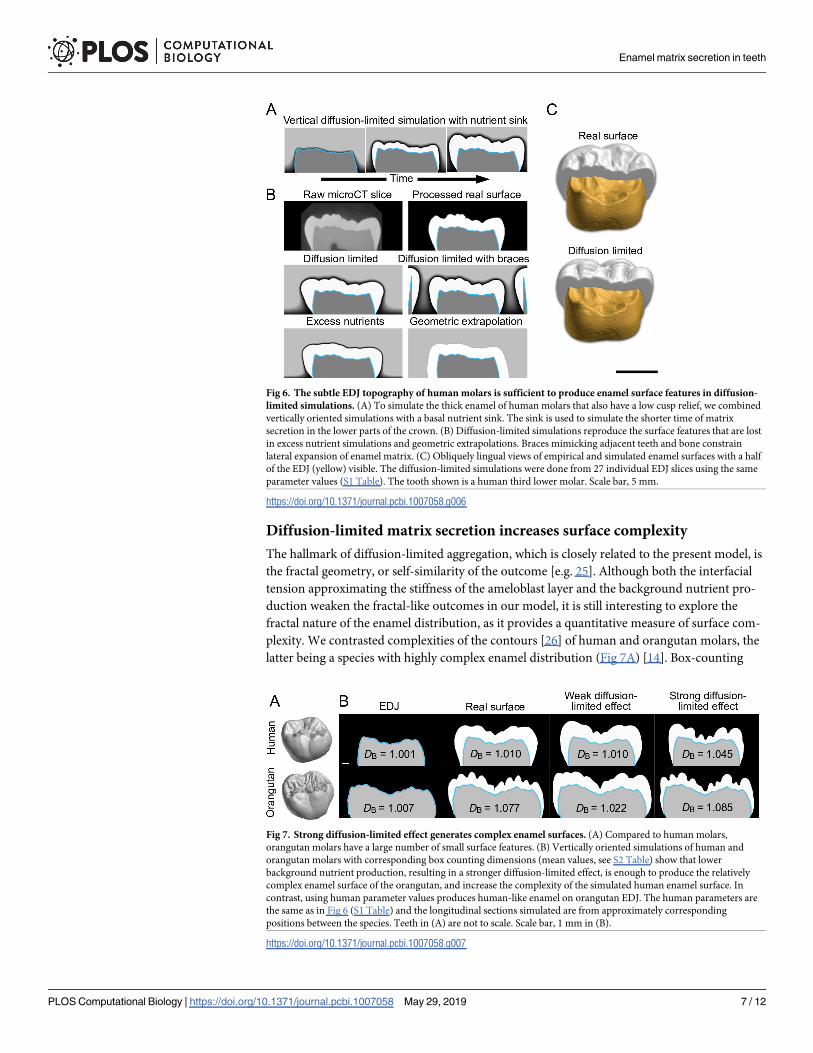
Fig 7. Strong diffusion-limited effect generates complex enamel surfaces. (A) Compared to human molars,
orangutan molars have a large number of small surface features. (B) Vertically oriented simulations of human and
orangutan molars with corresponding box counting dimensions (mean values, see S2 Table) show that lower
background nutrient production, resulting in a stronger diffusion-limited effect, is enough to produce the relatively
complex enamel surface of the orangutan, and increase the complexity of the simulated human enamel surface. In
contrast, using human parameter values produces human-like enamel on orangutan EDJ. The human parameters are
the same as in Fig 6 (S1 Table) and the longitudinal sections simulated are from approximately corresponding
positions between the species. Teeth in (A) are not to scale. Scale bar, 1 mm in (B).
https://doi.org/10.1371/journal.pcbi.1007058.g007
Enamel matrix secretion in teeth
PLOS Computational Biology | https://doi.org/10.1371/journal.pcbi.1007058 May 29, 2019 7 / 12

dimensions (DB) of the human and orangutan molars show that although the enamel surfaces
do not exhibit self-similarity per se, simulations with low background nutrient levels show
stronger diffusion-limited effects (Fig 7B, S2 Table). The main factor determining enamel sur-
face complexity of the orangutan molar appears to be the diffusion-limited effect of matrix
secretion (Fig 7B). Swapping the parameter values of the human and orangutan simulations
(S1 Table) produces orangutan-like enamel on human EDJ and human-like enamel on orang-
utan EDJ (Fig 7B, S2 Table). In contrast, excess background nutrient production results in no
increase in enamel complexity relative to the EDJ in either of the species (S2 Table), indicating
that diffusion-limited matrix secretion is required for the increase in surface complexity.
Discussion
Our diffusion-limited model suggests an objective basis for mapping the EDJ morphology to
enamel surface morphology. The simulations point to the critical role of the diffusion-limited
effect of matrix secretion in increasing tooth surface complexity and, together with convex and
concave EDJ features, in fine-tuning the shape of the enamel surface. Previously the rate of
matrix secretion has been reported to be highest in the outer parts of the enamel [9, 27]. The
result is supported by our simulations and synchrotron data, but only in the convex parts of
the crown (Fig 4). Nevertheless, complex patterns of enamel thickness on a tooth crown can
result from a single developmental process, without the need to evoke specific control or expla-
nations for the thickness of individual features. Combined with in-depth analyses of enamel
formation rates [4, 9, 27] and isotope compositions [28, 29] obtainable from sections, our
model should help to move studies using enamel thickness towards more mechanistic and pre-
dictive science. The model also points to the need to investigate the role of extracellular space
and capillaries in regulating diffusion, and to the potential effects of cell-cell tension in the
ameloblast layer [30]. Our approach should also be applicable to other systems with extracellu-
lar matrix secretion, or organs in which directional tissue growth may be limited by a diffusion
process. Diffusion-limited free boundary problems have a long history in mathematics [16, 17,
31], and as shown here, they can contribute to solving biological problems.
Materials and methods
Ethics statement
The study uses material collected previously and deposited in Institute of Biotechnology and
museum collections.
Diffusion-limited model
We solve the model using a finite element method algorithm presented in [32]. The model is
motivated by the classical Stefan problem [16, 17], and our formulation follows the main prin-
ciples of the problem with some modifications. The model does not consider individual cells
in the system, rather it treats both the enamel matrix and the dentin as continuums. Funda-
mentally, we are solely focused on how a 1-manifold interface representing the ameloblast
front on a cross-sectional plane evolves over time subject to interfacial tension and restricted
flow of nutrients. For mathematical and implementation details, see S1 Appendix. The
MATLAB source code is available at https://github.com/tjhakkin/biomatrix.
Dental data and processing
Pig and human molar samples are described in [20] and the orangutan sample is from the
Finnish Museum of Natural History (UN2720). The microCT voxel resolutions were 10 to
Enamel matrix secretion in teeth
PLOS Computational Biology | https://doi.org/10.1371/journal.pcbi.1007058 May 29, 2019 8 / 12

24 μm (pig), 17 μm (human), and 32 μm (orangutan). For the analyses, the scans were down-
sampled to 44 μm (pig molars) and 33 μm (human and orangutan molars). Synchrotron data
was collected at beamline ID19 of the European Synchrotron Radiation Facility, with voxel res-
olution 2.24 μm, keV = 91, and 6000 projections in 4x accumulation mode. Synchrotron data
reconstruction used Paganin style single propagation distance phase contrast. All the image
processing steps after primary tomography reconstructions were carried out with Fiji 2.0 [33].
To digitize EDJs for simulations, EDJs in each individual section were traced with a freehand
selection or wand tool, and the area was converted to a line (Edit/Selection/Area to Line). The
line was then interpolated with an interval of 10 pixels (Edit/Selection/Interpolate), fitted to a
spline (Edit/Selection/Fit spline), and adjusted manually to follow the EDJ if needed. The
splines were saved in ROI Manager (Analyze/Tools/ROI manager/more/save). The splines
were saved as XY coordinates (File/Save As/XY Coordinates) that were converted to level sets
using a Python script, included with the source code. During the conversion the spatial node
density and the relative size of the EDJ within the domain were also defined. To scale different
sized EDJs uniformly (e.g., when EDJs become smaller towards the cusp tip), two small trian-
gles placed in diagonally opposing corners were included in each level set conversion. To
enhance the visualization of the incremental lines in synchrotron reconstructions, three adja-
cent slices were averaged.
Simulations and analyses
The main simulation parameters are listed in S1 Table. Simulation output for each step is an
image file. The pig trigonids and talonids were simulated separately (Fig 2B). To compensate
for the isolated entoconid cusp being larger (Fig 3) than when part of the talonid (Fig 2), inter-
facial tension and number of iterations were decreased in the individual cusp simulations. For
simulations of multiple sections, all the sections of the analyzed step were merged into a stack
in Fiji. For the pig molar cusp (Fig 4), every second microCT slice (20 μm interval, 51 slices),
and for the human molar (Fig 6C), every fifth slice (66 μm interval, 27 slices) was simulated.
We used the basal sink to approximate developmental progression in the vertical simulations.
Because intercuspal regions lack the sink, vertical simulations slightly exaggerate enamel thick-
ness in valleys relative to cusp tips. Geometric extrapolation of enamel thickness was obtained
in Fiji by fitting a fixed sized circle along the EDJ (Process/Morphology/Gray Morphology/
Dilate). To visualize enamel thickness in 3D, the EDJ and enamel surfaces were exported from
Fiji (surfaces exported as Wavefront.obj from 3D Viewer plugin) and imported into Meshlab
(http://meshlab.sourceforge.net/). In Meshlab, Hausdorff distance was used to compare dis-
tances between two surfaces [34]. The distances were calculated after smoothing the meshes
with Laplacian smooth (3 steps). All 3D visualizations use orthographic projections.
We calculated box-counting dimensions from microCT slices of human and orangutan
molars. Binary contours were generated after thresholding in Fiji (Process/Binary/Outline)
and analyzed using Fiji FracLac 2.5 plugin [26]. Twelve different starting positions for the
grids were used, and the contours were rotated at 36 degree steps (resulting in total of 120 DB
values for each contour). Default sampling size was used for the scaling method. We analyzed
the contours with (S2 Table) and without the outer walls of the profiles, and the pattern of
results remained the same.
Supporting information
S1 Fig. Enamel area and surface perimeter in horizontal slices of a pig cusp. Whereas both
the diffusion-limited simulation and geometric extrapolation of Fig 4 approximate the amount
of real enamel, only the diffusion-limited simulation reproduces the length of the perimeter of
Enamel matrix secretion in teeth
PLOS Computational Biology | https://doi.org/10.1371/journal.pcbi.1007058 May 29, 2019 9 / 12

the real surface. The drop in enamel perimeter in the diffusion-limited simulation towards the
cusp tip relative to empirical data is due to the horizontal simulations not capturing the rela-
tively round EDJ tip.
(PDF)
S1 Table. EDJ conversion and simulation parameters. Node density denotes the number of
nodes along the longest axes in the regular triangular mesh. ‘Border’ is the proportional size of
the margins surrounding the EDJ shape. ’Base’ sets the y-axis position of the base in simula-
tions using a sink. All EDJ simulations are run with Neumann domain boundaries, except for
the simulations using basal sink for which we use mixed boundaries (Dirichlet/Neumann),
with a fixed time step 0.001. All parameters are dimensionless and their absolute values have
no meaning.
(PDF)
S2 Table. Box-counting dimensions calculated for human and orangutan molar teeth. The
DB values are calculated for the binary outlines of the EDJs and enamel surfaces. The back-
ground nutrient production values for the excess background nutrient, weak and strong diffu-
sion-limited effect simulations are 160, 75, and 30, respectively.
(PDF)
S1 Appendix. A detailed implementation of the diffusion-limited model.
(PDF)
Acknowledgments
We thank H. Suhonen for help with microCT imaging, and J. Laakkonen for help with mate-
rial. We acknowledge the European Synchrotron Radiation Facility for provision of synchro-
tron radiation facilities and thank P. Tafforeau for assistance in using beamline ID19. We
thank M. Fortelius and the members of the Center of Excellence in Experimental and Compu-
tational Developmental Biology Research for discussions or advise.
Author Contributions
Conceptualization: Teemu J. Hakkinen, S. Susanna Sova, Jukka Jernvall.
Data curation: Teemu J. Hakkinen, S. Susanna Sova, Jukka Jernvall.
Funding acquisition: Teemu J. Hakkinen, Jukka Jernvall.
Investigation: Teemu J. Hakkinen, S. Susanna Sova, Ian J. Corfe, Jukka Jernvall.
Methodology: Teemu J. Hakkinen, S. Susanna Sova, Antti Hannukainen, Jukka Jernvall.
Project administration: Jukka Jernvall.
Resources: S. Susanna Sova, Ian J. Corfe, Leo Tjaderhane, Jukka Jernvall.
Software: Teemu J. Hakkinen.
Supervision: Leo Tjaderhane, Antti Hannukainen, Jukka Jernvall.
Validation: Teemu J. Hakkinen, S. Susanna Sova, Jukka Jernvall.
Visualization: Teemu J. Hakkinen, S. Susanna Sova, Jukka Jernvall.
Writing – original draft: Teemu J. Hakkinen, S. Susanna Sova, Jukka Jernvall.
Enamel matrix secretion in teeth
PLOS Computational Biology | https://doi.org/10.1371/journal.pcbi.1007058 May 29, 2019 10 / 12

Writing – review & editing: Teemu J. Hakkinen, S. Susanna Sova, Ian J. Corfe, Leo Tjader-
hane, Antti Hannukainen, Jukka Jernvall.
References1. Schwartz GT. Taxonomic and functional aspects of the patterning of enamel thickness distribution in
extant large-bodied hominoids. Am J Phys Anthropol. 2000; 111:221–244. https://doi.org/10.1002/
(SICI)1096-8644(200002)111:2<221::AID-AJPA8>3.0.CO;2-G PMID: 10640949
2. Grine FE. Enamel Thickness of Deciduous and Permanent Molars in Modern Homo sapiens. Am J
Phys Anthropol. 2005; 126:14–31. https://doi.org/10.1002/ajpa.10277 PMID: 15472923
3. Smith TM, Olejniczak AJ, Martin LB, Reid DJ. Variation in hominoid molar enamel thickness. J Hum
Evol. 2005; 48: 575–592. https://doi.org/10.1016/j.jhevol.2005.02.004 PMID: 15927661
4. Dean MC. Tooth microstructure tracks the pace of human life-history evolution. Proc R Soc B. 2006;
273:2799–2808. https://doi.org/10.1098/rspb.2006.3583 PMID: 17015331
5. Lucas P, Constantino P, Wood B, Lawn B. Dental enamel as a dietary indicator in mammals. BioEs-
says. 2008; 30:374–385. https://doi.org/10.1002/bies.20729 PMID: 18348196
6. Olejniczak AJ, Smith TM, Skinner MM, Grine FE, Feeney RNM, Thackeray JF, et al. Three-dimensional
molar enamel distribution and thickness in Australopithecus and Paranthropus. Biol Lett. 2008; 4:406–
410. https://doi.org/10.1098/rsbl.2008.0223 PMID: 18522924
7. Skinner MM, Alemseged Z, Gaunitz C, Hublin J-J. Enamel thickness trends in Plio-Pleistocene hominin
mandibular molars. J Hum Evol. 2015; 85:35–45. https://doi.org/10.1016/j.jhevol.2015.03.012 PMID:
26024565
8. Pan L, Dumoncel J, de Beer F, Hoffman J, Thackeray JF, Duployer B, et al. Further morphological evi-
dence on South African earliest Homo lower postcanine dentition: Enamel thickness and enamel den-
tine junction. J Hum Evol. 2016; 96:82–96. https://doi.org/10.1016/j.jhevol.2016.05.003 PMID:
27343773
9. Kierdorf H, Breuer F, Witzel C, Kierdorf U. Pig enamel revisited–Incremental markings in enamel of wild
boars and domestic pigs. J Struc Biol. 2019; 205:48–59.
10. Wright JT, Hart TC, Hart PS, Simmons D, Suggs C, Daley B, et al. Human and mouse enamel pheno-
types resulting from mutation or altered expression of AMEL, ENAM, MMP20 and KLK4. Cells Tissues
Organs. 2009; 189:224–229. https://doi.org/10.1159/000151378 PMID: 18714142
11. Horvath JE, Ramachandran GL, Fedrigo O, Nielsen WJ, Babbitt CC, St. Clair EM, et al. Genetic com-
parisons yield insight into the evolution of enamel thickness during human evolution. J Hum Evol. 2014;
73:75–87. https://doi.org/10.1016/j.jhevol.2014.01.005 PMID: 24810709
12. Daubert DM, Kelley JL, Udod YG, Habor C, Kleist CG, Furman IK, et al. Human enamel thickness and
ENAM polymorphism. Int J Oral Sci. 2016; 8:93–97. https://doi.org/10.1038/ijos.2016.1 PMID:
27357321
13. Skinner MM, Wood BA, Hublin J-J. Protostylid expression at the enamel-dentine junction and enamel
surface of mandibular molars of Paranthropus robustus and Australopithecus africanus. J Hum Evol.
2009; 56:76–85. https://doi.org/10.1016/j.jhevol.2008.08.021 PMID: 18986683
14. Skinner MM, Evans A, Smith T, Jernvall J, Tafforeau P, Kupczik K, et al, Contributions of enamel-den-
tine junction shape and enamel deposition to primate molar crown complexity. Am J Phys Anthropol.
2010; 142:157–163. https://doi.org/10.1002/ajpa.21248 PMID: 20091839
15. Guy F, Lazzari V, Gilissen E, Thiery G. To what extent is primate second molar enamel occlusal mor-
phology shaped by the enamel-dentine junction? PLoS ONE. 2015 Sep 25. 10:e0138802. https://doi.
org/10.1371/journal.pone.0138802 PMID: 26406597
16. Chen S, Merriman B, Osher S, Smereka PA. A simple level set method for solving Stefan problems. J
Comp Physics. 1997; 135:8–29.
17. Chen H, Min C, Gibou F. A numerical scheme for the Stefan problem on adaptive Cartesian grids with
supralinear convergence rate. J Com. Physics. 2009; 228:5803–5818.
18. Yoshida S, Oshima H, Kobayashi S. Vascularization of the enamel organ in developing molar teeth of
rats–Scanning electron microscope study of corrosion casts. Okajima Folia Anat jpn. 1989; 66:99–112.
19. Ida-Yonemochi H, Nakajima M, Saku T. Heparanase, heparan sulfate and perlecan distribution along
with the vascular penetration during stellate reticulum retraction in the mouse enamel organ. Arch Oral
Biol. 2010; 55:778–787. https://doi.org/10.1016/j.archoralbio.2010.07.002 PMID: 20684947
20. Sova SS, Tjaderhane L, Heikkila PA, Jernvall J. A microCT study of three-dimensional patterns of
biomineralization in pig molars. Front Physiol. 2018 Feb 9. 9:71 https://doi.org/10.3389/fphys.2018.
00071 PMID: 29479320
Enamel matrix secretion in teeth
PLOS Computational Biology | https://doi.org/10.1371/journal.pcbi.1007058 May 29, 2019 11 / 12

21. Beynon AD, Dean MC, Reid DJ. On thick and thin enamel in Hominoids. Am J Phys Anthropol. 1991;
86:295–309.
22. Tafforeau P, Smith TM. Nondestructive imaging of hominoid dental microstructure using phase contrast
X-ray synchrotron microtomography. J Hum Evol. 2008; 54:272–278. https://doi.org/10.1016/j.jhevol.
2007.09.018 PMID: 18045654
23. Marchiori DF, Packota GV, Boughner JC. Third-molar mineralization as a function of available retromo-
lar space. Acta Odont Scan. 2016; 74:509–517.
24. Renvoise E, Kavanagh KD, Lazzari V, Hakkinen TJ, Rice R, Pantalacci S, et al. Mechanical constraint
from growing jaw facilitates mammalian dental diversity. Proc Nat Acad Sci USA. 2017; 114:9403–
9408. https://doi.org/10.1073/pnas.1707410114 PMID: 28808032
25. Halsey TC. Diffusion-limited aggregation: A model for pattern formation. Physics Today 2000; 53:36–
41.
26. Karperien A. FracLac for ImageJ. Available from: http://rsbweb.nih.gov/ij/plugins/fraclac/FLHelp/ Intro-
duction.htm. 2012.
27. Boyde A. Enamel. In: Oksche A, Vollrath L (Eds.), Handbook of Microscopic Anatomy vol V/6 Teeth.
Springer; 1989. pp. 309–473.
28. Green DR, Oack G, Colman AS. Determinants of blood water δ18O variation in a population of experi-
mental sheep: Implications for paleoclimate reconstruction. Chem Geol. 2018; 485:32–43. https://doi.
org/10.1016/j.chemgeo.2018.03.034 PMID: 30504966
29. Smith TM, Austin C, Green DR, Joannes-Boyau R, Bailey S, Dumitriu D, et al. Wintertime stress, nurs-
ing, and lead exposure in Neanderthal children. Sci Adv. 2018; 4: 10:eaau9483.
30. Suwa G, Kono RT. A micro-CT based study of linear enamel thickness in the mesial cusp section of
human molars: reevaluation of methodology and assessment of within-tooth, serial, and individual vari-
ation. Anthropological Sci. 2005; 113:273–289.
31. Vuik C. Some historical notes about the Stefan problem, Nieuw Archief voor Wiskunde. 1993; 11:157–
167.
32. Hakkinen T. On Free Boundary Problems. MSc thesis, Aalto University. 2016. Available from: https://
aaltodoc.aalto.fi/handle/123456789/20347
33. Schindelin J, Arganda-Carreras I, Frise E, Kaynig V, Longair M, Pietzsch T, et al. Fiji: an open-source
platform for biological-image analysis. Nat methods. 2012; 9:676–682. https://doi.org/10.1038/nmeth.
2019 PMID: 22743772
34. Cignoni P, Rocchini C, Scopigno R. Metro: measuring error on simplified surfaces Comput Graph
Forum. 1998; 17:167–174.
Enamel matrix secretion in teeth
PLOS Computational Biology | https://doi.org/10.1371/journal.pcbi.1007058 May 29, 2019 12 / 12