Embed Size (px)
Citation preview

Modeling Disease Transmission on a Location-Based Social Network
Kris Samala ∗
Carl Kingsford ∗†
May 18, 2012
Abstract
Location-based social networking services (LBSNs) provide an alternative form of gathering massiveamounts of mobility data applicable to various fields of research that require human activity surveillance.This paper examines the relationship between locations extracted from observed patterns of LBSN usageand the effectiveness of the resulting network in tracing geographical spread of an infectious disease.Our results show that location connections formed through LBSNs demonstrate a reasonable approachin modeling trends in human mobility.
1 Introduction
The increasing prevalence of smart phones, tablets, and other mobile web devices has spurred a surplusof applications that track real-time geospatial user activity. Location-based social networks (LBSN), suchas Gowalla 1 and Foursquare 2, allow users to share their whereabouts with friends and connect with newpeople of similar interests. These virtual communities yield large-scale datasets revealing a high resolutionview of human mobility. In this paper, we study the potential use of the underlying structure of LBSNs formodeling the spread of an infectious disease within the United States. Disease dynamics may be generalizedto encompass a wide variety of symptoms or tailored to a specific set of parameters for a particular contagion.We fit our model to simulate the transmission of the influenza virus.
Influenza ranks among the ten leading causes of death in the United States [28]. About three to fivemillion severe cases are reported annually that lead to roughly 250,000 to 500,000 deaths worldwide [29].The economic impact of a seasonal influenza epidemic costs an estimated total of $87.1 billion in the USevery year attributed to medical costs, loss of earnings due to illness, and total deaths [19]. Vaccination isthe most effective preventive measure against individual infection and epidemics [22]. However, the rapidevolution of its viral structure requires the vaccine’s viral components to be updated regularly based onthe recommendations of the World Health Organization (WHO) Global Influenza Surveillance Network.The selections are evaluated to match currently circulating strains, as well as emerging variants [12, 21].However, due to manufacturing and regulation constraints, updated vaccines could take five months to ayear to become available for mass distribution [1]. If a new strain emerges after the selection process ends,the vaccine may only provide partial immunity increasing the risk for a widespread pandemic.
Effectively predicting the spread of disease is crucial in minimizing seasonal epidemics and preventinga global pandemic. Several models have been developed to simulate the transmission of infections in apopulation. The susceptible-infected-recovered (SIR) model, introduced by Kermack and McKendrick in1927, provides a generic mathematical approach to modeling epidemics. SIR assumes a population thatis initially equally susceptible to a disease. Once an individual becomes ill, the disease spreads from theinfected to the susceptible. Each infected person eventually retires from the infected stage either throughrecovery from illness or death [25]. The model has since been extended to take more complex forms. Acontact network model provides a more realistic view of the dynamically changing interactions within a
∗Department of Computer Science, University of Maryland College Park†Center for Bioinformatics and Computational Biology, University of Maryland College Park1gowalla.com2foursquare.com
1

heterogenous population [27, 36]. Instead of assuming that the transmission probability is constant for allperson-to-person contacts, the dynamic contact network allows asymmetrical transmission patterns thateffectively represent higher risk subpopulations as well as variances in daily interactions.
Mathematical models tracing geographical spread of disease present a spatial view of epidemic progression[31, 32]. This feature is particularly important in identifying vulnerable regions in the case of an outbreakwherein necessary response strategies, such as school closings, travel restrictions, and quarantine, must beenacted. Airline travel is widely studied as the greatest facilitator of inter-regional influenza transmission[24, 4, 14]. The sharp increase in travel volumes and speed of inter-continental transport have had a significantinfluence on the spatio-temporal pattern of influenza transmission [4]. Airline flight itineraries are popularsources of mobility data. However, models based on this data set alone have several limitations. For example,air transportation generally covers only long-distance excursions. As a result, shorter range movement fromother modes of transportation would be excluded [14, 24]. Mass gatherings, such as sporting events, or localsocial venues wherein a diverse group of people come into contact with each other are also not taken intoconsideration.
Alternative methods of representing human contact and mobility include telephone records, standard mailand courier services, financial transactions, and migration patterns [30]. Each has its strengths but often failto capture some essential element that characterizes human behavior. The structure of offline social networkshas shown great potential in replacing traditional contact network models for SIR disease simulations. Astudy on a flu outbreak at Harvard College showed that individuals at the center of a social network tendto acquire infections earlier and are more likely to spread the infection to their friends [8]. These nodes actas early detection sensors of an emerging outbreak and should be prime targets for vaccination. Collectingdata for a similar contact network and observing the flow of infection on a global scale is a daunting, if notimpossible, task. Thus, we propose an alternative method for simulating geographical disease propagationthrough user-provided activities with local and temporal detail.
Online social media boasts a rich collection of observable activities voluntarily and openly shared by itsusers. However, the application of online behavior to realistic events, as in person-to-person contact, is notdirectly obvious. Due to the global scope and accessibility of web applications, online usage appears to havethe ability to transcend physical and geographical barriers. In tracing social contact, such intuition impliesthat online social networking sites do not effectively represent actual physical contact between its users.Nevertheless, research exploring comparisons between online and offline social networks have found thatphysical proximity, travel patterns, national borders, and common language all exhibit significant influenceover which connections are formed in online social networks [9, 35].
Recent studies have employed online social media to track influenza-related content in Twitter tweets[6, 11, 13, 26, 34], Facebook status updates [13], blog posts [15], and Google search queries [18]. Throughmining and analysis of vast amounts of online traffic, these portals serve as real-time surveillance systems thatare able to monitor and predict flu level trends and the possibility of an emerging epidemic. Communicationpatterns between YouTube users have been used to substitute human interactions in simulating the 2009H1N1 epidemic [30]. The results show that simulations on the YouTube-based network were able to predictthe first day of incidence in each country better than estimates from air traffic data. However, projectionsfor the total number of cases are less accurate and underestimates the actual number of incidences. Mergingthe advantages of utilizing user-generated content and social contact networks derived from online socialmedia, we look at the unique attributes of LBSNs and the potential application in disease simulation.
Advancements in web-based mobile technology have boosted the popularity of “apps” that encourageusers to share their daily experiences with staggering detail. Facebook, Foursquare, and Gowalla are only afew of the numerous applications that exploit the ease of capturing precise time and coordinates in recordinguser activity. LBSNs have recently been garnering attention in fields of research related to human mobilityand activity patterns [7, 2, 20], friendship prediction [9], link prediction [33], and recommendation systems[3]. These studies reveal promising results in tracing user mobility and online behavior. Our work focuses onextracting a location-based contact network from large volumes of fine-grained data gathered from LBSNsto model real-time physical social events, such as the transmission of disease.
Results from our simulations approximate the geotemporal spread of influenza during the 2009 H1N1epidemic. We observe that transition probabilities between cities in our Gowalla network model play animportant role in estimating the variation of disease incidence across different regions. Our model canbe applied in tracing human movement while observing the frequency and timing of user activities that
2
Table 1: Sample Data
City State Longitude Latitude Time
San Jose CA -121.89 37.32 2010-06-21 13:21:19Philadelphia PA -75.02 39.94 2010-06-21 13:59:58Minneapolis MN -93.24 44.85 2010-06-21 14:09:13New York NY -73.61 40.73 2010-06-21 14:49:06New York NY -73.98 40.72 2010-06-21 16:21:48San Francisco CA -122.40 37.78 2010-06-21 16:27:12New York NY -73.61 40.73 2010-06-21 19:26:03
contribute to infection spread. Through a close examination of LBSN use, our model captures the overalltravel patterns of its users at both local and long-distance levels.
2 Methods
2.1 Gowalla Check-in Network
Gowalla is a mobile social networking service where users submit location information to connect with friends,log daily routines, and share exciting new places they are visiting. A check-in is created when a user postsinformation about his current location. A spot is a specific place or venue, such as a restaurant, a park, oran airport. Check-ins are annotated with the spot name and location, user name, date and time of check-in,as well as optional user comments and photos.
We obtain our data set of 9 million check-ins from Berjani and Strufe [3], originally crawled using theGowalla API. The data consists of check-ins from spots located in the US from February 2009 to October2010. It includes field values for user ID, location ID, timestamp, and the latitude and longitude coordinatesof the place of check-in.
The data is transformed to follow a set of conventions useful in developing our model. To standardize thecollection of cities, a list of the most populated US cities with the corresponding geographical coordinateswas obtained from the US Census Bureau [5]. The average distance of a spot’s coordinates to its listed city’scoordinates is 9.07 miles with a standard deviation of 26.48 miles. If a spot is registered to a city that isnot on the census list, the entry is updated with the closest listed city with a mean distance of 26.70 milesand standard deviation of 24.03 miles. Gowalla logs a timestamp for a check-in based on the local time onthe device used. In order to obtain a chronological sequence of check-ins, we update all timestamps to be inEastern Standard Time.
Under the assumption that each check-in reflects a user’s location at the specified timestamp, we observea discrepancy regarding the check-in history of certain users. For example, Table 1 shows the activityof a single user on June 21, 2010 with check-ins between distant cities that are only within a few hoursapart. The fastest plausible mode of transportation is by commercial airplane, which travels approximately600mph on average. However, a small subset of users have apparently had the ability to register check-ins tomultiple distant places faster than the expected physical travel time. Another Gowalla data set [7], gatheredduring the same time period, exhibits similar issues. The problem may be due to flaws in Gowalla’s loggingimplementation, special user privileges, or perhaps a glitch during the crawling process. Nevertheless, thispattern occurs for only 0.3% of the total users so we eliminate these users’ activities from our sample.
We find that the number of check-ins from Austin, TX is more than double the number for the secondmost frequently checked-in city (New York, NY). We attribute this to the fact that Gowalla’s headquartersare located in Austin and possibly have a strong influence over the use of the service within its home city.To adjust for this bias, we look at the three US cities that have the closest population size to Austin —San Francisco, CA, Columbus, OH, and Indianapolis, IN. We define cityn to be the number of users whosemajority of check-ins are in city and compute the average ratio between the number of users from Austinand the number of users from other cities:
3
r̄ =1
|A|∑
city∈A
citynAustinn
, A = {San Francisco, Columbus, Indianapolis} (1)
We use r̄ in the next section to scale down the impact of Austin users to be roughly proportional to users insimilarly populated cities in constructing our location-based contact network.
2.2 Weighted City-to-City Contact Network
We formulate our contact network by observing the path of cities visited by each user. Let C be the setof nodes for each US city and let E be the set of weighted directed edges representing transfer connectionsbetween cities. For every pair of city nodes ci and cj in C, let ei,j = (ci, cj) be the directed edge betweenthese nodes. Let U be the set of all users, then for u ∈ U , Lu = [cs, . . . , ct], is list of check-ins such that cs,. . . , ct are the cities visited by user u in chronological order. For every ei,j ∈ E, we compute its weight,
w(ei,j) = ε+ (# of consecutive occurrences of ci and cj in Lu, u ∈ U) (2)
Let Ua be the set of users whose majority of check-ins are located in Austin. Then for ua ∈ Ua, the weightfor each consecutive ci, cj in Lua
is scaled by r̄ from equation 1 when added to w(ei,j).The result is a strongly connected graph with 501 nodes and 251001 weighted edges. A transition
probability matrix, T , is constructed such that T [i, j] denotes the probability of moving from city ci to citycj .
T [i, j] =w(ei,j)
w(ei,·), where w(ei,·) is the sum of the edge weights leaving city i (3)
2.3 Contact Probability Distribution
The rate of disease propagation from a single person is directly correlated with the number of people aninfected individual interacts with. The number of contacts fluctuates from person to person every daywhile the exact definition of what constitutes sufficient physical contact to transmit an infection variesfor different diseases. There are currently limited sources of social contact data applicable for infectiousdisease transimission. One of these include an investigation of how social contact patterns influence thetemporal spread of influenza. The study conducted a survey to determine the daily number of physical andconversational contacts for each participant [16]. They observed that lower contact numbers during schoolholidays coincides with decreased influenza incidence rates and that the timing of school sessions promotedthe spread of the 2009 H1N1 epidemic. We use the survey data from this study to determine how manycontacts a sick individual will attempt to infect in our simulation.
2.4 Model Dynamics
Our disease simulation follows an extended SIR model featuring an additional compartment, latent, whichdifferentiates a subgroup of the population who have been exposed to infection but are not yet able totransmit the disease [24]. Figure 1 shows the transitions between and within each disease stage. When asusceptible individual contracts an infection, he transitions from S to a latent phase L which could last upto 3 days. We define Li,j as the ith stage out of j total days of latency, where i = 1, . . . , j and j = 1, . . . , 3.
After the Lj,jth stage, the individual transitions to one of I1,k, where k = 1, . . . , 10, as the first stage of
infection of up to k total days. As he reaches the final day of infection at Ik,k, he finally moves to R andrecovers.
Seasonal factors affecting an influenza epidemic causes a periodic peak and decline in the number ofincidences each year. Cases are usually higher during the colder months of the winter when people are morelikely to stay indoors and decrease as the temperatures become warmer during the summer. To account forthe seasonal variability in the rate of infection, we apply a sinusoidal function to the transmission probabilityas determined by Edlund et al [17].
4

Figure 1: SLIR Disease Model.
Table 2: Simulation Parameters
Parameter Definition
init initial distribution of infected individuals for all citiespop population distribution for all citiessteps number of time steps to run simulationcity list of cities in networkcontacts contact probability distributionp disease transmission probabilityT city transition probability matrixmax lat maximum latency periodmax inf maximum infectious period
Table 3: General Procedures
Procedure Definition
GenAgent() generates a new agentSeasonal(t) sinusoidal function of time tInfect(x) returns True with probability xNextCity(T, ci) returns a city cj with probability T[i,j]
2.4.1 Implementation
The simulation is executed with parameters and procedures listed in Tables 2 and 3. A distribution of in-fluenza incidences per state is selected from Google Flu Trends data [23] to seed the simulation. The numberof infected individuals in a state is randomly distributed among its cities for all states to obtain init. Theoverall population distribution among all cities in pop is acquired from the US Census Bureau [5]. Both initand pop are arrays of integers whose indices correspond to cities. Simulation initializes the set of agents foreach disease compartment, S,L, I,R, and determines the length of infectious period for each infected agent.A call to Spread updates all sets of agents at every time step.
Simulation(init, pop, steps)1 S,L, I,R← ∅2 for i← 0 to len(city)3 do4 for n← 1 to (pop[i]− init[i])
5

5 do agent← GenAgent()6 agent.city ← city[i]7 agent.pd← 08 S.add(agent)9 for n← 1 to init[i]
10 do agent← new agent11 agent.city ← city[i]12 agent.pd← random(1,max inf)13 I.add(agent)14 for t← 1 to steps15 do Spread(p, contacts, T,max lat,max inf, t)
Spread simulates the transmission of disease from agents in I to agents in S. An infected agent comesinto contact with c individuals, randomly chosen from contacts. The agent attempts to infect c susceptiblesin its current city ci with season-influenced transmission probability Seasonal(p, t) then updates its locationaccording to the city contact network. The remaining latency and infectious period for each agent in L andI, respectively, are decremented to reflect the changing state of infection as time passes. Once the remainingperiod reaches 0, the agents transition toward the next phase (L → I or I → R), and the infectious periodfor each previously latent individual is set.
Spread(p, contacts, T,max lat,max inf, t)1 for agent in I2 do c← random(contacts)3 for k ← 1 to c4 do if Infect(Seasonal(p, t))5 then infected agent← S.getAgentFromSameCityAs(agent)6 infected agent.pd← random(1,max lat)7 S.remove(infected agent)8 L.add(infected agent)9 agent.city ← NextCity(T, agent.city)
10 agent.pd← agent.pd− 111 if agent.pd← 012 then I.remove(agent)13 R.add(agent)14 for agent in L15 do agent.pd← agent.pd− 116 if agent.pd← 017 then agent.pd← random(1,max inf)18 L.remove(agent)19 I.add(agent)
The procedure implements each set of agents, S,L, I,R, as vectors with the number of agents in eachcity. The vector for L is further subdivided such that L = {Li,j} for i = 1, . . . , j and j = 1, . . . ,max lat.Similarly, I = {Ik,l} for k = 1, . . . , l and l = 1, . . . ,max inf . The counts on all vectors are iterated overto simulate the actions for each agent and updated as events unfold. Our simulations run for 365 timesteps with varying p values and seed init with random pre-flu season estimates from Google Flu Trends. Asimulation outputs a steps× len(city) matrix, M , that contains the number of infected agents at each timestep for every city on our network.
2.5 Comparing with Google Flu Trends
Google Flu Trends approximates the proportion of influenza-like illness (ILI) cases from aggregated flu-relatedqueries on the web [23]. The study [18] revealed that the frequency of certain ILI-related search terms matchthe seasonal fluctuation of influenza reports indicating a good predictor for flu activity across various regions.
6

The Centers for Disease Control and Prevention (CDC) provides weekly surveillance reports with FluViewbased on observed ILI-related outpatient visits [10]. However, data collected for the surveillance system canbe delayed by up to a few weeks. Google Flu Trends offers daily estimates of flu activity by monitoringthe occurrences of ILI-related search terms. They tested the top 50 million queries in their database anddeveloped a linear model that produced a mean correlation of 0.9 with CDC observed ILI reports.
We compare our results with Google Flu Trends’ weekly US influenza estimates from September 2003to May 2012. The counts of infected agents in M are summed every seven days to obtain a 52-week tallynormalized by each state total. These are evaluated against every 52-week subset of the Flu Trends data tofind a closest match. A score for each pairing is determined by computing the average Euclidean distance,d̄, between corresponding column vectors for each state in the two matrices. The lowest distance matchingsare evaluated on a state-by-state level for further analysis.
3 Results
Simulation results for the Gowalla network model fit closest with Google Flu Trends estimates for May 2009to May 2010 with d̄ = 0.22. We find that our model approximates the timing and activity levels for eachstate in the continental US throughout the flu season, with the exception of Alaska, Vermont, West Virginia,and Wyoming, for which the Gowalla network did not include any check-in data. We developed two baselinecomparison networks to evaluate the strength of our model. The first is a permuted version of the Gowallanetwork wherein a random permutation of the probability vector for a city’s connections to all other cities issubstituted in the transition probability matrix T for all cities. The other is a randomized contact networkwhich draws a random value from a Gaussian distribution as the probability that an agent will move fromone city to another. Simulations using the same initial parameters as the Gowalla network results in d̄values for the permuted and random networks of 0.24 and 0.83, respectively, when compared with GoogleFlu estimates during the same flu season.
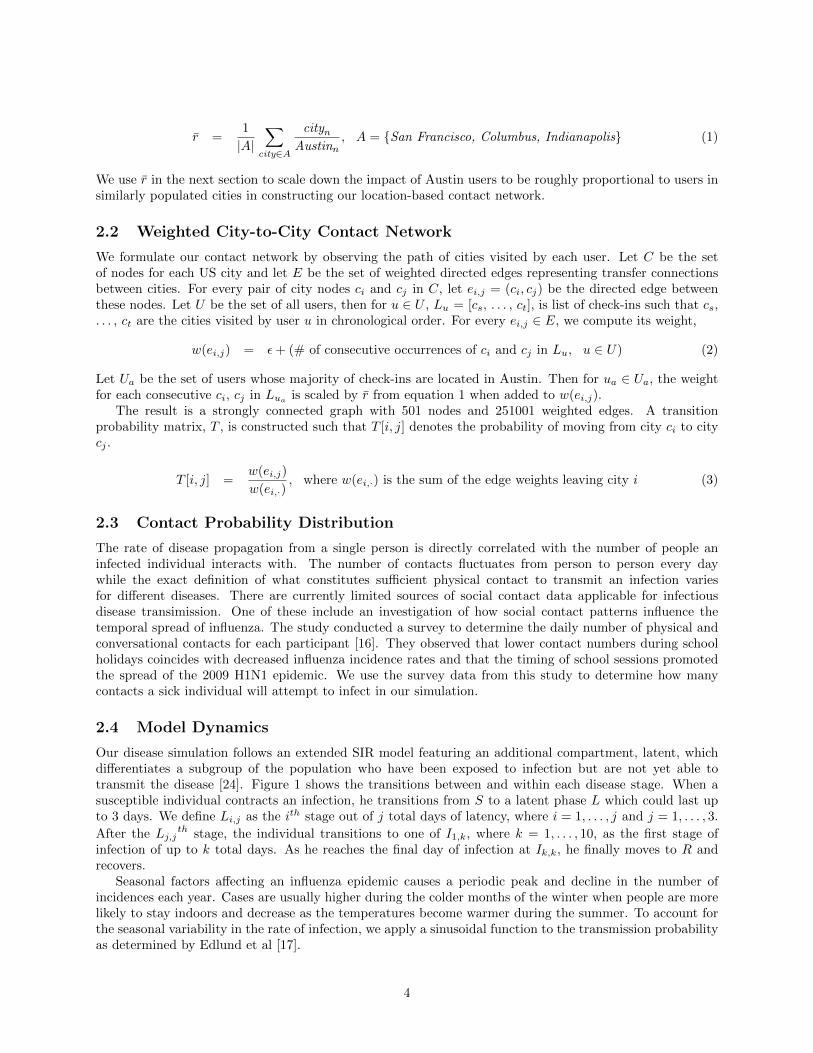
Figure 2 exhibits weekly influenza activity heat maps for Google Flu data and the simulation results forthe Gowalla model, permuted, and randomized contact networks. The x-axis lists the 52-week simulationperiod while the y-axis lists the US states observed. Values for each tile are obtained from the percentage oftotal incidences for a state at a given week normalized across all states for that week. The weekly heat mapestimates a general trend of how the activity levels of each state influence the prevalence of flu on a nationallevel. The Gowalla network model follows a similar pattern of varying flu levels for each state throughout theyear as Google Flu. The permuted network shows little variation while the randomized network is mostlyuniformly distributed.
Meanwhile, Figure 3, displays a geographical snap shot of flu activity across the US for the four differentsets. The geographic heat maps show the relative distribution of influenza incidences across the region forthe week of October 11, 2009. Google Flu and Gowalla network highlight different states with high activitybut follow a general overall distribution of the various ranges of flu levels. As evident in the weekly heatmaps, the permuted and randomized networks show a much limited distribution of values in comparison.Specifically, the randomized network exhibits a sparse distribution of incidences for only a few select states.The results entail that the Gowalla network model has an observable impact on the geo-temporal spreadof disease. The actual distribution of which state induces increased prevalence on another state differs as aresult of bias with the manner of Gowalla service use which may distort the representation of certain states.
The overall proportion of incidence during the 52-week period, shown in Figure 4, exhibits high corre-lation between the three simulated models, with Euclidean distances of less than 0.05 from each other andapproximately 0.14 against Google Flu. The pattern may be due to the applied seasonal factor varyingthe transmission probabilities over time with a sine wave function. This indicates that the total incidenceson the national level is unaffected by the city-to-city transition probabilities since individual contact andtransmission rates are sampled from the same distribution.
4 Discussion
Our observations demonstrate that the Gowalla network model approximates the geographical propagationof disease as a consequence of human mobility patterns. The location-based contact network relies on the
7

2009
−05
−10
2009
−05
−17
2009
−05
−24
2009
−05
−31
2009
−06
−07
2009
−06
−14
2009
−06
−21
2009
−06
−28
2009
−07
−05
2009
−07
−12
2009
−07
−19
2009
−07
−26
2009
−08
−02
2009
−08
−09
2009
−08
−16
2009
−08
−23
2009
−08
−30
2009
−09
−06
2009
−09
−13
2009
−09
−20
2009
−09
−27
2009
−10
−04
2009
−10
−11
2009
−10
−18
2009
−10
−25
2009
−11
−01
2009
−11
−08
2009
−11
−15
2009
−11
−22
2009
−11
−29
2009
−12
−06
2009
−12
−13
2009
−12
−20
2009
−12
−27
2010
−01
−03
2010
−01
−10
2010
−01
−17
2010
−01
−24
2010
−01
−31
2010
−02
−07
2010
−02
−14
2010
−02
−21
2010
−02
−28
2010
−03
−07
2010
−03
−14
2010
−03
−21
2010
−03
−28
2010
−04
−04
2010
−04
−11
2010
−04
−18
2010
−04
−25
2010
−05
−02
WYWIWVWAVAVTUTTXTNSDSCRIPAOROKOHNDNCNYNMNJNHNVNEMTMOMSMNMIMAMDMELAKYKSIAINILIDGAFLDCDECTCOCAARAZAKAL
Google Flu Trends
−2 2Column Z−Score
Color Key
2009
−05
−10
2009
−05
−17
2009
−05
−24
2009
−05
−31
2009
−06
−07
2009
−06
−14
2009
−06
−21
2009
−06
−28
2009
−07
−05
2009
−07
−12
2009
−07
−19
2009
−07
−26
2009
−08
−02
2009
−08
−09
2009
−08
−16
2009
−08
−23
2009
−08
−30
2009
−09
−06
2009
−09
−13
2009
−09
−20
2009
−09
−27
2009
−10
−04
2009
−10
−11
2009
−10
−18
2009
−10
−25
2009
−11
−01
2009
−11
−08
2009
−11
−15
2009
−11
−22
2009
−11
−29
2009
−12
−06
2009
−12
−13
2009
−12
−20
2009
−12
−27
2010
−01
−03
2010
−01
−10
2010
−01
−17
2010
−01
−24
2010
−01
−31
2010
−02
−07
2010
−02
−14
2010
−02
−21
2010
−02
−28
2010
−03
−07
2010
−03
−14
2010
−03
−21
2010
−03
−28
2010
−04
−04
2010
−04
−11
2010
−04
−18
2010
−04
−25
2010
−05
−02
WYWIWVWAVAVTUTTXTNSDSCRIPAOROKOHNDNCNYNMNJNHNVNEMTMOMSMNMIMAMDMELAKYKSIAINILIDGAFLDCDECTCOCAARAZAKAL
Gowalla Network
−2 2Column Z−Score
Color Key
2009
−05
−10
2009
−05
−17
2009
−05
−24
2009
−05
−31
2009
−06
−07
2009
−06
−14
2009
−06
−21
2009
−06
−28
2009
−07
−05
2009
−07
−12
2009
−07
−19
2009
−07
−26
2009
−08
−02
2009
−08
−09
2009
−08
−16
2009
−08
−23
2009
−08
−30
2009
−09
−06
2009
−09
−13
2009
−09
−20
2009
−09
−27
2009
−10
−04
2009
−10
−11
2009
−10
−18
2009
−10
−25
2009
−11
−01
2009
−11
−08
2009
−11
−15
2009
−11
−22
2009
−11
−29
2009
−12
−06
2009
−12
−13
2009
−12
−20
2009
−12
−27
2010
−01
−03
2010
−01
−10
2010
−01
−17
2010
−01
−24
2010
−01
−31
2010
−02
−07
2010
−02
−14
2010
−02
−21
2010
−02
−28
2010
−03
−07
2010
−03
−14
2010
−03
−21
2010
−03
−28
2010
−04
−04
2010
−04
−11
2010
−04
−18
2010
−04
−25
2010
−05
−02
WYWIWVWAVAVTUTTXTNSDSCRIPAOROKOHNDNCNYNMNJNHNVNEMTMOMSMNMIMAMDMELAKYKSIAINILIDGAFLDCDECTCOCAARAZAKAL
Permuted Network
−2 2Column Z−Score
Color Key
2009
−05
−10
2009
−05
−17
2009
−05
−24
2009
−05
−31
2009
−06
−07
2009
−06
−14
2009
−06
−21
2009
−06
−28
2009
−07
−05
2009
−07
−12
2009
−07
−19
2009
−07
−26
2009
−08
−02
2009
−08
−09
2009
−08
−16
2009
−08
−23
2009
−08
−30
2009
−09
−06
2009
−09
−13
2009
−09
−20
2009
−09
−27
2009
−10
−04
2009
−10
−11
2009
−10
−18
2009
−10
−25
2009
−11
−01
2009
−11
−08
2009
−11
−15
2009
−11
−22
2009
−11
−29
2009
−12
−06
2009
−12
−13
2009
−12
−20
2009
−12
−27
2010
−01
−03
2010
−01
−10
2010
−01
−17
2010
−01
−24
2010
−01
−31
2010
−02
−07
2010
−02
−14
2010
−02
−21
2010
−02
−28
2010
−03
−07
2010
−03
−14
2010
−03
−21
2010
−03
−28
2010
−04
−04
2010
−04
−11
2010
−04
−18
2010
−04
−25
2010
−05
−02
WYWIWVWAVAVTUTTXTNSDSCRIPAOROKOHNDNCNYNMNJNHNVNEMTMOMSMNMIMAMDMELAKYKSIAINILIDGAFLDCDECTCOCAARAZAKAL
Randomized Network
−2 0 2Column Z−Score
Color Key
Figure 2: Week-by-week Heat Maps.
check-in activity of Gowalla users to detect movement from place to place. Infection spread is simulated overthe network using established disease model parameters to determine spatio-temporal epidemic progression.Although the model uses a unique measure of movement through LBSNs, our results show that the transitionprobability distribution computed from our network is indicative of actual travel probabilities influenced bylocal and long-distance transportation methods.
It is worth noting that the Gowalla state-by-state distance comparisons against Google Flu estimates bestmatch the 2009 H1N1 flu pandemic. This suggests that our model may be more appropriately used for highincidence disease outbreaks than seasonal epidemics. The disease parameters used may have played a rolein the emergence of such performance, however, the random and permuted networks that incorporated thesame parameters did not display the same behavior. If the model is updated to reflect better representationof regional activity through the use of larger and more up-to-date collections of check-in information, our
8

TX
MT
CA
ID
AZ
NV
NM
OR
CO IL
WY
UTIA
KS
MNSD
NE
NDWI
WA
OK
MO
MI
AL GA
PAIN
AR
NY
LA
NCVA
TNKY
OH
ME
FLMS
SC
MI
WVVT
NH
NJMD
MA
LegendGOOGLE HEAT MAPData from 10/11/2009
0.001 - 0.0150.016 - 0.0250.026 - 0.0350.036 - 0.0450.046 - 0.0550
TX
MT
CA
ID
AZ
NV
NM
OR
CO ILUTIA
KS
MNSD
NE
NDWI
WA
OKMO
MI
AL GA
PAIN
AR
NY
NCVA
TN
OH
FLLA
KY
MS
ME
SC
MI
NHNJ
MDMA
LegendGOWALLA HEAT MAPData from 10/11/2009
0.0001 - 0.0030.004 - 0.0410.042 - 0.0790.080 - 0.1160.117 - 0.2020
TX
MT
CA
ID
AZ
NV
NM
OR
CO ILUTIA
KS
MNSD
NE
NDWI
WA
OKMO
MI
AL GA
PAIN
AR
NY
LA
NCVA
TN
OH
ME
FL
KY
MSSC
MI
NH
NJMD
MA
LegendPERMUTED HEAT MAPData from 10/11/2009
0.001 - 0.0030.004 - 0.0400.041 - 0.0770.078 - 0.1140.115 - 0.2410
AZ
MN
LA
VA
FL
TN
GEOGRAPHICAL HEAT MAPS
LegendRANDOMIZED HEAT MAPData from 10/11/2009
0.001 - 0.0750.076 - 0.2590.260 - .04430.444 - 0.4900
Figure 3: Geographical Heat Maps.
Figure 4: Influenza Overall Estimates.
9

simulations may be able to provide real-time metrics for user mobility and contact.Location-based social networks offer intriguing insights into the mobility pattern of its users. It demon-
strates behavioral trends through the timing and frequency of check-ins to favorite spots and visits to newplaces. The large-scale availability of such information provides an interesting alternative to tracing humanactivity. However, the power and shortcomings of the data lie on its dependence to self-reported user activity.On one hand, it allows people to conveniently record accurate details of day-to-day excursions. Instead ofrelying on recalling a busy day’s worth of commute when filling out survey forms, one can simply press abutton on a device that is always at hand. However, the types of individuals that these services cater tomay be limited to a particular niche. Although the use of these applications has grown dramatically over thelast few years, there remain large sections of the population that are excluded from LBSN data sets. Oldergenerations may not be accustomed to using new technologies and younger children have yet to acquiresole access to these gadgets. Regardless, LBSN captures an essential element of human behavior that islacking on conventional surveillance methods thanks to its unique ability of reporting immediate and preciseinformation regarding a user’s whereabouts.
References
[1] World Health Organization: Global Alert and Response Briefing Notes. Pandemic influenza vac-cine manufacturing process and timeline. http://www.who.int/csr/disease/swineflu/notes/h1n1_vaccine_20090806/en/. Accessed April 2012.
[2] A. Bawa-Cavia. Sensing the urban: Using location-based social network data in urban analysis, June2011. The First Workshop on Pervasive Urban Applications (PURBA).
[3] B. Berjani and T. Strufe. A recommendation system for spots in location-based online social networks.In Proceedings of the 4th Workshop on Social Network Systems, 2011.
[4] J. Brownstein, C. Wolfe, and K. Mandl. Empirical evidence for the effect of airline travel on inter-regional influenza spread in the United States. PLoS Medicine, 3:1826–1835, October 2006.
[5] US Census Bureau. 2010 Census Data. http://2010.census.gov/2010census/. Accessed April 2012.
[6] C. Chew and G. Eysenbach. Pandemics in the age of Twitter: Content analysis of Tweets during the2009 H1N1 outbreak. PLoS ONE, 5, November 2010.
[7] E. Cho, S. Myers, and J. Leskovec. Friendship and mobility: user movement in location-based social net-works. In ACM SIGKDD International Conference on Knowledge Discovery and Data Mining (KDD),pages 1082–1090, 2011.
[8] N. Christakins and J. Fowler. Social network sensors for early detection of contagious outbreaks. PLoSONE, 5, September 2010.
[9] J. Cranshaw, E. Toch, Hong J., Kittur A., and N. Sadeh. Bridging the gap between physical locationand online social networks. In Proceedings of Ubicomp ’10, pages 119–128, 2010.
[10] CDC Influenza Division. FluView: A weekly influenza surveillance report. http://www.cdc.gov/flu/weekly/. Accessed April 2012.
[11] Achrekar H. et al. Predicting flu trends using Twitter data. In First International Workshop on Cyber-Physical Networking Systems, pages 713–718, 2011.
[12] Barr et al. Epidemiological, antigenic and genetic characteristics of seasonal influenza A(H1N1),A(H3N2) and B influenza viruses: Basis for the WHO recommendation on the composition of influenzavaccines for use in the 2009–2010 Northern Hemisphere season. Vaccine, 28:1156–1167, 2010.
[13] Chen L. et al. Vision: Towards real time epidemic vigilance through online social networks. In ACMWorkshop on Mobile Cloud Computing & Services: Social Networks and Beyond, June 2010.
10

[14] Colizza V. et al. The role of airline transportation network in the prediction and predictability of globalepidemics. In Proceedings of the National Academy of Sciences of the United States, volume 103, pages2015–2020, February 2006.
[15] Corley C. et al. Monitoring influenza trends through mining social media. In International Conferenceon Bioinformatics and Computational Biology, July 2009.
[16] Eames K. et al. Measured dynamic social contact patterns explain the spread of H1N1v influenza. PLoSComputational Biology, 8, March 2012.
[17] Edlund S. et al. A spatio-temporal model for influenza. Electronic Journal of Health Informatics, 6,2010.
[18] Ginsberg J. et al. Detecting influenza epidemics using search engine query data. Nature, 457, February2009.
[19] Molinari et al. The annual impact of seasonal influenza in the US: Measuring disease burden and costs.Vaccine, 25:5086–5096, March 2007.
[20] Noulas A. et al. An empirical study of geographic user activity patterns in Foursquare. In Proceedingsof Fifth International AAAI Conference on Weblogs and Social Media, July 2011.
[21] Russell et al. Influenza vaccine strain selection and recent studies on the global migration of seasonalinfluenza viruses. Vaccine, 26S:D31–D34, July 2008.
[22] Centers for Disease Control and Prevention: Advisory Committee on Immunization Practices. Preven-tion and control of influenza with vaccines. Morbidity and Mortality Weekly Report, pages 1–62, August2010.
[23] Google.org. Flu Trends. http://www.google.org/flutrends/. Accessed April 2012.
[24] R.F. Grais and Ellis J.H. et al. Modelling the spread of annual influenza epidemics in the US: Thepotential role of air travel. Health Care Managetent Science, 7:127–134, 2004.
[25] W.O Kermack and A.G. McKendrick. A contribution to the mathematical theory of epidemics. InProceedings of the Royal Society of London. Series A, Containing Papers of a Mathematical and PhysicalCharacter, volume 115, pages 700–721, August 1927.
[26] V. Lampos and N. Cristianini. Tracking the flu pandemic by monitoring the social web. In 2ndInternational Workshop on Cognitive Information Processing, 2010.
[27] L.A. Meyers, M.E.J. Newman, and B. Pourbohloul. Predicting epidemics on directed contact networks.Journal of Theoretical Biology, 240:400–418, 2006.
[28] S. Murphy, J. Xu, and K Kochanek. Deaths: Preliminary Data for 2010. National Vital StatisticsReport, 60(4), January 2012.
[29] World Health Organization. Fact Sheets: Influenza. http://www.who.int/mediacentre/factsheets/2003/fs211/en/. Accessed April 2012.
[30] J. Osth, T. Niedomysl, and B. Malmberg. Using data from social networking sites to predict the spreadof pandemic influenza. In Internation Meeting on Emerging Diseases and Surveillance, 2011.
[31] L. Rvachev and I. Longini. A mathematical model for the global spread of influenza. MathematicalBiosciences, 75:3–22, 1985.
[32] L. Sattenspiel and C. Simon. The spread and persistence of infectious diseases in structured populations.Mathematical Biosciences, 90:341–366, 1988.
11

[33] S. Scellato, A. Noulas, and C. Mascolo. Exploiting place features in link prediction on location-basedsocial networks. In Proceedings of the 17th ACM SIGKDD international conference on Knowledgediscovery and data mining, pages 1046–1054, 2011.
[34] A. Signorini, A.M. Segre, and P. Polgreen. The use of Twitter to track levels of disease activity andpublic concern in the U.S. during the Influenza A H1N1 pandemic. PLoS ONE, 6, May 2011.
[35] Y. Takhteyev, A. Gruzd, and B. Wellman. Geography of Twitter networks. Social Networks, 34:73–81,2012.
[36] E. Volz and L.A. Meyers. Susceptible-infected-recovered epidemics in dynamic contact networks. InProceedings of The Royal Society B, volume 274, pages 2925–2933, September 2007.
12


![Annotated Swadesh wordlists for the Chumashan group ... · Annotated Swadesh wordlists for the Chumashan group (Chumashan family). Languages included: Ineseño (Samala) [chm-ins];](https://img.pdfslide.us/doc/110x75/5f1007a97e708231d4471861/annotated-swadesh-wordlists-for-the-chumashan-group-annotated-swadesh-wordlists.jpg)