Embed Size (px)
Citation preview

Modeling Decision Variables: Dollars, Deaths, and Downtime
Judith Mitrani-Reiser (JHU)
James L. Beck (Caltech)
PEER Annual Meeting
San Francisco, CA
January 19, 2007
PEER Annual Meeting January 19, 2007
Outline
• Methodology to estimate building safety for PEER’s PBEE framework (using ATC-20 guidelines).
• Methodology to estimate probability of fatalities and downtime for PEER’s PBEE framework.
• Applied comprehensive damage and loss analysis to PEER’s benchmark study.
• Express all performance metrics in economic terms for a benefit-cost analysis.

PEER Annual Meeting January 19, 2007
PBEE methodology for PEER: collaboration for benchmark study
C. GouletJ. Stewart
C. HaseltonG. Deierlein
J. Mitrani-ReiserJ. Beck
K. Porter

PEER Annual Meeting January 19, 2007
Facility definition: benchmark site
LA Bulk Mail Facility, Bell, CA, 7 miles SE of downtown L.A.
Representative of urban area in highly seismic region.
Site is within 20 km of 7 known faults, but no one fault dominates the site hazard.
Near-fault effects are not a concern at this site.
High-quality geotechnical data is available for this site.
from USGS (by way of Goulet)

PEER Annual Meeting January 19, 2007
Facility definition: benchmark building
RC 4-story frame building Typical office building 4 x 6 bays (bay width = 30 ft) T1= 1 sec
from Haselton

PEER Annual Meeting January 19, 2007
Design Description
A: Baseline perimeter frame design.
B: Same as A, but with code min strengths.
C: Same as A, but with uniform beam/column throughout.
D: Same as C, but no SCWB provision.
E: Baseline space frame design.
Benchmark Building Design Variants
• Structural analysis performed using Opensees software.
• Fiber and lumped plasticity models used to estimate structural response for a range of hazard levels.
• Sa(T1) used as IM in benchmark study.

PEER Annual Meeting January 19, 2007
Repair Cost: component contribution
Repair costs for damageable
building components.

PEER Annual Meeting January 19, 2007
Repair Cost: vulnerability functions
Mean repair costMDF =
Replacement cost
Replacement cost $9M
.1 .19 .3 .44 .55 .82 1.20
0.1
0.2
0.3
0.4
0.5
0.6
0.7
0.8
Design A, Baseline Perimeter-Frame DesignDesign E, Baseline Space-Frame Design
.26
Spectral Acceleration (g)
Mea
n D
amag
e Fa
ctor
10%-in-50yr 2%-in-50yr
Sum repair costs at each hazard level

PEER Annual Meeting January 19, 2007
Repair Cost : expected annual loss
0 [ | ] ( | )dcr
im
EAL E TC im p im im im im
where is the mean annual rate of events where:
0
0.1crIM im g
0 0.5 1 1.5 20
0.2
0.4
0.6
0.8
1
PGA (g)P
Hazard Curve
Spectral Acceleration (g)1.51.0 0.1 0.5

PEER Annual Meeting January 19, 2007
Results of Benchmark Study: EAL
Design Description EAL ($)
A: Baseline perimeter frame design. 66,585
B: Same as A, but with code minimum strengths.
95,656
C: Same as A, but with uniform beam/column throughout.
51,933
D: Same as C, but no SCWB provision. 112,930
E: Baseline space frame design. 49,422
43% increase
PEER Annual Meeting January 19, 2007
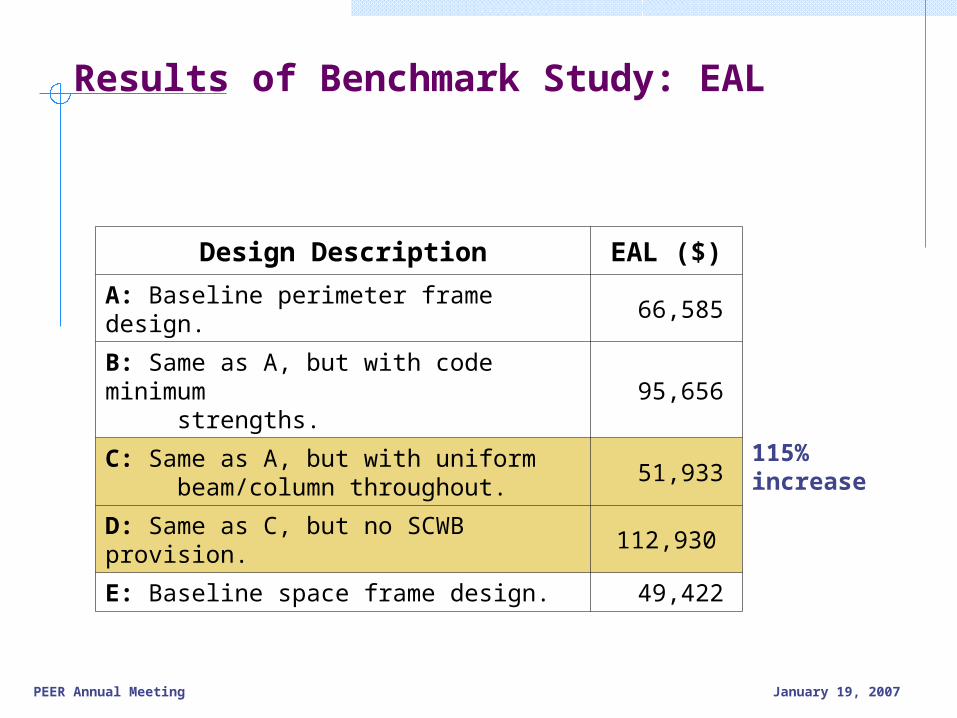
Results of Benchmark Study: EAL
Design Description EAL ($)
A: Baseline perimeter frame design. 66,585
B: Same as A, but with code minimum strengths.
95,656
C: Same as A, but with uniform beam/column throughout.
51,933
D: Same as C, but no SCWB provision. 112,930
E: Baseline space frame design. 49,422
115% increase

PEER Annual Meeting January 19, 2007
EAL Contributions
Contribution from collapse ~ 1%
Baseline Perimeter-Frame Design

PEER Annual Meeting January 19, 2007
ATC 20 guidelines (ATC 1985, 1995, 1996)
Event Tree
Building Safety: virtual inspector

PEER Annual Meeting January 19, 2007
ATC 20 guidelines (ATC 1985, 1995, 1996)
Event Tree
Building Safety: virtual inspector

PEER Annual Meeting January 19, 2007
Building Safety: rapid evaluation results
PEER Annual Meeting January 19, 2007
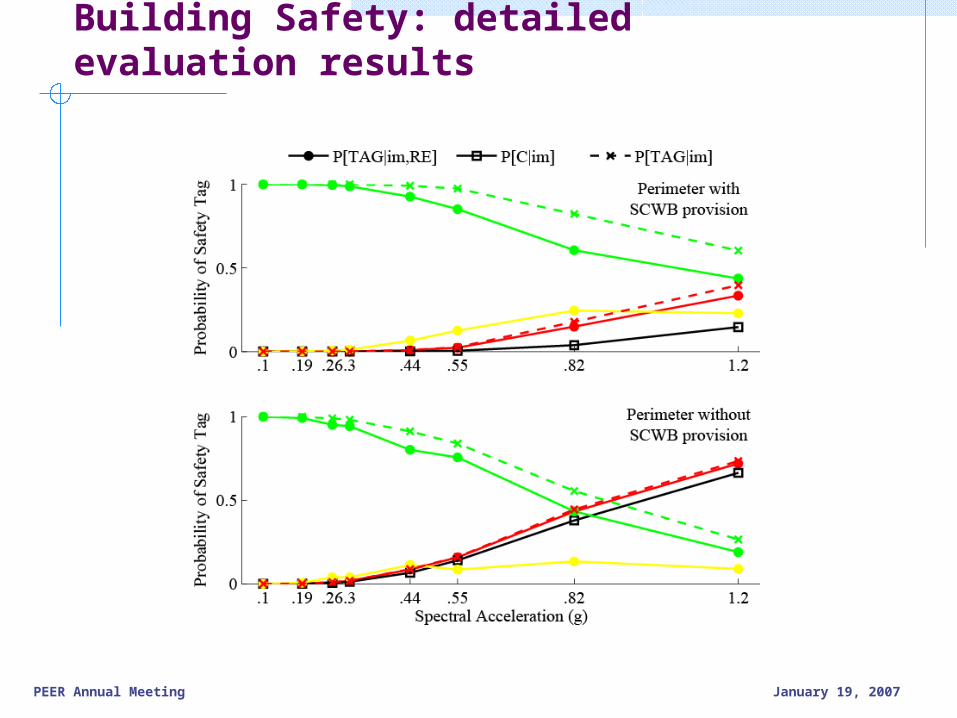
Building Safety: detailed evaluation results

PEER Annual Meeting January 19, 2007
Life Safety
Event Tree
P[C|im] determined by structural analysis
P[LC|im, NC] determined by virtual inspector
pDM from epidemiological studies and expert opinion

PEER Annual Meeting January 19, 2007
Life Safety
P[C|im] determined by structural analysis
P[LC|im, NC] determined by virtual inspector
pDM from epidemiological studies and expert opinion
Event Tree

PEER Annual Meeting January 19, 2007
Life Safety: mean population at risk
Mean # occupants determined from ATC-13 (1985).

PEER Annual Meeting January 19, 2007
DMpBuilding Characteristics
Fatality Model
Damage State (DM)
For all construction types except light steel and wood
frame.
ATC-13 (1985)
LC 0.01
C 0.20
Reinforced-concrete (non-near-field ground motions)
Coburn et al. (1992)
LC 0.31
C 0.49
Mid-rise concrete moment frame
HAZUS 99-SR2 (2002)
LC 0.0001
C 0.1
Mid-rise non-ductile reinforced-concrete frame
Shoaf and Seligson
(2005)
LC 0.015
C 0.131
Life Safety: fatality probabilities

PEER Annual Meeting January 19, 2007
DMpBuilding Characteristics
Fatality Model
Damage State (DM) E[Yn|DM] Var[Yn|DM]
For all construction types except light steel and wood
frame.
ATC-13 (1985)
LC 0.01 1.33 1.32
C 0.20 26.68 21.34
Reinforced-concrete (non-near-field ground motions)
Coburn et al. (1992)
LC 0.31 41.35 28.53
C 0.49 65.37 33.2
Mid-rise concrete moment frame
HAZUS 99-SR2 (2002)
LC 0.0001 0.01 0.01
C 0.1 13.34 12.01
Mid-rise non-ductile reinforced-concrete frame
Shoaf and Seligson
(2005)
LC 0.015 2.00 1.97
C 0.131 17.47 15.19
Life Safety: number of fatalities
Use Binomial distribution to estimate mean and variance of fatalities.

PEER Annual Meeting January 19, 2007
0 [ | ] ( | )dn cr
im
EANF E Y im p im im im im
Design DescriptionEANF(*10-3)
A: Baseline perimeter frame design. 1.4
B: Same as A, but with code-min strengths.
1.3
C: Same A, but with uniform beam/column throughout.
1.6
D: Same as C, but no SCWB provision. 22.8
E: Baseline space frame design. 1.0
Life Safety: expected annualnumber of fatalities

PEER Annual Meeting January 19, 2007
Design DescriptionEANF(*10-3)
EALF ($)
A: Baseline perimeter frame design. 1.4 4,900
B: Same as A, but with code-min strengths.
1.3 4,550
C: Same A, but with uniform beam/column throughout.
1.6 5,600
D: Same as C, but no SCWB provision. 22.8 79,800
E: Baseline space frame design. 1.0 3,500
value of a statistical life = $3.5M (FHWA 1994, Mrozeck and Taylor 2002)
EALF VSL EANF
VSL
Life Safety: expected annual lossdue to fatalities

PEER Annual Meeting January 19, 2007
[ | , ] [ | ] ( | , )
[ | ] ( | , )
[ | ] ( | , )
TO TO G G
TO Y Y
TO R R
E R NC im E R TAG P TAG NC im
E R TAG P TAG NC im
E R TAG P TAG NC im
• ABAG’s building inspection data from over 700 buildings after the Loma Prieta earthquake, 10 days (Blecher and Comerio 2006).
• Estimate by expert, 1 month (Scawthorne 2006).
• Estimate from Stanford case study of closed buildings after Loma Prieta earthquake, 6 months (Comerio 2006).
Results from the Virtual Inspector.
Downtime: mobilization delay
Use Virtual Inspector results to determine
mobilization delay.

PEER Annual Meeting January 19, 2007
Baseline Perimeter-Frame Design
Downtime: mobilization delay & repair time
10%-in-5yr
DT ~ 4 months
2%-in-50yr
DT ~ 17 months

PEER Annual Meeting January 19, 2007
Design DescriptionDown-time Type
Sa(T1)
EALD ($USD)
0.1 0.19 0.26 0.3 0.44 0.55 0.82 1.2
A: Baseline perimeter frame design.
Total(days) 24 52 114 157 284 388 518 655 20,519
B: Same as A, but with code-min strengths.
Total(days) 28 89 221 238 363 426 543 635 28,362
C: Same A, but with uniform beam/column throughout.
Total(days) 26 57 94 124 245 335 485 642 22,207
D: Same as C, but no SCWB provision.
Total(days) 30 94 220 239 386 491 726 942 32,726
E: Baseline space frame design.
Total(days) 26 42 85 119 217 332 577 949 19,517
Comerio (2006)
Downtime: economic losses

PEER Annual Meeting January 19, 2007
Comerio (2006) 16-32 months
Downtime: economic losses
Design DescriptionDown-time Type
Sa(T1)
EALD ($USD)
0.1 0.19 0.26 0.3 0.44 0.55 0.82 1.2
A: Baseline perimeter frame design.
Total(days) 24 52 114 157 284 388 518 655 20,519
B: Same as A, but with code-min strengths.
Total(days) 28 89 221 238 363 426 543 635 28,362
C: Same A, but with uniform beam/column throughout.
Total(days) 26 57 94 124 245 335 485 642 22,207
D: Same as C, but no SCWB provision.
Total(days) 30 94 220 239 386 491 726 942 32,726
E: Baseline space frame design.
Total(days) 26 42 85 119 217 332 577 949 19,517

PEER Annual Meeting January 19, 2007
Downtime: economic losses
Design DescriptionDown-time Type
Sa(T1)
EALD ($USD)
0.1 0.19 0.26 0.3 0.44 0.55 0.82 1.2
A: Baseline perimeter frame design.
Total(days) 24 52 114 157 284 388 518 655 20,519
B: Same as A, but with code-min strengths.
Total(days) 28 89 221 238 363 426 543 635 28,362
C: Same A, but with uniform beam/column throughout.
Total(days) 26 57 94 124 245 335 485 642 22,207
D: Same as C, but no SCWB provision.
Total(days) 30 94 220 239 386 491 726 942 32,726
E: Baseline space frame design.
Total(days) 26 42 85 119 217 332 577 949 19,517
28% increase in EALD for code-min design.

PEER Annual Meeting January 19, 2007
Downtime: economic losses
Design DescriptionDown-time Type
Sa(T1)
EALD ($USD)
0.1 0.19 0.26 0.3 0.44 0.55 0.82 1.2
A: Baseline perimeter frame design.
Total(days) 24 52 114 157 284 388 518 655 20,519
B: Same as A, but with code-min strengths.
Total(days) 28 89 221 238 363 426 543 635 28,362
C: Same A, but with uniform beam/column throughout.
Total(days) 26 57 94 124 245 335 485 642 22,207
D: Same as C, but no SCWB provision.
Total(days) 30 94 220 239 386 491 726 942 32,726
E: Baseline space frame design.
Total(days) 26 42 85 119 217 332 577 949 19,517
47% increase in EALD for
non-code-conforming design.
PEER Annual Meeting January 19, 2007
Design DescriptionEAL($)
EALD ($)
EALF ($)
EALTOTAL
($)
A: Baseline perimeter frame design. 66,585 20,519 4,900 92,004
B: Same as A, but with code-min strengths. 95,656 28,362 4,550 128,568
C: Same A, but with uniform beam/column throughout.
51,933 22,207 5,600 79,740
D: Same as C, but no SCWB provision. 112,930 32,726 79,800 225,456
E: Baseline space frame design. 49,422 19,517 3,500 72,439
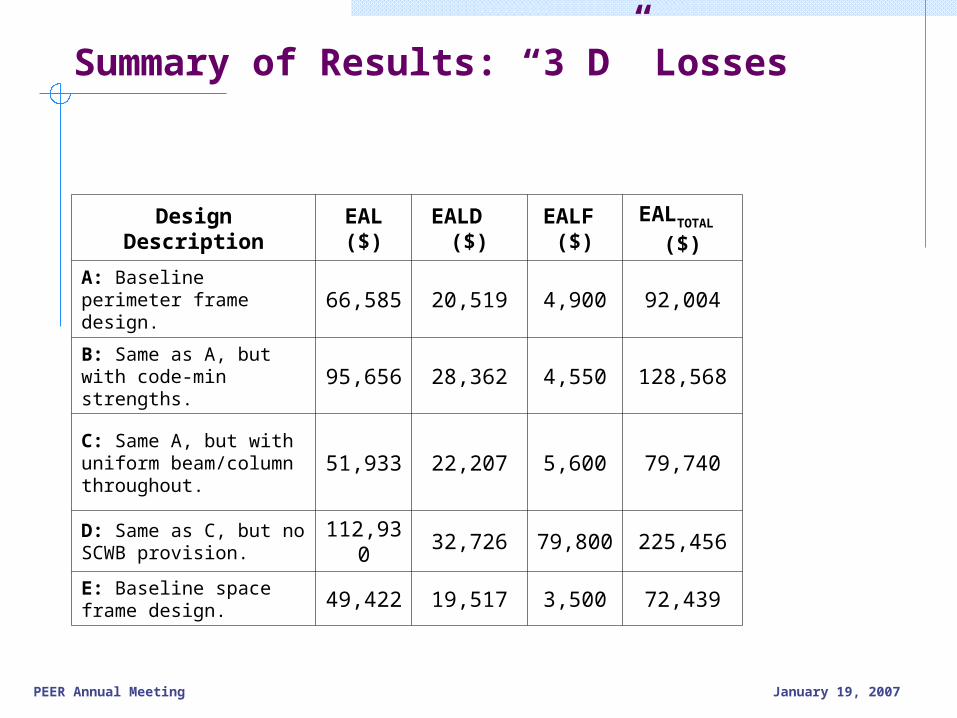
Summary of Results: “3 D” Losses

PEER Annual Meeting January 19, 2007
Design DescriptionEAL($)
EALD ($)
EALF ($)
EALTOTAL
($)
A: Baseline perimeter frame design. 66,585 20,519 4,900 92,004
B: Same as A, but with code-min strengths. 95,656 28,362 4,550 128,568
C: Same A, but with uniform beam/column throughout.
51,933 22,207 5,600 79,740
D: Same as C, but no SCWB provision. 112,930 32,726 79,800 225,456
E: Baseline space frame design. 49,422 19,517 3,500 72,439
Summary of Results: “3 D” Losses

PEER Annual Meeting January 19, 2007
Design DescriptionEAL($)
EALD ($)
EALF ($)
EALTOTAL
($)E[PVL(50yr)]
($M)
A: Baseline perimeter frame design. 66,585 20,519 4,900 92,004 1.84
B: Same as A, but with code-min strengths. 95,656 28,362 4,550 128,568 2.50
C: Same A, but with uniform beam/column throughout.
51,933 22,207 5,600 79,740 1.64
D: Same as C, but no SCWB provision. 112,930 32,726 79,800 225,456 6.66
E: Baseline space frame design. 49,422 19,517 3,500 72,439 1.44
Summary of Results: “3 D” Losses

PEER Annual Meeting January 19, 2007
Benefit-Cost Analysis
Benefit = [ (50yr)] [ (50yr)] $403,500
Cost = [upfront cost] [upfront cost)] $100, 000
Benefit4
Cost
perimeter space
space perimeter
E PVL E PVL
E E
A risk-neutral decision maker will choose the space-frame design!

PEER Annual Meeting January 19, 2007
Summary
• Established framework for estimating the 3 D’s (dollars, deaths and downtime) as part of PEER’s PBEE framework.
• Used PEER benchmark study to illustrate this loss framework.
• Results show that all metrics are important in estimating overall building performance, and should all be included in a building loss estimation and BCA.
• We hope that this effort will contribute to the ongoing ATC-58 effort (downtime & deaths).

PEER Annual Meeting January 19, 2007
Thank You!