Embed Size (px)
Citation preview
Modeling crawling cell motility
J. Löber1 F. Ziebert2 I. S. Aranson3
1Institute of Theoretical PhysicsTU Berlin
2Institute of PhysicsUniversity of Freiburg
3Materials Science DivisionArgonne National Laboratory
Mini-Symposium TU Berlin, July 2014
J. Löber, F. Ziebert, I. S. Aranson Modeling crawling cell motility
Introduction
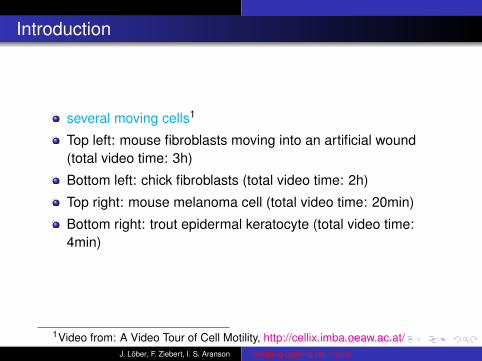
several moving cells1
Top left: mouse fibroblasts moving into an artificial wound(total video time: 3h)
Bottom left: chick fibroblasts (total video time: 2h)
Top right: mouse melanoma cell (total video time: 20min)
Bottom right: trout epidermal keratocyte (total video time:4min)
1Video from: A Video Tour of Cell Motility, http://cellix.imba.oeaw.ac.at/J. Löber, F. Ziebert, I. S. Aranson Modeling crawling cell motility
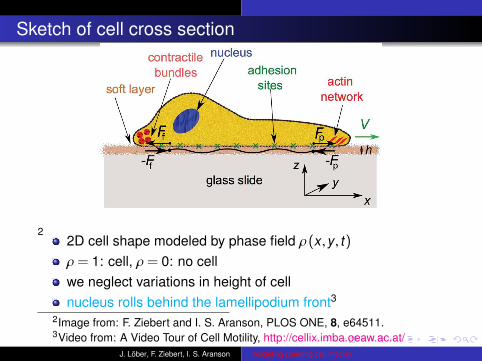
Sketch of cell cross section
22D cell shape modeled by phase field ρ(x,y, t)ρ = 1: cell, ρ = 0: no cellwe neglect variations in height of cellnucleus rolls behind the lamellipodium front3
2Image from: F. Ziebert and I. S. Aranson, PLOS ONE, 8, e64511.3Video from: A Video Tour of Cell Motility, http://cellix.imba.oeaw.ac.at/
J. Löber, F. Ziebert, I. S. Aranson Modeling crawling cell motility
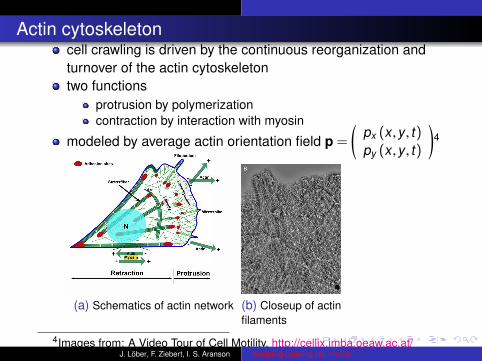
Actin cytoskeletoncell crawling is driven by the continuous reorganization andturnover of the actin cytoskeletontwo functions
protrusion by polymerizationcontraction by interaction with myosin
modeled by average actin orientation field p =
(px (x,y, t)py (x,y, t)
)4
(a) Schematics of actin network (b) Closeup of actinfilaments
4Images from: A Video Tour of Cell Motility, http://cellix.imba.oeaw.ac.at/J. Löber, F. Ziebert, I. S. Aranson Modeling crawling cell motility
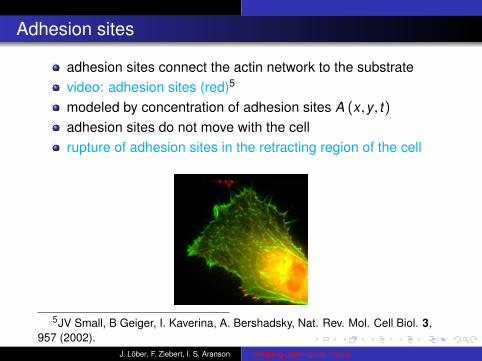
Adhesion sites
adhesion sites connect the actin network to the substratevideo: adhesion sites (red)5
modeled by concentration of adhesion sites A (x,y, t)adhesion sites do not move with the cellrupture of adhesion sites in the retracting region of the cell
5JV Small, B Geiger, I. Kaverina, A. Bershadsky, Nat. Rev. Mol. Cell Biol. 3,957 (2002).
J. Löber, F. Ziebert, I. S. Aranson Modeling crawling cell motility
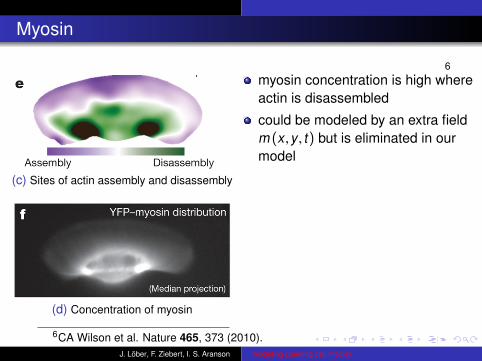
Myosin
(c) Sites of actin assembly and disassembly
(d) Concentration of myosin
myosin concentration is high whereactin is disassembled
could be modeled by an extra fieldm (x,y, t) but is eliminated in ourmodel
6
6CA Wilson et al. Nature 465, 373 (2010).J. Löber, F. Ziebert, I. S. Aranson Modeling crawling cell motility
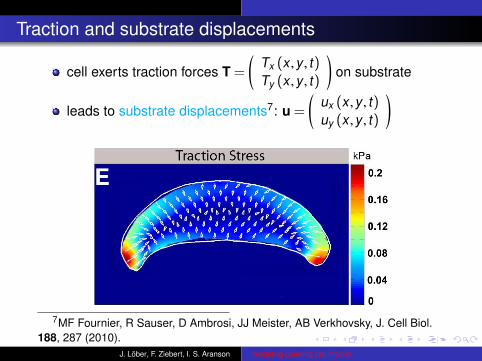
Traction and substrate displacements
cell exerts traction forces T =
(Tx (x,y, t)Ty (x,y, t)
)on substrate
leads to substrate displacements7: u =
(ux (x,y, t)uy (x,y, t)
)
7MF Fournier, R Sauser, D Ambrosi, JJ Meister, AB Verkhovsky, J. Cell Biol.188, 287 (2010).
J. Löber, F. Ziebert, I. S. Aranson Modeling crawling cell motility
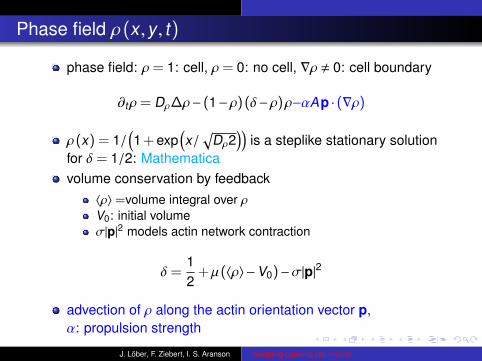
Phase field ρ(x,y, t)
phase field: ρ = 1: cell, ρ = 0: no cell, ∇ρ , 0: cell boundary
∂tρ = Dρ∆ρ− (1−ρ)(δ−ρ)ρ−αAp · (∇ρ)
ρ(x) = 1/(1 + exp
(x/
√Dρ2
))is a steplike stationary solution
for δ = 1/2: Mathematicavolume conservation by feedback
〈ρ〉=volume integral over ρV0: initial volumeσ|p|2 models actin network contraction
δ =12
+µ(〈ρ〉−V0)−σ|p|2
advection of ρ along the actin orientation vector p,α: propulsion strength
J. Löber, F. Ziebert, I. S. Aranson Modeling crawling cell motility
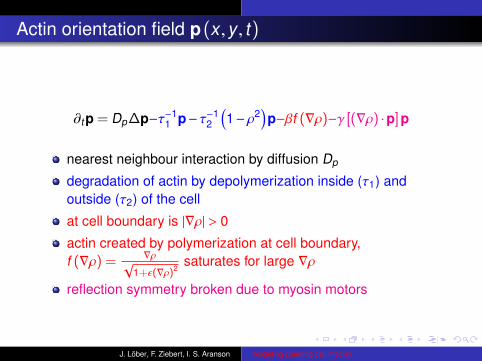
Actin orientation field p(x,y, t)
∂tp = Dp∆p−τ−11 p−τ−1
2
(1−ρ2
)p−βf (∇ρ)−γ [(∇ρ) ·p]p
nearest neighbour interaction by diffusion Dp
degradation of actin by depolymerization inside (τ1) andoutside (τ2) of the cell
at cell boundary is |∇ρ| > 0
actin created by polymerization at cell boundary,f (∇ρ) = ∇ρ
√1+ε(∇ρ)2
saturates for large ∇ρ
reflection symmetry broken due to myosin motors
J. Löber, F. Ziebert, I. S. Aranson Modeling crawling cell motility
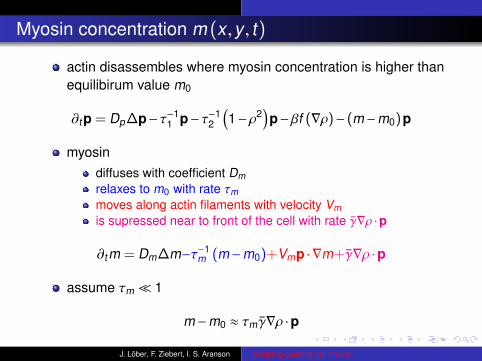
Myosin concentration m (x,y, t)
actin disassembles where myosin concentration is higher thanequilibirum value m0
∂tp = Dp∆p−τ−11 p−τ−1
2
(1−ρ2
)p−βf (∇ρ)− (m−m0)p
myosindiffuses with coefficient Dmrelaxes to m0 with rate τmmoves along actin filaments with velocity Vmis supressed near to front of the cell with rate γ∇ρ ·p
∂tm = Dm∆m−τ−1m (m−m0)+Vmp · ∇m+γ∇ρ ·p
assume τm � 1
m−m0 ≈ τmγ∇ρ ·p
J. Löber, F. Ziebert, I. S. Aranson Modeling crawling cell motility
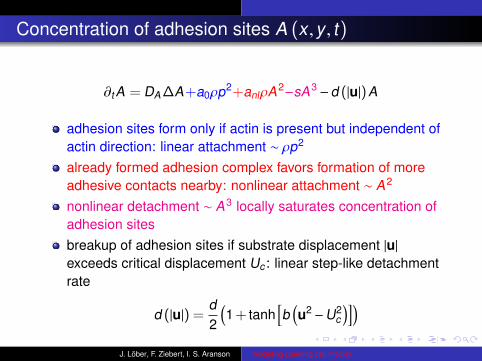
Concentration of adhesion sites A (x,y, t)
∂tA = DA ∆A+a0ρp2+anlρA2−sA3−d (|u|)A
adhesion sites form only if actin is present but independent ofactin direction: linear attachment ∼ ρp2
already formed adhesion complex favors formation of moreadhesive contacts nearby: nonlinear attachment ∼ A2
nonlinear detachment ∼ A3 locally saturates concentration ofadhesion sitesbreakup of adhesion sites if substrate displacement |u|exceeds critical displacement Uc : linear step-like detachmentrate
d (|u|) =d2
(1 + tanh
[b(u2−U2
c
)])J. Löber, F. Ziebert, I. S. Aranson Modeling crawling cell motility
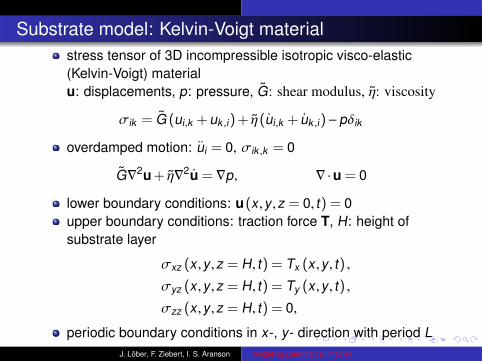
Substrate model: Kelvin-Voigt materialstress tensor of 3D incompressible isotropic visco-elastic(Kelvin-Voigt) materialu: displacements, p: pressure, G: shear modulus, η: viscosity
σik = G (ui,k + uk ,i) + η(ui,k + uk ,i)−pδik
overdamped motion: ui = 0, σik ,k = 0
G∇2u + η∇2u = ∇p, ∇ ·u = 0
lower boundary conditions: u(x,y,z = 0, t) = 0upper boundary conditions: traction force T, H: height ofsubstrate layer
σxz (x,y,z = H, t) = Tx (x,y, t) ,
σyz (x,y,z = H, t) = Ty (x,y, t) ,
σzz (x,y,z = H, t) = 0,
periodic boundary conditions in x-, y- direction with period LJ. Löber, F. Ziebert, I. S. Aranson Modeling crawling cell motility
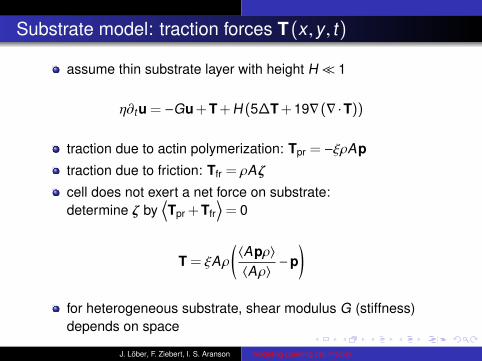
Substrate model: traction forces T(x,y, t)
assume thin substrate layer with height H� 1
η∂tu = −Gu + T + H (5∆T + 19∇(∇ ·T))
traction due to actin polymerization: Tpr = −ξρAp
traction due to friction: Tfr = ρAζ
cell does not exert a net force on substrate:determine ζ by
⟨Tpr + Tfr
⟩= 0
T = ξAρ(〈Apρ〉〈Aρ〉
−p)
for heterogeneous substrate, shear modulus G (stiffness)depends on space
J. Löber, F. Ziebert, I. S. Aranson Modeling crawling cell motility
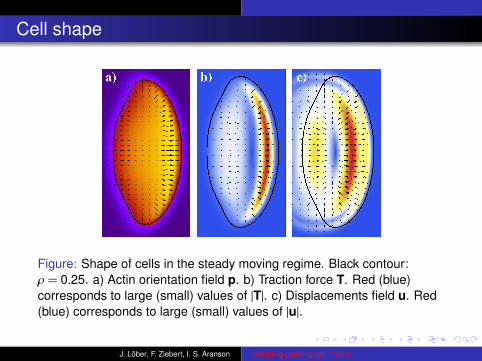
Cell shape
Figure: Shape of cells in the steady moving regime. Black contour:ρ = 0.25. a) Actin orientation field p. b) Traction force T. Red (blue)corresponds to large (small) values of |T|. c) Displacements field u. Red(blue) corresponds to large (small) values of |u|.
J. Löber, F. Ziebert, I. S. Aranson Modeling crawling cell motility
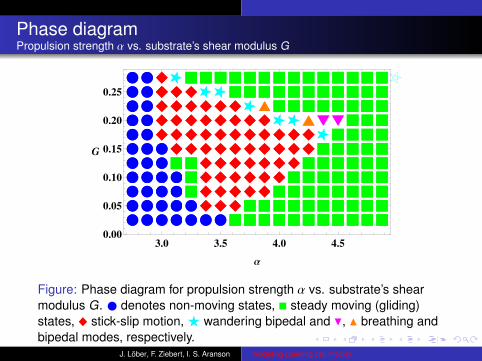
Phase diagramPropulsion strength α vs. substrate’s shear modulus G
3.0 3.5 4.0 4.50.00
0.05
0.10
0.15
0.20
0.25
Α
G
Figure: Phase diagram for propulsion strength α vs. substrate’s shearmodulus G. denotes non-moving states, � steady moving (gliding)states, _ stick-slip motion,F wandering bipedal and H, N breathing andbipedal modes, respectively.
J. Löber, F. Ziebert, I. S. Aranson Modeling crawling cell motility
Stick-slip motion
0 20 40 60 80 100
-1.0
-0.5
0.0
0.5
1.0
1.5
t
y
aL bL cL dL
x
y
aL bL
cL dL
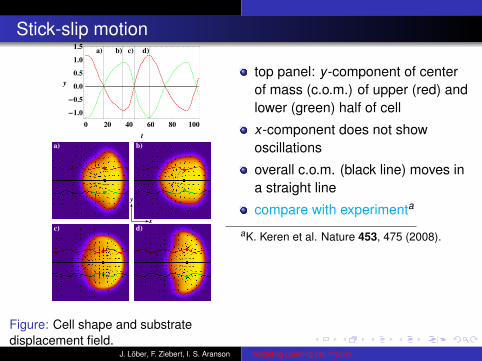
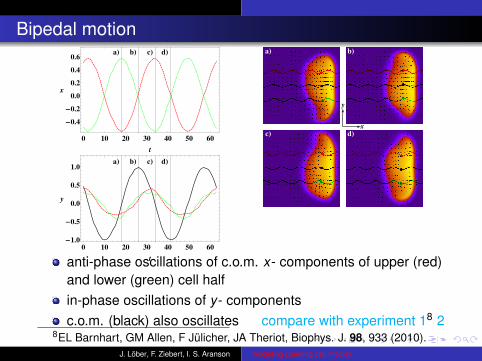
Figure: Cell shape and substratedisplacement field.
top panel: y-component of centerof mass (c.o.m.) of upper (red) andlower (green) half of cell
x-component does not showoscillations
overall c.o.m. (black line) moves ina straight line
compare with experimenta
aK. Keren et al. Nature 453, 475 (2008).
J. Löber, F. Ziebert, I. S. Aranson Modeling crawling cell motility
Bipedal motion
0 10 20 30 40 50 60
-0.4
-0.2
0.0
0.2
0.4
0.6
t
x
aL bL cL dL
0 10 20 30 40 50 60
-1.0
-0.5
0.0
0.5
1.0
t
y
aL bL cL dL
x
y
aL bL
cL dL
anti-phase oscillations of c.o.m. x- components of upper (red)and lower (green) cell halfin-phase oscillations of y- componentsc.o.m. (black) also oscillates compare with experiment 18 2
8EL Barnhart, GM Allen, F Jülicher, JA Theriot, Biophys. J. 98, 933 (2010).J. Löber, F. Ziebert, I. S. Aranson Modeling crawling cell motility
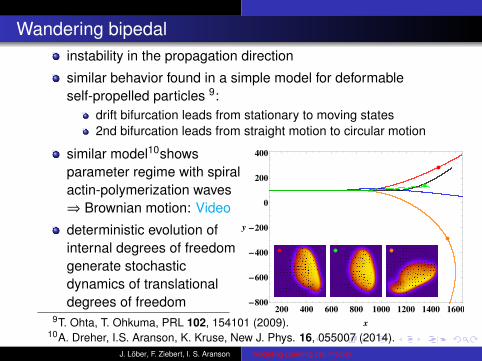
Wandering bipedalinstability in the propagation direction
similar behavior found in a simple model for deformableself-propelled particles 9:
drift bifurcation leads from stationary to moving states2nd bifurcation leads from straight motion to circular motion
similar model10showsparameter regime with spiralactin-polymerization waves⇒ Brownian motion: Video
deterministic evolution ofinternal degrees of freedomgenerate stochasticdynamics of translationaldegrees of freedom
200 400 600 800 1000 1200 1400 1600-800
-600
-400
-200
0
200
400
x
y
9T. Ohta, T. Ohkuma, PRL 102, 154101 (2009).10A. Dreher, I.S. Aranson, K. Kruse, New J. Phys. 16, 055007 (2014).
J. Löber, F. Ziebert, I. S. Aranson Modeling crawling cell motility
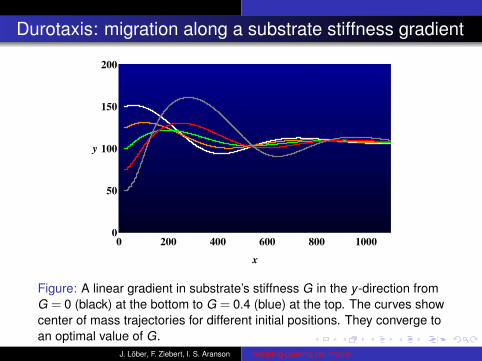
Durotaxis: migration along a substrate stiffness gradient
0 200 400 600 800 10000
50
100
150
200
x
y
Figure: A linear gradient in substrate’s stiffness G in the y-direction fromG = 0 (black) at the bottom to G = 0.4 (blue) at the top. The curves showcenter of mass trajectories for different initial positions. They converge toan optimal value of G.
J. Löber, F. Ziebert, I. S. Aranson Modeling crawling cell motility
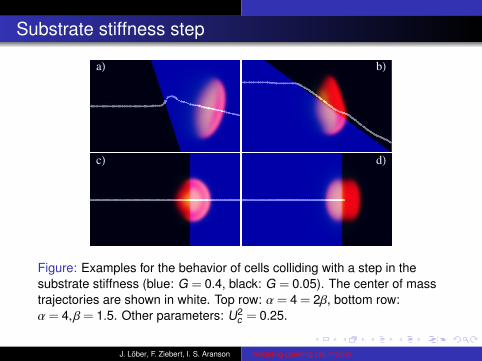
Substrate stiffness step
aL bL
cL dL
Figure: Examples for the behavior of cells colliding with a step in thesubstrate stiffness (blue: G = 0.4, black: G = 0.05). The center of masstrajectories are shown in white. Top row: α = 4 = 2β, bottom row:α = 4,β = 1.5. Other parameters: U2
c = 0.25.
J. Löber, F. Ziebert, I. S. Aranson Modeling crawling cell motility
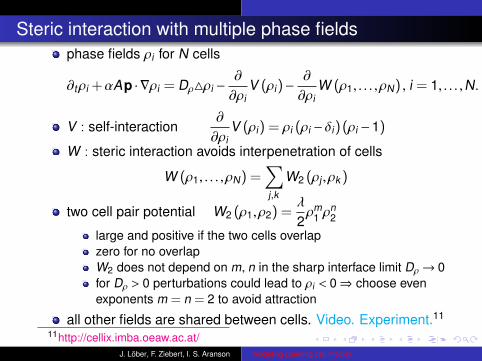
Steric interaction with multiple phase fieldsphase fields ρi for N cells
∂tρi +αAp · ∇ρi = Dρ4ρi −∂
∂ρiV (ρi)−
∂
∂ρiW (ρ1, . . . ,ρN) , i = 1, . . . ,N.
V : self-interaction∂
∂ρiV (ρi) = ρi (ρi −δi)(ρi −1)
W : steric interaction avoids interpenetration of cells
W (ρ1, . . . ,ρN) =∑j,k
W2 (ρj ,ρk )
two cell pair potential W2 (ρ1,ρ2) =λ
2ρm
1 ρn2
large and positive if the two cells overlapzero for no overlapW2 does not depend on m, n in the sharp interface limit Dρ→ 0for Dρ > 0 perturbations could lead to ρi < 0⇒ choose evenexponents m = n = 2 to avoid attraction
all other fields are shared between cells. Video. Experiment.11
11http://cellix.imba.oeaw.ac.at/J. Löber, F. Ziebert, I. S. Aranson Modeling crawling cell motility
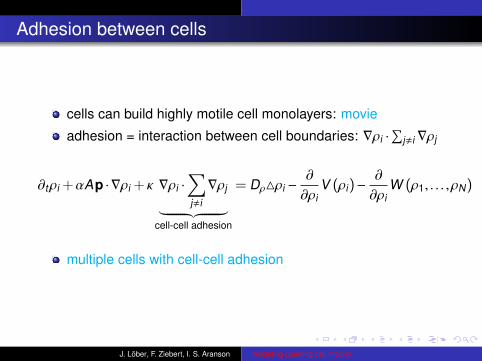
Adhesion between cells
cells can build highly motile cell monolayers: movie
adhesion = interaction between cell boundaries: ∇ρi ·∑
j,i∇ρj
∂tρi +αAp · ∇ρi + κ ∇ρi ·∑j,i
∇ρj︸ ︷︷ ︸cell-cell adhesion
= Dρ4ρi −∂
∂ρiV (ρi)−
∂
∂ρiW (ρ1, . . . ,ρN)
multiple cells with cell-cell adhesion
J. Löber, F. Ziebert, I. S. Aranson Modeling crawling cell motility
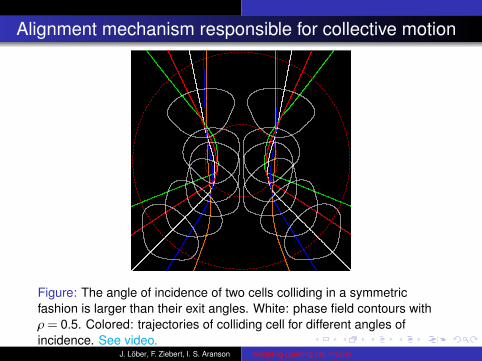
Alignment mechanism responsible for collective motion
Figure: The angle of incidence of two cells colliding in a symmetricfashion is larger than their exit angles. White: phase field contours withρ = 0.5. Colored: trajectories of colliding cell for different angles ofincidence. See video.
J. Löber, F. Ziebert, I. S. Aranson Modeling crawling cell motility
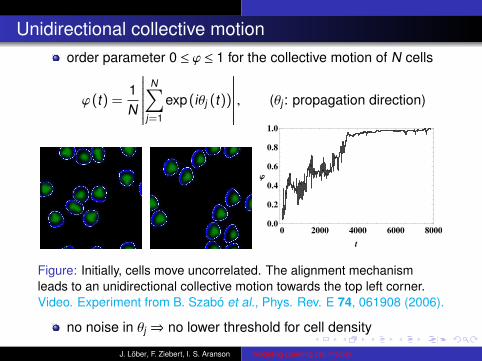
Unidirectional collective motionorder parameter 0 ≤ ϕ ≤ 1 for the collective motion of N cells
ϕ(t) =1N
∣∣∣∣∣∣∣∣N∑
j=1
exp(iθj (t))
∣∣∣∣∣∣∣∣ , (θj : propagation direction)
0 2000 4000 6000 80000.0
0.2
0.4
0.6
0.8
1.0
t
j
Figure: Initially, cells move uncorrelated. The alignment mechanismleads to an unidirectional collective motion towards the top left corner.Video. Experiment from B. Szabó et al., Phys. Rev. E 74, 061908 (2006).
no noise in θj ⇒ no lower threshold for cell density
J. Löber, F. Ziebert, I. S. Aranson Modeling crawling cell motility
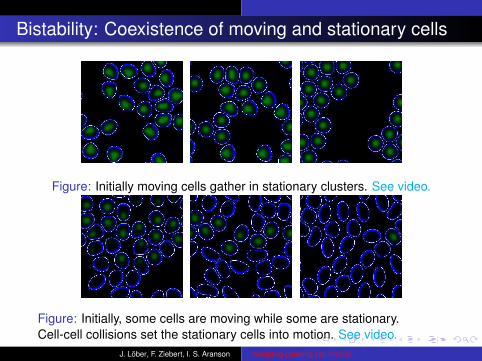
Bistability: Coexistence of moving and stationary cells
Figure: Initially moving cells gather in stationary clusters. See video.
Figure: Initially, some cells are moving while some are stationary.Cell-cell collisions set the stationary cells into motion. See video.
J. Löber, F. Ziebert, I. S. Aranson Modeling crawling cell motility
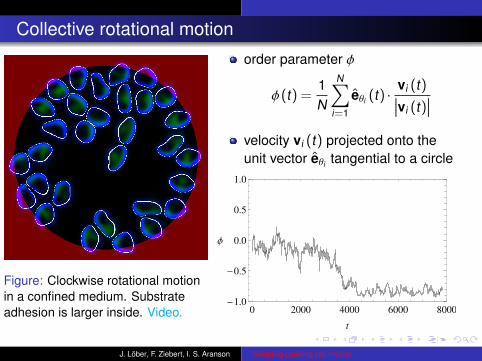
Collective rotational motion
Figure: Clockwise rotational motionin a confined medium. Substrateadhesion is larger inside. Video.
order parameter φ
φ(t) =1N
N∑i=1
eθi (t) ·vi (t)∣∣∣vi (t)
∣∣∣velocity vi (t) projected onto theunit vector eθi tangential to a circle
0 2000 4000 6000 8000-1.0
-0.5
0.0
0.5
1.0
t
Φ
J. Löber, F. Ziebert, I. S. Aranson Modeling crawling cell motility
Collective rotational motion in experiments
experiment with keratocytes from12: Video
MDCK epithelial cells are placed on substrate with patternedadhesiveness13
modeled with cellular Potts model
switching off adhesion molecules (E-cadherin) leads to lesspersistent rotational motion
carcinomas (epithelial cancer cells) express altered migrationbehavior due to decreased cell-cell adhesion
12B. Szabó, G. J. Szöllösi, B. Gönci, Zs. Jurányi, D. Selmeczi, T. Vicsek, Phys.Rev. E 74, 061908 (2006).
13K. Doxzen et al., Integr. Biol. 5, 1026 (2013).J. Löber, F. Ziebert, I. S. Aranson Modeling crawling cell motility
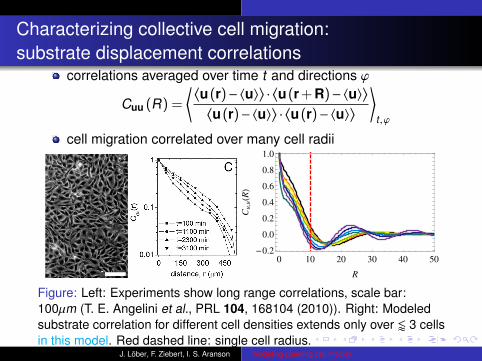
Characterizing collective cell migration:substrate displacement correlations
correlations averaged over time t and directions ϕ
Cuu (R) =
⟨⟨u(r)−〈u〉
⟩·⟨u(r + R)−〈u〉
⟩⟨u(r)−〈u〉
⟩·⟨u(r)−〈u〉
⟩ ⟩t ,ϕ
cell migration correlated over many cell radii
0 10 20 30 40 50-0.2
0.0
0.2
0.4
0.6
0.8
1.0
R
Cu,u
HRL
Figure: Left: Experiments show long range correlations, scale bar:100µm (T. E. Angelini et al., PRL 104, 168104 (2010)). Right: Modeledsubstrate correlation for different cell densities extends only over / 3 cellsin this model. Red dashed line: single cell radius.
J. Löber, F. Ziebert, I. S. Aranson Modeling crawling cell motility
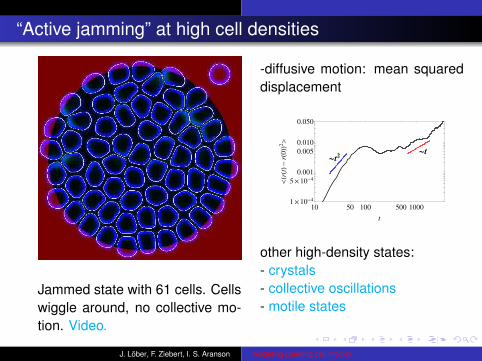
“Active jamming” at high cell densities
Jammed state with 61 cells. Cellswiggle around, no collective mo-tion. Video.
-diffusive motion: mean squareddisplacement
10 50 100 500 10001 ´ 10
-4
5 ´ 10-4
0.001
0.005
0.010
0.050
t
<HrH
tL-
rH0L
L2>
~t
~t2
other high-density states:- crystals- collective oscillations- motile states
J. Löber, F. Ziebert, I. S. Aranson Modeling crawling cell motility
Summary
phenomenological model for crawling cells based onreaction-diffusion equations
cells exhibit different modes of movement accompanied byshape changes similar to experiments
stick-slip motionbipedal motion
migration of cells is sensitive to mechanical properties ofsubstrate
collective motion of multiple cells modeled with interactingphase fields
J. Löber, F. Ziebert, I. S. Aranson Modeling crawling cell motility
Outlook
derive model equations in more fundamental way as e.g. in 14
fit model parameters to specific cell types
search for states with high-density and long range correlations
14Generic theory of active polar gels: a paradigm for cytoskeletal dynamics, K.Kruse, J.F. Joanny, F. Jülicher, J. Prost, K. Sekimoto, Eur. Phys. J. E 16, 5 (2005).
J. Löber, F. Ziebert, I. S. Aranson Modeling crawling cell motility
Appendix For Further Reading
For Further Reading I
J. Löber, F. Ziebert, and I. S. Aranson.Modeling crawling cell movement on soft engineeredsubstrates.Soft Matter 10, 1365 (2014).
F. Ziebert, S. Swaminathan, and I. S. Aranson.Model for self-polarization and motility of keratocyte fragments.J. R. Soc. Interface 9, 1084 (2012).
F. Ziebert, and I. S. Aranson.Effects of Adhesion Dynamics and Substrate Compliance onthe Shape and Motility of Crawling Cells.PLOS ONE, 8, e64511 (2013).
J. Löber, F. Ziebert, I. S. Aranson Modeling crawling cell motility