Embed Size (px)
Citation preview
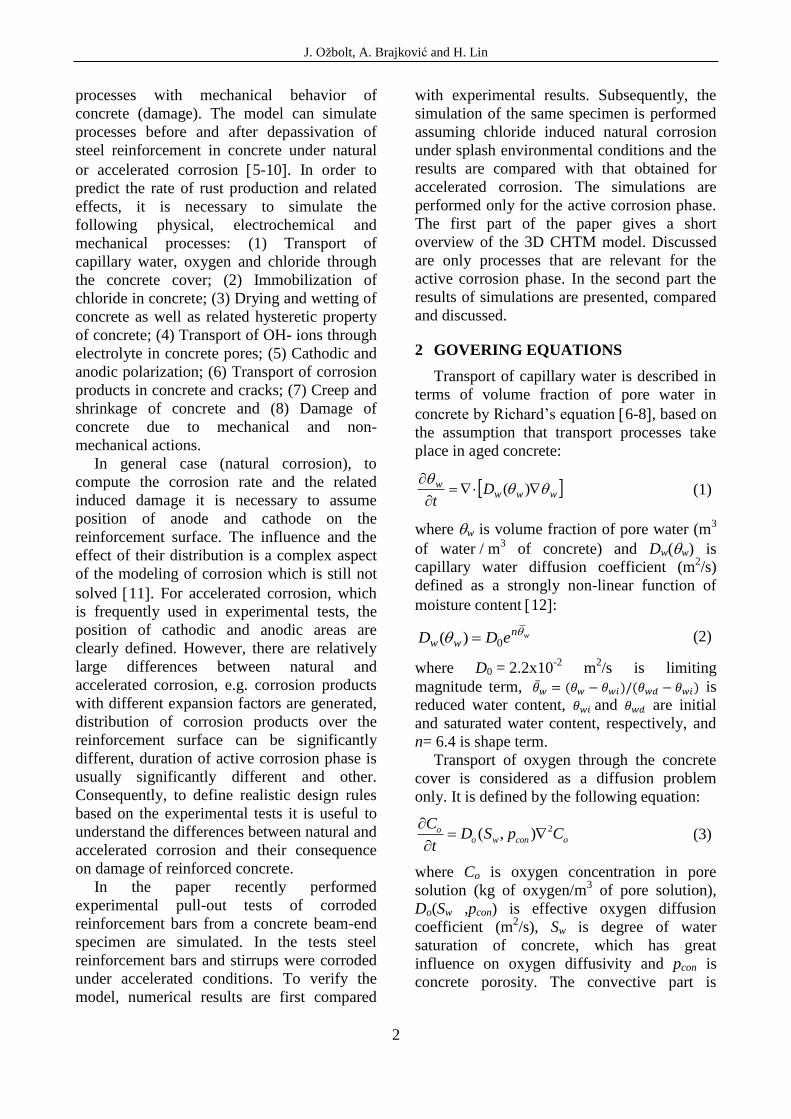
10th International Conference on Fracture Mechanics of Concrete and Concrete Structures
FraMCoS-X G. Pijaudier-Cabot, P. Grassl and C. La Borderie (Eds)
1
MODELING CORROSION OF STEEL REINFORCEMENT IN CONCRETE:
NATURAL VS. ACCELERATED CORROSION
J. OŽBOLT*, A. BRAJKOVIĆ
* AND H. LIN
†
* Institute of Construction Materials, University of Stuttgart
70560 Stuttgart, Germany
e-mail: [email protected]
† Department of Civil Engineering, Tsinghua University
100084 Beijing, China
e-mail: [email protected]
Key words: Reinforced Concrete, Corrosion, Durability, Numerical Simulation
Abstract: Chloride-induced corrosion of steel reinforcement in concrete is one of the major reasons
for deterioration of reinforced concrete structures. In the present paper a recently developed coupled
3D chemo-hygro-thermo-mechanical model for concrete is used to study the difference between
natural and accelerated corrosion of steel reinforcement in concrete beam-end specimen. Only
active corrosion phase is simulated for natural and accelerated corrosion. The results of the analysis
are compared with the available test results performed under accelerated conditions. For accelerated
corrosion a good agreement between predicted and experimentally observed corrosion induced
damage and pull-out resistance of corroded reinforcement bar is obtained. The comparison between
natural and accelerated corrosion shows that there is a relatively large difference between
distribution of current density (corrosion) over the surface of main reinforcement bar and stirrups.
1 INTRODUCTION
Deterioration of reinforced concrete
structures caused by chloride-induced
corrosion is one of the major concerns for
durability of RC structures 12.
Consequences of chloride-induced corrosion
of steel reinforcement have negative effects on
structural behavior and involve several aspects
related to the life cycle of the structure, such as
serviceability, safety and structural
performance. The main effect of the corrosion
attack is manifested as cracking and spalling
of concrete cover, due to the expansion of
corrosion products, which have greater volume
than the steel. Direct and indirect costs of
maintenance and repair are very high.
Therefore, it is important to develop and
improve numerical tools which can
realistically simulate corrosion processes and
the related mechanism of deterioration in RC
structures.
Before depassivation of reinforcement a
surface layer of ferric oxide covers and
protects the steel in concrete. Depassivation of
the protective layer can occur by reaching a
critical threshold concentration of free chloride
ions near the reinforcement bar surface or as a
consequence of carbonation of concrete 1.
Corrosion of steel in concrete is an
electrochemical process dependent on the
electrical conductivity of the concrete and steel
surfaces and the concentration of dissolved
oxygen in the pore water near the
reinforcement 3 4. The recently developed
3D chemo-hygro-thermo-mechanical (CHTM)
model, which is employed in the present
numerical simulations, couples the above
mentioned physical and electrochemical
J. Ožbolt, A. Brajković and H. Lin
2
processes with mechanical behavior of
concrete (damage). The model can simulate
processes before and after depassivation of
steel reinforcement in concrete under natural
or accelerated corrosion 5-10. In order to
predict the rate of rust production and related
effects, it is necessary to simulate the
following physical, electrochemical and
mechanical processes: (1) Transport of
capillary water, oxygen and chloride through
the concrete cover; (2) Immobilization of
chloride in concrete; (3) Drying and wetting of
concrete as well as related hysteretic property
of concrete; (4) Transport of OH- ions through
electrolyte in concrete pores; (5) Cathodic and
anodic polarization; (6) Transport of corrosion
products in concrete and cracks; (7) Creep and
shrinkage of concrete and (8) Damage of
concrete due to mechanical and non-
mechanical actions.
In general case (natural corrosion), to
compute the corrosion rate and the related
induced damage it is necessary to assume
position of anode and cathode on the
reinforcement surface. The influence and the
effect of their distribution is a complex aspect
of the modeling of corrosion which is still not
solved 11. For accelerated corrosion, which
is frequently used in experimental tests, the
position of cathodic and anodic areas are
clearly defined. However, there are relatively
large differences between natural and
accelerated corrosion, e.g. corrosion products
with different expansion factors are generated,
distribution of corrosion products over the
reinforcement surface can be significantly
different, duration of active corrosion phase is
usually significantly different and other.
Consequently, to define realistic design rules
based on the experimental tests it is useful to
understand the differences between natural and
accelerated corrosion and their consequence
on damage of reinforced concrete.
In the paper recently performed
experimental pull-out tests of corroded
reinforcement bars from a concrete beam-end
specimen are simulated. In the tests steel
reinforcement bars and stirrups were corroded
under accelerated conditions. To verify the
model, numerical results are first compared
with experimental results. Subsequently, the
simulation of the same specimen is performed
assuming chloride induced natural corrosion
under splash environmental conditions and the
results are compared with that obtained for
accelerated corrosion. The simulations are
performed only for the active corrosion phase.
The first part of the paper gives a short
overview of the 3D CHTM model. Discussed
are only processes that are relevant for the
active corrosion phase. In the second part the
results of simulations are presented, compared
and discussed.
2 GOVERING EQUATIONS
Transport of capillary water is described in
terms of volume fraction of pore water in
concrete by Richard’s equation 6-8, based on
the assumption that transport processes take
place in aged concrete:
wwww Dt
)(
(1)
where w is volume fraction of pore water (m3
of water / m3 of concrete) and Dw(w) is
capillary water diffusion coefficient (m2/s)
defined as a strongly non-linear function of
moisture content 12:
wnww eDD
0)(
(2)
where D0 = 2.2x10⁻²
m2/s is limiting
magnitude term, ̅ is
reduced water content, and are initial
and saturated water content, respectively, and
n= 6.4 is shape term.
Transport of oxygen through the concrete
cover is considered as a diffusion problem
only. It is defined by the following equation:
2( , )oo w con o
CD S p C
t
(3)
where Co is oxygen concentration in pore
solution (kg of oxygen/m3 of pore solution),
Do(Sw ,pcon) is effective oxygen diffusion
coefficient (m2/s), Sw is degree of water
saturation of concrete, which has great
influence on oxygen diffusivity and pcon is
concrete porosity. The convective part is
J. Ožbolt, A. Brajković and H. Lin
3
neglected due to the assumption that water
saturation of concrete is uniform 5.
The oxygen consumed at cathode surface is
supplied from concrete by oxygen diffusion.
The oxygen diffusion flux at the cathode
surface, (kg/m
2 s) can be calculated as:
( , )c oo o w con
cathode
Cj D S p
n
(4)
where n is the outward normal to the cathode
surface.
The oxygen consumption at the cathodic
and anodic surfaces can be calculated as:
8
( , )
kg8.29 10
C
oo w con c c
cathode
c
CD S p k i
n
k
(5a)
8
( , )
kg4.14 10
C
oo w con a a
anode
a
CD S p k i
n
k
(5b)
where ic and ia are cathodic and anodic current
density (A/m2), respectively. The constants kc
and ka are calculated using the stoichiometry
of chemical reactions and Faraday's law.
The electric current through the electrolyte
is a result of motion of charged particles and,
if the electrical neutrality of the system and the
uniform ions concentration are assumed, can
be written as:
Φ i (6)
where i is electric current density vector, is
electrical conductivity of concrete and is
electric potential. If electrical neutrality is
accounted for and electrical conductivity of
concrete is assumed as uniformly distributed,
the equation of electrical charge conservation
reads 6:
2 0 Φ (7)
For a given boundary conditions,
on all surfaces of the concrete body, the
solution of Eq. (5) determines the electric
potential distribution, and using Eq. (4) the
corrosion current density can be calculated.
According to Butler–Volmer kinetics, in the
present model kinetics of reaction at the
cathodic and anodic surface can be estimated
from:
2.3 /
0c co
c c
ob
Ci i e
C
2.3 /
0a a
a ai i e
(8)
where Cob is oxygen concentration at surface
of concrete element exposed to seawater
(kg/m3), a and c are the anodic and cathodic
overpotential, respectively, i0c and i0a are the
exchange current density of the cathodic and
anodic reaction (A/m2), c and a are the Tafel
slope for cathodic and anodic reaction (V/dec),
respectively. From experiments 13 it is known that in
the case of chloride type of corrosion the part of corrosion products penetrate into the pore of concrete around the reinforcement bar and relatively large amount of rust can be transported through radial cracks that are generated because of expansion of corrosion products. This transport is very much dependent on water saturation 14. Mathematically speaking distribution of corrosion product (red rust) R (kg/m
3 of pore
solution) into the pores of concrete and in the cracks is modeled as convective diffusion problem:
( )w w r w w w
Rθ θ D R D θ θ R
t
(9)
in which Dr is diffusion coefficient (m2/s) of
corrosion product. Note that Eq. (9) does not
describe transport of rust, however, it
describes distribution of rust which is
produced in concrete (pores and cracks) as a
consequence of the reaction of soluble species
(that can dissolve in the concrete pore solution
and subsequently migrate or diffuse through
pores and cracks of concrete) with oxygen in
pore water. For more detail see 14.
3 NUMERICAL IMPLEMENTATION
By using the finite element method to solve
the partial differential equations of the
mathematical model, the strong form has to be
rewritten into a weak form. The weak form of
the system of partial differential equations is
J. Ožbolt, A. Brajković and H. Lin
4
carried out by employing the Galerkin
weighted residual method. This is then
implemented into a non-commercial 3D finite
element code MASA, developed at the
University of Stuttgart (Institute of
Construction Materials). The non-mechanical
part of the problem is solved by using a direct
integration method of implicit type. To solve
the mechanical part, Newton-Raphson iterative
scheme is used. As the constitutive law for
concrete the microplane model based on the
relaxed kinematic constraint is used 15. To
avoid mesh size dependency, as a
regularization method the crack band approach
is employed 16. In the finite element
analysis, the band corresponds to a row of
finite elements. As already mentioned, the
coupling between the mechanical and non-
mechanical parts of the model is performed by
continuous updating of the governing
parameters during the incremental transient
finite element analysis using a staggered
solution scheme. For more detail see 5-7.
One-dimensional corrosion contact
elements are employed to account for the
inelastic strains due to the expansion of
corrosion products. They are placed radially
around the reinforcement bar surface and their
main function is to simulate the contact
between reinforcement and the surrounding
concrete. These contact elements can take up
only shear forces, in the direction parallel to
the reinforcement axis, and compressive forces
perpendicular to the adjacent surface of the
reinforcement. The inelastic radial expansion
due to corrosion, Δlr, is calculated as:
1rr
r r s
m rl
A
(10)
where ρr and ρs are densities of rust and steel,
respectively, r is the ratio between the mass of
steel (ms) and the corresponding mass of rust
(mr) over the related surface of the
reinforcement Ar that corresponds to the
contact element. Note that the ratio between
densities of steel and rust depends on the type
of the corrosion products and can vary from 2
to 7 414.
4 NUMERICAL STUDY
The above presented 3D CHTM model is
here employed to study the difference between
accelerated and natural corrosion of steel
reinforcement of a beam-end specimen. As a
reference, the experimental results performed
by Lin et al. 17 under accelerated corrosion
are used.
4.1 Geometry, material properties and
loading
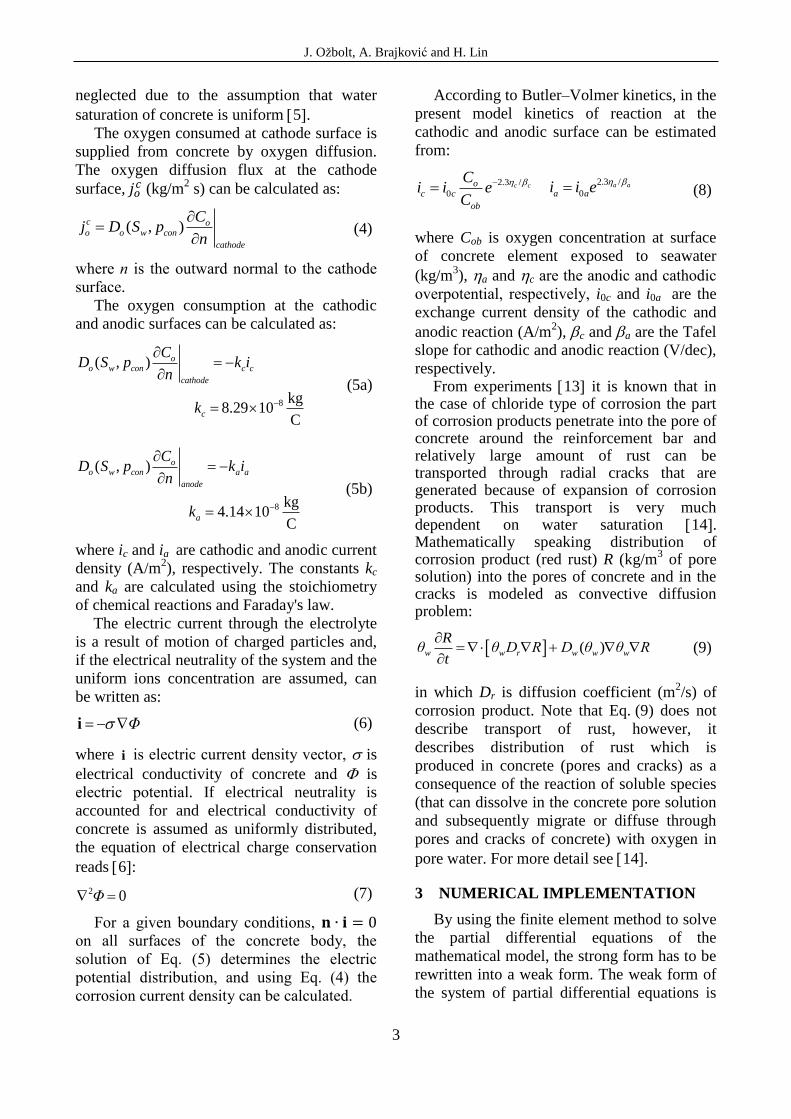
The typical geometry of the tested
specimen is shown in Fig. 1 17. To study the
difference between natural and accelerated
chloride induced corrosion, numerical
simulation is performed for both cases. The
specimen cross-section is 150 x 250 mm, the
diameter of the main reinforcement bar is
d = 20 mm and concrete cover c = 25 mm. The
total embedment length of the reinforcement is
200 mm, whereas the rest of the length is
isolated with a plastic sleeve (Fig. 1). Along
the embedment length there are two stirrups
with d = 8 mm and spacing s = 100 mm (test
specimen LA2S, 17).
150
250
5020
050
d=20mm
dst =8mm
PVC
d = 20
P
25P
5050
50
300150
25 A-A B-B
B
BA
A
Stirrup
Figure 1: Geometry of the test specimens (LA4S 17).
Table 1: Mechanical properties
Parameter Value
Modulus of el. of concrete, Ec (GPa) 30.0
Poisson's ratio of concrete,c 0.18
Tensile strength of concrete, ft (MPa) 3.85
Uniaxial comp. str. of concrete, fc (MPa) 45.7
Fracture energy of concrete, GF (J/m2) 150.0
Modulus of elasticity of steel, Es (GPa) 210.0
Poisson's ratio of steel,s 0.33
J. Ožbolt, A. Brajković and H. Lin
5
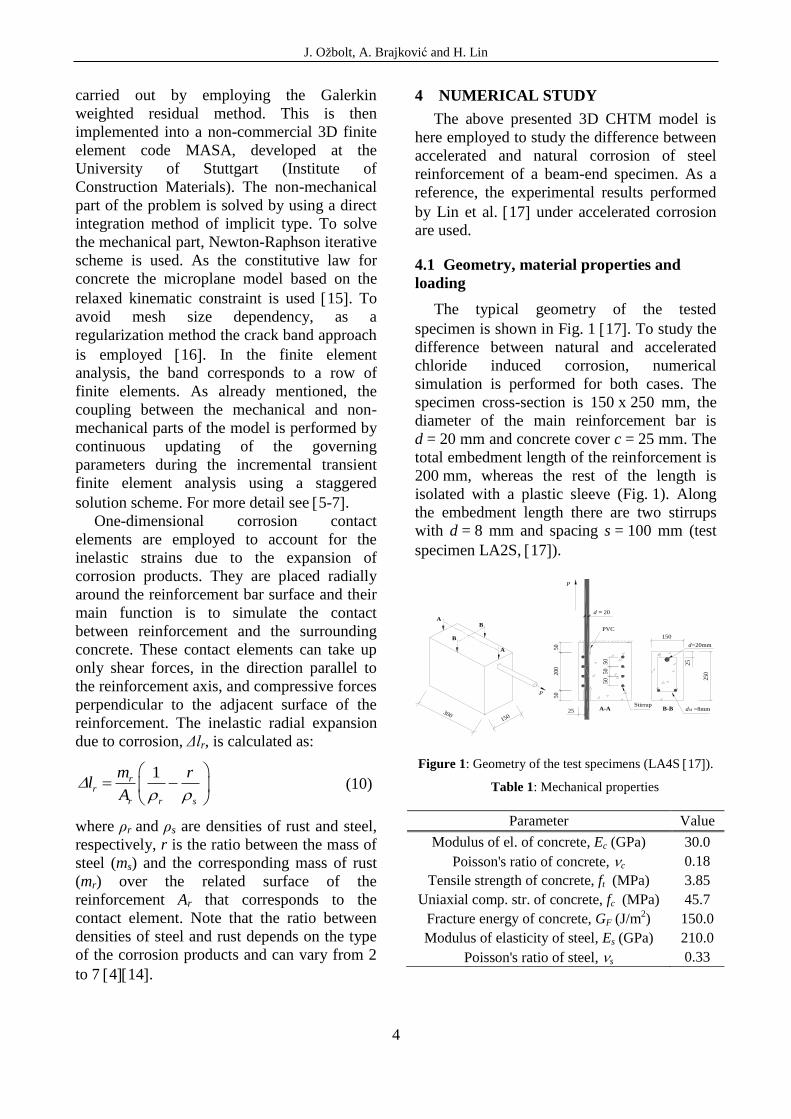
The finite element discretization of the
specimen is shown on Fig. 2. Concrete is
discretized with four node 3D solid finite
elements and reinforcement with eight node
3D solid elements. The mechanical boundary
conditions for the pull-out test are the same as
in the experimental tests (see Fig. 1). The
mechanical properties of concrete and steel are
summarized in Tab. 1.
Figure 2: 3D finite element discretization.
Figure 3: Bond-slip relationship for not corroded
reinforcement.
To simulate the expansion due to the
formation of corrosion products, one-
dimensional (1D) radially oriented corrosion
contact truss finite elements over the surface
of reinforcement are used with a length of 0.10
mm. They can take up radial forces (only
compressive, no tensile) and shear forces in
direction of the reinforcement axis. The radial
compressive resistance is assumed to be linear
elastic and the shear resistance is controlled by
the bond-slip relationship. The bond-slip
constitutive law of contact elements (not
corroded) is shown in Fig. 3, where max is the
total bond strength and f is the frictional
strength. The bond strength and the shape of
the curve is similar as observed in the
experiments 17. Note that in the numerical
simulation the bond-slip relationship was
assumed as independent of the corrosion level.
As will be shown later, this assumption is
realistic since, because of small concrete
cover, the failure of corroded reinforcement
was due to the splitting of concrete cover and
not to the pull-out.
Table 1. The dependence of the oxygen diffusivity
and electrical conductivity on water saturation for good
quality concrete (water-cement ratio, w/c = 0.4).
Saturation (%) 50 60 70 80 90
Oxygen diff.
Do (10-8
m2/s)
1.55 1.20 0.75 0.30 0.13
Electrical con.
σ (10-3
Ω-1
m-1
) 0.20 0.53 1.0 6.0 11.2
Table 2. Parameters used in the numerical
simulations.
Parameter Value
Faraday′s constant, F (C/mol) 96486.7
Anodic exchange current den., i0a (A/m2) 1.875×10
-4
Cathodic exchange current den., i0c (A/m2) 6.25×10
-6
Anodic equilibrium pot., Φ0a (V vs. SCE) -0.780
Cath. equilibrium pot., Φ0c (V vs. SCE) 0.160
Tafel slope for anodic reaction, βa (V/dec) 0.06
Tafel slope for cath. reaction, βc (V/dec) 0.160
Numerical simulation for natural corrosion
is performed only for the active corrosion
phase, i.e. after depassivation of
reinforcement. It is assumed that the saturation
is constant over the entire volume of the
specimen (S = 50%). The initial concentration
of oxygen in concrete is taken the same as the
concentration on the exposed concrete surfaces
and is equal to 0.0085 kg of dissolved
oxygen / m3 of pore solution. Oxygen
diffusivity and electrical conductivity of
concrete are chosen for a good quality
concrete with water-cement ratio, w/c = 0.4
(Table 1). The parameters relevant for the
calculation of electric potential and
consumption of oxygen are summarized in
Tables 1 and 2. They approximately
correspond to parameters for severe splash
J. Ožbolt, A. Brajković and H. Lin
6
zone environmental conditions 12. In
addition, for the transport of corrosion
products through cracks, the rust diffusivity is
set to Dr = 2.2×10⁻¹⁶
m2/s.
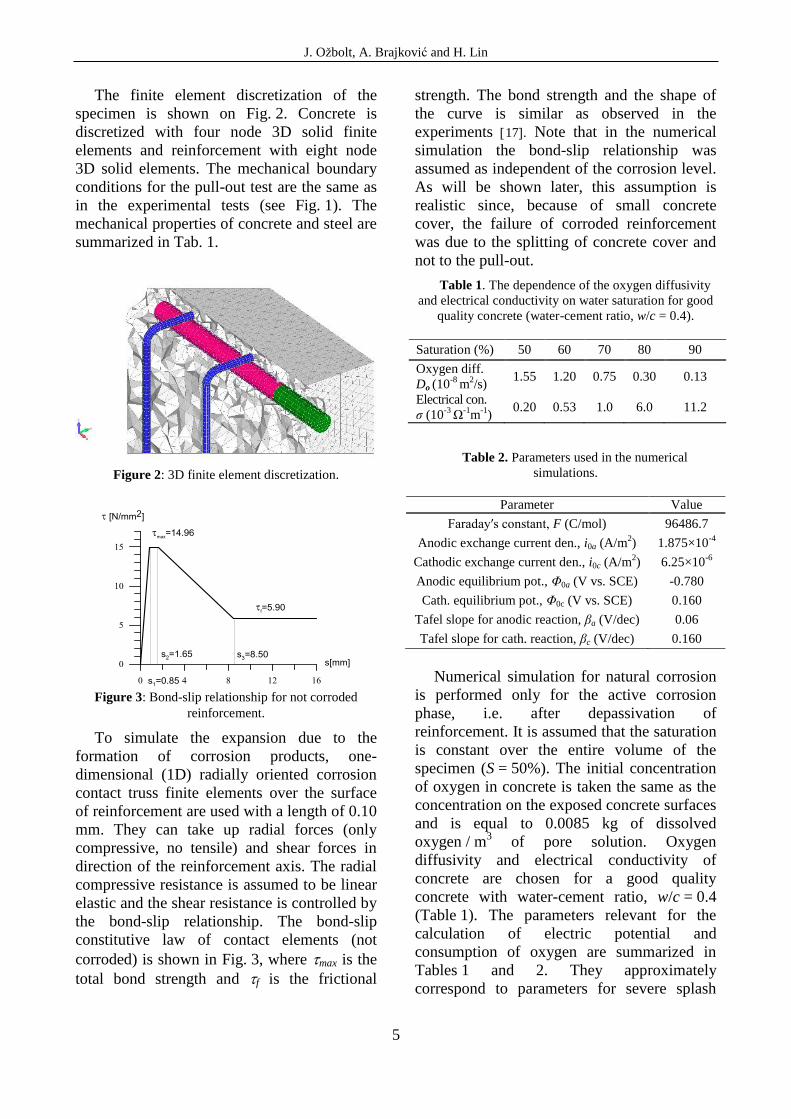
Sponge
Stainless steel net
Cathode
Connecting
steel bars
+ -
Connecting
steel net
D.C.Power Source
Anode
Figure 4: Accelerated corrosion test set-up 17.
In experimental tests accelerated corrosion
technique was used to accelerate steel bar
corrosion in concrete. Power supplies with
adjustable voltage and current were used to
impress constant current on the specimens (see
Fig. 4). The steel bars served as the anode and
the outside stainless steel net was fixed on the
surface to serve as cathodes. Sponge was
placed between the stainless steel net and the
concrete surface to provide an adequate
contact and it was every day sprayed with a
5% chloride solution, therefore, saturation was
not constant. Initially it was set to 50% with
the surface saturation of 85%.
Figure 5: Natural corrosion: position of anodic (green)
and cathodic (red) areas on the surface of reinforcement.
Accelerated corrosion was carried out under
relatively constant current density of 400~600
μA/cm2. Time necessary for obtaining the
target corrosion was evaluated based on the
Faraday’s law. Note that the current density
was very high, approximately 500 times larger
than observed for natural corrosion under
extreme conditions.
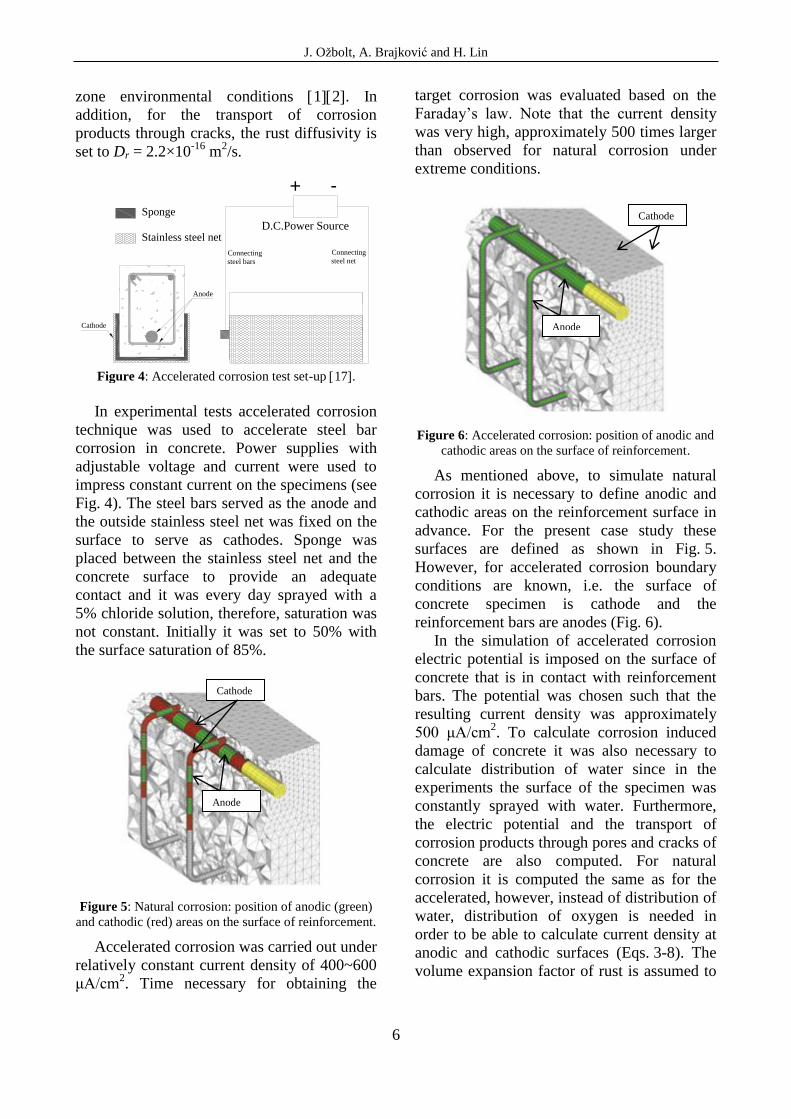
Figure 6: Accelerated corrosion: position of anodic and
cathodic areas on the surface of reinforcement.
As mentioned above, to simulate natural
corrosion it is necessary to define anodic and
cathodic areas on the reinforcement surface in
advance. For the present case study these
surfaces are defined as shown in Fig. 5.
However, for accelerated corrosion boundary
conditions are known, i.e. the surface of
concrete specimen is cathode and the
reinforcement bars are anodes (Fig. 6).
In the simulation of accelerated corrosion
electric potential is imposed on the surface of
concrete that is in contact with reinforcement
bars. The potential was chosen such that the
resulting current density was approximately
500 μA/cm2. To calculate corrosion induced
damage of concrete it was also necessary to
calculate distribution of water since in the
experiments the surface of the specimen was
constantly sprayed with water. Furthermore,
the electric potential and the transport of
corrosion products through pores and cracks of
concrete are also computed. For natural
corrosion it is computed the same as for the
accelerated, however, instead of distribution of
water, distribution of oxygen is needed in
order to be able to calculate current density at
anodic and cathodic surfaces (Eqs. 3-8). The
volume expansion factor of rust is assumed to
Anode
Cathode
de
Cathode
Anode
J. Ožbolt, A. Brajković and H. Lin
7
be r = s/r = 4.0 and 1.90 for natural and
accelerated corrosion, respectively.
4.2 Results: accelerated corrosion
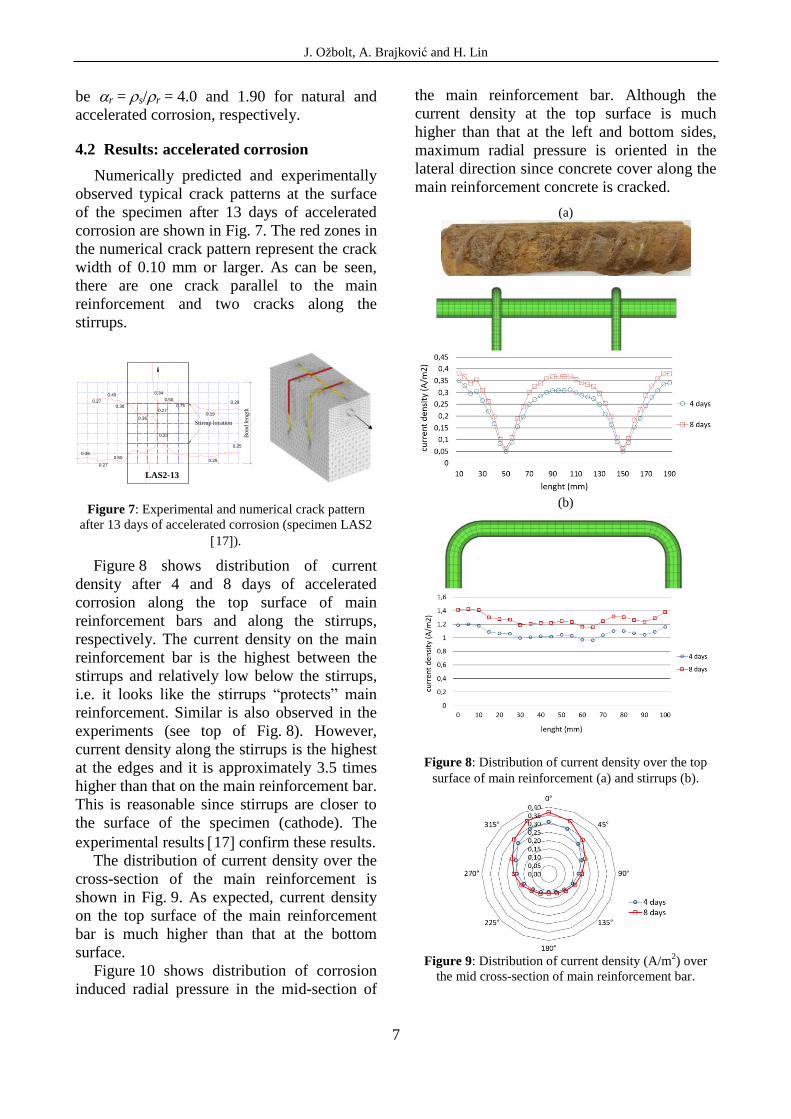
Numerically predicted and experimentally
observed typical crack patterns at the surface
of the specimen after 13 days of accelerated
corrosion are shown in Fig. 7. The red zones in
the numerical crack pattern represent the crack
width of 0.10 mm or larger. As can be seen,
there are one crack parallel to the main
reinforcement and two cracks along the
stirrups.
LAS2-13
0.34
0.27
0.50
0.75
0.36
0.23
0.50
0.27
0.36
0.25
0.25
0.19
0.290.38
0.40
0.27
Stirrup location
Bond l
ength
Figure 7: Experimental and numerical crack pattern
after 13 days of accelerated corrosion (specimen LAS2
17).
Figure 8 shows distribution of current
density after 4 and 8 days of accelerated
corrosion along the top surface of main
reinforcement bars and along the stirrups,
respectively. The current density on the main
reinforcement bar is the highest between the
stirrups and relatively low below the stirrups,
i.e. it looks like the stirrups “protects” main
reinforcement. Similar is also observed in the
experiments (see top of Fig. 8). However,
current density along the stirrups is the highest
at the edges and it is approximately 3.5 times
higher than that on the main reinforcement bar.
This is reasonable since stirrups are closer to
the surface of the specimen (cathode). The
experimental results 17 confirm these results.
The distribution of current density over the
cross-section of the main reinforcement is
shown in Fig. 9. As expected, current density
on the top surface of the main reinforcement
bar is much higher than that at the bottom
surface.
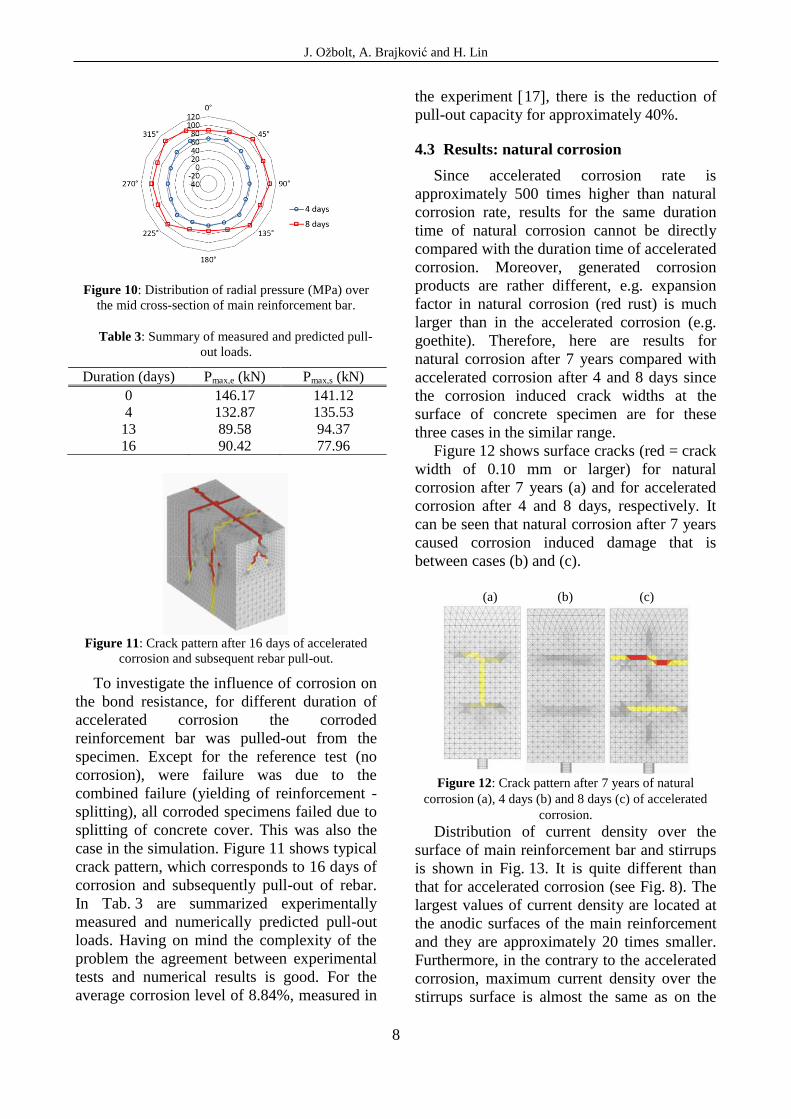
Figure 10 shows distribution of corrosion
induced radial pressure in the mid-section of
the main reinforcement bar. Although the
current density at the top surface is much
higher than that at the left and bottom sides,
maximum radial pressure is oriented in the
lateral direction since concrete cover along the
main reinforcement concrete is cracked.
(a)
(b)
Figure 8: Distribution of current density over the top
surface of main reinforcement (a) and stirrups (b).
Figure 9: Distribution of current density (A/m
2) over
the mid cross-section of main reinforcement bar.
J. Ožbolt, A. Brajković and H. Lin
8
Figure 10: Distribution of radial pressure (MPa) over
the mid cross-section of main reinforcement bar.
Table 3: Summary of measured and predicted pull-
out loads.
Duration (days) Pmax,e (kN) Pmax,s (kN)
0 146.17 141.12
4 132.87 135.53
13 89.58 94.37
16 90.42 77.96
Figure 11: Crack pattern after 16 days of accelerated
corrosion and subsequent rebar pull-out.
To investigate the influence of corrosion on
the bond resistance, for different duration of
accelerated corrosion the corroded
reinforcement bar was pulled-out from the
specimen. Except for the reference test (no
corrosion), were failure was due to the
combined failure (yielding of reinforcement -
splitting), all corroded specimens failed due to
splitting of concrete cover. This was also the
case in the simulation. Figure 11 shows typical
crack pattern, which corresponds to 16 days of
corrosion and subsequently pull-out of rebar.
In Tab. 3 are summarized experimentally
measured and numerically predicted pull-out
loads. Having on mind the complexity of the
problem the agreement between experimental
tests and numerical results is good. For the
average corrosion level of 8.84%, measured in
the experiment 17, there is the reduction of
pull-out capacity for approximately 40%.
4.3 Results: natural corrosion
Since accelerated corrosion rate is
approximately 500 times higher than natural
corrosion rate, results for the same duration
time of natural corrosion cannot be directly
compared with the duration time of accelerated
corrosion. Moreover, generated corrosion
products are rather different, e.g. expansion
factor in natural corrosion (red rust) is much
larger than in the accelerated corrosion (e.g.
goethite). Therefore, here are results for
natural corrosion after 7 years compared with
accelerated corrosion after 4 and 8 days since
the corrosion induced crack widths at the
surface of concrete specimen are for these
three cases in the similar range.
Figure 12 shows surface cracks (red = crack
width of 0.10 mm or larger) for natural
corrosion after 7 years (a) and for accelerated
corrosion after 4 and 8 days, respectively. It
can be seen that natural corrosion after 7 years
caused corrosion induced damage that is
between cases (b) and (c).
(a) (b) (c)
Figure 12: Crack pattern after 7 years of natural
corrosion (a), 4 days (b) and 8 days (c) of accelerated
corrosion. Distribution of current density over the
surface of main reinforcement bar and stirrups
is shown in Fig. 13. It is quite different than
that for accelerated corrosion (see Fig. 8). The
largest values of current density are located at
the anodic surfaces of the main reinforcement
and they are approximately 20 times smaller.
Furthermore, in the contrary to the accelerated
corrosion, maximum current density over the
stirrups surface is almost the same as on the

J. Ožbolt, A. Brajković and H. Lin
9
main rebar. Similar was observed for splices
under accelerated corrosion 18. There are
two main reasons for these differences: (i) In
natural corrosion there are micro-cells and
current is running between anodic and
cathodic surfaces. However, in the case of
accelerated corrosion current is running
between the concrete surface (cathode) and
reinforcement (anode) and a part of the main
reinforcement is in the “shadow” of stirrups.
Moreover, surfaces of reinforcement bars
oriented into direction of the top concrete
surface are directly exposed to the current
whereas the bottom surfaces are in “shadow”;
(ii) In the natural corrosion saturation was
assumed to be constant and in the accelerated
corrosion concrete surface was sprayed with
water. Therefore the stirrups were in the zone
of higher saturation than the main
reinforcement bar. Consequently, current
density on stirrups is larger.
(a)
(b)
Figure 13: Distribution of current density over the top
surface of main reinforcement (a) and stirrups (b).
Distribution of current density over the
anodic section of main rebar is shown in
Fig. 14. It can be seen that the highest current
density is located at the top surface of main
rebar that coincide with the vertical corrosion
induced crack of concrete cover. Due to the
crack the supply of oxygen is good and
consequently the corrosion rate high.
Figure 14: Distribution of current density (A/m
2) over
the anodic cross-section of main reinforcement bar.
Figure 15: Distribution of radial pressure (MPa) over
the anodic cross-section of main reinforcement bar.
Figure 15 shows distribution of radial
corrosion induced pressure over the anodic
surface of main reinforcement bar. The
pressure in direction of free surface is
relatively low due to the splitting crack. The
highest pressure is approximately 60 MPa that
is much smaller than that obtained for the
accelerated corrosion (approximately 100
MPa).
The pull-out capacity of corroded main
reinforcement after 7 years of corrosion was
reduced from 141.12 kN to 132.86 kN, which
is approximately in the range of the pull-out
resistance of accelerated corrosion between 4
and 8 days. The typical crack pattern after
pull-out of corroded main reinforcement bar is
shown in Fig. 16. Similar as for accelerated
corrosion, failure mode is due to splitting of
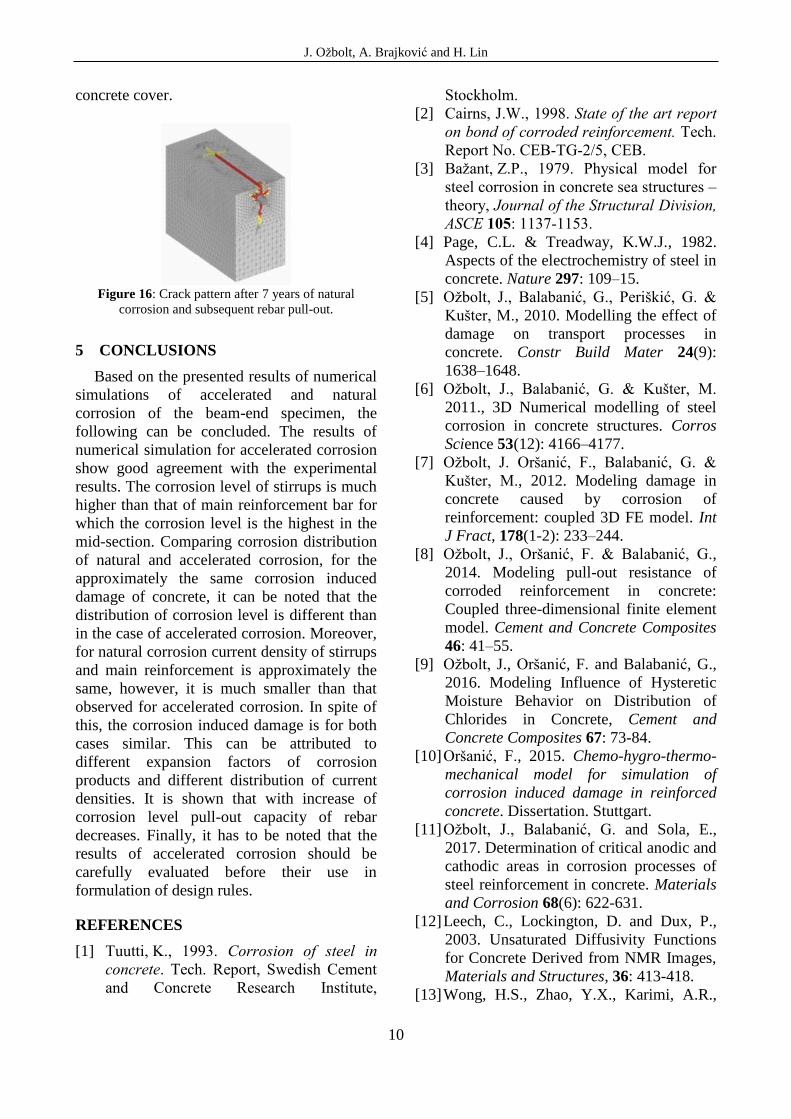
J. Ožbolt, A. Brajković and H. Lin
10
concrete cover.
Figure 16: Crack pattern after 7 years of natural
corrosion and subsequent rebar pull-out.
5 CONCLUSIONS
Based on the presented results of numerical
simulations of accelerated and natural
corrosion of the beam-end specimen, the
following can be concluded. The results of
numerical simulation for accelerated corrosion
show good agreement with the experimental
results. The corrosion level of stirrups is much
higher than that of main reinforcement bar for
which the corrosion level is the highest in the
mid-section. Comparing corrosion distribution
of natural and accelerated corrosion, for the
approximately the same corrosion induced
damage of concrete, it can be noted that the
distribution of corrosion level is different than
in the case of accelerated corrosion. Moreover,
for natural corrosion current density of stirrups
and main reinforcement is approximately the
same, however, it is much smaller than that
observed for accelerated corrosion. In spite of
this, the corrosion induced damage is for both
cases similar. This can be attributed to
different expansion factors of corrosion
products and different distribution of current
densities. It is shown that with increase of
corrosion level pull-out capacity of rebar
decreases. Finally, it has to be noted that the
results of accelerated corrosion should be
carefully evaluated before their use in
formulation of design rules.
REFERENCES
[1] Tuutti, K., 1993. Corrosion of steel in
concrete. Tech. Report, Swedish Cement
and Concrete Research Institute,
Stockholm.
[2] Cairns, J.W., 1998. State of the art report
on bond of corroded reinforcement. Tech.
Report No. CEB-TG-2/5, CEB.
[3] Bažant, Z.P., 1979. Physical model for
steel corrosion in concrete sea structures –
theory, Journal of the Structural Division,
ASCE 105: 1137-1153.
[4] Page, C.L. & Treadway, K.W.J., 1982.
Aspects of the electrochemistry of steel in
concrete. Nature 297: 109–15.
[5] Ožbolt, J., Balabanić, G., Periškić, G. &
Kušter, M., 2010. Modelling the effect of
damage on transport processes in
concrete. Constr Build Mater 24(9):
1638–1648.
[6] Ožbolt, J., Balabanić, G. & Kušter, M.
2011., 3D Numerical modelling of steel
corrosion in concrete structures. Corros
Science 53(12): 4166–4177.
[7] Ožbolt, J. Oršanić, F., Balabanić, G. &
Kušter, M., 2012. Modeling damage in
concrete caused by corrosion of
reinforcement: coupled 3D FE model. Int
J Fract, 178(1-2): 233–244.
[8] Ožbolt, J., Oršanić, F. & Balabanić, G.,
2014. Modeling pull-out resistance of
corroded reinforcement in concrete:
Coupled three-dimensional finite element
model. Cement and Concrete Composites
46: 41–55.
[9] Ožbolt, J., Oršanić, F. and Balabanić, G.,
2016. Modeling Influence of Hysteretic
Moisture Behavior on Distribution of
Chlorides in Concrete, Cement and
Concrete Composites 67: 73-84.
[10] Oršanić, F., 2015. Chemo-hygro-thermo-
mechanical model for simulation of
corrosion induced damage in reinforced
concrete. Dissertation. Stuttgart.
[11] Ožbolt, J., Balabanić, G. and Sola, E.,
2017. Determination of critical anodic and
cathodic areas in corrosion processes of
steel reinforcement in concrete. Materials
and Corrosion 68(6): 622-631.
[12] Leech, C., Lockington, D. and Dux, P.,
2003. Unsaturated Diffusivity Functions
for Concrete Derived from NMR Images,
Materials and Structures, 36: 413-418.
[13] Wong, H.S., Zhao, Y.X., Karimi, A.R.,
J. Ožbolt, A. Brajković and H. Lin
11
Buenfeld, N.R. and Jin, W-L, 2010. On
the penetration of corrosion products from
reinforcing steel into concrete due to
chloride-induced corrosion, Corrosion
Science, 52(7): 2469-2480.
[14] Sola, E., 2017. Experimental and
numerical study of chloride induced
corrosion in reinforced. Dissertation.
Stuttgart.
[15] Ožbolt, J., Li, Y. and Kožar, I., 2001.
Microplane model for concrete with
relaxed kinematic constraint. Int J Solids
Struct, 38(16): 2683–2711.
[16] Bažant, Z.P. and Oh, B.H., 1983. Crack
band theory for fracture of concrete.
Mater Struct, 16(93): 155–177.
[17] Lin, H., Zhao, Y., Yang, J-Q., Feng, P.,
Ozbolt, J. and Ye, H., 2019. Effects of the
corrosion of main bar and stirrups on the
bond behavior of reinforcing steel bar,
Constr Build Mater, in review.
[18] Abdelatif, A.O., Ožbolt, J. and Gambarel
li, S., 2018. 3D finite element modelling
of corrosion of lap splice joints in
concrete, Constr Build Mater 169: 124–
131.