Embed Size (px)
Citation preview
General rights Copyright and moral rights for the publications made accessible in the public portal are retained by the authors and/or other copyright owners and it is a condition of accessing publications that users recognise and abide by the legal requirements associated with these rights.
• Users may download and print one copy of any publication from the public portal for the purpose of private study or research. • You may not further distribute the material or use it for any profit-making activity or commercial gain • You may freely distribute the URL identifying the publication in the public portal
If you believe that this document breaches copyright please contact us providing details, and we will remove access to the work immediately and investigate your claim.
Downloaded from orbit.dtu.dk on: Sep 08, 2018
Modeling auditory evoked brainstem responses to transient stimuli
Rønne, Filip Munch; Dau, Torsten; Harte, James; Elberling, Claus
Published in:Acoustical Society of America. Journal
Link to article, DOI:10.1121/1.3699171
Publication date:2012
Document VersionEarly version, also known as pre-print
Link back to DTU Orbit
Citation (APA):Rønne, F. M., Dau, T., Harte, J., & Elberling, C. (2012). Modeling auditory evoked brainstem responses totransient stimuli. Acoustical Society of America. Journal, 131(5), 3903-3913. DOI: 10.1121/1.3699171
AIP/123-QED
Modeling auditory evoked brainstem responses to transient stimuli
Filip Munch Rønne and Torsten Dau
Centre for Applied Hearing Research,
Acoustic Technology,
Department of Electrical Engineering,
Technical University of Denmark,
DK-2800 Kgs. Lyngby,
Denmarka)
James Harte
Institute of Digital Healthcare,
WMG,
University of Warwick,
Coventry,
CV4 7AL,
UK
Claus Elberling
William Demant Holding A/S,
Kongebakken 9,
DK-2765 Smørum,
Denmark
(Dated: March 2, 2012)
1
Abstract
A quantitative model is presented that describes the formation of audi-
tory brainstem responses (ABR) to tone pulses, clicks and rising chirps
as a function of stimulation level. The model computes the convolution
of the instantaneous discharge rates using the “humanized” nonlinear
auditory-nerve (AN) model of Zilany and Bruce (2007) and an em-
pirically derived unitary response function which is assumed to reflect
contributions from different cell populations within the auditory brain-
stem, recorded at a given pair of electrodes on the scalp. It is shown
that the model accounts for the decrease of tone-pulse evoked wave-
V latency with frequency but underestimates the level dependency of
the tone-pulse as well as click-evoked latency values. Furthermore, the
model correctly predicts the nonlinear wave-V amplitude behavior in
response to the chirp stimulation both as a function of chirp sweeping
rate and level. Overall, the results support the hypothesis that the
pattern of ABR generation is strongly affected by the nonlinear and
dispersive processes in the cochlea.
PACS numbers: 43.64.Qh, 43.64.Ri, 43.64.Bt
2
I. INTRODUCTION
When sound is presented to the ear, it is possible to record auditory evoked potentials
(AEPs) on the surface of the human scalp. AEPs represent the summed electric potential
from many remotely located neurons firing in response to the stimulus applied. They are
typically grouped in terms of time of occurrence after stimulus onset and are thus denoted
as auditory brainstem responses (ABRs) with latencies between 1 and 7 ms, middle-latency
responses (MLRs) with latencies in the range of 15-50 ms, and auditory late responses
(ALRs) with latencies in the range of about 75-200 ms.
AEPs have been used to asses the neural encoding of sound both for clinical and research
purposes. Various types of stimuli have been considered, such as transients like clicks, chirps
and tone-bursts (e.g., Jewett and Williston, 1971; Dau et al., 2000), steady-state signals such
as amplitude modulated (AM) tones (e.g. John and Picton, 2000; Galambos et al., 1981;
Kuwada et al., 1986; Picton et al., 1987; Rees et al., 1986), but also more complex signals
like speech (e.g., Warrier et al., 2004; Agung et al., 2006; Swaminathan et al., 2008; Aiken
and Picton, 2008; Akhoun et al., 2008; Lalor and Foxe, 2010; Chandrasekaran and Kraus,
2010). Tone-burst evoked ABRs have been studied to objectively estimate frequency-specific
hearing sensitivity, for example in newborn and young children (e.g. Ribeiro and Carvallo,
2008) or to estimate effects of cochlear group delay as a function of frequency and level of
stimulation (e.g. Gorga et al., 1988; Harte et al., 2009; Neely et al., 1988; Murray et al., 1998).
Broadband rising chirps have recently been developed for ABR recordings to maximize
synchronous firing of nerve fibers across frequency, leading to an increase of ABR wave-V
amplitude and a higher signal-to-noise ratio compared to traditional click stimulation (e.g.
Dau et al., 2000; Elberling and Don, 2008; Fobel and Dau, 2004; Junius and Dau, 2005;
Shore and Nuttall, 1985). It is argued (Dau et al., 2000), that these broadband chirp stimuli
compensate for the frequency-dependent group delay seen in the basilar membrane (BM)
velocity/displacement travelling waves. In a recent study, Elberling et al. (2010) presented
a)Electronic address: [email protected]
3
five chirps with different frequency-delay functions and investigated the resulting wave-V
amplitude of their responses at stimulation levels of 20, 40 and 60 dB normal hearing level
(nHL). Their results demonstrated that the dispersion function, or sweeping rate, of the
chirp that evoked the largest wave-V amplitude was a function of stimulation level. With
increasing level, the “optimal” chirp that created the largest wave-V response was found to
become progressively shorter (Elberling et al., 2010), i.e. to have the fastest sweeping rate.
It is well known that the frequency dependency of wave-V latency is related to the
tonotopical coding of frequency on the BM in the cochlea. High-frequency stimulation excites
basal parts of the BM and thus produces a shorter delay than low-frequency stimulation that
mainly excites apical parts of the BM (Gorga et al., 1988; Greenwood, 1990; Harte et al.,
2009; Neely et al., 1988; Murray et al., 1998). The level dependency of wave-V latency is
not so well understood. Cochlear tuning is known to be level dependent, where an increase
of the stimulus level results in broader auditory filters and thus a broader excitation pattern
on the BM (Glasberg and Moore, 1990; Recio and Rhode, 2000). This means that regions
of the BM with characteristic frequencies further away from the stimulus frequency are also
excited. Elberling (1976) and Folsom (1984) reasoned that the broadening of excitation with
level might result in shorter latencies, as more basal regions of the BM are activated that
are associated with shorter implicit delays. Another inherent feature of the filter tuning
is the change in the envelope of the BM impulse response at a given location, as level is
increased. The timing of the individual peaks of the physiological impulse response are level
independent but the amplitude of the earlier peaks are more emphasized as the stimulus
level increases (e.g., Kiang (1965), Recio and Rhode (2000)). This change in the envelope, as
stimulus level is increased, results in an onset emphasis that could result in a decrease of the
wave-V latency. Adaptation in the inner-hair cell (IHC)-AN synapse similarly enhances the
onset of a signal while attenuating later parts (Westerman and Smith, 1988) in the stimulus.
Thus, adaptation in the IHC-AN synapse might also contribute to the level-dependence of
wave-V latency.
The wave V amplitude is both stimulus frequency and stimulus level dependent. The
4
general shape of the frequency dependence is considered to be mainly controlled by the
transfer functions of the outer and middle ear effectively acting as a band-pass filter (Pascal
et al., 1998; Puria, 2003), with maximal transduction at 1-2 kHz. The level dependence
of the wave-V amplitude results from the summation of the individual neural responses
after the non-linear processing through the BM at the individual characteristic frequencies
(CFs), where compressive behavior has been found for medium-level stimulation at the CF
while linear behavior has been found for low-level stimulation (e.g. Ruggero et al., 1997).
The chirp-evoked ABRs obtained in Elberling et al. (2010) demonstrated non-monotonic
level-dependent behavior, assumed to result from the broadening of neural excitation
with increasing level (Harte et al., 2010). At low levels, each frequency component of
the chirp might excite a narrow region on the BM and, given the timing associated with
each component, might add up in phase (e.g. Dau et al., 2000). At high stimulus levels,
each frequency component excites a broader region on the BM, due to upwards spread
of excitation (Rhode and Recio, 2000). Thus, a specific location on the BM is excited
by a broader range of frequency components. These different components contribute
with different timing which results in desynchronization and a reduction of ABR wave-V
amplitude (Elberling et al., 2010).
However, while it appears obvious that cochlear processing affects ABR amplitudes and
latencies, only very few studies have actually attempted to provide quantitative predictions
of ABR data. In the present study, a computational model is presented that simulates evoked
responses to tone pulses of various frequencies and levels, upward chirps with different sweep
rates and levels as well as click stimuli. The key stages in the model are (i) the nonlinear
processing in the cochlea, including key properties such as compressive basilar-membrane
filtering, inner hair-cell (IHC) transduction, and IHC-AN synapse adaptation, and (ii) the
(linear) transformation between the neural representation at the output of the AN and the
recorded potential at the scalp. This approach was inspired by Goldstein and Kiang (1958),
who described evoked responses as a linear convolution of an elementary unit waveform of
5
a given neuron, called the unitary response, with the instantaneous auditory nerve (AN)
discharge rate in response to a given stimulus. This approach was applied to simulate cat
compound action potentials (CAP) by deBoer (1975).
Based on the work of Goldstein and Kiang (1958), deBoer (1975) and Melcher and Kiang
(1996), Dau (2003) proposed a model for the generation of ABRs and frequency following
responses (FFR) to tones. In Dau (2003), the unitary response was estimated empirically
based on measured ABR data, via deconvolution of average click-evoked responses and the
simulated neural activity pattern at the output of an AN model. Dau (2003) demonstrated
that the auditory periphery strongly affects the simulated ABR patterns and could account
for some of the key features observed in the recordings of chirp- versus click-evoked re-
sponses. However, while that study provided a proof of concept, it did not consider a more
detailed analysis of the responses as a function of stimulation frequency and level. Further-
more, significant discrepancies between the predicted and measured wave-V latencies were
observed but not further evaluated. Here, the original modeling framework of Dau (2003)
was extended to include current advances in AN modeling, such as linear BM filters at high
stimulus levels, peak splitting (Kiang, 1990) and a shift of best frequency with level. The
AN model developed by Zilany and Bruce (2007) was used here which is based on current
knowledge derived from both behavioral and objective measures of cochlear processing. The
model was originally developed for cat but also adopted by the same authors for humans
including corresponding middle-ear filtering and BM filter tuning (Ibrahim and Bruce, 2010).
II. MODEL FOR ABR GENERATION
A. Convolution model of ABR generation
Melcher and Kiang (1996) described the generation of ABR in cats as a summation of
individual brainstem cell potentials, vi, in response to a given stimulus, s;
6
ABR(t, x1, x2, s) =∑
i
vi(t, x1, x2, s) (1)
where x1 and x2 are the locations of the electrodes on the scalp. The potential, vi, in response
to a given acoustic stimulus, can be determined by a convolution between the instantaneous
firing rate of the ith cell, ri(t, s), and a unitary response function, u(t, x1, x2). This latter
function is defined as the potential produced between the electrode positions on the scalp,
x1 and x2, each time the cell discharges;
vi(t, x1, x2, s) = ri(t, s) ⋆ ui(t, x1, x2) (2)
where ⋆ denotes the convolution operation. To obtain an ABR with this method, all cells
need to be considered individually, which would be computationally prohibitive. To avoid
this, Melcher and Kiang (1996) suggested the use of the cell population potential, V . Cells
can be grouped by the physio-anatomical type of the cell, p, where P is the number of
different cell types:
ABR(t, x1, x2, s) =P∑
p=1
Vp(t, x1, x2, s) (3)
It is reasonable to assume that all cells of the population described have the same unitary
response (UR), u(t, x1, x2), as they have the same morphological and electrical properties
(Melcher and Kiang, 1996). The combination of eqn. (2) and (3) yields a general expression
for ABR generation:
ABR(t, x1, x2, s) = u(t, x1, x2) ⋆P∑
p=1
Np∑i=1
rpi(t, s) (4)
where Np is the total number of cells of type, p. The three main peaks in the click-evoked
ABR are waves I, III and V. Dau (2003) made the assumption that the instantaneous firing
functions in the medial superior olive (MSO), anterior ventral cochlear nucleus (AVCN)
are the same as in the AN, following the suggestion by Melcher and Kiang (1996). Thus,
7
the instantaneous firing functions for the different cell populations are given by ri,MSO =
ri,AVCN = ri,AN = ri, simplifying Eqn. 4 to:
ABR = u(t, x1, x2) ⋆
N∑i=1
ri(t, s) (5)
The generation of an ABR is thus represented as the sum of the instantaneous firing from
all cells, convolved with a UR that is dependent on the electrode location on the scalp but
assumed to be independent of cell type, efferent influence and stimulus.
B. Model structure
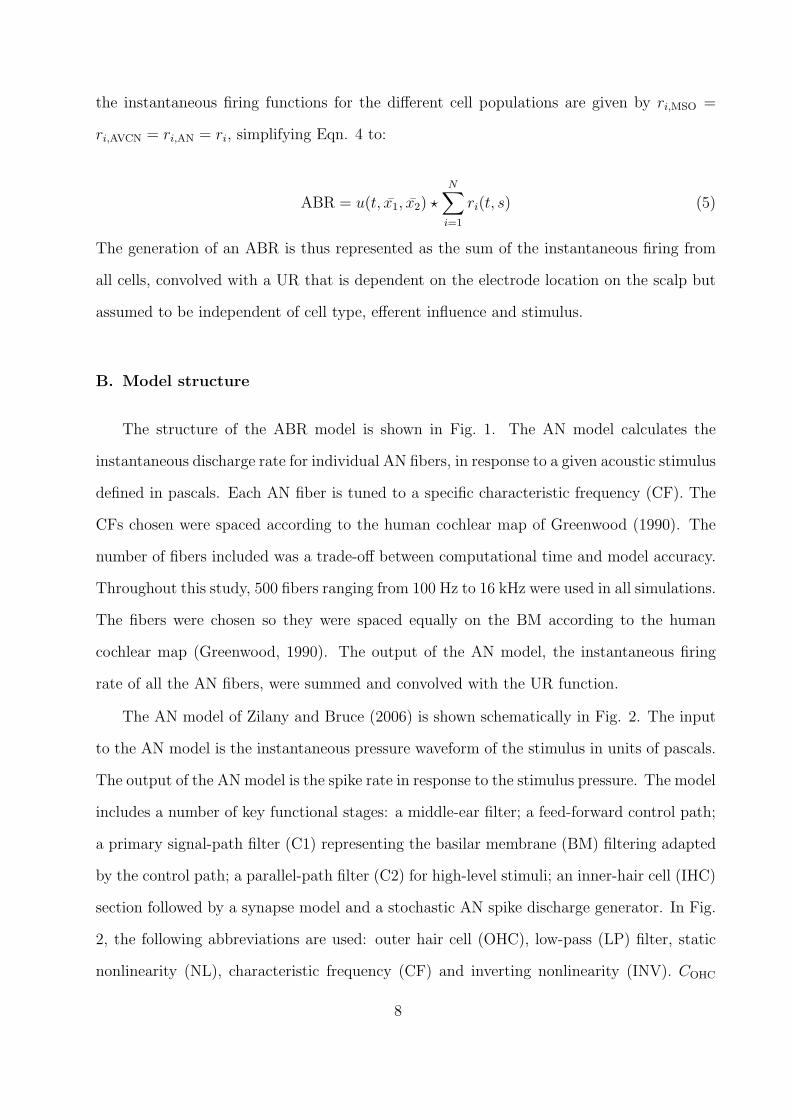
The structure of the ABR model is shown in Fig. 1. The AN model calculates the
instantaneous discharge rate for individual AN fibers, in response to a given acoustic stimulus
defined in pascals. Each AN fiber is tuned to a specific characteristic frequency (CF). The
CFs chosen were spaced according to the human cochlear map of Greenwood (1990). The
number of fibers included was a trade-off between computational time and model accuracy.
Throughout this study, 500 fibers ranging from 100 Hz to 16 kHz were used in all simulations.
The fibers were chosen so they were spaced equally on the BM according to the human
cochlear map (Greenwood, 1990). The output of the AN model, the instantaneous firing
rate of all the AN fibers, were summed and convolved with the UR function.
The AN model of Zilany and Bruce (2006) is shown schematically in Fig. 2. The input
to the AN model is the instantaneous pressure waveform of the stimulus in units of pascals.
The output of the AN model is the spike rate in response to the stimulus pressure. The model
includes a number of key functional stages: a middle-ear filter; a feed-forward control path;
a primary signal-path filter (C1) representing the basilar membrane (BM) filtering adapted
by the control path; a parallel-path filter (C2) for high-level stimuli; an inner-hair cell (IHC)
section followed by a synapse model and a stochastic AN spike discharge generator. In Fig.
2, the following abbreviations are used: outer hair cell (OHC), low-pass (LP) filter, static
nonlinearity (NL), characteristic frequency (CF) and inverting nonlinearity (INV). COHC
8
FIG. 1. Schematic structure of the ABR model. 500 AN fibers tuned to different CFs are
individually simulated by the AN model. The summed activity, integrated across frequency,
is then convolved with a unitary response and represents the simulated ABR to a given
stimulus.
and CIHC are scaling constants that indicate the OHC and IHC status, respectively. The
black and gray curves in the filter stages represent the tuning at low and high sound pressure
levels, respectively. The wideband C2 filter shape is fixed and is the same as the broadest
possible C1 filter. The black and gray functions in the stage following the C1 filter indicate
the nonlinearity in the IHC input/output functions in normal and impaired (scaled down
according to CIHC) hearing, respectively. Details about the model implementation can be
found in Zilany and Bruce (2006). In the present study, the spikes/s output from the synapse
model was used, rather than the stochastic output from the spike generator. The stochastic
spike generator requires averaging over many repetitions before it becomes repeatable and
thus usable to ABR modeling.
9
SpikeTimes
NL
OHC
LP
Middle-earFilter
Stimulus
f(τC1)
τC1
τcp
OHCStatus
COHC
IHC
LPNL
CIHC
Wideband
C2 Filter
CF
Chirping
C1 Filter
CF
Control
Path
Filter CF
INV
ΣSynapse
Model
Spike
Generator
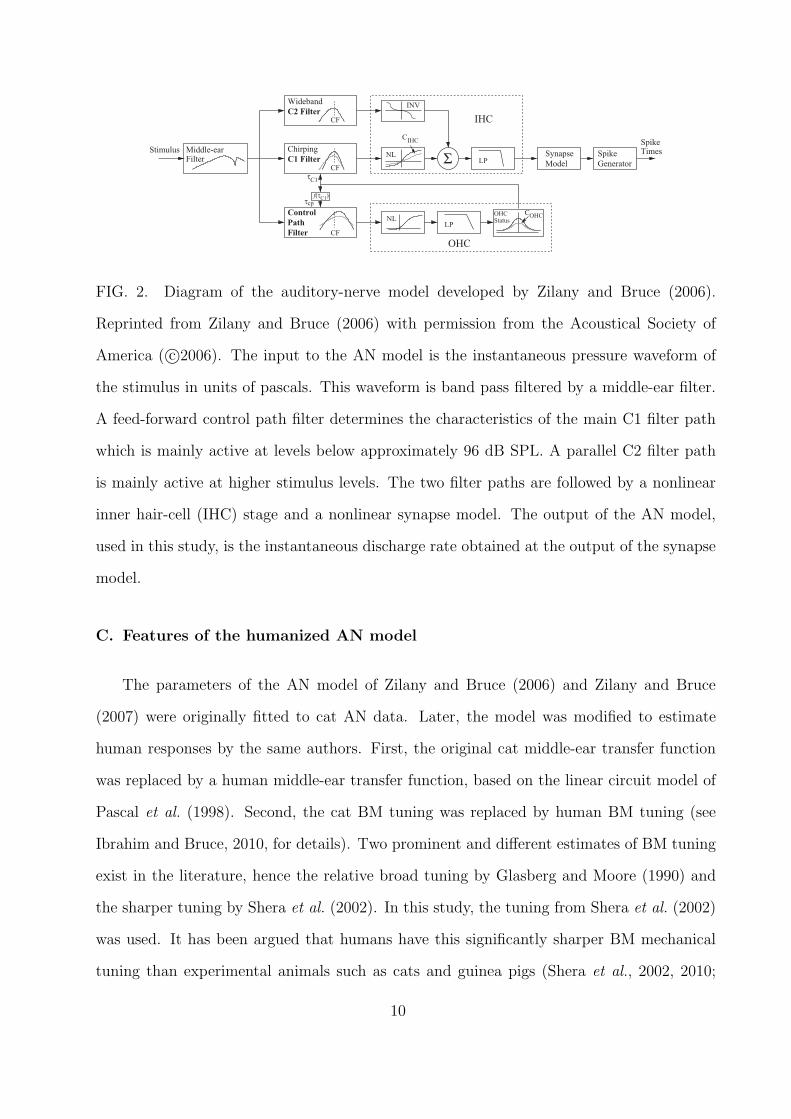
FIG. 2. Diagram of the auditory-nerve model developed by Zilany and Bruce (2006).
Reprinted from Zilany and Bruce (2006) with permission from the Acoustical Society of
America ( c©2006). The input to the AN model is the instantaneous pressure waveform of
the stimulus in units of pascals. This waveform is band pass filtered by a middle-ear filter.
A feed-forward control path filter determines the characteristics of the main C1 filter path
which is mainly active at levels below approximately 96 dB SPL. A parallel C2 filter path
is mainly active at higher stimulus levels. The two filter paths are followed by a nonlinear
inner hair-cell (IHC) stage and a nonlinear synapse model. The output of the AN model,
used in this study, is the instantaneous discharge rate obtained at the output of the synapse
model.
C. Features of the humanized AN model
The parameters of the AN model of Zilany and Bruce (2006) and Zilany and Bruce
(2007) were originally fitted to cat AN data. Later, the model was modified to estimate
human responses by the same authors. First, the original cat middle-ear transfer function
was replaced by a human middle-ear transfer function, based on the linear circuit model of
Pascal et al. (1998). Second, the cat BM tuning was replaced by human BM tuning (see
Ibrahim and Bruce, 2010, for details). Two prominent and different estimates of BM tuning
exist in the literature, hence the relative broad tuning by Glasberg and Moore (1990) and
the sharper tuning by Shera et al. (2002). In this study, the tuning from Shera et al. (2002)
was used. It has been argued that humans have this significantly sharper BM mechanical
tuning than experimental animals such as cats and guinea pigs (Shera et al., 2002, 2010;
10
Bentsen et al., 2011). The sharper human tuning is also probable in light of the recent
findings by Joris et al. (2011) who showed that macaque monkeys have sharper tuning than
rodents and cats. Further, the simulations using the ABR model produced the best results
with the Shera et al. (2002) tuning compared to the alternative broader tuning presented
by Glasberg and Moore (1990). To incorporate the sharper tuning, the model equivalent
rectangular bandwidth (ERB) quality factor, QERB, for cochlear tuning was modified to be:
QERB = 12.7
(CF
1000
)0.3
(6)
where CF is the center frequency of the BM filter. According to Shera et al. (2002), this
function is applicable to humans at frequencies at and above 1 kHz. To map the QERB to
the Q10 estimates used by the AN model the following mapping function was used (Ibrahim
and Bruce, 2010):
Q10 = 0.2085 + 0.505QERB (7)
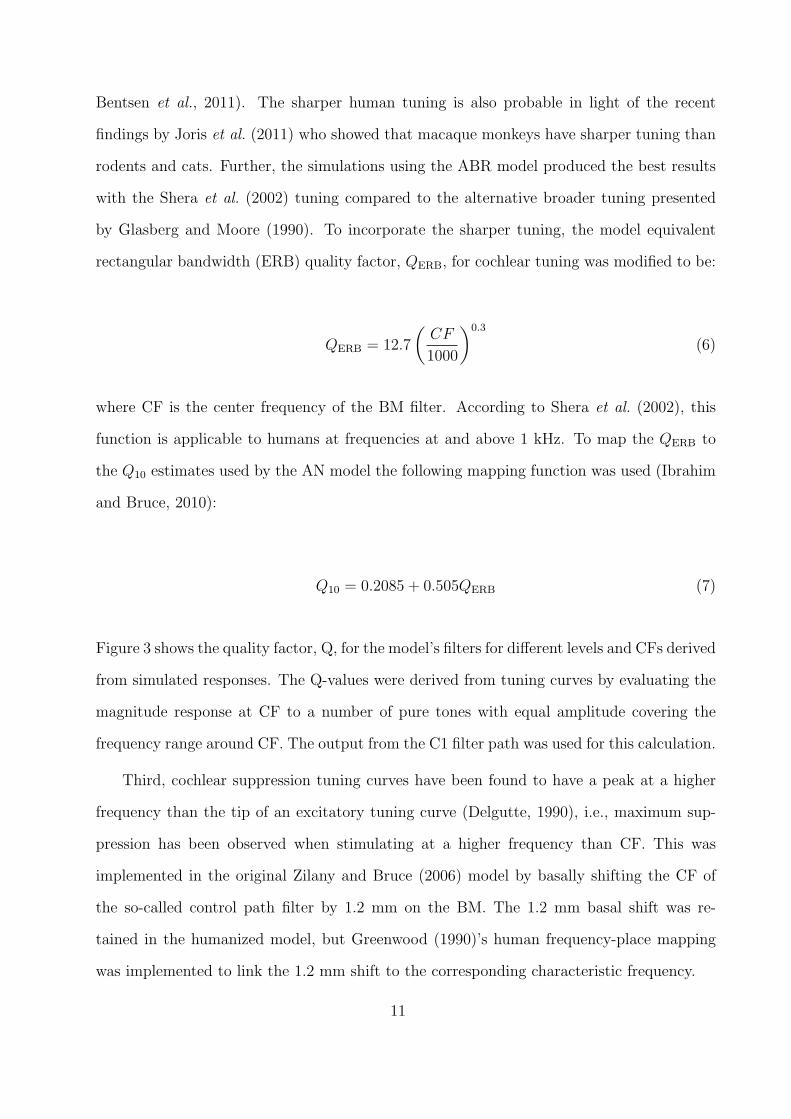
Figure 3 shows the quality factor, Q, for the model’s filters for different levels and CFs derived
from simulated responses. The Q-values were derived from tuning curves by evaluating the
magnitude response at CF to a number of pure tones with equal amplitude covering the
frequency range around CF. The output from the C1 filter path was used for this calculation.
Third, cochlear suppression tuning curves have been found to have a peak at a higher
frequency than the tip of an excitatory tuning curve (Delgutte, 1990), i.e., maximum sup-
pression has been observed when stimulating at a higher frequency than CF. This was
implemented in the original Zilany and Bruce (2006) model by basally shifting the CF of
the so-called control path filter by 1.2 mm on the BM. The 1.2 mm basal shift was re-
tained in the humanized model, but Greenwood (1990)’s human frequency-place mapping
was implemented to link the 1.2 mm shift to the corresponding characteristic frequency.
11
0.5 0.75 1 2 3 5 7.5 100
5
10
15
20
25
30
CF [kHz]
Ban
dwid
th [Q
ER
B]
40dB50dB60dB70dB80dB90dB
FIG. 3. Filter bandwidths, QERB, derived from the output of the C1 filter path (from Fig.
2). The dashed curve shows QERB estimates based on Shera et al. (2002)’s data obtained at
a stimulation level of 40 dB pe SPL.
III. METHOD
A. Estimation of the unitary response
The unitary response (UR) was obtained by deconvolving a “template” click-evoked
ABR with the summed neural activity pattern generated by the AN model in response to a
click stimulus. Given the assumed superposition, any stimulus should in theory be usable.
In this study, a click stimulus was chosen as it is most commonly used in clinics. The
deconvolution is an ill-posed mathematical problem and has an infinite number of solutions.
A stable and probable solution was, like in Dau (2003), found using Tikhonov regularization
(Tikhonov, 1963) as implemented in the MATLAB Regularization Tools of Hansen (1998).
The UR is subject dependent. In an attempt to employ a general UR, Elberling et al.
(2010)’s grand average ABR data (left panel of Fig. 4) was used for the deconvolution.
The resulting general UR was advantageous as the simulations presented in this study were
compared to reference data, typically averaged across many subjects.
The grand average ABR (Elberling et al., 2010) was made by aligning wave-V peaks
across recordings from 20 ears. The stimulus was a 100 µs standard click presented at
12
2 4 6 8 10−200
0
200
400
Time [ms]A
BR
am
plitu
de [n
v]
I
III
V
2 4 6 8 10−2
−1
0
1
2
3x 10
−8
Time [ms]
Am
plitu
de [m
odel
uni
ts]
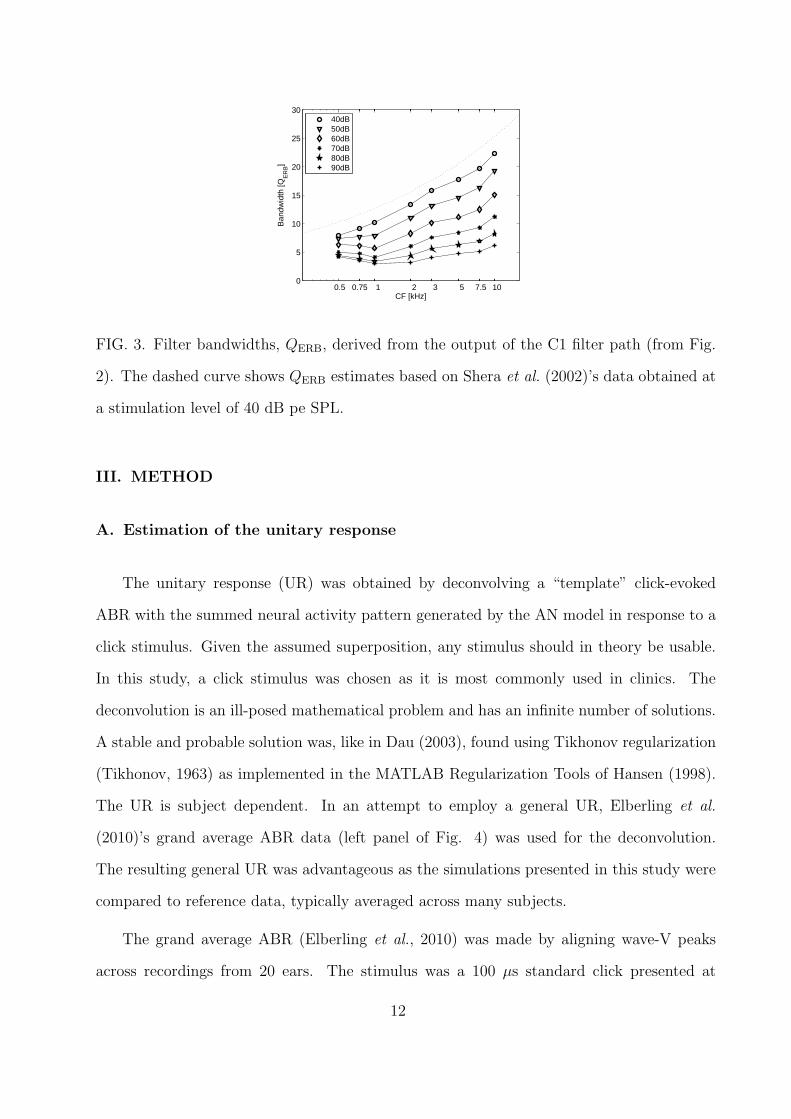
FIG. 4. Left panel: Grand average ABR evoked by 60 dBnHL click (Elberling et al., 2010).
Right panel: The derived unitary response function used throughout this study. This was
calculated as the deconvolution of the grand average ABR and the summed neural activity
pattern generated by the AN model in response to an identical click stimulus.
60 dBnHL (≈ 95.2 dB pe SPL, see section III.B.3 for conversion factor). The alignment
procedure created a standardized click-evoked ABR that had the disadvantage that the
wave-V amplitude was smaller than in an individually measured ABR, due to inter-subject
variability of the individual wave-forms. The UR was therefore scaled such that the simulated
click-evoked ABR at 40 dBnHL had the same amplitude as the mean ABR amplitudes
(rather than the amplitude of the grand averaged waveforms) from Elberling et al. (2010).
The right panel of Figure 4 shows the UR, obtained with the grand averaged ABR (from
the left panel) as the target. The UR function is similar to the one obtained in Dau (2003).
The ABR model using this UR is also capable of simulating the latency of wave-I. Given the
linearity of the UR function the wave-I to wave-V interval will remain constant. Simulated
wave-I amplitudes will however be smaller due to the way the UR was derived from the
grand average ABR. If the model were to simulate wave-I amplitudes, the UR should either
be scaled according to a representative wave-I amplitude, or be recalculated based on a
click-response where the wave-I is more faithfully represented. In the present model, linear
superposition was assumed above the level of the AN synapse; thus, the derived UR function
was applied to any input stimulus at any level.
13
B. Stimuli
1. Tone bursts
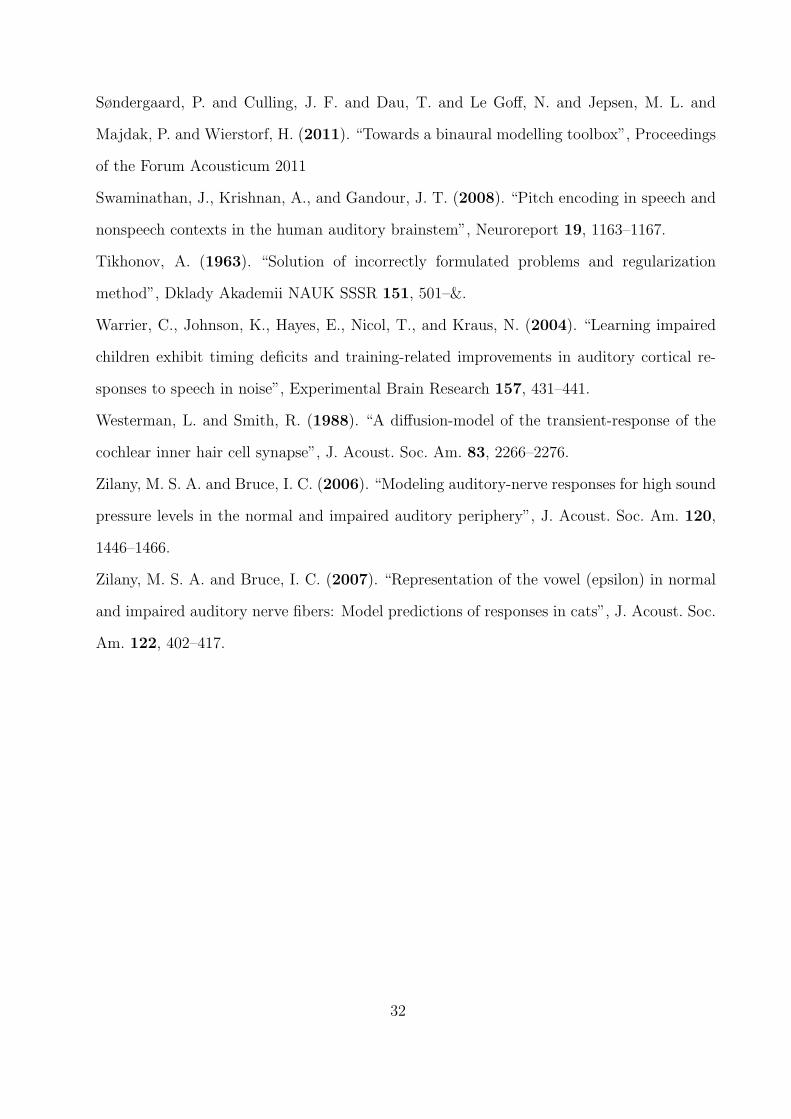
Hanning-windowed tone bursts as in Harte et al. (2009) were used as stimuli. The tone
bursts with center frequencies of 2 kHz and above included approximately 10 cycles and
therefore ranged from 5 to 1.25 ms (see Table I). The number of cycles during the rise time
period was reduced to 7.5 at 1.5 kHz and 5 at 1.0 kHz. These durations represent a trade-off
between having an equal number of cycles across frequencies and a relatively narrow spread
in their spectrum. Levels of 40 to 100 dB peSPL were used, in steps of 10 dB.
2. Broadband chirps and clicks
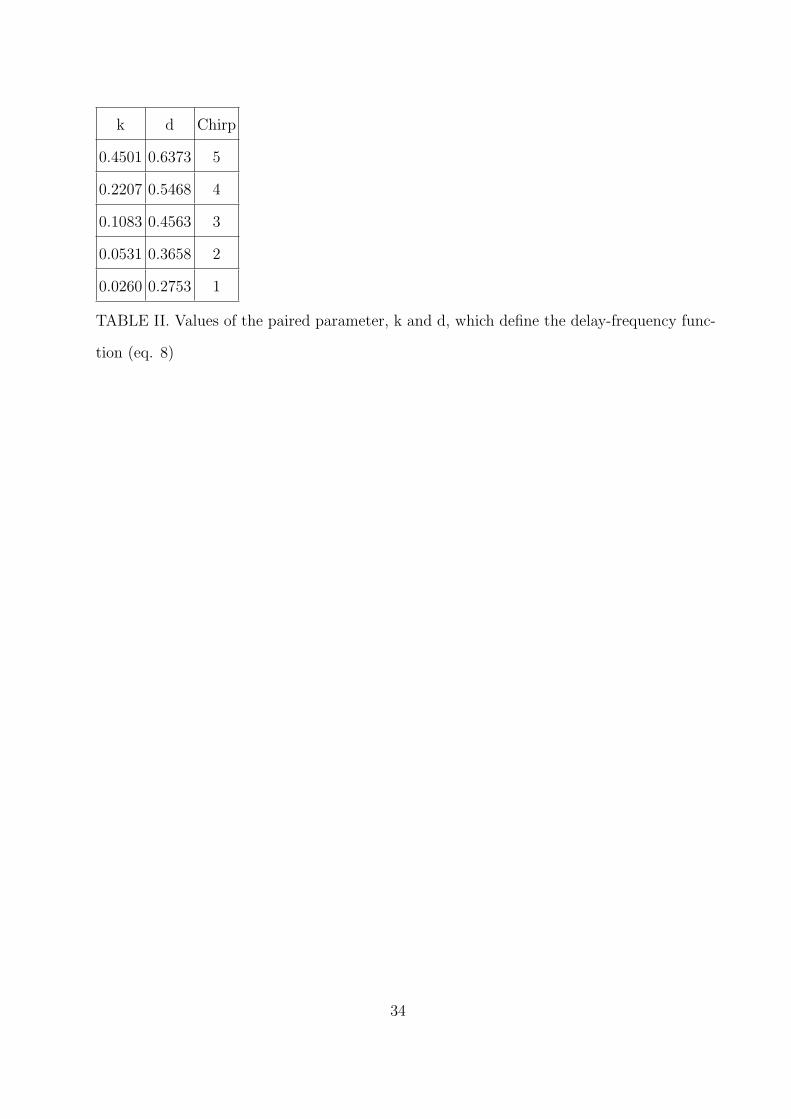
Five chirps with different delay functions were used as defined in Elberling et al. (2010).
The frequency-dependent delays of the chirps were defined as:
τ = k · CF−d (8)
where τ represents the latency associated with frequency CF, and k and d are paired con-
stants. Table II lists the parameters representing the individual chirps, following the choices
of Elberling et al. (2010). The delay difference between 710 and 5700 Hz for the chirps 1 to
5 were thus 1.86, 2.56, 3.32, 4.12 and 5.04 ms, respectively. For comparison, a “standard”
click stimulus of 100 µs duration was presented at 20, 40 and 60 dB nHL. The five chirps
were calibrated such that they had the same spectrum level as the click.
3. Calibration of the stimuli
As the experimental data were described in dB pe SPL or dB nHL, it was necessary to
acoustically calibrate the transient stimuli used in this study with an IEC 60711 coupler.
The tone bursts and the click were measured acoustically with an Etymotic ER2 earphone
connected to an IEC 60711 coupler (Bruel and Kjær 4157) through a Bruel and Kjær external
14
ear simulator DB 2012. For each stimulus in the tone burst simulation (6 tone bursts and 1
click), the amplitude was adjusted until the acoustically measured peak-to-trough amplitude
was similar to the peak-to-trough amplitude of a reference 1-kHz pure tone signal. A scaling
factor was found to calibrate the numerical model.
As in Elberling et al. (2010), the chirps were adjusted to have the same spectrum level
(rather than dB pe SPL) as the calibrated click. Elberling et al. (2010) provided the click
and chirp levels in dB nHL, and the stimuli needed to be converted to dB peSPL at the
eardrum before being presented to the model. The correct conversion factor was found to
be 35.2 dB1 (Richter and Fedtke, 2005), and hence the levels corresponding to 20, 40 and
60 dB nHL were found to be 55.2, 75.2 and 95.2 dB peSPL, respectively.
IV. RESULTS
A. Simulation of tone-burst evoked wave-V latencies
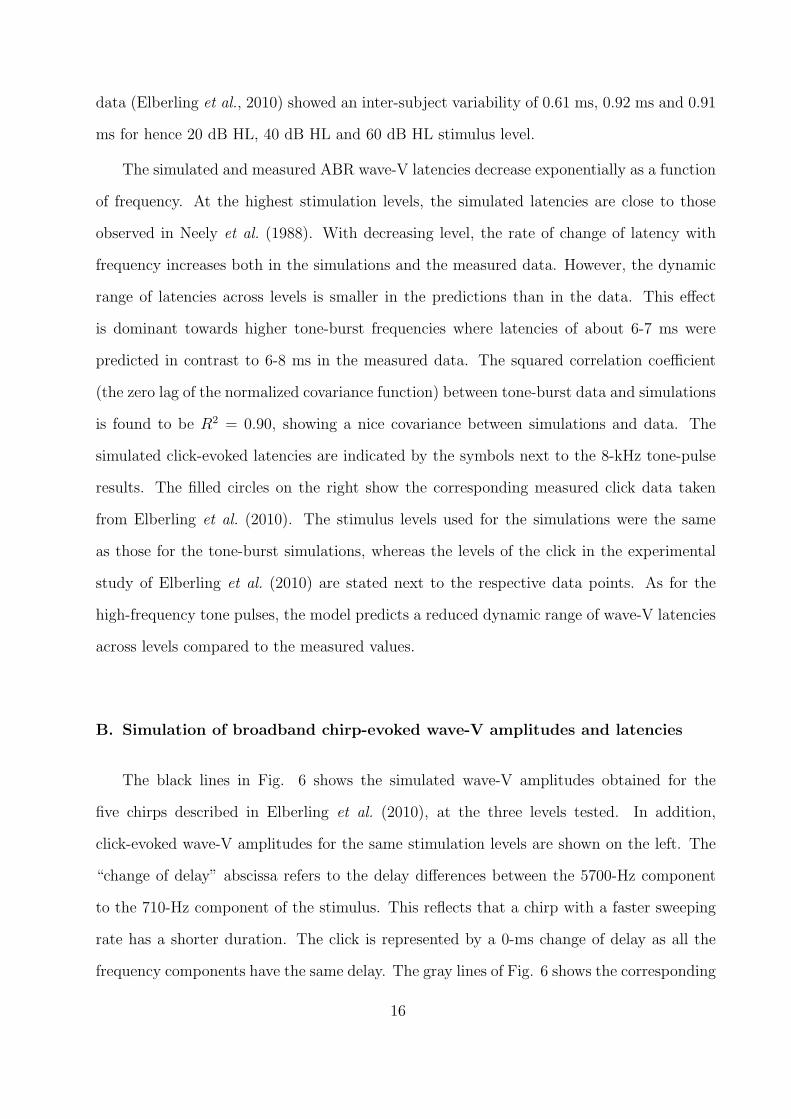
Figure 5 shows the simulated tone-burst evoked ABR wave-V latencies obtained with
the ABR model (symbols connected with solid lines). For direct comparison, functions fitted
to measured data from Neely et al. (1988) are indicated as dashed lines. Neely et al. (1988)’s
fitted lines were described by:
τb = a + bc−(i/100)(CF/1000)−g (9)
where i is the tone-burst intensity in SPL (divided by 100), CF is the tone burst center
frequency in Hertz, and a = 5 ms, b = 12.9 ms, c = 5.0 and g = 0.413 were fitted constants.
Additionally, measured data obtained in Harte et al. (2009) at a level of 66 dB peSPL are
shown as a dotted line. The differences between Neely et al. (1988) and Harte et al. (2009)’s
stimuli resulted in negligible differences in simulation results, therefore only Harte et al.
(2009)’s stimuli are simulated here. The inter-subject variability (the standard deviation)
on the Harte et al. (2009) data is 1.36 ms for 1 kHz, 0.93 ms for 2 kHz, and 0.71 ms for
8 kHz. Neely et al. (1988) does not explicitly state any inter-subject variability. The click
15
data (Elberling et al., 2010) showed an inter-subject variability of 0.61 ms, 0.92 ms and 0.91
ms for hence 20 dB HL, 40 dB HL and 60 dB HL stimulus level.
The simulated and measured ABR wave-V latencies decrease exponentially as a function
of frequency. At the highest stimulation levels, the simulated latencies are close to those
observed in Neely et al. (1988). With decreasing level, the rate of change of latency with
frequency increases both in the simulations and the measured data. However, the dynamic
range of latencies across levels is smaller in the predictions than in the data. This effect
is dominant towards higher tone-burst frequencies where latencies of about 6-7 ms were
predicted in contrast to 6-8 ms in the measured data. The squared correlation coefficient
(the zero lag of the normalized covariance function) between tone-burst data and simulations
is found to be R2 = 0.90, showing a nice covariance between simulations and data. The
simulated click-evoked latencies are indicated by the symbols next to the 8-kHz tone-pulse
results. The filled circles on the right show the corresponding measured click data taken
from Elberling et al. (2010). The stimulus levels used for the simulations were the same
as those for the tone-burst simulations, whereas the levels of the click in the experimental
study of Elberling et al. (2010) are stated next to the respective data points. As for the
high-frequency tone pulses, the model predicts a reduced dynamic range of wave-V latencies
across levels compared to the measured values.
B. Simulation of broadband chirp-evoked wave-V amplitudes and latencies
The black lines in Fig. 6 shows the simulated wave-V amplitudes obtained for the
five chirps described in Elberling et al. (2010), at the three levels tested. In addition,
click-evoked wave-V amplitudes for the same stimulation levels are shown on the left. The
“change of delay” abscissa refers to the delay differences between the 5700-Hz component
to the 710-Hz component of the stimulus. This reflects that a chirp with a faster sweeping
rate has a shorter duration. The click is represented by a 0-ms change of delay as all the
frequency components have the same delay. The gray lines of Fig. 6 shows the corresponding
16
1 1.5 2 3 6 8
6
7
8
9
10
11
12
Frequency of toneburst [kHz]
Late
ncy
of w
ave
V [m
s]
Click
95.2
75.2
55.2
40 dB50 dB60 dB70 dB80 dB90 dB100 dB
FIG. 5. Simulated (solid curves) and modeled (dashed curves based on eq. 9, dotted
curve, based on Harte et al., 2009) ABR wave-V latencies as a function of tone-burst center
frequency and level. Each line fitted to Neely et al. (1988)’s empirical data corresponds to
one simulated level. Open symbols to the right show simulated click-evoked ABR wave-V
latencies, filled symbols show Elberling et al. (2010) measured click latencies. All levels are
given in dB pe SPL.
measured data from Elberling et al. (2010). The squared correlation coefficient between data
and simulations is R2 = 0.90, demonstrating good covariance between simulations and data.
The measured data shows that, for the highest stimulation level of 60 dB nHL, the chirp with
a relatively short duration (chirp 2) i.e. a small delay difference between the low- and high-
frequency stimulus components, had the largest wave-V amplitude. Chirp 2 thus represents
the stimulus that is most effective at synchronizing the neural output across frequency.
In contrast, for the stimulation levels of 40 dB nHL and 20 dB nHL, the corresponding
maxima were found with chirp 3 and chirp 5, respectively, suggesting that other sweeping
rates provided maximal synchronization across frequency. These key features observed in
the measured data are also reflected in the simulations. The click-evoked responses show a
smaller amplitude than those obtained with all chirps both in the data and the predictions.
However, the maxima in the simulated functions are slightly shifted towards chirps with
17
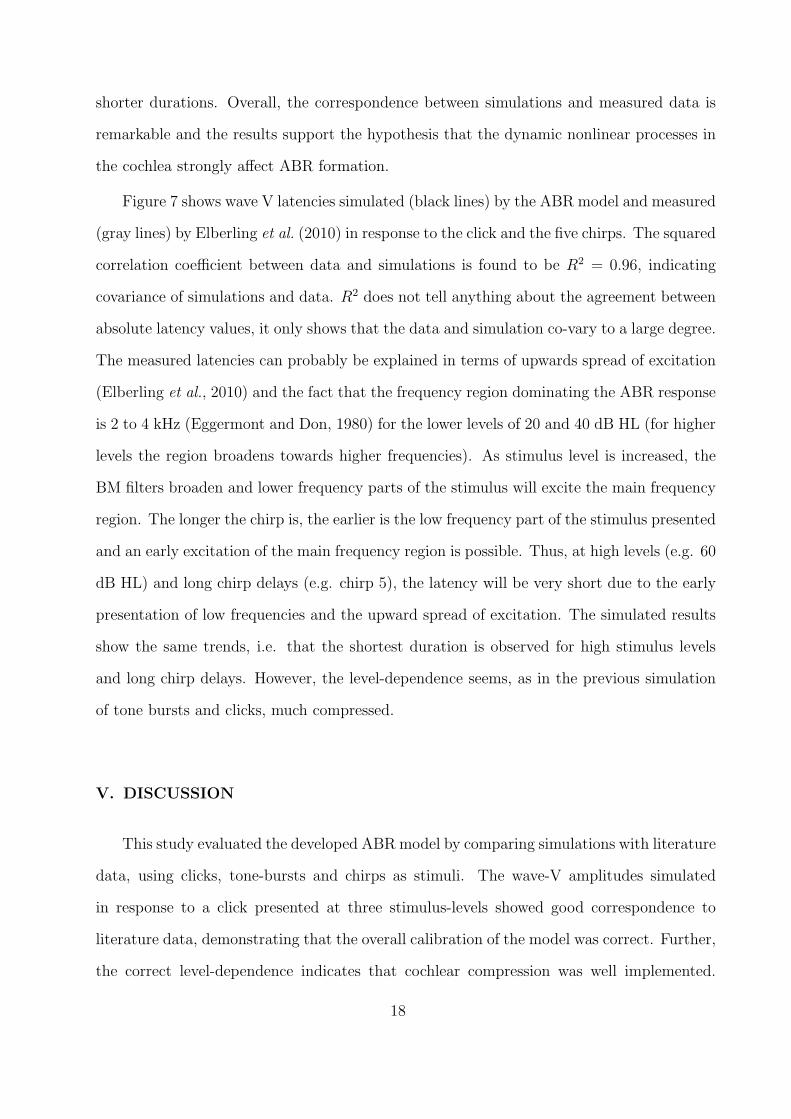
shorter durations. Overall, the correspondence between simulations and measured data is
remarkable and the results support the hypothesis that the dynamic nonlinear processes in
the cochlea strongly affect ABR formation.
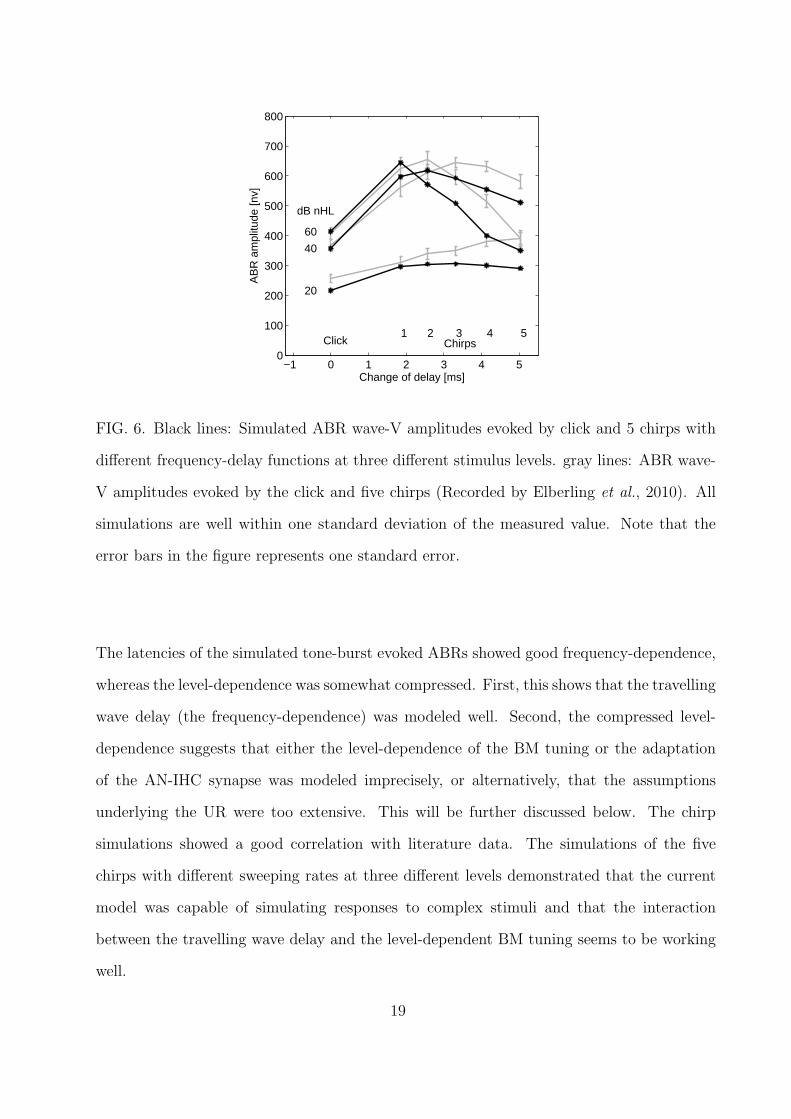
Figure 7 shows wave V latencies simulated (black lines) by the ABR model and measured
(gray lines) by Elberling et al. (2010) in response to the click and the five chirps. The squared
correlation coefficient between data and simulations is found to be R2 = 0.96, indicating
covariance of simulations and data. R2 does not tell anything about the agreement between
absolute latency values, it only shows that the data and simulation co-vary to a large degree.
The measured latencies can probably be explained in terms of upwards spread of excitation
(Elberling et al., 2010) and the fact that the frequency region dominating the ABR response
is 2 to 4 kHz (Eggermont and Don, 1980) for the lower levels of 20 and 40 dB HL (for higher
levels the region broadens towards higher frequencies). As stimulus level is increased, the
BM filters broaden and lower frequency parts of the stimulus will excite the main frequency
region. The longer the chirp is, the earlier is the low frequency part of the stimulus presented
and an early excitation of the main frequency region is possible. Thus, at high levels (e.g. 60
dB HL) and long chirp delays (e.g. chirp 5), the latency will be very short due to the early
presentation of low frequencies and the upward spread of excitation. The simulated results
show the same trends, i.e. that the shortest duration is observed for high stimulus levels
and long chirp delays. However, the level-dependence seems, as in the previous simulation
of tone bursts and clicks, much compressed.
V. DISCUSSION
This study evaluated the developed ABR model by comparing simulations with literature
data, using clicks, tone-bursts and chirps as stimuli. The wave-V amplitudes simulated
in response to a click presented at three stimulus-levels showed good correspondence to
literature data, demonstrating that the overall calibration of the model was correct. Further,
the correct level-dependence indicates that cochlear compression was well implemented.
18
−1 0 1 2 3 4 50
100
200
300
400
500
600
700
800
Change of delay [ms]
AB
R a
mpl
itude
[nv]
20
40
60
dB nHL
Click1 2 3 4 5
Chirps
FIG. 6. Black lines: Simulated ABR wave-V amplitudes evoked by click and 5 chirps with
different frequency-delay functions at three different stimulus levels. gray lines: ABR wave-
V amplitudes evoked by the click and five chirps (Recorded by Elberling et al., 2010). All
simulations are well within one standard deviation of the measured value. Note that the
error bars in the figure represents one standard error.
The latencies of the simulated tone-burst evoked ABRs showed good frequency-dependence,
whereas the level-dependence was somewhat compressed. First, this shows that the travelling
wave delay (the frequency-dependence) was modeled well. Second, the compressed level-
dependence suggests that either the level-dependence of the BM tuning or the adaptation
of the AN-IHC synapse was modeled imprecisely, or alternatively, that the assumptions
underlying the UR were too extensive. This will be further discussed below. The chirp
simulations showed a good correlation with literature data. The simulations of the five
chirps with different sweeping rates at three different levels demonstrated that the current
model was capable of simulating responses to complex stimuli and that the interaction
between the travelling wave delay and the level-dependent BM tuning seems to be working
well.
19
0 2 4 60
1
2
3
4
5
6
7
8
9
10
Change of delay [ms]
AB
R la
tenc
y [m
s]
60
40
20
dB nHL
2040
60
dB nHL
Click1 2 3 4 5
Chirps
FIG. 7. Black lines: Simulated ABR wave-V latencies evoked by click and 5 chirps with
different frequency-delay functions at three different stimulus levels. gray lines: ABR wave-
V latencies evoked by the click and five chirps (Recorded by Elberling et al., 2010). Note
that the error bars represents one standard deviation.
A. Limitations of the conceptual approach
The assumption that all nonlinearity is restricted to the BM and AN and that the re-
maining processing is linear is an obvious over-simplification given the high complexity of
neural processing within the brainstem. Specifically, the assumption that the rate functions
in the MSO and AVCN within the brainstem are the same as in the AN is most likely
erroneous (Dau, 2003). For example, it has been shown that neural synchronization in the
AVCN can be enhanced compared with AN fibers, due to the convergence of inputs from
two or more AN fibers on an AVCN cell and postsynaptic cells that require coincident input
spikes before firing (Joris et al., 1994). Furthermore, even though the human ABR may
be largely generated by brainstem cells in the spherical cell pathway (Melcher and Kiang,
1996), there is probably also some contribution from other cell types such as globular and
multipolar cells. There is still some controversy about the exact generating sites of the ABR
20
peaks beyond wave I. The whole modeling approach should therefore be considered as a
rough approximation of the real neural mechanisms involved in the generation of brainstem
potentials. Nevertheless, it appears that the chosen approach represents an effective ap-
proximation since major characteristics of the measured data can be accounted for. These
major characteristics include the wave-V amplitude, the frequency dependence of the wave-V
latency and, to a lesser degree, the level-dependence of the wave-V latency.
B. Effects of the unitary response function
In the present study, the UR was empirically obtained by deconvolving a grand average
click ABR with the discharge rate function at the output of the AN model. The UR was only
obtained once, for this 95.2 dB SPL click evoked grand averaged ABR, and all other stimulus
conditions made use of this UR. Only using one UR derived from a single waveform ensured
that the generality of the modeling framework could be tested. Simple linear convolution
of a UR might be an over-simplification for several reasons. First, the UR can be assumed
to be subject dependent. In the present study, all simulations were rerun using individually
estimated UR functions from three different subjects (not shown explicitly). However, this
only resulted in a change to the overall simulated response amplitudes, and introduced an in-
dividual latency offset. The differences were minimal and reflected inter-subject differences,
keeping the same broad dynamics as observed for the grand averaged UR. Second, Chertoff
(2004) investigated the level and frequency dependency of a UR used to model compound
action potentials (CAP) in Mongolian gerbils. He showed that the UR has both a slight
level and frequency dependence in this species (the first peak of the CAP-UR shifts up to
0.1 ms). However, no general formulation of the dependency was stated and no formulation
of a level-dependent UR for humans has yet been attempted in the literature. Further,
the interval between wave-I and wave-V peaks has been shown to be remarkably robust
across stimulus level in ABR recordings (Don and Eggermont, 1978; Eggermont and Don,
1980), indicating that a level-dependent UR is not required. Contradictory to this, however,
21
Chertoff et al. (2010) measured compound action potential (CAP) latency in humans, and
demonstrated that CAPs could have a smaller latency change with level than what has been
reported for ABR wave-V latency (Serpanos et al., 1997; Dau, 2003; Elberling et al., 2010).
This would tend to suggest that the wave-I (which is believed to have the same origin as the
CAP) to wave-V interval, and thus the UR, should be level-dependent. It is unclear from
the literature whether a level-dependent UR is in fact needed.
C. Wave-V latency dependency on frequency and level
Taking the variability on the measured data into account, the simulated tone-burst
evoked response latencies showed reasonable agreement with the measured data (Harte et al.,
2009; Neely et al., 1988) for the frequency range 1 - 8 kHz and for a level range of 40 - 100 dB
SPL. In particular, for a given stimulation level, the change of latency with frequency can be
accounted for quite well by the model. However, the latency change with level was smaller in
the simulations than in the data, particularly at high frequencies. Click-evoked ABRs were
also simulated to test the model’s performance when considering broadband excitation. The
simulated click-evoked latencies of the present study decreased by only 0.6 ms for a 40 dB
increase of stimulus level (from 55 to 95dB pe SPL), corresponding to -0.015 ms / dB, which
is in contrast to the decrease of a little less than 2 ms observed in the Elberling et al. (2010)
data, corresponding to -0.043 ms / dB. Other literature studies report latency decreases in
the order of -0.043 ms / dB (Serpanos et al., 1997) and -0.046 ms / dB (Dau, 2003) for
similar stimulus ranges. Even though the variability on the individual data set was high (a
standard deviation of 0.81 ms on average for Elberling et al., 2010), the discrepancy between
model and data is noticeable.
BM filter tuning and IHC-AN synapse adaptation determine the level dependency of
ABR wave-V latency in the model. The ABR model latency change of -0.015 ms / dB is
a small improvement over the earlier modeling study by Dau (2003) who obtained latency
changes of -0.005 ms / dB for a similar stimulus level range. Additional simulations, where
22
the BM tuning was altered (and reported in Rønne et al., 2011), demonstrated that the
improvement was the result of the use of the humanized version of Zilany and Bruce (2007)’s
AN model instead of the model by Heinz et al. (2001). The humanized AN model uses the
sharper tuning estimates from Shera et al. (2002) (see Ibrahim and Bruce, 2010) while
Heinz et al. (2001) used the estimates of Glasberg and Moore (1990). The filters of Shera
et al. (2002) (derived at only 40 dB SPL) are more sharply tuned than those described in
Glasberg and Moore (1990) since they were estimated based on behavioral forward-masking
data and otoacoustic emission data. In contrast, the estimates of Glasberg and Moore (1990)
are based on behavioral simultaneous masking, which is affected by peripheral suppression
(Shera et al., 2002; Bentsen et al., 2011). However, there is still a substantial discrepancy
between the simulated and the measured latency-level range. As shown in Fig. 3, the model
incorporates a level dependence in the C1 filter tuning factor. While the empirical evidence
for the frequency dependence of the tuning factor (Shera et al., 2002, 2010; Bentsen et al.,
2011) is well documented, there is little data existing for the level dependence in humans.
This quality factor level dependence will strongly affect wave-V latency and could be one
reason for the underestimation observed in the simulations. Additionally, neural adaptation
in the IHC-AN synapse enhances the onset and leads to shorter delays. For analysis purposes
(data not shown in this paper, see Rønne et al., 2011), click-evoked wave-V latencies were
simulated using an altered version of the ABR model where the IHC output of the AN model
was used, thus not including any adaptation process. However, while adaptation affected
the absolute value of the wave-V latency in the framework of the present model, it did not
have a major impact on the latency variation with level. A possible level-dependence of
the UR, though not implemented in the model, could also affect the ABR wave-V latency.
As discussed above, the literature is inconclusive on this matter. Further, Chertoff et al.
(2010)’s CAP latencies decrease by -0.030 ms / dB over the level range of 75 to 105 dB SPL.
So, even if a level-dependent UR was implemented to account for the difference in latency
change between Chertoff et al. (2010) and Elberling et al. (2010), the AN model would still
under predict the wave-V latency. It thus remains unclear why the model fails to account
23
more accurately for the level-dependent behavior of wave-V latency.
D. Across-frequency synchronization for broadband stimulation
When considering effects of level-dependent neural synchronization across frequency, the
simulations illustrate the crucial role of nonlinear cochlear processing for the formation of
brainstem responses to transient stimuli. The chirps presented in Elberling et al. (2010)
were considered here as “critical” stimuli to challenge and evaluate the model. The results
support the hypothesis that the dynamic behavior of ABR generation is mainly due to
peripheral mechanisms as all processing at higher neural stages beyond the level of the AN
was essentially considered as a linear filter. Further, the results reinforce the need to have
level dependent chirp stimuli to get maximum wave-V amplitude clinically (Elberling and
Don, 2010).
E. Perspectives
The model might be useful as a tool for studying consequences of different types of
cochlear hearing impairment on the evoked potential waveform, provided that pathology
can be adequately simulated in the model. Furthermore, brainstem responses to complex
stimuli (cABR), such as consonant-vowel utterances, have been considered as an objective
index of the neural transcription of features (e.g. temporal, spectral) that are important for
speech understanding in quiet and noise (e.g. Anderson et al., 2011). The model could be
used to analyze which spectro-temporal characteristics of the speech-evoked patterns can be
accounted for by cochlear processes. Finally, an important step would be to consider ”steady-
state” responses (SSR) obtained with temporally fluctuating stimuli such as complex tones or
amplitude modulated tones or noises. These responses are assumed to be generated by units
in the auditory brainstem and in the primary auditory cortex (e.g. Kuwada et al., 1986).
Therefore, the corresponding unitary response would have to be extended by a middle-
latency component. It is not clear, to what extent such a convolution approach can be
24
successfully applied to middle-latency responses (MLR), to transients as well as amplitude
modulation following responses. Regarding MLRs, at least, it has been shown that the
“classical” SSR to click trains presented at a 40 clicks/sec repetition rate can be modeled
reasonably well using a linear convolution approach (Bohorquez and Ozdamar, 2008; Junius
and Dau, 2005).
VI. SUMMARY AND CONCLUSION
A computational model for the generation of ABRs to transient stimuli was presented.
The model was based on the assumption that an ABR can be simulated as the convolution
between an instantaneous discharge rate function and a unitary response. The instantaneous
discharge rate function was obtained from a state-of-the-art nonlinear AN model (Zilany
and Bruce, 2006). The UR was derived “empirically” as the deconvolution between the
simulated instantaneous discharge rate AN function in response to a click stimulus and
measured average click-evoked ABR.
The model was evaluated by comparing the predicted responses to measured ABR data
from the literature. It was shown that a realistic simulation of the level-dependent signal
processing in the cochlea is essential for the interpretation of ABR to tone pulses, clicks
and chirps presented at various stimulation levels. In particular, the model could account
reasonably well for the nonlinear wave-V amplitude behavior as a function of chirp stimulus
level and sweeping rate which supports the strong role of cochlear nonlinearities, such as
compression and level-dependent tuning, for the formation of ABR. However, the model
clearly underestimated the level dependence of the response (wave-V) latency and it re-
mained unresolved in the framework of the modeling work presented here what mechanisms
are responsible for the relatively large latency changes with level observed in the data.
Overall, the developed model can provide insight into the complex nature of ABR gen-
eration. It can be used to investigate the representation of other types of stimuli (such as
speech in noise) or to study effects of (different types of cochlear) hearing impairment on the
25
predicted potential patterns. Furthermore, the modeling approach might provide a basis for
the investigation of longer-latency responses, such as steady-state responses to amplitude
modulated tones and noises.
The ABR model including, grand average ABR, UR, and key simulations, is included
in the Auditory Modeling (AM) toolbox (Søndergaard et al., 2011) and can be downloaded
from: http://amtoolbox.sourceforge.net/ (date last viewed 02/14/12).
Endnotes
1. The ISO 389-6:2007 standard specifies that the peak-to-peak reference equivalent
threshold sound pressure level (peRETSPL) is 43.5 dB peRETSPL, for an ER2 ear-
phone connected to an IEC 60711 coupler through the external ear simulator DB 0370.
Unfortunately, the tube diameter for the standard ear tip for the ER2 earphone (ER1-
14) is 1.37mm whereas it is 3mm for the DB 0370. This mismatch creates an acoustic
horn effect which affects the spectrum (Richter and Fedtke, 2005; Elberling et al.,
2012) and thus the level. Richter and Fedtke (2005) also measured the peak-to-peak
reference equivalent threshold sound pressure level (peRETSPL) for an ER2 earphone
connected to a head and torso simulator (HATS) and found it to be 35.2 dB. The
change of the external ear simulator from the DB 0370 (ISO 389-6:2007) to the HATS
(Table 7 Richter and Fedtke, 2005), results thus in a 8.3 dB change in the peRETSPL.
As the acoustic horn effect is not present in human fittings, the ISO 389-6:2007 does
not represent the pe SPL at the eardrum. For the modeling presented in the present
study, the HATS measurements from Richter and Fedtke (2005) were therefore used
as the reference.
References
Agung, K., Purdy, S. C., McMahon, C. M., and Newall, P. (2006). “The use of cortical
auditory evoked potentials to evaluate neural encoding of speech sounds in adults”, Journal
26
of the American Academy of Audiology 17, 559–572.
Aiken, S. J. and Picton, T. W. (2008). “Envelope and spectral frequency-following responses
to vowel sounds”, Hear. Res. 245, 35–47.
Akhoun, I., Gallego, S., Moulin, A., Menard, M., Veuillet, E., Berger-Vachon, C., Collet, L.,
and Thai-Van, H. (2008). “The temporal relationship between speech auditory brainstem
responses and the acoustic pattern of the phoneme vertical bar ba vertical bar in normal-
hearing adults”, Clinical Neurophysiology 119, 922–933.
Anderson, S. and Parbery-Clark, A.and Yi, Han-Gyoland Kraus, N. (2008). “A Neural
Basis of Speech-in-Noise Perception in Older Adults”, Ear and Hearing 32, 750-757.
Bentsen, T., Harte, J. M., and Dau, T. (2011). “Human cochlear tuning estimates from
stimulus-frequency otoacoustic emissions”, J. Acoust. Soc. Am. 129, 3797–3807.
Bohorquez, J. and Oezdamar, O. (2008). “Generation of the 40-Hz auditory steady-state
response (ASSR) explained using convolution”, Clinical Neurophysiology 119, 2598–2607.
Chandrasekaran, B. and Kraus, N. (2010). “The scalp-recorded brainstem response to
speech: Neural origins and plasticity”, Psychophysiology 47, 236–246.
Chertoff, M. (2004). “Analytic treatment of the compound action potential: Estimating
the summed post-stimulus time histogram and unit response”, J. Acoust. Soc. Am. 116,
3022–3030.
Chertoff, M. and Lichtenhan, J. and Willis, M. (2010). “Click- and chirp-evoked human
compound action potentials”, J. Acoust. Soc. Am. 127, 2992–2996.
Dau, T. (2003). “The importance of cochlear processing for the formation of auditory brain-
stem and frequency following responses”, J. Acoust. Soc. Am. 113, 936–950.
Dau, T., Wegner, O., Mellert, V., and Kollmeier, B. (2000). “Auditory brainstem responses
with optimized chirp signals compensating basilar membrane dispersion”, J. Acoust. Soc.
Am. 107, 1530–1540.
deBoer, E. (1975). “Synthetic whole-nerve action potentials for the cat”, J. Acoust. Soc.
Am. 58, 1030–1045.
Delgutte, B. (1990). “Physiological-mechanics og psychophysical masking - observations
27
from auditory-nerve fibers”, J. Acoust. Soc. Am. 87, 791–809.
Don, M. and Eggermont, J. (1978). “Analysis of click-evoked brain-stem potentials in man
using high-pass noise masking”, J. Acoust. Soc. Am. 63, 1084–1092.
Don, M., Ponton, C., Eggermont, J., and Kwong, B. (1998). “The effects of sensory hear-
ing loss on cochlear filter times estimated from auditory brainstem response latencies”, J.
Acoust. Soc. Am. 104, 2280–2289.
Eggermont, J. and Don, M. (1980). “Analysis of the click-evoked brain-stem potentials in
humans using high-pass noise masking. II. Effect of click intensity”, J. Acoust. Soc. Am. 68,
1671–1675.
Elberling, C. (1976). “High frequency evoked action potentials recorded from the ear canal
in man”, Scandinavian audiology 5, 157–164.
Elberling, C., Callø, J., and Don, M. (2010). “Evaluating auditory brainstem responses to
different chirp stimuli at three levels of stimulation”, J. Acoust. Soc. Am. 128, 215–223.
Elberling, C. and Don, M. (2008). “Auditory brainstem responses to a chirp stimulus de-
signed from derived-band latencies in normal-hearing subjects”, J. Acoust. Soc. Am. 124,
3022–3037.
Elberling, C. and Don, M. (2010). “A direct approach for the design of chirp stimuli used
for the recording of auditory brainstem responses”, J. Acoust. Soc. Am. 128, 2955–2964.
Elberling, C. and Kristensen, S. G. B. and Don, M. (2012). “Auditory brainstem responses
to chirps delivered by different insert earphones”, J. Acoust. Soc. Am., in press.
Fobel, O. and Dau, T. (2004). “Searching for the optimal stimulus eliciting auditory brain-
stem responses in humans”, J. Acoust. Soc. Am. 116, 2213–2222.
Folsom, R. (1984). “Frequency specificity of human auditory brain-stem responses as re-
vealed by pure-tone masking profiles”, J. Acoust. Soc. Am. 75, 919–924.
Galambos, R., Makeig, S., and Talmachoff, P. (1981). “A 40 Hz auditory potential recorded
from the human scalp”, Procedings of the national academy of sciences of the United States
of America-Biological sciences 78, 2643–2647.
Glasberg, B. R. and Moore, B. C. (1990). “Derivation of auditory filter shapes from notched-
28
noise data”, Hear. Res. 47, 103 – 138.
Goldstein, M. and Kiang, N. (1958). “Synchrony of neural activity in electric responses
evoked by transient acoustic stimuli”, J. Acoust. Soc. Am. 30, 107–114.
Gorga, M., Kaminski, J., Beauchine, K., and Jesteadt, W. (1988). “Auditory brain-stem
responses to tone bursts in normally hearing subjects”, Journal of speech and Hear. Res.
31, 87–97.
Greenwood, D. (1990). “A cochlear frequency-position function for several species - 19 years
later”, J. Acoust. Soc. Am. 87, 2592–2605.
Hansen, P. C. H. (1998). “Regularization tools. A matlab package for analysis and solution of
discrete ill-posed problems”, http://www2.imm.dtu.dk/∼pch/ (date last viewed 10/26/11).
Harte, J., Pigasse, G., and Dau, T. (2009). “Comparison of cochlear delay estimates using
otoacoustic emissions and auditory brainstem responses”, J. Acoust. Soc. Am. 126, 1291–
1301.
Harte, J., Rønne, F., and Dau, T. (2010). “Modeling human auditory evoked brainstem re-
sponses based on nonlinear cochlear processing”, Proceedings of 20th International Congress
on Acoustics .
Heinz, M., Zhang, X., Bruce, I., and Carney, L. (2001). “Auditory nerve model for predicting
performance limits of normal and impaired listeners”, ARLO 5, 91–96.
Ibrahim, R. A. and Bruce, I. C. (2010). “Effects of Peripheral Tuning on the Auditory
Nerve’s Representation of Speech Envelope and Temporal Fine Structure Cues”, Neuro-
physiological bases of auditory perception 429–438. LopezPoveda, E.A. and Palmer, A.R.,
15th International Symposium on Hearing, Salamanca, SPAIN, JUN 01-05, 2009, Med Elect;
Hear Life.
Jewett, D. and Williston, J. (1971). “Auditory-evoked far fields averaged from scalp of
humans”, Brain 94, 681–&.
John, M. and Picton, T. (2000). “Human auditory steady-state responses to amplitude-
modulated tones: phase and latency measurements”, Hear. Res. 141, 57–79.
Joris, P.X. and Carney, L. H. and Smith, P. H. and Yin, T. C. T. (1994). “Enhancement
29
of neural synchronization in the anteroventral cochlear nucleus .1. Responses to tones at the
characteristic frequency”, Journal of Neurophysiology 71, 1022–1036.
Joris, P.X. and Bergevin, C. and Kalluri, R. and McLaughlin, M. and Michelet, P. and
van der Heijden, M. and Shera, C.A. (2011). “Frequency selectivity in Old-World monkeys
corroborates sharp cochlear tuning in humans”, Proceedings of the national academy of
sciences of the United States of America 108, 17516–17520.
Junius, D. and Dau, T. (2005). “Influence of cochlear traveling wave and neural adaptation
on auditory brainstem responses”, Hear. Res. 205, 53–67.
Kiang, N. (1965). Discharge patterns of single fibers in the cat’s auditory nerve,32–67,
(Cambridge, Mass., M.I.T. Press).
Kiang, N. (1990). “Curious oddments of auditory-nerve studies”, Hear. Res. 49, 1–16.
Kuwada, S., Batra, R., and Maher, V. (1986). “Scalp potentials of normal and hearing-
impaired subjects in response to sinusoidally amplitude-modulated tones”, Hear. Res. 21,
179–192.
Lalor, E. C. and Foxe, J. J. (2010). “Neural responses to uninterrupted natural speech
can be extracted with precise temporal resolution”, European journal of neuroscience 31,
189–193.
Melcher, J. and Kiang, N. (1996). “Generators of the brainstem auditory evoked potential
in cat .3. Identified cell populations”, Hear. Res. 93, 52–71.
Murray, J., Cohn, E., Harker, L., and Gorga, M. (1998). “Tone burst auditory brain stem
response latency estimates of cochlear travel time in Meniere’s disease, cochlear hearing loss,
and normal ears”, American journal of otology 19, 854–859.
Neely, S., Norton, S., Gorga, M., and W., J. (1988). “Latency of auditory brain-stem
responses and otoacoustic emissions using tone-burst stimuli”, J. Acoust. Soc. Am. 83, 652–
656.
Pascal, J., Bourgeade, A., Lagier, M., and Legros, C. (1998). “Linear and nonlinear model
of the human middle ear”, J. Acoust. Soc. Am. 104, 1509–1516.
Picton, T., Skinner, C., Champagne, S., Kellett, A., and Maiste, A. (1987). “Potentials-
30
evoked by the sinusoidal modulation of the amplitude or frequency of a tone”, J. Acoust.
Soc. Am. 82, 165–178.
Puria, S. (2003). “Measurements of human middle ear forward and reverse acoustics: Im-
plications for otoacoustic emissions”, J. Acoust. Soc. Am. 113, 2773–2789.
Recio, A. and Rhode, W. (2000). “Basilar membrane responses to broadband stimuli”, J.
Acoust. Soc. Am. 108, 2281–2298.
Rees, A., Green, G., and Kay, R. (1986). “Steady-state evoked-responses to sinusoidally
amplitude-modulated sounds recorded in man”, Hear. Res. 23, 123–133.
Rhode, W. and Recio, A. (2000). “Study of mechanical motions in the basal region of the
chinchilla cochlea”, J. Acoust. Soc. Am. 107, 3317–3332.
Ribeiro, F. M. and Carvallo, R. M. (2008). “Tone-evoked ABR in full-term and preterm
neonates with normal hearing”, International journal of audiology 47, 21–29.
Richter, U. and Fedtke, T. (2005). “Reference zero for the calibration of audiometric equip-
ment using ’clicks’ as test signals”, International Journal og Audiology 44, 478–487.
Ruggero, M., Rich, N., Recio, A., Narayan, S., and Robles, L. (1997). “Basilar-membrane
responses to tones at the base of the chinchilla cochlea”, J. Acoust. Soc. Am. 101, 2151–2163.
Rønne, F.M., Harte, J., Elberling, C., Dau, T.(2011). “Modeling the level-dependent latency
of the auditory brainstem response”, Proceedings of Forum Acousticum 2011 .
Serpanos, Y. C., O’Malley, H., Gravel, J. S.,(1997). “The relationship between loudness
intensity functions and the click-ABR wave V latency”, Ear and Hearing 101, 2151–2163.
Shera, C., Guinan, J., and Oxenham, A. (2002). “Revised estimates of human cochlear tun-
ing from otoacoustic and behavioral measurements”, Proceedings of the National Academy
of Sciences of the United States of America 99, 3318–3323.
Shera, C. A., Guinan, Jr., J. J., and Oxenham, A. J. (2010). “Otoacoustic Estimation
of Cochlear Tuning: Validation in the Chinchilla”, JARO-Journal of the association for
research in otolaryngology 11, 343–365.
Shore, S. and Nuttall, A. (1985). “High-synchrony cochlear compound action-potentials
evoked by rising freuqency-swept tone bursts”, J. Acoust. Soc. Am. 78, 1286–1295.
31
Søndergaard, P. and Culling, J. F. and Dau, T. and Le Goff, N. and Jepsen, M. L. and
Majdak, P. and Wierstorf, H. (2011). “Towards a binaural modelling toolbox”, Proceedings
of the Forum Acousticum 2011
Swaminathan, J., Krishnan, A., and Gandour, J. T. (2008). “Pitch encoding in speech and
nonspeech contexts in the human auditory brainstem”, Neuroreport 19, 1163–1167.
Tikhonov, A. (1963). “Solution of incorrectly formulated problems and regularization
method”, Dklady Akademii NAUK SSSR 151, 501–&.
Warrier, C., Johnson, K., Hayes, E., Nicol, T., and Kraus, N. (2004). “Learning impaired
children exhibit timing deficits and training-related improvements in auditory cortical re-
sponses to speech in noise”, Experimental Brain Research 157, 431–441.
Westerman, L. and Smith, R. (1988). “A diffusion-model of the transient-response of the
cochlear inner hair cell synapse”, J. Acoust. Soc. Am. 83, 2266–2276.
Zilany, M. S. A. and Bruce, I. C. (2006). “Modeling auditory-nerve responses for high sound
pressure levels in the normal and impaired auditory periphery”, J. Acoust. Soc. Am. 120,
1446–1466.
Zilany, M. S. A. and Bruce, I. C. (2007). “Representation of the vowel (epsilon) in normal
and impaired auditory nerve fibers: Model predictions of responses in cats”, J. Acoust. Soc.
Am. 122, 402–417.
32
Frequency Total Length
kHz ms cycles
0.5 10 5
0.75 7 5.25
1 5 5
1.5 5 7.5
2 5 10
3 3.4 10.2
4 2.5 10
6 1.7 10.2
8 1.25 10
TABLE I. Tone burst stimuli used, with durations represented in ms and as number of
cycles.
33
k d Chirp
0.4501 0.6373 5
0.2207 0.5468 4
0.1083 0.4563 3
0.0531 0.3658 2
0.0260 0.2753 1
TABLE II. Values of the paired parameter, k and d, which define the delay-frequency func-
tion (eq. 8)
34
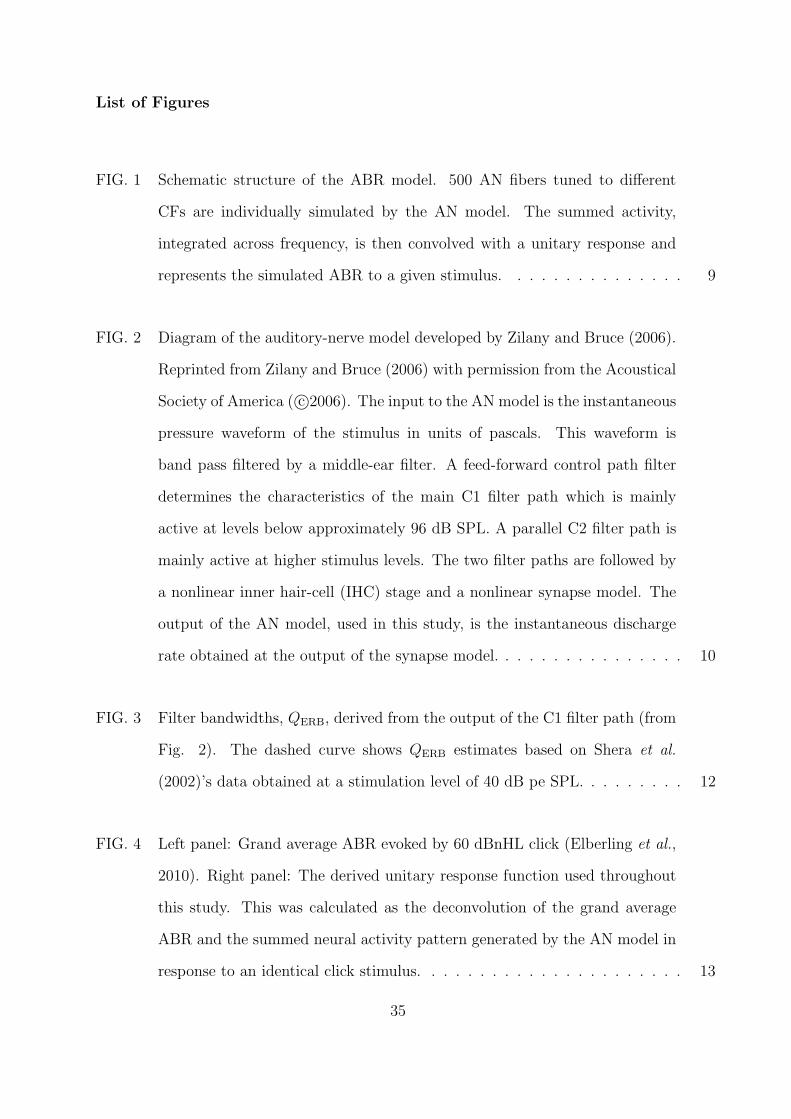
List of Figures
FIG. 1 Schematic structure of the ABR model. 500 AN fibers tuned to different
CFs are individually simulated by the AN model. The summed activity,
integrated across frequency, is then convolved with a unitary response and
represents the simulated ABR to a given stimulus. . . . . . . . . . . . . . . 9
FIG. 2 Diagram of the auditory-nerve model developed by Zilany and Bruce (2006).
Reprinted from Zilany and Bruce (2006) with permission from the Acoustical
Society of America ( c©2006). The input to the AN model is the instantaneous
pressure waveform of the stimulus in units of pascals. This waveform is
band pass filtered by a middle-ear filter. A feed-forward control path filter
determines the characteristics of the main C1 filter path which is mainly
active at levels below approximately 96 dB SPL. A parallel C2 filter path is
mainly active at higher stimulus levels. The two filter paths are followed by
a nonlinear inner hair-cell (IHC) stage and a nonlinear synapse model. The
output of the AN model, used in this study, is the instantaneous discharge
rate obtained at the output of the synapse model. . . . . . . . . . . . . . . . 10
FIG. 3 Filter bandwidths, QERB, derived from the output of the C1 filter path (from
Fig. 2). The dashed curve shows QERB estimates based on Shera et al.
(2002)’s data obtained at a stimulation level of 40 dB pe SPL. . . . . . . . . 12
FIG. 4 Left panel: Grand average ABR evoked by 60 dBnHL click (Elberling et al.,
2010). Right panel: The derived unitary response function used throughout
this study. This was calculated as the deconvolution of the grand average
ABR and the summed neural activity pattern generated by the AN model in
response to an identical click stimulus. . . . . . . . . . . . . . . . . . . . . . 13
35
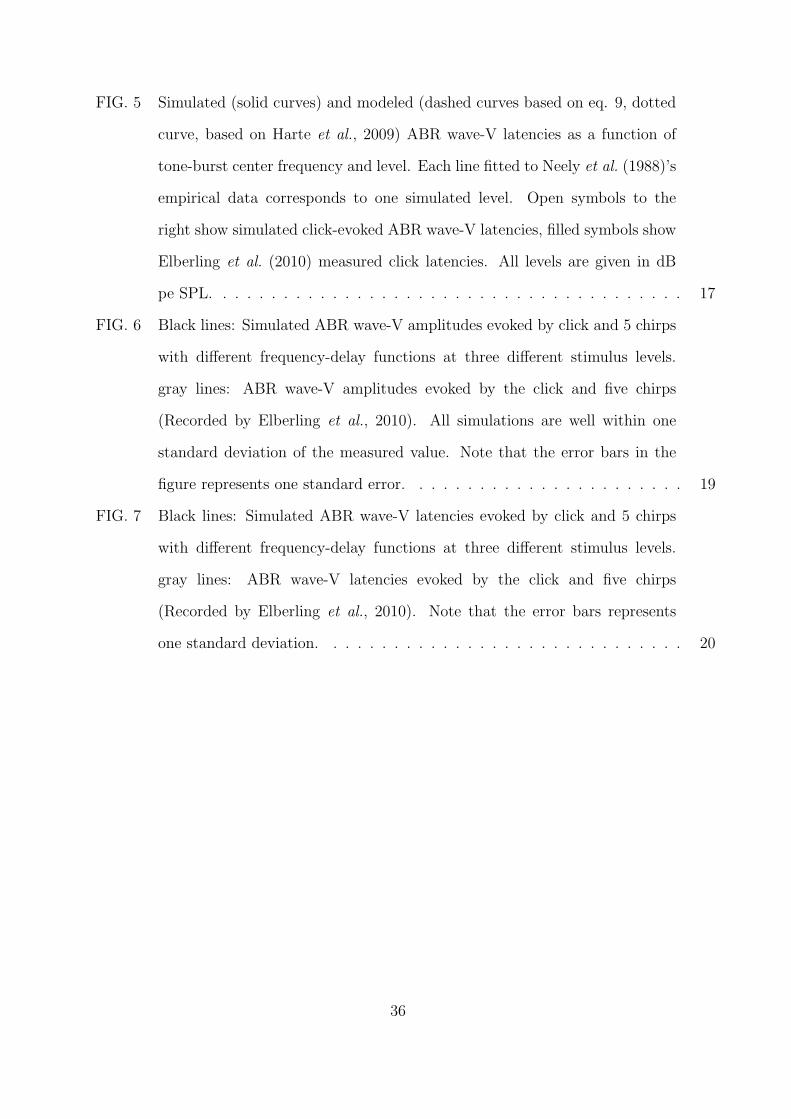
FIG. 5 Simulated (solid curves) and modeled (dashed curves based on eq. 9, dotted
curve, based on Harte et al., 2009) ABR wave-V latencies as a function of
tone-burst center frequency and level. Each line fitted to Neely et al. (1988)’s
empirical data corresponds to one simulated level. Open symbols to the
right show simulated click-evoked ABR wave-V latencies, filled symbols show
Elberling et al. (2010) measured click latencies. All levels are given in dB
pe SPL. . . . . . . . . . . . . . . . . . . . . . . . . . . . . . . . . . . . . . . 17
FIG. 6 Black lines: Simulated ABR wave-V amplitudes evoked by click and 5 chirps
with different frequency-delay functions at three different stimulus levels.
gray lines: ABR wave-V amplitudes evoked by the click and five chirps
(Recorded by Elberling et al., 2010). All simulations are well within one
standard deviation of the measured value. Note that the error bars in the
figure represents one standard error. . . . . . . . . . . . . . . . . . . . . . . 19
FIG. 7 Black lines: Simulated ABR wave-V latencies evoked by click and 5 chirps
with different frequency-delay functions at three different stimulus levels.
gray lines: ABR wave-V latencies evoked by the click and five chirps
(Recorded by Elberling et al., 2010). Note that the error bars represents
one standard deviation. . . . . . . . . . . . . . . . . . . . . . . . . . . . . . 20
36


![Road Traffic Noise and its Effect on Brain Stem Auditory ... · [2]. Among all objective methods of hearing evaluation, brainstem auditory evoked potential is considered the most](https://img.pdfslide.us/doc/110x75/5f5d38a1dfd4a155386e996d/road-traffic-noise-and-its-effect-on-brain-stem-auditory-2-among-all-objective.jpg)