Embed Size (px)
Citation preview

Modeling Atomic Scale Interfaces Using CZM in Carbon Nanotube Based Composites
NAMAS CHANDRA Department of Mechanical EngineeringFlorida State/Florida A&M University
Tallahassee FL 32310
Santa Fe, New MexicoAFOSR Contract Review Meeting
August 30- September 2, 2005

DNA~2-1/2 nm diameter
Things Natural Things Manmade
MicroElectroMechanical devices10 -100 m wide
Red blood cellsPollen grain
Fly ash~ 10-20m
Atoms of siliconspacing ~tenths of nm
Head of a pin1-2 mm
Quantum corral of 48 iron atoms on copper surfacepositioned one at a time with an STM tip
Corral diameter 14 nm
Human hair~ 10-50m wide
Red blood cellswith white cell
~ 2-5 m
Ant~ 5 mm
The Scale of Things -- Nanometers and More
Dust mite
200 m
ATP synthase
~10 nm diameter Nanotube electrode
Carbon nanotube~2 nm diameter
Nanotube transistor
O O
O
OO
O OO O OO OO
O
S
O
S
O
S
O
S
O
S
O
S
O
S
O
S
PO
O
21st Century Challenge
Combine nanoscale building blocks to make novel functional devices, e.g., a photosynthetic reaction center with integral semiconductor storage
Th
e M
icro
wo
rld
0.1 nm
1 nanometer (nm)
0.01 m10 nm
0.1 m100 nm
1 micrometer (m)
0.01 mm10 m
0.1 mm100 m
1 millimeter (mm)
1 cm10 mm
10-2 m
10-3 m
10-4 m
10-5 m
10-6 m
10-7 m
10-8 m
10-9 m
10-10 m
Visi
ble
Th
e N
ano
wo
rld
1,000 nanometers = In
frar
edU
ltrav
iole
tM
icro
wav
eSo
ft x-
ray
1,000,000 nanometers =
Zone plate x-ray “lens”Outermost ring spacing
~35 nm
Office of Basic Energy SciencesOffice of Science, U.S. DOE
Version 03-05-02

AMML
Note on Molecular DynamicsGiven for one instance an intelligence which would comprehend all forces by which nature is animated and the respective situation of beings who compose it ……… Nothing would be uncertain and the future , as the past, would be present to its eyes
Laplace, 1814
Given a geometric configuration of atoms, we can compute all the future configurations if we can compute the motion of each atom as a function of time if we know how the atoms will move under mutually interacting forces
Limitations Interacting forces given by
potential energy functions; Right function or series of functions critical
Space scale 1 μm3 of Al contains about 1010
atoms Time Scale 1 step= 1fs : For simulation of
1μs need 109 steps

AMML
Carbon Nanotubes (CNTs)Carbon Nanotubes (CNTs)
CNTs can span 23,000 miles without failing due to its own weight.
CNTs are 100 times stronger than steel.
Many times stiffer than any known material
Conducts heat better than diamond
Can be a conductor or insulator without any doping.
Lighter than feather.

AMML
Carbon Nanotubes (CNT)
Carbon Nanotubes: Graphite sheet rolled into a tube Single wall and Multiwall nanotubes Zigzag, armchair and chiral nanotubes Length ~ 100 nm to few m Diameter~ 1 nm
E ~ 1 TPa Strength ~150 GPaConductivity depends on chirality
ApplicationsC a rb o n n a n o t u b e s i nd if fe re n t o r i e n ta t io nV is c o -e la s ti c m e d iu m
High strengthcomposites
Functionalcomposites
Nano electronics
Energy storage
Nano sensorsMedical applications
Do these properties extend to CNT reinforced composites ?

AMML
Do we realize the potentials of CNT in PMC?Researcher Matrix Vol% CNT
Exptl Calculation
SeriesParallel
Schaddler ‘98 Epoxy 2.85 (tension) 1.13 9.60 1.03
Epoxy 2.85 (comp) 1.4 9.60 1.03
Andrews ‘99 Petroleumpitch
0.33 1.20 9.09 1.003
1.62 2.29 12.46 1.016
Gong ‘00 Epoxy 0.57 1.12 4.98 1.0057
0.57 1.25 4.98 1.0057
Qian ‘00
(With surf actant)
Polystyrene 0.49 1.24 4.9151 1.0049
Ma’00 PET 3.6 1.4 4.564 1.037
Andrews’02 Polystyrene 2.5 1.22 14.86 1.035.0 1.28 28.73 1.0510.0 1.67 56.46 1.1115.0 2.06 84.18 1.1825.0 2.50 139.64 1.33
PPA 0.50 1.17 5.16 1.011.50 1.33 13.49 1.022.50 1.50 21.81 1.035.00 2.50 42.62 1.05
EC EM
EC EM
C f f m mE V E V E
Parallel modelUpper Bound
1 f m
C f m
V V
E E E
Series modelLower Bound
Answer is No-We do not
AMML
Inte
rfac
e
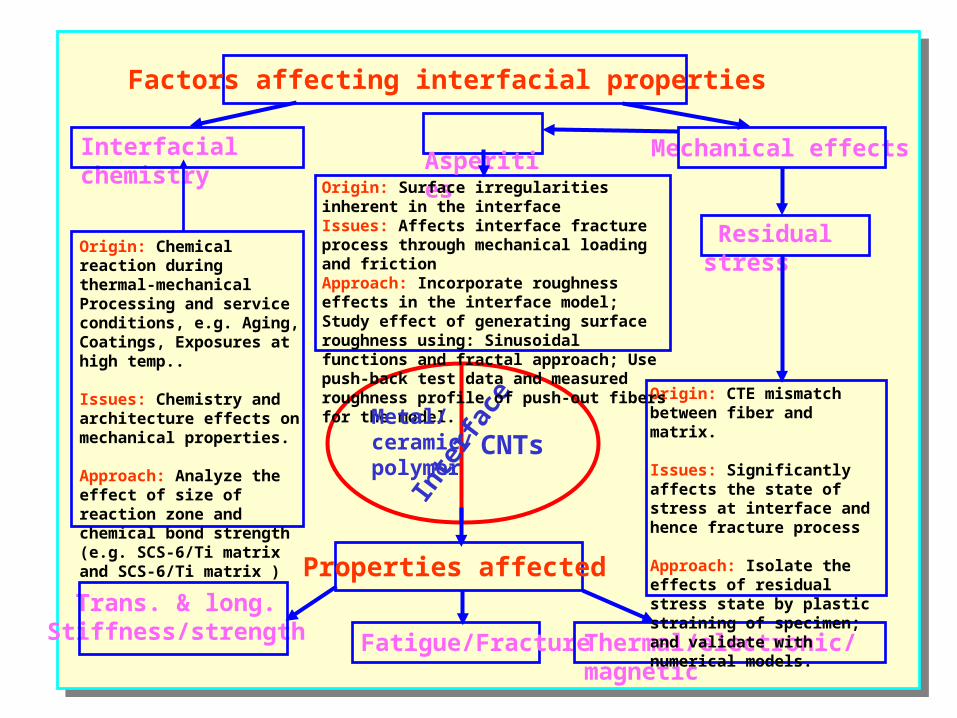
Properties affected
Fatigue/Fracture Thermal/electronic/magnetic
Factors affecting interfacial properties
Trans. & long.Stiffness/strength
Interfacial chemistry Mechanical effects
Origin: Chemical reaction during thermal-mechanical Processing and service conditions, e.g. Aging, Coatings, Exposures at high temp..
Issues: Chemistry and architecture effects on mechanical properties.
Approach: Analyze the effect of size of reaction zone and chemical bond strength (e.g. SCS-6/Ti matrix and SCS-6/Ti matrix )
Residual stress
Origin: CTE mismatch between fiber and matrix.
Issues: Significantly affects the state of stress at interface and hence fracture process
Approach: Isolate the effects of residual stress state by plastic straining of specimen; and validate with numerical models.
Asperities
Origin: Surface irregularities inherent in the interfaceIssues: Affects interface fracture process through mechanical loading and frictionApproach: Incorporate roughness effects in the interface model; Study effect of generating surface roughness using: Sinusoidal functions and fractal approach; Use push-back test data and measured roughness profile of push-out fibers for the model.
Metal/ceramic/polymer
CNTs

AMML
Critical Scientific Issues
• Critical issues in nanotube composites
– Alignment– Dispersion– Load Transfer
• Load transfer and to some extant Dispersion affected by interfaces
• Interface Bounding surface with physical / chemical / mechanical discontinuity
• CNT-matrix interfaces– Vanderwall’s forces– Mechanical interlocking– Chemical bonding

AMML
Some issues in Elastic Modulii computation
• Energy based approach– Assumes existence of W. Then,– Validity of W based on potentials questionable under conditions such as
temperature, pressure– Value of E depends on selection of strain.
• Stress –Strain approach– Circumvents the above problems
– Evaluation of local modulus for defect regions possible
2
2YW
E

Averaging Volume
Total Volume
Atomic Volume
Stress Measures
Virial stress
1 1 1
2 2
N
ij i j j imv v r f
1 1 1
2 2
N N
ij i j i jm v v f r
BDT stress
1 1
1 1 1
2 2
N Nlutskoij i j j iLutsko
mv v r f
r
Lutsko stress
Averaging Volumefor Lutsko stress
ZY
X

Strain calculation in nanotubes
Defect free nanotube mesh of hexagons
Strain calculated using displacements and derivatives shape functions in a local coordinate system formed by tangential (X) and radial (y) direction of centroid and tube axis
Area weighted averages of surrounding hexagons considered for strain at each atom
Similar procedure for pentagons and heptagons
G
Y’X’
Z’ Z
X
Y
i
j
l
Updated Lagrangian scheme is used in MD simulations

Elastic modulus of defect free CNT
Strain
Stress
(GPa)
0 0.01 0.02 0.03 0.04 0.05 0.06 0.07
10
20
30
40
50
60
Bulk Stress (E=1.002 TPa)
Lutsko Stress (E= 0.997 TPa)
BDT Stress (E= 1.002 TPa)
-All stress and strain measures yield a Young’s modulus value of 1.002TPa
-Defect free (9,0) nanotube with periodic boundary conditions
-Strains applied using conjugate gradients energy minimization
-Values in literature range from 0.5 to 5.5 Tpa. Mostly around 1Tpa

Effect of Diameter
Strains
Str
ess
(GP
a)
0 0.01 0.02 0.03 0.04 0.05 0.060
10
20
30
40
50
(9,0) at defect
(10,0) at defect
(11,0) at defect
(13,0) at defect
(15,0) at defect
(9,0) no defect
(10,0) no defect
(11,0) no defect
(13,0) no defect
(15,0) no defect
stress strain curves for different (n,0)tubes with varying diameters.
stiffness values of defects for various tubes with different diameters do not change significantly
Stiffness in the range of 0.61TPa to 0.63TPa for different (n,0) tubes
Mechanical properties of defect not significantly affected by the curvature of nanotube

Residual stress at zero strain
Stress is present at zero strain values.
This corresponds to stress due to curvature
It is found to decrease with increasing diameter
Basis for stress calculation graphene sheet
Brenner et. al.1 observed similar variation in energy at zero strain
1 Robertson DH, Brenner DW and Mintmire 1992 1/Radius (A)
Sre
ss(G
PA
)
0.1 0.2 0.30
1
2
3
4
5
(8,0)
(9,0)
(10,0)
(11,0)
(12,0)
(15,0)
(17,0)
(20,0)(25,0)
(50,0)
N. Chandra et. al., Phys. Rev B 69, 09141 (2004)

CNT with 5-7-7-5 defect
Lutsko stress profile for (9,0) tube with type I defect shown below
Stress amplification observed in the defected region
This effect reduces with increasing applied strains
In (n,n) type of tubes there is a decrease in stress at the defect region
z - position
Str
ess
(Gp
a)
-20 -10 0 10 2010
20
30
40
50
60
3 % Applied Strain
0 % Applied Strain
1 % Applied Strain
5 % Applied Strain
7 % Applied Strain
8 % Applied Strain
Shet and Chandra, J. Mat. Sci, 40, 27-36 (2005)Shet, Chandra, Namilae, Mech. Adv. Mat. Str,,55-65, (2005).

Evolution of stress and strain
Strain and stress evolution at 1,3,5 and 7 % applied strainsStress based on BDT stress

Local elastic moduli of CNT with defects
Strain
Str
ess
(GP
a)
0 0.025 0.05 0.075 0.10
10
20
30
40
50
60
(9,0) CNT no defect
Type I defect
Type II defect
(a)
(b)
(c)
-Reduction in stiffness in the presence of defect from 1 Tpa-Initial residual stress indicates additional forces at zero strain-Analogous to formation energy
-Type I defect E= 0.62 TPa
-Type II defect E=0.63 Tpa
Namilae and Chandra, Chem.. Phy. Letters 387, 4-6, 247-252, (2004)
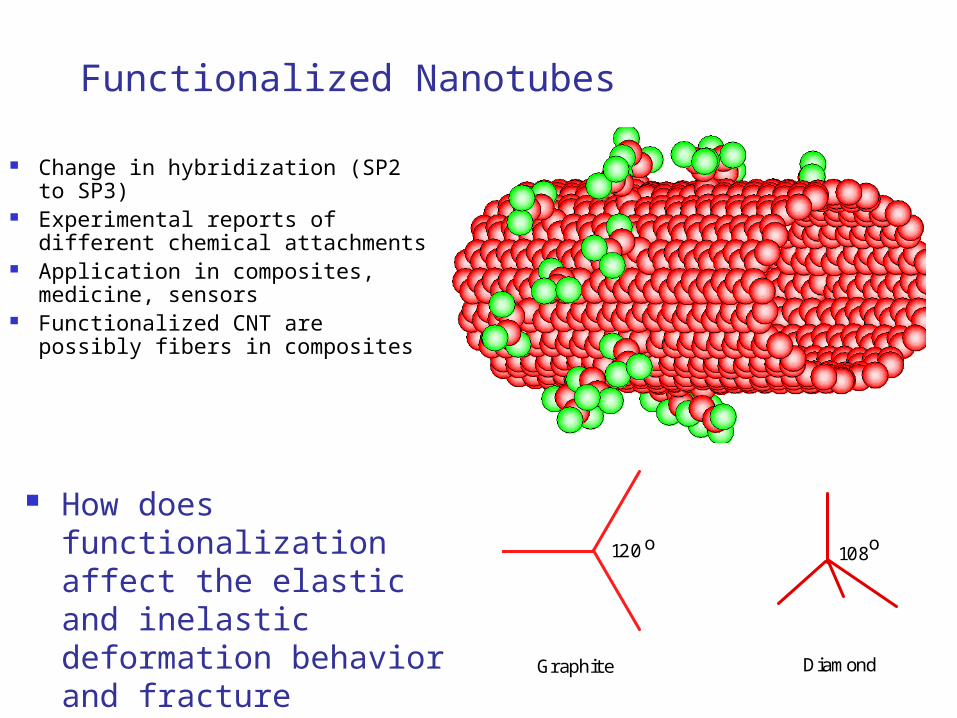
Functionalized Nanotubes
Change in hybridization (SP2 to SP3)
Experimental reports of different chemical attachments
Application in composites, medicine, sensors
Functionalized CNT are possibly fibers in composites
108o120o
Graphite Diamond
How does functionalization affect the elastic and inelastic deformation behavior and fracture

Strain
Str
ess
(Gp
a)
0 0.01 0.02 0.03 0.04
5
10
15
20
25
30
35
(10,10) CNT 0.84 T Pa
(10,10) CNT with vinyl 0.92 T Pa
(10,10) CNT with butyl 1.03 T Pa
Functionalized nanotubes Increase in stiffness observed by functionalizing
Stiffness increase is more for higher number of chemical attachments
Stiffness increase higher for longer chemical attachments
Volume for Stress Calculation
Vinyl and ButylHydrocarbonsT=77K and 3000KLutsko stress

(8,0)
(10,10)
(10,10)
(10,10)
(10,10)
(10,10)
(12,0)
(15, 0)
(8,8)
(10,10)
(12,12)
(10,0)
3.13
3.91
6.78
6.78
6.78
6.78
6.78
4.69
5.87
5.42
6.78
8.13
21
21
21
21
21
31
-C2H3*
-C2H3
-C2H3
-C2H3
-C2H3
-C2H3
-C2H3
-C3H5
-C4H7
-C5H9*
-C2H3
-C2H3
21
21
21
21
21
50
0.862
0.854
0.859
0.849
0.721
0.837
0.784
0.837
0.837
0.837
0.837
0.837
1 .05
1 .04
0.977
0.951
0.889
0.932
0.906
0.940
1.03
0.95
1.02
1.11
Nanotube Radius Chemical # of E (TPa) w/o E (TPa)Group Attachments Attachments Attachments Stiffness
increase is more for higher number of chemical attachments
Stiffness increase higher for longer chemical attachments
Namilae and Chandra, Chem. Phy. Letters 387, 4-6, 247-252, (2004)
Local Stiffness of Functionalized CNTs Local Stiffness of Functionalized CNTs

Contour plots Higher stress atthe location ofattachment
Stress (GPa) Stress (GPa)
Stress (GPa)Stress (GPa) Stress (GPa)
(a) (b) (c)
(d) (e) (f)
Stress contours with one chemical attachment. Stress fluctuations are present

Radius variation
Atom Number
Ra
diu
s
100 200 300 400
6.6
6.7
6.8
6.9
7
7.1
7.2
7.3
with vinyl attachments
without attachments
Increased radius of curvature at the attachment because of change in hybridization
Radius of curvature lowered in adjoining area
Sp3 Hybridization here
Higher stress atthe location ofattachment
Stress (GPa) Stress (GPa)
Stress (GPa)Stress (GPa) Stress (GPa)
(a) (b) (c)
(d) (e) (f)

Defects Evolve at much lower strain of 6.5 % in CNT with chemical attachments
Onset of plastic deformation at lower strain. Reduced fracture strain
Evolution of defects in tensionEvolution of defects in tension
Defects EvolveEffect of functionalization
on defect evolution

Different Fracture Mechanisms ?
Fracture Behavior Different Fracture happens by
formation of defects, coalescence of defects and final separation of damaged region in defect free CNT
In Functionalized CNT it happens in a brittle manner by breaking of bonds
Namilae and Chandra, Chem. Phy. Letters 387, 4-6, 247-252, (2004)

Displacement (A)S
tre
ss(G
Pa
)10 20 30 40
0
10
20
30
40
50
60
70
80
90
100
110
120
130
o
(a)
(b)
Compressive behavior of CNT in polymer matrix withWeak interface
Weak Interfaces
Compressive Behavior of CNT composites (weak) Compressive Behavior of CNT composites (weak)

Displacement (A)S
tre
ss(G
Pa
)10 20 30 40
0
20
40
60
80
100
120
140
160
(a)(b)
(c)(d)
(e)
(f)
(g)
o
Strong Interfaces
Compressive Behavior of CNT composites (strong)Compressive Behavior of CNT composites (strong)
•Deformation mechanism changes•Mechanical Response significantly altered
Strong Interfaces

Compressive response of (6,0)(15,0) nanotube with and without chemical bonding between the walls of nanotubes.
Tensile simulation with functionalization
Tensile simulation without functionalization
StrainS
tre
ss(G
Pa
)0.01 0.02 0.03 0.04 0.05 0.06
0
10
20
30
40
50
60
70(a)
(b)
(c)
(d)
(e)
Effect of interstitial on tensile behavior of MWNTs
Interstitial atoms increase the load transfer in tension, and both stiffness and strength increase
Paper under reviewInterstitial atoms in multiwall nanotubes

Atomic simulation of CNT pullout test
Simulation conditions Corner atoms of hydrocarbon attachments fixed Displacement applied as shown 0.02A/1500 steps T=300K
Matrix
Fiber

Energy for debonding of chemical attachment = 3eV
Simulation of pull-out test Simulation of pull-out test

Interfacial shear
Displacement (A)
React
ion
(eV/A
)
5 10 15-1
0
1
2
3
4
5
6
7
8
Typical interface shear force pattern. Note zero force afterFailure (separation of chemical attachment)
After Failure
Max load
250,000 steps
Interfacial shear measured as reaction force of fixed atoms

Debonding and Rebonding of Interfaces
displacement (A)
Fo
rce
(eV
/A)
0 5 10 15-2
-1
0
1
2
3
4
5
6
7
8Rebonding
Debonding
Failure

Matrix
Debonding and Rebonding
Energy for debonding of chemical attachment 3eV
Strain energy in force-displacement plot 20 ± 4 eV
Energy increase due to debonding-rebonding
Matrix

displacement (A)
Fo
rce
(eV
/A)
0 5 10 15-2
-1
0
1
2
3
4
5
6
7
8
displacement (A)
Fo
rce
(eV
/A)
0 5 10 15-2
-1
0
1
2
3
4
5
6
7
8displacement (A)
Forc
e(e
V/A
)
0 5 10 15-2
-1
0
1
2
3
4
5
6
7
8
displacement (A)F
orc
e(e
V/A
)0 5 10 15
-2
-1
0
1
2
3
4
5
6
7
8
displacement (A)F
orc
e(e
V/A
)
0 5 10 15-2
-1
0
1
2
3
4
5
6
7
8
displacement (A)
Fo
rce
(eV
/A)
0 5 10 15-2
-1
0
1
2
3
4
5
6
7
8
Various types of Interface Behavior Various types of Interface Behavior

Increasing the length of attachment increases region ‘a’
Decreasing the number of attachments extends region ‘b’
Displacement (A)
For
ce(e
v/A
)
0 5 10 15-2
-1
0
1
2
3
4
5
6
7
8
(a)
(b)
(c)(d)
(e)
Peak force
failureab
c d
e
b
a
c
Behavior of different lengths of interfacesBehavior of different lengths of interfaces

Displacement (A)
Fo
rce
(eV
/A)
5 10 15
0
2
4
6
8
2
Temperature 50 K
Displacement (A)
Fo
rce
(eV
/A)
5 10 15
0
2
4
6
8
2
Temperature 1000 K
Displacement (A)
Fo
rce
(eV
/A)
5 10 15
0
2
4
6
8
2
Temperature 2000 K
Displacement (A)
Fo
rce
(eV
/A)
5 10 15
0
2
4
6
8
2
Temperature 300 K
Force to failure decreases with increasing temperature
Debonding-rebonding behavior at higher temperatures does not alter the energy dissipation
Temperature dependence of pullout tests

Assumptions Nanotubes deform in linear elastic manner Interface character completely determined by traction-displacement plot
D isplacement (d)
Typical t - d plot
M at r ix
F iber (N anot ube)
M at r ix
F iber (N anot ube)
W1
W2
W1
W2
(a)
(b)
(c )
(d )
u
Chandra et. a., IJSS, 39, 2827-2855, (2002)
Cohesive zone model for interfaces

Cohesive zone Models for nanoscale interfaces
Applied displacement (A)
Tra
ctio
n(G
Pa
)
5 10 15
0
0.1
0.2
0.3
0.4
0.5
0.6
Applied displacement (A)
Tra
ctio
n(G
Pa
)
5 10 15
0
1
2
3
4
5
Applied displacement (A)
Tra
ctio
n(G
Pa)
5 10 15 20 25
0
0.1
0.2
0.3
0.4
0.5
0.6
Applied displacement (A)
Tra
ctio
n(G
Pa)
5 10 15 20 25
0
1
2
3
4
5
(a)
(b)
Namilae and Chandra JEMT, 222-232,
(2005).

Finite element simulation
ABAQUS with user element for cohesive zone model
Linear elastic model for both matrix and CNT
About 1000 elements and 100 elements at interface

Parametric studies
Volume % CNT
Ela
stic
Mo
du
lus
(GP
a)
0 5 10 15 20
5
10
15
20
25
30
35
Interface Strength = 5 MPa
Interface Strength = 5 GPa
Interface Strength = 50 MPa
Interface Strength = 500 MPa
Perfect Interface
Variation of CNT content for different interface strengths

Parametric studies
Matrix Elastic Modulus (GPa)
Co
mp
osi
teE
last
icM
od
ulu
s(G
Pa
)
0 5 100
5
10
15
20
25
30
35
40
Interface strength= 50 MPa
Interface strength= 500 MPa
Interface strength= 5 GPa
Interface strength= 5 MPa
Perfect Interface
Pure Matrix
Variation of matrix stiffness for different interface strengths

Parametric studies
Fiber Elastic Modulus (GPa)
Co
mp
osi
teE
last
icM
od
ulu
s(G
Pa
)
200 400 600 800 1000
4
6
8
10
12
14
16
18
20SiCFiber
GlassFiber
CarbonFiber
CNT
Very low interface strength = 5 MPa
Interface strength = 50 MPa
Interface strength = 500 MPa
Interface strength = 5 GPa
Perfect Interface
Fiber Volume = 7.7%
Matrix E = 3.5 GPa
Variation of fiber stiffness for different interface strengths

AMML
Summary
• Interfaces play a key role even at micro/nano scales.• Nanoscale effects can be effectively captured using
molecular dynamics model (using the right potentials).• MD results can be integrated in an heirarchical model
using CZM-Finite Element method• Using Atomistic scale we can determine atomic effect on
macro effects.• Understanding the effects of nanoscale interfaces, and
interface mechanics will be important in in a number of engineering applications.

AMML
AcknowledgementAcknowledgement
Nanomechanics Group:Prof. A. Srinivasan, U. Chandra
Dr. S. Namilae, C. Shet
S. Guan, M. Naveen, Girish, Yanan, J. Kohle, Jason Montgomery
FuAlso contributed by ARO, NSF, FSURF
Dr. Les Lee, AFOSR, Short Term Grant

AMML
Further ReferencesFurther References
MD Papers:N. Chandra, S. Namilae, and C. Shet, Local elastic properties of carbon nanotubes in the presence of Stone -
Wales defects, Physical Review B, 69, 094101, (2004).S. Namilae, N. Chandra, and C. Shet, Mechanical behavior of functionalized nanotubes, Chemical Physics
Letters 387, 4-6, 247-252, (2004) N. Chandra and S. Namilae, Multi-scale modeling of nanocystalline materials, Materials Science Forum, 447-
448, 19-27, (2004)..C. Shet, N. Chandra, and S. Namilae, Defect-defect interaction in carbon nanotubes under mechanical loading,
Mechanics of Advanced Materials and Structures, (2004) (in print).C. Shet, N. Chandra, and S. Namilae, Defect annihilations in carbon nanotubes under thermo-mechanical
loading, Journal of Material Sciences , (in print).S. Namilae, C. Shet, N. Chandra and T.G. Nieh, Atomistic simulation of grain boundary sliding in pure and
magnesium doped aluminum bicrystals, Scripta Materialia 46, 49-54 (2002).S. Namilae, C. Shet, N. Chandra and T.G. Nieh, Atomistic simulation of the effect of trace elements on grain
boundary of aluminum, Materials Science Forum, 357-359, 387-392, (2001).C. Shet, H. Li and N. Chandra, Interface Models for grain boundary sliding and migration, Materials Science
Forum 357-359, 577-586, (2001).N. Chandra and P. Dang, Atomistic Simulation of Grain Boundary Sliding and Migration, Journal of
Materials Science, 34, 4, 656-666 (1998).N. Chandra, Mechanics of Superplastic Deformations at Atomic Scale, Materials Science Forum, 304, 3, 411-
419 (1998).

AMML
Further ReferencesFurther References
Cohesive Zones:
C. Shet and N. Chandra, The effect of the shape of the cohesive zone curves on the fracture responses, Mechanics of Advanced Materials and Structures, 11(3), 249-276, (2004).
N. Chandra and C. Shet, A Micromechanistic Perspective of Cohesive Zone Approach in Modeling Fracture. Computer Modeling in Engineering & Sciences, CMES, Computer Modeling in Engineering and Sciences, 5(1), 21-34, (2004))
H. Li and N. Chandra, Analysis of Crack Growth and Crack-tip Plasticity in Ductile Material Using Cohesive Zone Models, International Journal of Plasticity, 19, 849-882, (2003).
N. Chandra, Constitutive behavior of Superplastic materials, International Journal for nonlinear mechanics, 37, 461-484, (2002).
N. Chandra, H. Li, C. Shet and H. Ghonem, Some Issues in the Application of Cohesive Zone Models for Metal-ceramic Interface. International Journal of Solids and Structures, 39, 2827-2855, (2002).
C. Shet and N. Chandra, Analysis of Energy Balance When Using Cohesive Zone Models to Simulate Fracture Process, ASME Journal of Engineering Materials and Technology, 124, 440-450, (2002).
N. Chandra, Evaluation of Interfacial Fracture Toughness Using Cohesive Zone Models, Composites Part A: Applied Science and Manufacturing, 33, 1433-1447, (2002).
C. Shet, H. Li and N. Chandra, Interface Models for grain boundary sliding and migration, Materials Science Forum 357-359, 577-586, (2001).

AMML
Further ReferencesFurther References
Interface Mechanics:N. Chandra and H. Ghonem, Interfacial Mechanics of push-out tests: theory and experiments, Composites Part A: Applied Science and Manufacturing, 32, 3-4, 575-
584, (2001).D. Osborne, N. Chandra and, H. Ghonem, Interface Behavior of Ti Matrix Composites at elevated temperature, Composites Part A: Applied Science and
Manufacturing, 32, 3-4, 545-553, (2001).N. Chandra, S. C. Rama and Z. Chen, Process Modeling of Superplastic materials, Materials Transactions JIM, 40, 8, 723-726 (1999).S. R. Voleti, C. R. Ananth and N. Chandra, Effect of Fiber Fracture and Matrix Yielding on Load Sharing in Continuous Fiber Metal Matrix Composites, Journal of
Composites Technology and Research, 20, 4, 203-209, (1998).C.R. Ananth, S. R. Voleti and N. Chandra, Effect of Fiber Fracture and Interfacial Debonding on the Evolution of Damage in Metal Matrix Composites, Composites
Part A, 29A, 1203-1211, (1998) S. Mukherjee, C. R. Ananth and N. Chandra, Effect of Interface Chemistry on the Fracture Properties of Titanium Matrix Composites, Composites Part A, 29A, 1213-
1219, (1998) S. R. Voleti, C. R. Ananth and N. Chandra, Effect of Interfacial Properties on the Fiber Fragmentation Process in Polymer Matrix Composites, Journal of Composites
Technology and Research, 20, 1, 16-26, (1998). S. Mukherjee, C. R. Ananth and N. Chandra, Evaluation of Fracture Toughness of MMC Interfaces Using Thin-slice Push-out Tests, Scripta Materialia, 36, 1333-
1338 (1997). C. R. Ananth, S. Mukherjee, and N. Chandra, Effect of Time Dependent Matrix Behavior on the Evolution of Processing-Induced Residual Stresses in Metal Matrix
Composites, Journal of Composites Technology and Research 19, 3, 134-141, (1997). S. Mukherjee, C. R. Ananth and N. Chandra, Effect of Residual Stresses on the Interfacial Fracture Behavior of Metal Matrix Composites, Composite Science and
Technology, 57, 1501-112, (1997). C. R. Ananth and N. Chandra, Elevated temperature interfacial behavior of MMC: a computational study, Composites: Part A, 27A, 805-811 (1996). S. R. Voleti, N. Chandra and J R. Miller, Global-Local Analysis of Large-scale Composite Structures Using Finite Element Methods, Composites & Structures, 58, 3,
453-464, (1996). C. R. Ananth and N. Chandra, Evaluation of Interfacial Properties of Metal Matrix Composites from Fiber Push-out Tests, Mechanics of Composite Materials and
Structures, 2, 309-328 (1995).Xie, Z.Y. and N. Chandra, Application of GPS Tensors to Fiber Reinforced Composites, Journal of Composite Materials, 29, 1448-1514, (1995). S. Mukherjee, H. Garmestani and N. Chandra, Experimental Investigation of Thermally Induced Plastic Deformation of MMCs Using Backscattered Kikuchi Method,
Scripta Metallurgica et Materialia, 33, 1, 93-99 (1995). N. Chandra and C.R. Ananth, Analysis of Interfacial Behavior in MMCs and IMCs Using Thin Slice Push-out Tests', Composite Science and Technology, 54, 1 , 87-
100, (1995). C. R. Ananth and N. Chandra, Numerical Modeling of Fiber Push-Out Test in Metallic and Intermetallic Matrix Composites-Mechanics of the Failure Process', Journal
of Composite Materials, 29, 11, 1488-1514, (1995). N. Chandra., C.R. Ananth and H. Garmestani, Micromechanical Modeling of Process-Induced Residual Stresses in Ti-24Al-11Nb/SCS6 Composite', Journal of
Composite Technology and Research, 17, 37-46, (1994). Z. Xie and N. Chandra, Application of Equation Regulation Method to Multi-Phase Composites', International Journal of Non-linear Mechanics, 28, 6, 687-704,
(1993).

Buckling Behavior-Neat CNT

Buckling Behavior-Functionalized CNT

Compressive loading of carbon nanotubes
Using surface modified CNT in composites improves resistance to buckling

Thermal Stresses
Temperature (K)
Str
ess
(GP
a)
100 200 300 400 5000
0.1
0.2
0.3
0.4
0.5
0.6
0.7
0.8
0.9
1
1.1
1.2
With AttachmentsWith AttachmentsNo AttachmentsNo Attachments
Thermal stress is higher for functionalized nanotube in polymer matrix

Strain
En
erg
yp
er
ato
m(e
V)
0.025 0.05 0.075 0.1
-7.165
-7.16
-7.155
-7.15
-7.145
-7.14
-7.135
-7.13
-7.125
Energy per atom experienced by the inner tube in (6,0) (15,0) double walled
Effect of capped and uncapped on the compressive behavior of MWNTs
Capped compressive simulation
Uncapped compressive simulation
Inner tube is loaded in compression, even with weak inter wall interaction