Embed Size (px)
Citation preview

Modeling and Simulation to Support Virtual Chemical Hazard Environments
Jeffery D Peterson, Ph.D.James A Kleimeyer, Ph.D.
Richard J Green, Ph.D.
West Desert Test Center, Dugway Proving Ground
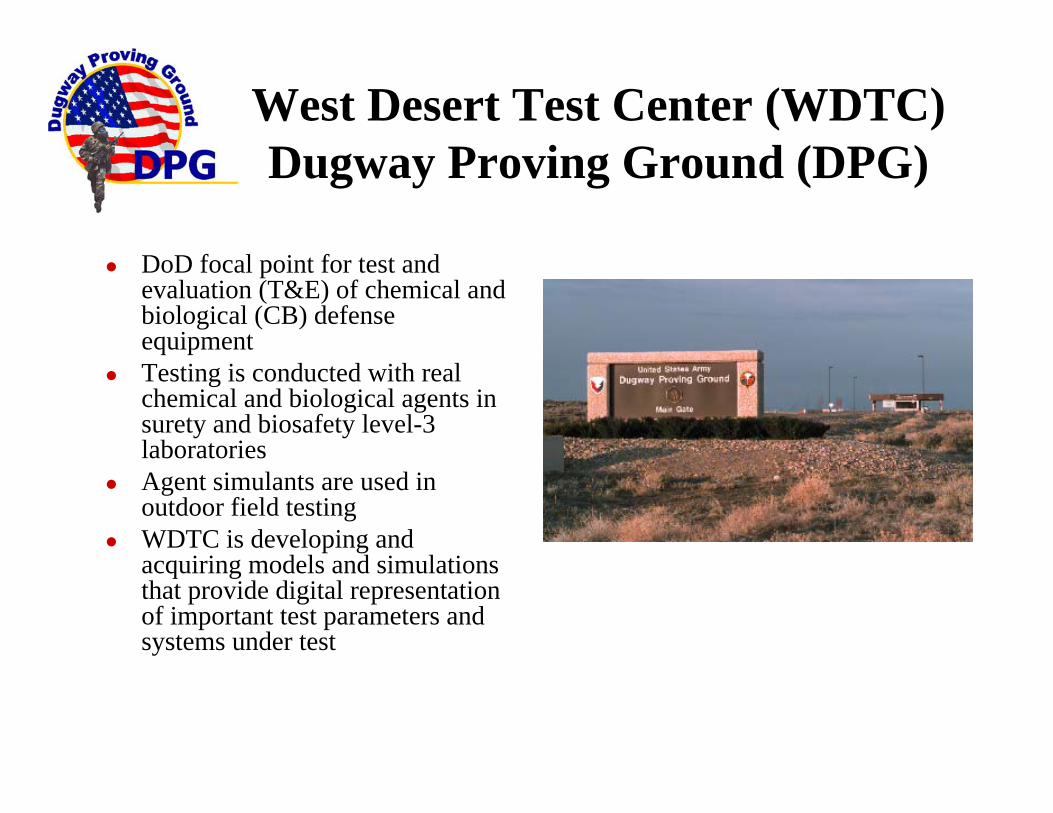
West Desert Test Center (WDTC)Dugway Proving Ground (DPG)
DoD focal point for test and evaluation (T&E) of chemical and biological (CB) defense equipmentTesting is conducted with real chemical and biological agents in surety and biosafety level-3 laboratories Agent simulants are used in outdoor field testingWDTC is developing and acquiring models and simulations that provide digital representation of important test parameters and systems under test
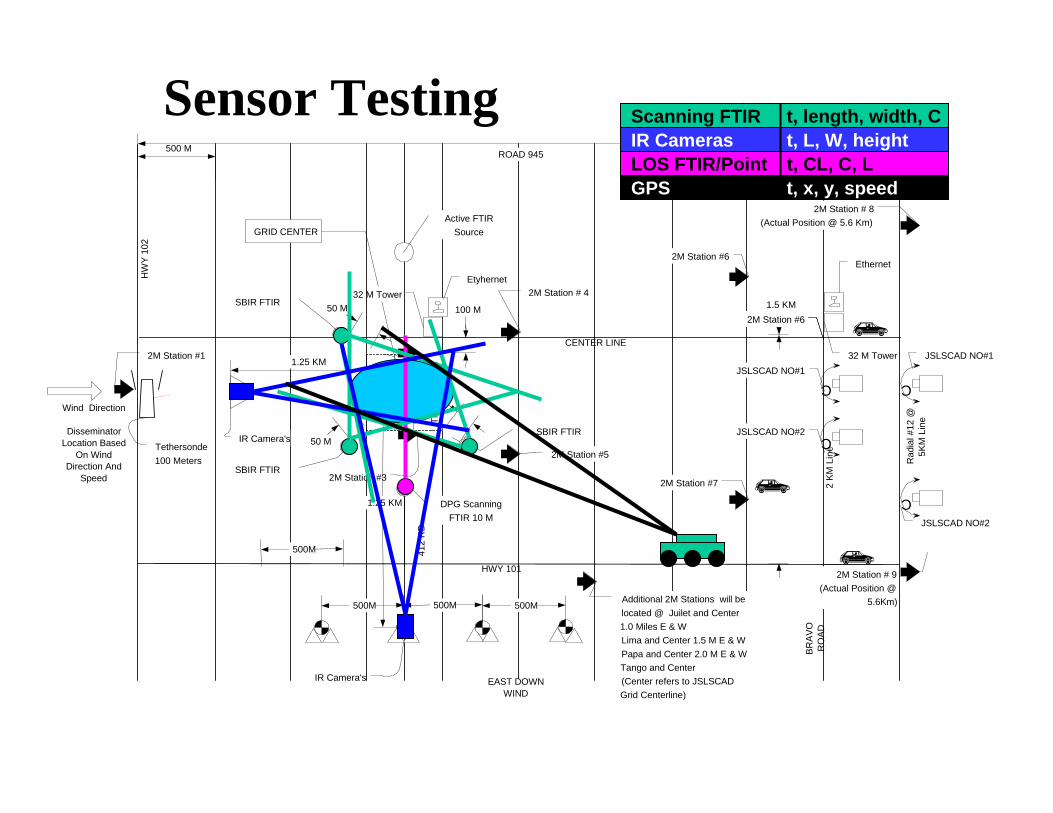
Sensor Testing
JSLSCAD NO#2
JSLSCAD NO#1
EAST DOWNWIND
CENTER LINE
HWY 101
HW
Y 10
2500 M
Trut
h M
onito
r's
GRID CENTER
IR Camera's
32 M Tower
32 M Tower
DPG ScanningFTIR 10 M
412
RD
Wind Direction
DisseminatorLocation Based
On WindDirection And
Speed
BRAV
OR
OAD
2M Station # 4
2M Station #5
Active FTIRSource
IR Camera's
2M Station #3
2M Station # 9(Actual Position @
5.6Km)
2M Station #6
2M Station #7
2M Station # 8(Actual Position @ 5.6 Km)
Additional 2M Stations will belocated @ Juilet and Center1.0 Miles E & WLima and Center 1.5 M E & WPapa and Center 2.0 M E & WTango and Center(Center refers to JSLSCADGrid Centerline)
Tethersonde100 Meters
1.25 KM
1.25 KM2M Station #1
SBIR FTIR
SBIR FTIR
SBIR FTIR
500M
500M
500M500M
50 M
50 M
50 M
100 M 1.5 KM
ROAD 945
JSLSCAD NO#2
EtyhernetEthernet
2 K
M L
ine
Rad
ial #
12 @
5KM
Lin
e
C
C
C
C
2M Station #62M Station #62M Station #6
JSLSCAD NO#1
1.5 KM
Scanning FTIR t, length, width, CIR Cameras t, L, W, heightLOS FTIR/Point t, CL, C, L GPS t, x, y, speed

DPG M&S Tools
Tracks the CB exposures of each entity Exposure Toxicity Server (ETS)
Performs “what if” analyses of stationary and mobile CB sensorsCB Analyzer
Provides the ability to playback entities, static entities, hazard boxes, hazard puffs, CB detonations, and CB tactical messagesPlayer
Globally relocatable mesoscale weather model with high-resolution forecast capability4-Dimensional Weather System (4DWX)
Simulation for creating a 3-D, time-varying, digital representation of the natural atmospheric environment
Ocean, Atmospheric, and Space Environment Server (OASES)
Reads vehicle speed and GPS location and translocates position onto desired terrainLive Vehicle Interface (LVI)
Physics based environment server used for hazard propagationNuclear, Chemical, Biological, and Radiological Environment Server (NCBR)
Simulation tool used to represent any general class of CB sensorsDial-A-Sensor (CB DAS)
2-D battlefield representation that allows for scenario generation and battlefield situational developmentOneSAF Testbed Baseline (OTB)
Displays situational awareness data (Force XXI Battle Command Brigade and Below (FBCB2)) and chemical hazard detection alarmsRole Player Workstation (RPWS)
2-D visualization of the battlefield terrain along with icons representing each entityMÄK Plan View Display (PVD)
3-D visualization application with 3-D entity model supportMÄK Stealth
VCR-like application that records and plays back all network trafficMÄK Data Logger
PurposeTool

Post-Test Data Analysis
0 50 100 150 200 250 300 350 400 450
180
200
220
240
260
280
300
320ATP006: Analyzer Azimuth Scan - Vehicle 2
Azim
uth
(deg
rees
)
Time (s)
Min. Hit Azimuth Max. Hit Azimuth Azimuth @ Max. CL Alarm Azimuth
0 50 100 150 200 250 300 350 400 450
0
2
4
6
8
10
ATP006: Analyzer Elevation Scan - Vehicle 2
Elev
atio
n (d
egre
es)
Time (s)
Min. Hit Elevation Max. Hit Elevation Elevation @ Max. CL Alarm Elevation
Measured distance through the hazardTimeDistance
Max/min elevation angles that hit the hazard
TimeElevation
Max/min azimuth angles that hit the hazard
TimeAzimuth
Elevation angles for max CL valuesTimeElevation
Azimuth angles for max CL valuesTimeAzimuth
Max detected CL valuesTimeMax CL
DescriptionAbscissaOrdinate
Analyzer Data Plots
CB Analyzer is a graphical post-test data analysis tool developed to provide:– Concentration– Target Location (azimuth,
elevation)– Ranging (distance to hazard)

Test Data Visualization
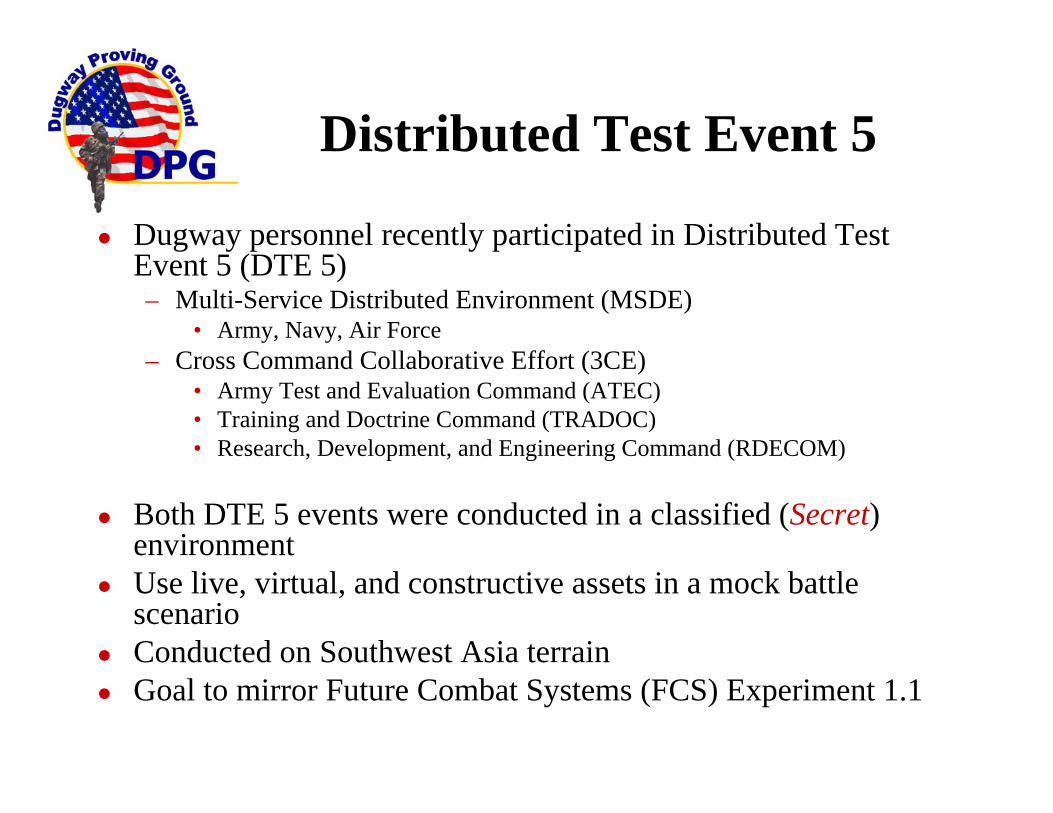
Distributed Test Event 5
Dugway personnel recently participated in Distributed Test Event 5 (DTE 5)– Multi-Service Distributed Environment (MSDE)
• Army, Navy, Air Force– Cross Command Collaborative Effort (3CE)
• Army Test and Evaluation Command (ATEC)• Training and Doctrine Command (TRADOC)• Research, Development, and Engineering Command (RDECOM)
Both DTE 5 events were conducted in a classified (Secret) environmentUse live, virtual, and constructive assets in a mock battle scenarioConducted on Southwest Asia terrainGoal to mirror Future Combat Systems (FCS) Experiment 1.1

a
JITC – Joint
NSWC Navy
NAVY - NSWC Dahlgren
NSWC – Dahlgren, VA
NAWCAD – Patuxent River, MD
SPAWAR – San Diego, CA
NAWCWD – China Lake, CA
AIR FORCE - DMOC
DMOC - Kirtland AFB, NM
SIMAF – Wright-Patterson AFB, OH
46thTW – Eglin AFB, FL
19 SOS - Hurlburt Field, FL
CAOC-X – Langley AFB, VA
CEIF – Hanscom AFB, MA
AFAMS-CVC – Pentagon
SWC – Los Angeles AFB, CA
SWC – Schriver AFB, CO ARMY - IRCC
WSTC - WSMR, NM
ATC / DTC - APG, MD
EPG / DPG - FT LEWIS, WA
EPG - FT HUACHUCA, AZ
RTTC/AMRDEC - Huntsville, AL
JPSD JPO / NVESD – FT Belvoir,, VA
DRENFull MeshDREN
Full Mesh
DMOC - AF
IRCC -Army
DTE 5: MSDE ParticipantsDTE 5: MSDE Participants

a
DTE 5: Army 3CE ParticipantsDTE 5: Army 3CE Participants
JPSD JPO / NVESD – FT Belvoir,, VA
ATC / HQ DTC - APG, MD
EPG / DPG - FT LEWIS, WA
EPG - FT HUACHUCA, AZ WSTC - WSMR, NM
ATIN Hub - IRCC
UAMBL – FT Knox, KY
RTTC/ATTC/AMRDEC - Huntsville, AL
BLCSE Hub – FT Gordon, GA
Classified DREN
Classified DREN
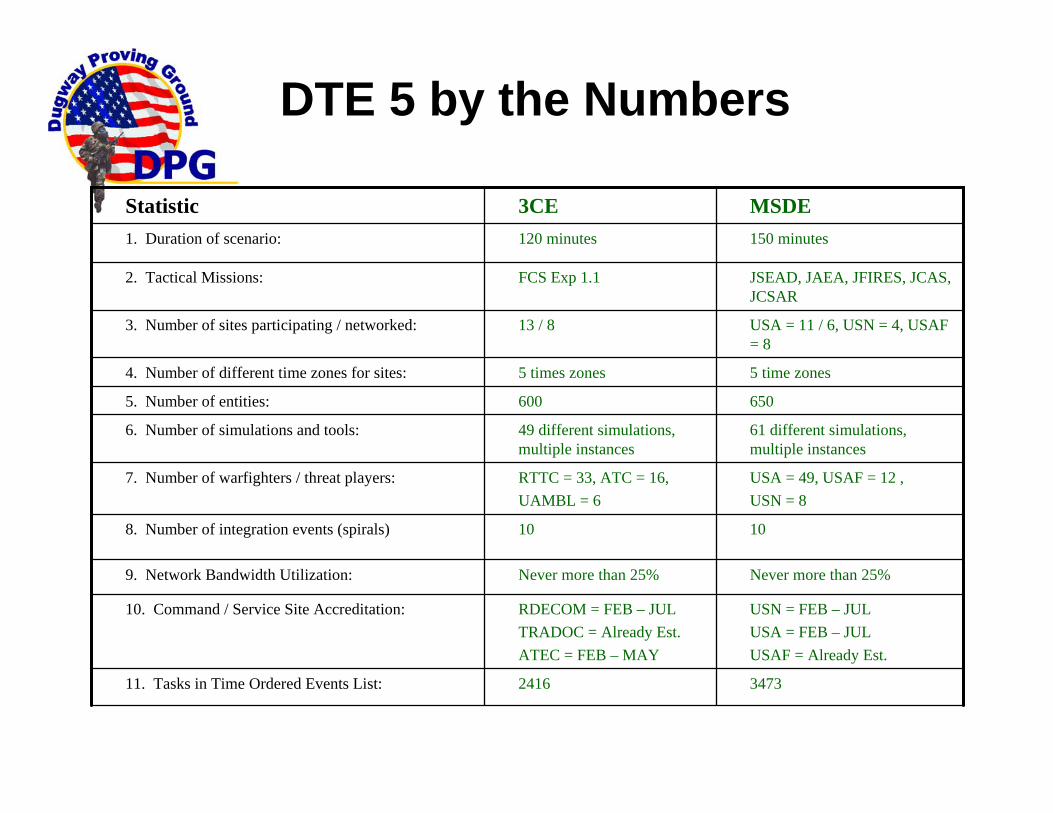
MSDE3CEStatistic
2416
RDECOM = FEB – JULTRADOC = Already Est.ATEC = FEB – MAY
Never more than 25%
10
RTTC = 33, ATC = 16,UAMBL = 6
49 different simulations, multiple instances
600
5 times zones
13 / 8
FCS Exp 1.1
120 minutes
JSEAD, JAEA, JFIRES, JCAS, JCSAR
2. Tactical Missions:
10 8. Number of integration events (spirals)
347311. Tasks in Time Ordered Events List:
6505. Number of entities:
USA = 11 / 6, USN = 4, USAF = 8
3. Number of sites participating / networked:
USN = FEB – JULUSA = FEB – JULUSAF = Already Est.
10. Command / Service Site Accreditation:
Never more than 25%9. Network Bandwidth Utilization:
USA = 49, USAF = 12 , USN = 8
7. Number of warfighters / threat players:
61 different simulations, multiple instances
6. Number of simulations and tools:
5 time zones4. Number of different time zones for sites:
150 minutes1. Duration of scenario:
DTE 5 by the Numbers
Dugway Roles in Distributed Testing
Provide simulated chemical agent releaseProvide weatherProvide agent propagation model– Subject to weather, terrain
Provide agent exposure monitoring– Who was exposed? When? How much? Status?
Provide virtual chemical agent sensors– 3 Joint Services Lightweight Standoff Chemical Agent
Sensors (JSLSCAD)– 3 ground deposition sensors
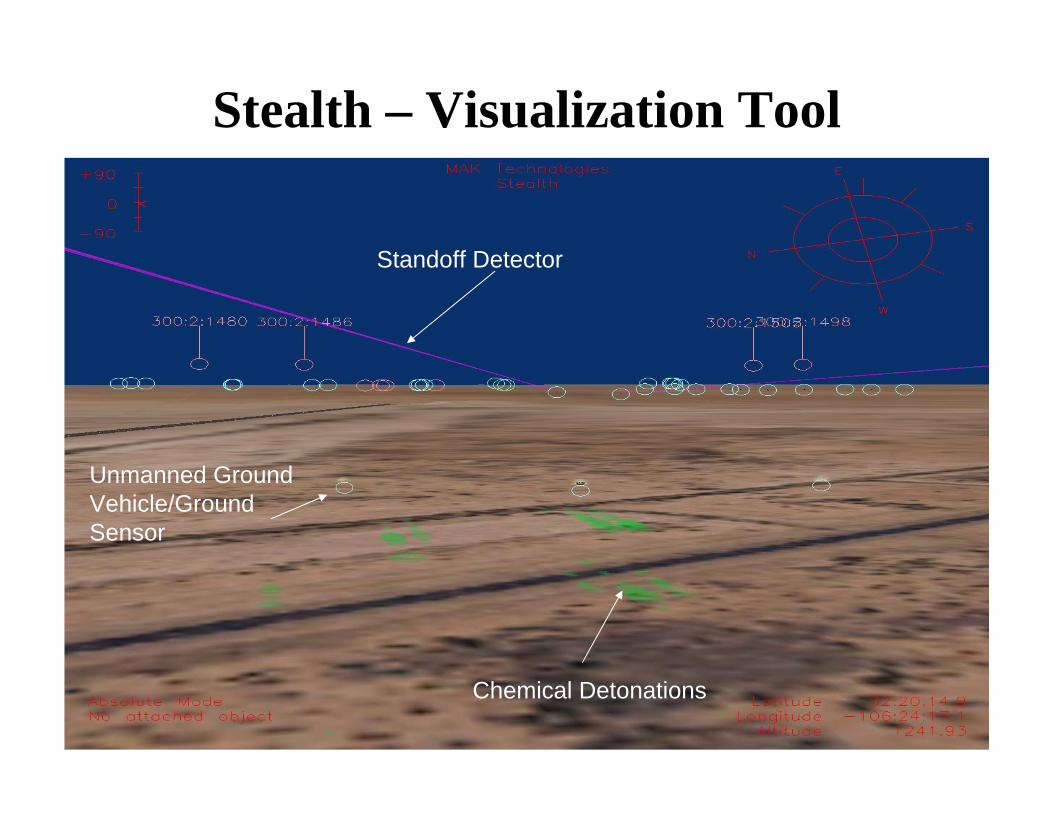
Stealth – Visualization Tool
Chemical Detonations
Standoff Detector
Unmanned Ground Vehicle/Ground Sensor
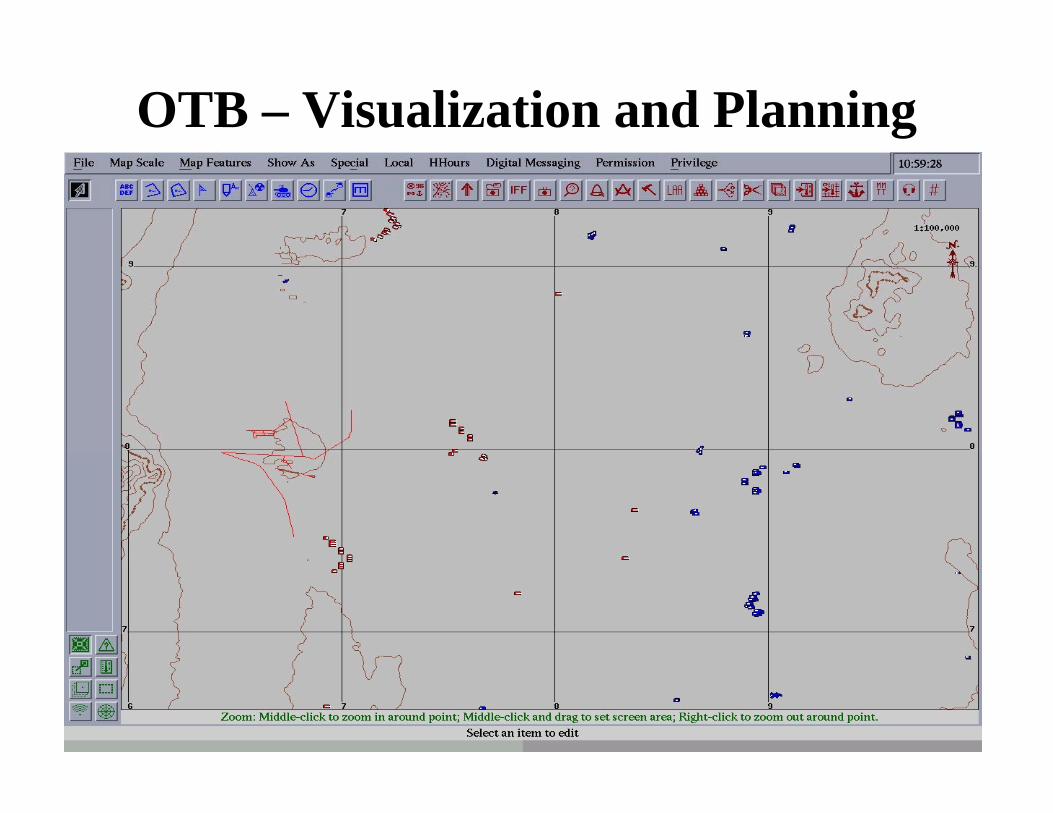
OTB – Visualization and Planning
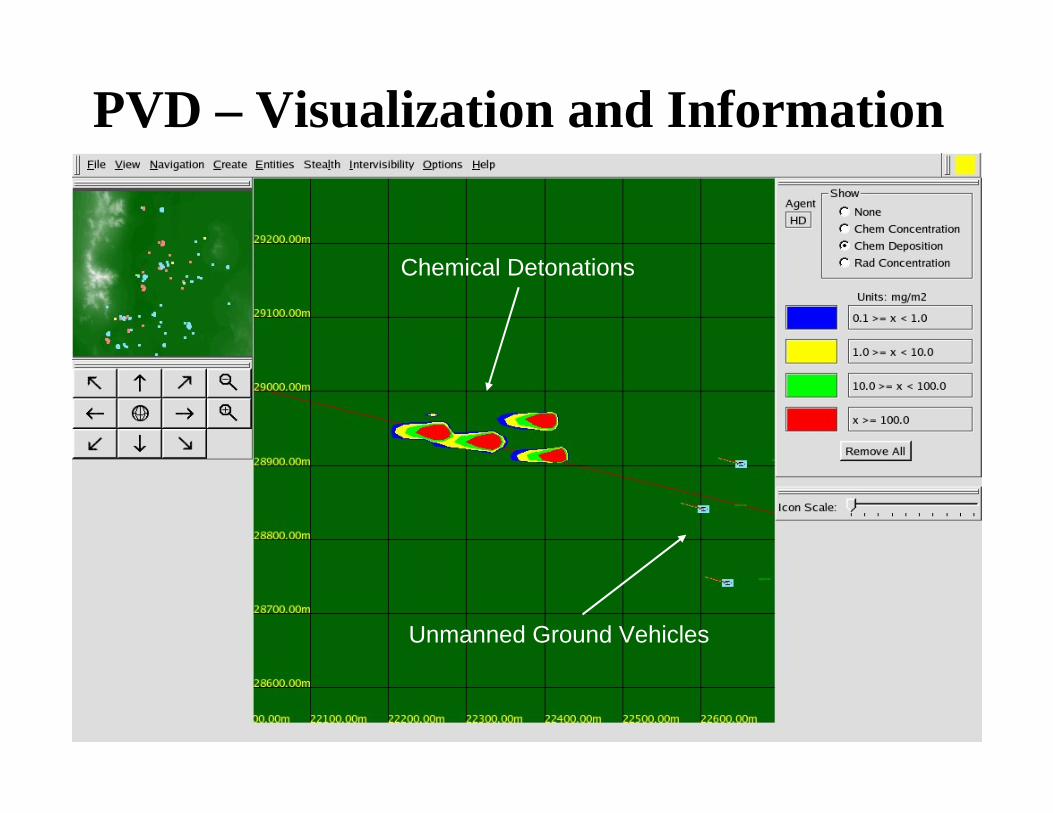
PVD – Visualization and Information
Unmanned Ground Vehicles
Chemical Detonations

RPWS—Situational Awareness
Vehicle 2
Vehicle 1
Vehicle 3

Future M&S Plans at DugwayContinue use of tools for post test data analysisSupport classified testingSupport future distributed test eventsDistribute live DPG test data to customers/othersBegin development of live (real-time) test data analysis– Stream live field data into Distributed Test Control
Center (DTCC)– Fusion of sensor data
Begin development of overarching protection models– Individual, Collective
Provide test support for Joint Warning and Reporting Network (JWARN)