Embed Size (px)
Citation preview
EUROPEAN JOURNAL OF MATERIALS SCIENCE AND ENGINEERING
Volume 6, Issue 1, 2021: 003-018 | www.ejmse.ro | ISSN: 2537-4338
DOI: 10.36868/ejmse.2021.06.01.003
*Corresponding author: [email protected], +2348038458613; [email protected]
MODELING AND SIMULATION OF WELDING TEMPERATURE
FIELDS IN Cr-Mo STEEL BAR
Reuben Adebare ADEWUYI 1*, Jacob Olayiwola AWEDA2
1Department of Mechanical Engineering, The Federal Polytechnic, Ado-Ekiti, Nigeria 2Department of Mechanical Engineering, University of Ilorin, Ilorin, Nigeria
Abstract
Simulation of welding temperature fields during TIG arc the welding process of Cr-Mo steel
bar (ASTM A304) was studied. The results of Simulation models of welding processes help to
predict welding parameters effects on the temperature field during and after welding and by
this, the failure rate could be estimated and minimized. This paper presents the welding profile
model, assembled from 100 mm by 50 mm by 20 mm thick, a Double-Sided Half V-Groove Weld
Joint, moving heat source was employed to methodically examine welding temperature fields
and transformation in the single-pass butt-welded joint. Unfortunately, the precision of the
model rests on many parameters, which cannot be precisely dictated. To resolve this
proposition, a calibration process was made by using a Datalogger type K thermocouple –
3 channel–LU-MTM-380SD during the welding process on Cr-Mo steel bar. The obtained
Experimental results were used as input to run the simulation. Depending on weld joint profile,
temperature fields were discovered to vary with distance from the weld centerline which altered
the yield stress of weld metal. To realize this goal, a pattern of the 3D model of heat transfer
with a moving heat source during welding was simulated in Autodesk Inventor Simulation CFD
2018 Application Software. The results shown that the welding temperature fields have a higher
value at the welding center line and decreased towards the edges of the bar. An indication that
simulation is a veritable tool to access likely consequence of the welding process at both welded
and non-welded portions of steel bar before real machine structural development.
Keywords: Weld joints, Yield stress, Temperature fields, and Simulation.
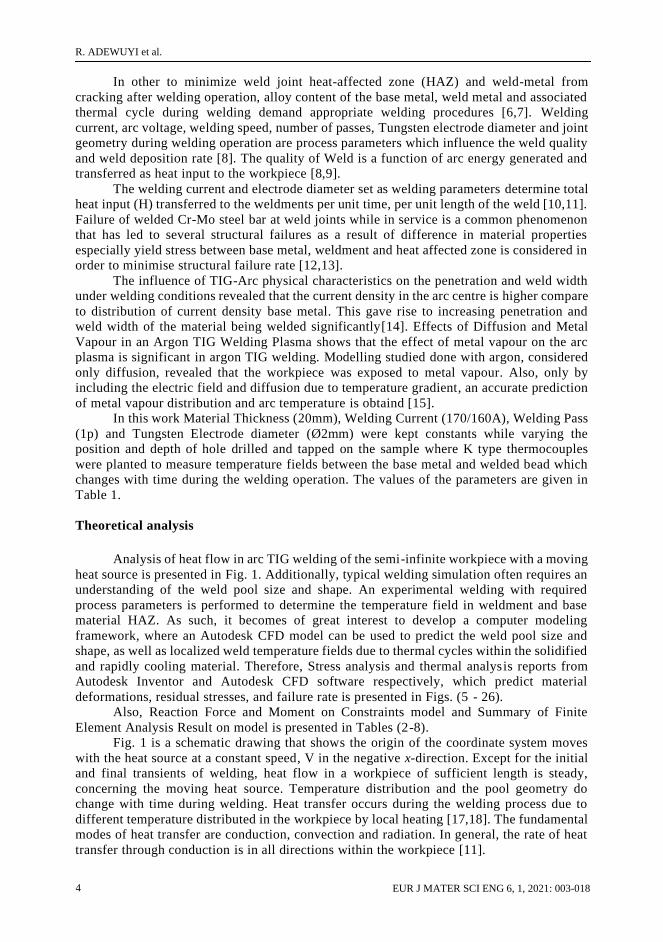
Introduction
Modeling and Simulation of weldment has advanced from the analysis of laboratory
processes to engineering prediction applications due to increase in failure rate. This trend is
observed and used to solve the increased complex models which gives a better description
of the engineering applications [1]. With or without the application of pressure and filler
material, welding as material joining process involves melting at high temperature the
sample’s weld centre line to suitable temperatures (melting and cooling processes) [2].
Applications of Chromium-Molybdenum (Cr-Mo) steels in various capacities such as oil
refineries, fertilizer plants, and power plants, at service temperature of up to 600°C and
pressure of 30MPa established its value [3]. Remarkable oxidation resistance, resistance to
sulfide corrosion and high-temperature strength, are good properties that distinguished Cr-
Mo from other low-alloy steels and are derived functions from chromium and molybdenum
alloying elements and they improve with the increase of alloying elements [4]. Tungsten
inert gas (TIG) welding, used to weld Cr-Mo steels, arc welding process that produces metal
joints by melting process, heating with an arc between a non-consumable electrode and the
base metal [4,5].
R. ADEWUYI et al.
EUR J MATER SCI ENG 6, 1, 2021: 003-018 4
In other to minimize weld joint heat-affected zone (HAZ) and weld-metal from
cracking after welding operation, alloy content of the base metal, weld metal and associated
thermal cycle during welding demand appropriate welding procedures [6,7]. Welding
current, arc voltage, welding speed, number of passes, Tungsten electrode diameter and joint
geometry during welding operation are process parameters which influence the weld quality
and weld deposition rate [8]. The quality of Weld is a function of arc energy generated and
transferred as heat input to the workpiece [8,9].
The welding current and electrode diameter set as welding parameters determine total
heat input (H) transferred to the weldments per unit time, per unit length of the weld [10,11].
Failure of welded Cr-Mo steel bar at weld joints while in service is a common phenomenon
that has led to several structural failures as a result of difference in material properties
especially yield stress between base metal, weldment and heat affected zone is considered in
order to minimise structural failure rate [12,13].
The influence of TIG-Arc physical characteristics on the penetration and weld width
under welding conditions revealed that the current density in the arc centre is higher compare
to distribution of current density base metal. This gave rise to increasing penetration and
weld width of the material being welded significantly[14]. Effects of Diffusion and Metal
Vapour in an Argon TIG Welding Plasma shows that the effect of metal vapour on the arc
plasma is significant in argon TIG welding. Modelling studied done with argon, considered
only diffusion, revealed that the workpiece was exposed to metal vapour. Also, only by
including the electric field and diffusion due to temperature gradient, an accurate prediction
of metal vapour distribution and arc temperature is obtaind [15].
In this work Material Thickness (20mm), Welding Current (170/160A), Welding Pass
(1p) and Tungsten Electrode diameter (Ø2mm) were kept constants while varying the
position and depth of hole drilled and tapped on the sample where K type thermocouples
were planted to measure temperature fields between the base metal and welded bead which
changes with time during the welding operation. The values of the parameters are given in
Table 1.
Theoretical analysis
Analysis of heat flow in arc TIG welding of the semi-infinite workpiece with a moving
heat source is presented in Fig. 1. Additionally, typical welding simulation often requires an
understanding of the weld pool size and shape. An experimental welding with required
process parameters is performed to determine the temperature field in weldment and base
material HAZ. As such, it becomes of great interest to develop a computer modeling
framework, where an Autodesk CFD model can be used to predict the weld pool size and
shape, as well as localized weld temperature fields due to thermal cycles within the solidified
and rapidly cooling material. Therefore, Stress analysis and thermal analysis reports from
Autodesk Inventor and Autodesk CFD software respectively, which predict material
deformations, residual stresses, and failure rate is presented in Figs. (5 - 26).
Also, Reaction Force and Moment on Constraints model and Summary of Finite
Element Analysis Result on model is presented in Tables (2-8).
Fig. 1 is a schematic drawing that shows the origin of the coordinate system moves
with the heat source at a constant speed, V in the negative x-direction. Except for the initial
and final transients of welding, heat flow in a workpiece of sufficient length is steady,
concerning the moving heat source. Temperature distribution and the pool geometry do
change with time during welding. Heat transfer occurs during the welding process due to
different temperature distributed in the workpiece by local heating [17,18]. The fundamental
modes of heat transfer are conduction, convection and radiation. In general, the rate of heat
transfer through conduction is in all directions within the workpiece [11].

MODELING AND SIMULATION OF WELDING TEMPERATURE FIELDS IN Cr-Mo STEEL BAR
http://www.ejmse.ro 5
Fig. 1. Two-dimensional heat flow during welding of the semi-infinite workpiece
Fig. 2. Weld design using Autodesk Inventor Professional Modeling Software: A = Normal force, B = Shear force,
C = Bending moment acting in the plane of welded parts, D = Bending moment acting in the plane perpendicular to the
plane of welded parts, E = Torque. Welding calculation generated from Autodesk Inventor Professional Modelling
Software
A three dimensional model designed using Autodesk Inventor Professional Modeling
Software. One welding profile was assembled for study from 100 mm by 50 mm by 20 mm thick,
shown in Fig. 3.
Fig. 3. A three-dimensional model

R. ADEWUYI et al.
EUR J MATER SCI ENG 6, 1, 2021: 003-018 6
Experimental Procedure
Before welding operation the edges of both components are double beveled so that in
cross-section, the fusion faces form two opposing V’s as shown in Fig. 3. Welding procedure and
arrangement of the thermocouple at different distances away from the weld centreline, during
experimental processes, is presented in Plate 1. TIG welding parameters considered were Material
Thickness (20 mm), Welding Current (170/160A), Welding Pass (1p) and Tungsten Electrode
diameter (Ø2 mm). Three holes of Ø5.0 mm were drilled and tapped on the sample where K type
thermocouples were planted to measure temperature fields between the base metal and welded
bead which changes with time during the welding operation
Fig. 4. Specimen shown arrangement of the thermocouple
at different distances away from the weld centerline
Simulation Procedure and Surface Boundary Conditions/Assumptions
Autodesk Active model in Autodesk inventor was imported into Autodesk Simulation CPD to
study the temperature fields in the weld metal and base metal. The assembled specimens was simulated
using Autodesk Inventor Simulation CFD 2018 Application Software which exposed temperature
fields on Heat Affected Zone and weld metal Cr-Mo steel bar shown in Figs. (5-6).
On the toolbar, the following parameters were set; select material/set to solid/Cr-Mo steel.
Scenario Environment /Ambient temperature–Pressure -1atm., Temp.-27 oC.
Material property settings – Cr-Mo steel bar.
Boundary Conditions temperature setting –Welding bead temperature set to 429.8oC from
experimental result.
Initial Conditions-Base metal temperature set to 27oC.
Heat transfer-Steady state, number of Iterations-0-10.
Surface-based heat transfer boundary conditions represent either a known physical state,
such as temperature, or an amount of heat entering or leaving the weld metal, such as a heat flux.
Temperature is the only condition that can be applied to openings and wall surfaces and others
only to wall surfaces [15,16].
Results and discussion
Experimental results
Temperature fields from the arrangement of the thermocouple at different distances away
from the weld centreline against time are presented in Fig. 5.
T2, at 14mm depth, 10mm away from
weld centre line.
T3, at 18mm depth, 12mm away from
weld centre line.
T1, at 8mm depth, 8mm away from
weld centre line.

MODELING AND SIMULATION OF WELDING TEMPERATURE FIELDS IN Cr-Mo STEEL BAR
http://www.ejmse.ro 7
Temperature fields in Cr-Mo steel bar (100x100x20mm) during TIG welding operation
on the Double Sided Half V-Groove Weld Joint.
Table 1. TIG Welding process parameters
Fig. 5. Temperature fields in Cr-Mo steel bar (100 x 100 x 20 mm) during TIG welding operation
In Fig. 5 measured temperature profiles are shown during the welding experiment. The
highest experimentally obtained temperature is at the peak value of the curve closest to the weld
centre (8 mm). Also, it could be deduced that Temperature fields effect reduced away from the
weld centreline. Temperature field at T1, 8mm depth, 8mm away from weld centre line is at its
peak 429.8oC which is the highest and this followed by temperature field at T2, 14mm depth,
10mm away from weld centre line 380.6 °C and the least which is at T3, 18mm depth, 12mm
away from weld centre line 293.9 oC.
Simulation results
The thermal simulation (temperature fields) on Cr-Mo steel using Autodesk Inventor
Simulation Computational fluid dynamics (CFD) 2018 Application Software shown in Figs. (6-
7) revealed how the temperature fields change with time. The Reddish area of the weld zone in
Fig. 6 changes towards the edges of the bar. This information is use to study thermal stresses
experienced within the grains which leads to failure.
A heat-affected zone (HAZ) is the part of the weldment that was not liquified during the
welding operation, but whose grain structure and elemental properties were altered at elevated
temperature within the weld metal. This alteration in grain structure and elemental properties
leads to stresses that reduce the strength of the weld metal, and eventually causes catastrophic
failures.
Machine Setting/Weld Parameters
Material Thickness (mm) 20 mm
Welding Current (A) 170/160A (A)
Number of passes 1
Electrode diameter (Ø mm) 2.0 mm

R. ADEWUYI et al.
EUR J MATER SCI ENG 6, 1, 2021: 003-018 8
Furthermore, difficult positioning welding principles and practices such as overhead and
vertical welding (1G-6G, 1F-4F) are also factors that determine the temperature fields in weld
joints which leads to failure while in service, if the joint between fusion zone and weld centerline
is eroded (Fig. 1).
Fig. 6. Temperature distribution simulated result from the model in the welding plane

MODELING AND SIMULATION OF WELDING TEMPERATURE FIELDS IN Cr-Mo STEEL BAR
http://www.ejmse.ro 9
Fig. 7. Temperature distribution field in Simulated models
Stress analysis report from Autodesk Inventor
These are the analyses of the various stresses acting on the X, Y, and Z-axes model. The
analyses were to use the components of the maximum and minimum values of stress derivable to
determine the safety factor.
The Finite Element Analyses (FEA) results for the X, Y, and Z-axes model are shown in
Tables (1-8).
Table 2. Physical properties of the weld specimen
Name Value
Mass 0.216747 kg
Area 37133.2 mm2
Volume 199747 mm3
Center of Gravity X = -288.794 mm
Y= 19.7698 mm
Z = 197.596 mm
Table 3. Material properties of the weld specimen
Name Property Stainless Steel (ASTM A304))
General Mass Density 8 g/cm3
Yield Strength 250 MPa
Ultimate Tensile Strength 540 MPa
Stress Young's Modulus 193 GPa
Poisson's Ratio 0.3 ul
Shear Modulus 74.2308 GPa
Table 4. Operating conditions force 1 on weld specimen
Load Type Force
Magnitude 1000.000 N
Vector X 1000.000 N
Vector Y -0.000 N
Vector Z 0.000 N

R. ADEWUYI et al.
EUR J MATER SCI ENG 6, 1, 2021: 003-018 10
Fig. 8. Operating conditions force 1 on weld specimen Selected Face(s)
Table 5. Operating conditions force 2 on weld specimen
Load Type Force
Magnitude 1000.000 N
Vector X -1000.000 N
Vector Y -0.000 N
Vector Z 0.000 N
Fig. 9. Operating conditions force 2 on weld specimen Selected Face(s)
Table 6. Operating conditions pressure 1 on weld specimen
Load Type Pressure
Magnitude 200.000 MPa
Table 7. Operating Conditions Pressure 2 on model
Load Type Force
Magnitude 200.000 MPa

MODELING AND SIMULATION OF WELDING TEMPERATURE FIELDS IN Cr-Mo STEEL BAR
http://www.ejmse.ro 11
Fig. 10. Operating conditions pressure 1 on weld specimen Selected Face(s)
Fig. 11. Operating conditions pressure 2 on weld specimen Selected Face(s)
Table 8. Reaction force and moment on constraints model
Constraint Name Reaction Force
Reaction Moment
Magnitude Component (X,Y,Z) Magnitude Component (X,Y,Z)
Fixed Constraint:1 10606.5 N
0 N
49394 N m
-49394 N m
0 N 0 N m
-10606.5 N 0 N m
Table 9. Summary of Finite Element Analysis Result for model
Name Minimum Maximum
Volume 199747 mm3
Mass 0.216747kg
Von Mises Stress 31.0058 MPa 17129.1 MPa
1st Principal Stress -3692.54 MPa 23603.8 MPa
3rd Principal Stress -13330.8 MPa 4950.13 MPa
Displacement 0 mm 5.64764 mm
Safety Factor 0.014595 ul 8.06301 ul
Stress XX -5112.61 MPa 8569.7 MPa
Stress XY -2765.44 MPa 2327.65 MPa
Stress XZ -1489.08 MPa 3508.27 MPa
Stress YY -5739.38 MPa 13924.7 MPa
Stress YZ -5633.25 MPa 8295.25 MPa

R. ADEWUYI et al.
EUR J MATER SCI ENG 6, 1, 2021: 003-018 12
Name Minimum Maximum
Stress ZZ -11416.4 MPa 18906.5 MPa
X Displacement -0.0552787 mm 0.0670591 mm
Y Displacement -0.269111 mm 2.00457 mm
Z Displacement -5.29257 mm 5.23562 mm
Equivalent Strain 0.000148084 ul 0.0850456 ul
1st Principal Strain -0.000331474 ul 0.101266 ul
3rd Principal Strain -0.0562173 ul -0.0000757935 ul
Strain XX -0.0107637 ul 0.0115726 ul
Strain XY -0.0186273 ul 0.0156785 ul
Strain XZ -0.0100301 ul 0.0236309 ul
Strain YY -0.0286534 ul 0.0517444 ul
Strain YZ -0.0346116 ul 0.0558748 ul
Strain ZZ -0.0449105 ul 0.0696261 ul
Contact Pressure 0 MPa 20510 MPa
Contact Pressure X -7598.77 MPa 4276.95 MPa
Contact Pressure Y -7937.96 MPa 4081.27 MPa
Contact Pressure Z -17787.5 MPa 17067.5 MPa
Fig. 12. Von Mises stress on weld specimen Fig.13. 1st principal stress on weld specimen

MODELING AND SIMULATION OF WELDING TEMPERATURE FIELDS IN Cr-Mo STEEL BAR
http://www.ejmse.ro 13
Fig. 14. 3rd Principal Stress on Weld Specimen Fig. 15. Displacement on Weld Specimen
Fig. 16. Safety Factor on Weld Specimen Fig. 17. Stress on XX Section

R. ADEWUYI et al.
EUR J MATER SCI ENG 6, 1, 2021: 003-018 14
Fig. 18. Stress on XY Section Fig. 19. Stress on XZ Section
Fig. 20. Stress on YY Section Fig. 21. Stress on YZ Section

MODELING AND SIMULATION OF WELDING TEMPERATURE FIELDS IN Cr-Mo STEEL BAR
http://www.ejmse.ro 15
Fig. 22. Stress on ZZ Section Fig. 23. Equivalent Strain
Fig. 24. Contact Pressure Fig. 25. Contact Pressure X

R. ADEWUYI et al.
EUR J MATER SCI ENG 6, 1, 2021: 003-018 16
Fig. 26. Contact Pressure Y Fig. 27. Contact Pressure Z
Conclusions
It has been established that the application of Autodesk Inventor and Autodesk CFD if
adopted for analysis of thermal cycle and predictions of component failure after welding
operation. The following conclusions can be drawn:
Simulating welding temperature fields during and after welding operation, will be useful
to predict or assess thermal stresses which may lead to failure on time.
Autodesk CFD methods reveal with reasonable accuracy the temperature fields within the
weld pool and weldment and solved finite element analysis is only as good as the underlying data
and assumptions.
Under complex loading from the results of uniaxial tensile tests, the Finite Element
Analysis result for model revealed the likely failure while the material in use.
References
[1] Mehran G., Joseph A., Juho M., Timo B., Jari L. Finite element simulation of welding
distortions in ultra-high strength steel S960 MC including comprehensive thermal and solid-
state phase transformation models, Elsevier Engineering Structures 219, 2020, 110804,
DOI: 10.1016/j.engstruct.2020.110804
[2] Kumar, H. CFD Simulation of Velocity and Temperature Distribution inside Refrigerator
Compartment, International Journal of Engineering and Advanced Technology
(IJEAT), 6, 2019, pp. 4199–4207

MODELING AND SIMULATION OF WELDING TEMPERATURE FIELDS IN Cr-Mo STEEL BAR
http://www.ejmse.ro 17
[3] Xiang, J., Chen, F. F., Park, H., & Murphy, A. B. Effects of Diffusion of Metal Vapour in an
Argon TIG Welding Plasma, 13th International Conference on CFD in the Minerals and
Process Industries, Melbourne, Australia, 2019
[4] Rocha, E. J. F., De Sousa Antonino, T., Guimarães, P. B., Ferreira, R. A. S., Barbosa, J. M.
A., Rohatgi, J. Modeling of the temperature field generated by the deposition of weld bead
on a steel butt joint by FEM techniques and thermographic images, Materials Research,
21(3), 2018, DOI: 10.1590/1980-5373-MR-2016-0796
[5] Islam, M., Buijk, A., Rais-Rohani, M., Motoyama, K. Simulation-based numerical
optimization of arc welding process for reduced distortion in welded structures, Elsevier
B.V.Science Direct Finite Elements in Analysis and Design, 84, 2014, pp.54–64
[6] XiaoweiPu, Chaohua Zhang., Suo Li1., Dean Deng. Simulating welding residual stress and
deformation in a multi-pass butt-welded joint considering balance between computing time
and prediction accuracy, International Journal of Advanced Manufacturing
Technology, 93, 2017, pp.2215–2226
[7] Sun J, Deng D, Ye Y, He J, Xia L. Numerical simulation of welding residual stress in a
multi-pass T-joint of thick Q390 high strength steel plate using an instantaneous heat source,
Trans Chin Weld Inst., 37(7), 2016, pp.31–34 38
[8] Adewuyi, R.A., and Shuaib-Babata, Y. L. Simulation of Heat Affected Zone (HAZ)in Multi-
Pass Welds in Low Carbon Steel, Proceedings of the 10th National Engineering Forum of
School of Engineering, The Federal Polytechnic, Ado-Ekiti, 2, 2015, pp.77-83
[9] Shuaib-Babata, Y.L., Adewuyi, R.A. Effects of Thermal Treatment Processes (TTP) on the
Tensile Properties of 0.165% Carbon Steel,' FUOYE Journal of Engineering and
Technology, 1(1), 2016, pp.15-19
[10] Shuaib-Babata, Y. L., Adewuyi, R.A., Aweda, J. O. Effects of Thermal Treatment Processes
(TTP) on some of the Mechanical Properties of welded 0.165% Carbon Steel, Journal of
Production Engineering, (JPE), 20(1), 2017, pp.101-111
[11] Adewuyi, R.A., Elegbeleye, K.E. Impact of Post-Weld Heat Treatment (PWHT) on the
Hardness and Microstructure of Low Carbon Steel. International Journal of Innovative
Science, Engineering & Technology, 3(11), 2016, pp.16-26
[12] Chen, B.Q., Soares, C.G. Effect of welding sequence on temperature distribution, distortions,
and residual stress on stiffened plates, Int J AdvManufTechnol, 86, 2016, pp.3145–3156
[13] Nezamdost, M.R., Esfahani, M.R.N., Hashemi, S.H., Mirbozorgi, S.A. Investigation of
temperature and residual stresses field of submerged arc welding by finite element method
and experiments,' Int J AdvManuf Technol., 87, 2016, pp.615–624
[14] Rajput, E. Heat-and-mass-transfer. (5th, Ed.) New Delhi: S. Chand & Company Ltd., 2012
Experimental Analysis on TIG welding process parameters of dissimilar metals SS304-
SS202 using the Taguchi Method. International Journal of Engineering and
Manufacturing Science, 7 , 2017, pp. 249-258
[15] Hongbin, D., Xiuqiang, S., & Haoran, W. The influence of TIG-Arc physical characteristics
on the penetration and weld width under different Ar and He supply conditions, Results in
Physics, 9, 2018, pp.1120-1126
[16] Xiaowei, P., Zhang, C., SuoLi, & Deng, D. Simulating welding residual stress and
deformation in a multi-pass butt-welded joint considering balance between computing time
and prediction accuracy, The International Journal of Advanced Manufacturing
Technology, 2017, DOI: 10.1007/s00170-017-0691-5

R. ADEWUYI et al.
EUR J MATER SCI ENG 6, 1, 2021: 003-018 18
[17] Park, H. K.,Trautmann, M., Tanaka, K., Tanaka, M., Murphy,A. B. Mixing of multiple metal
vapours into an arc plasma in gas tungsten arc welding of stainless steel, Journal of Physics
D: Applied Physics, 50(43), 2017, 43LT03
[18] Lundbäck, A. Modelling and Simulation of Welding and Metal Deposition, Luleå University
of Technology Department of Applied Physics and Mechanical Engineering Division of
Computer Aided Design 2010
________________
Received: December 04, 2020
Accepted: January 21, 2021