Embed Size (px)
Citation preview
This article was downloaded by: [UQ Library]On: 11 November 2014, At: 22:26Publisher: Taylor & FrancisInforma Ltd Registered in England and Wales Registered Number: 1072954 Registered office: Mortimer House,37-41 Mortimer Street, London W1T 3JH, UK
Fuel Science and Technology InternationalPublication details, including instructions for authors and subscription information:http://www.tandfonline.com/loi/lpet19
MODELING AND SIMULATION OF SPARK IGNITIONENGINESYousef S.H. Najjar a & Abdullah M. Alturki aa Mechanical Engineering Department (Thermal) , King Abdulaziz University , Jeddah , S.APublished online: 25 Apr 2007.
To cite this article: Yousef S.H. Najjar & Abdullah M. Alturki (1996) MODELING AND SIMULATION OF SPARK IGNITION ENGINES,Fuel Science and Technology International, 14:8, 993-1018, DOI: 10.1080/08843759608947625
To link to this article: http://dx.doi.org/10.1080/08843759608947625
PLEASE SCROLL DOWN FOR ARTICLE
Taylor & Francis makes every effort to ensure the accuracy of all the information (the “Content”) containedin the publications on our platform. However, Taylor & Francis, our agents, and our licensors make norepresentations or warranties whatsoever as to the accuracy, completeness, or suitability for any purpose of theContent. Any opinions and views expressed in this publication are the opinions and views of the authors, andare not the views of or endorsed by Taylor & Francis. The accuracy of the Content should not be relied upon andshould be independently verified with primary sources of information. Taylor and Francis shall not be liable forany losses, actions, claims, proceedings, demands, costs, expenses, damages, and other liabilities whatsoeveror howsoever caused arising directly or indirectly in connection with, in relation to or arising out of the use of theContent.
This article may be used for research, teaching, and private study purposes. Any substantial or systematicreproduction, redistribution, reselling, loan, sub-licensing, systematic supply, or distribution in anyform to anyone is expressly forbidden. Terms & Conditions of access and use can be found at http://www.tandfonline.com/page/terms-and-conditions
FUEL SCIENCE & TECHNOLOGY INT'L., 14(8),993-1018 (1996)
MODELING AND SIMULATION OF SPARK IGNITION
ENGINES
Yousef S.H. Najjar and Abdullah M, Alturki
Mechanical Engineering Department (Thermal)
King Abdulaziz University, jeddan, SA
ABSTRACT
Modeling is important because it saves time, effort and cost needed for
engine development and prediction of performance, In this work, losses
due to imperfect construction oi the real engine, including progressive
combustion, valve timing and heat transfer have been modeled besides
engine friction. Hence, it becomes possible to convert the output of the
fuel-air cycle into net brake performance. Simulation of engine
performance was carried out by varying engine speed, compression ratio
and spark advance over wide range. Hence, it was possible to compare
the results with those from experiments on a single cylinder engine.
993
Copyright Cl:> 1996 by Marcel Dekker, Inc.
Dow
nloa
ded
by [
UQ
Lib
rary
] at
22:
26 1
1 N
ovem
ber
2014
994 NAJJAR AND ALTURKI
The model predictions were found to compare favourably with
experiment within 4.6% in power and 2.9% in SFC. The losses considered
in this work amount to about 14% of the fuel energy input.
INTRODUCTION
The best way to develop the techniques to enhance performance in
internal combustion engines, is to understand how to decrease losses.
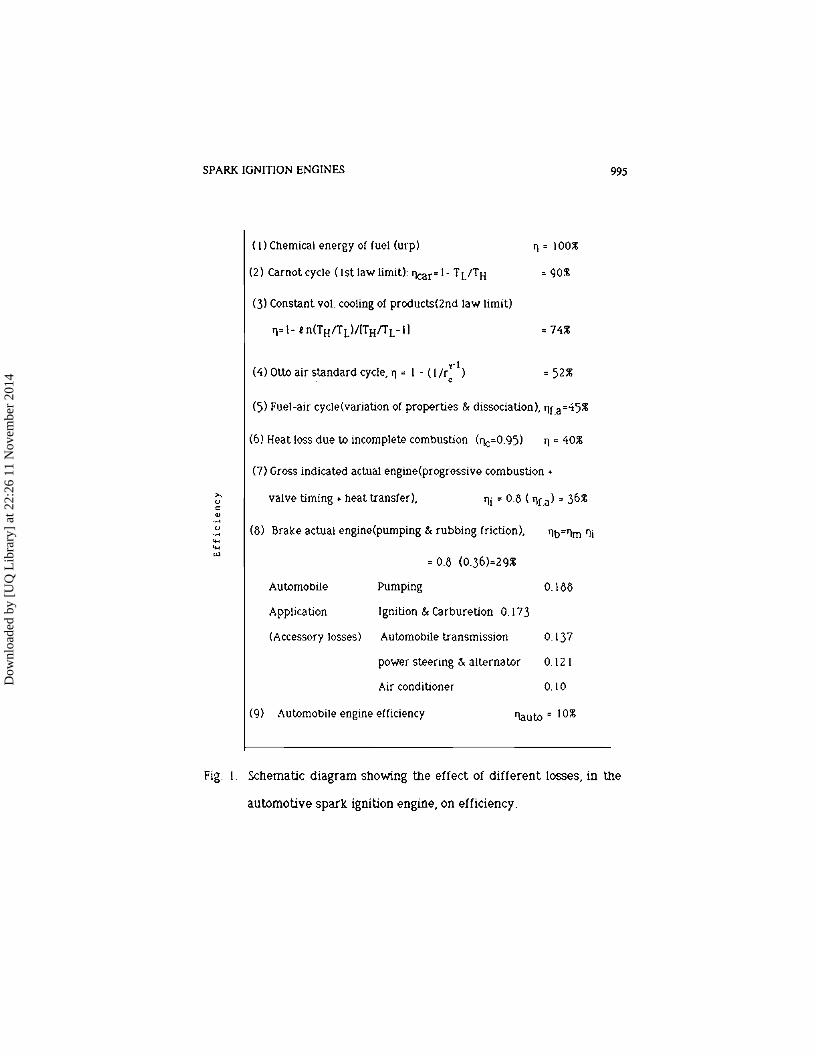
Figure 1 shows a schematic diagram which explains why all the fuel
energy was not converted to work. The magnitude of some losses varies
with load or speed [11. Some of the losses would be different in
magnitude, for example, a rnulticytinder or a turbocharged engine; where
friction would be lower and fuel economy better, [21. There is some
arbitrariness in assigning losses, so the magnitudes shown in Fig. I should
not be taken very precisely. However, it suggests where the losses are
and Where effort should be exerted to improve the performance of the
engine.
Except the brake work, all other availability terms represent losses or
undesirable transfers from the system; hence decreasing terms
constitutes an improvement. These undesirable available energy transfer
and destruction terms fall into five categories [31: (I) combustion (2) heat
transfer, (3) exhaust to ambient, (4) fluid flow, (5) mechanical friction.
The combustion and exnaust losses are present in the ideal cycle models,
however, they are smaller than in the real engine [4J. The loss in
Dow
nloa
ded
by [
UQ
Lib
rary
] at
22:
26 1
1 N
ovem
ber
2014
SPARK IGNITION ENGINES
(1) Chemical energy of fuel (urp)
(2) Carnotcycle (Ist law limit): 'lear=1-TLITH
(3) Constantvol.cooling of productstznd law limit)
y-l(4) Ottoair standard cycle, '1 = I - (I/r )
. c
'1 = 100:l;
=74:l;
=52%
995
(5) Fuel-air cycletvariauon of properties & dissociation), '1La =45%
(6) Heat loss due to incomplete combustion ('1c=0.95) '1 = 40%
(7) Gross indicated actual enginetprogrossive combustion +
'Ii =08 ( '1La) = 36%s-,uc
".~u.~......"'
valve timing + heat transfer),
(8) Brake actual engine(pumping & rubbing friction), '1b='1m 'Ii
Automobile
Application
pumping
Ignition & Carburetion 0.173
0.188
(Accessory losses) Automobile transmission 0.137
power steering & alternator 0.12 I
Air conditioner O. 10
(9) Automobile engine efficiency 'Iauto = 10%
Fig. L Schematic diagram showing the effect of different losses, in the
automotive spark ignition engine, on efficiency.
Dow
nloa
ded
by [
UQ
Lib
rary
] at
22:
26 1
1 N
ovem
ber
2014
996 NAJJAR AND ALTURKI
availability due to heat transfer, fluid flow, and mechanical friction are
real engine effects.
Refering to Fig. I the maximum output theoretically obtainable from a
certain quantity of fuel is approximately equal to the mechanical
equivalent of the internal energy of reaction urp hence efficiency would
be 100%, shown by level I. Assuming ambient temperature Ta = 300K
and the cornbuston temperature TH = 2900K, according to first law
analysis a completely reversible heat engine would produce theoretically
Carnot efficiency 'lear = 0.9, shown by level 2. According to the second
law analysis, the maximum amount of heat ranster that can be converted
to useful work is relatively less, hence the best we can hope to obtain
from constant volume cooling of combustion products is T)th = I - .tn
(TH/TL)/[(TH/TL)-I]=0.74 of the energy released by combustion 151. This
. is the upper limit set by the second law, as shown by level 3.
This second law efficiency could be obtained by using large number of
reversible infinitesimal engines. Hence, a more realistic cycle would be
. . r 1 . ..like the Otto cycle WIth T) = l-l/r . For typical compression ratios
Otto c
this comes to about 052 (level 4) assuming the working fluid as air with
constant thermodynamic properties whereas the processes are isentropic
Dow
nloa
ded
by [
UQ
Lib
rary
] at
22:
26 1
1 N
ovem
ber
2014
SPARK IGNITION ENGINES 997
compression and expansion and constant volume heat addition and
rejection. The value of such a cycle is to enable examining qualitatively
the influence of a number of variables on performance, because the
results differ a great deal from those of the actual engine. A more
convenient approximation to the real engine is the fuel-air cycle where
the reactants are assumed frozen during compression, wIlereas
combustion is complete witn T\c = 100% and products are in equilibrium.
Hence variation of specific heat and dissociation are taken into
consideration, however, the processes remain ideal. Typical efficiency of
such an ideal engine is about 0.45, as shown by level 5. Thus the losses
which can be ascribed to engine cycle amount to about 55% of urp. Most
of these losses are due to the irreversible combustion process, incomplete
expansion to ambient pressure and sensible exhaust heat [61.
Incomplete combustion causes thermal energy release to be less than the
chemical energy of the fuel hence, with combustion efficiency T\c = 0.95,
'"I = 0.4 as shown by level 6. This incomplete combustion results in the
formation of CO and UHC as pollutants. Imperfect construction of the
real engine including finite combustion rates, valve timing and throttling,
heat transfer to cylinder walls, and incomplete combustion, produce some
reduction from the ideal engine, represented by the fuel-air cycles about
20% [7] leaving the real engine with a gross indicated efficiency '"Ii = 036
Dow
nloa
ded
by [
UQ
Lib
rary
] at
22:
26 1
1 N
ovem
ber
2014
998 NAJJAR AND ALTURKI
as shown by level 7. If the pumping and rubbing friction losses are
estimated by a mechanical efficiency of 30% then the brake efficiency flb
= 'li 'lm = 029 (level 13). The losses forming the difference between the
ideal engine and the actual measured values form the main SUbject of
investigation in this work. Tocomplete the picture, if the gasoline engine
is considered for automotive applications, the engine is grossly inefficient.
Only about 10% of the auto's energy input reaches the drive axle as
useful work. The accessory losses include pumping, ignition and
carburetion, automatic transmission, power steering and alternator, and
air conditioner [81, leaving final efficiency about 10% as shown by level 9.
EXPERIMENTAL FACILITY
A variable compression engine test rig was utilized in this work. The
engine is a single cylinder, four-stroke, water -cooled gasoline engine
which can be run on diesel The compression ratio can 00 varied between
S and I(\ by sliding the cylinder head in and out; the ignition timing can
be set between 300 and 10° BTDC. Displacement volume is 532 em3,
bore = 95 rnm. stroke = 32 mrn. length of the connecting rod = ISS mm,
port diameter is 30mm for both inlet and exhaust valves. Valve timing
is: ['10 344°, rvc 216°, EVO 144°, EVe = 16°. The rig comprises
instruments Which provide direct readout of brake power; torque; fuel,
air and coolant consumption or flow rate; besides exhaust and coolant
temperatures.
Dow
nloa
ded
by [
UQ
Lib
rary
] at
22:
26 1
1 N
ovem
ber
2014
SPARK IGNITION ENGINES 999
The results either measued or calculated are tne brake power, air-fuel
ratio, specific fuel consumption, thermal efficiency, and exnaust
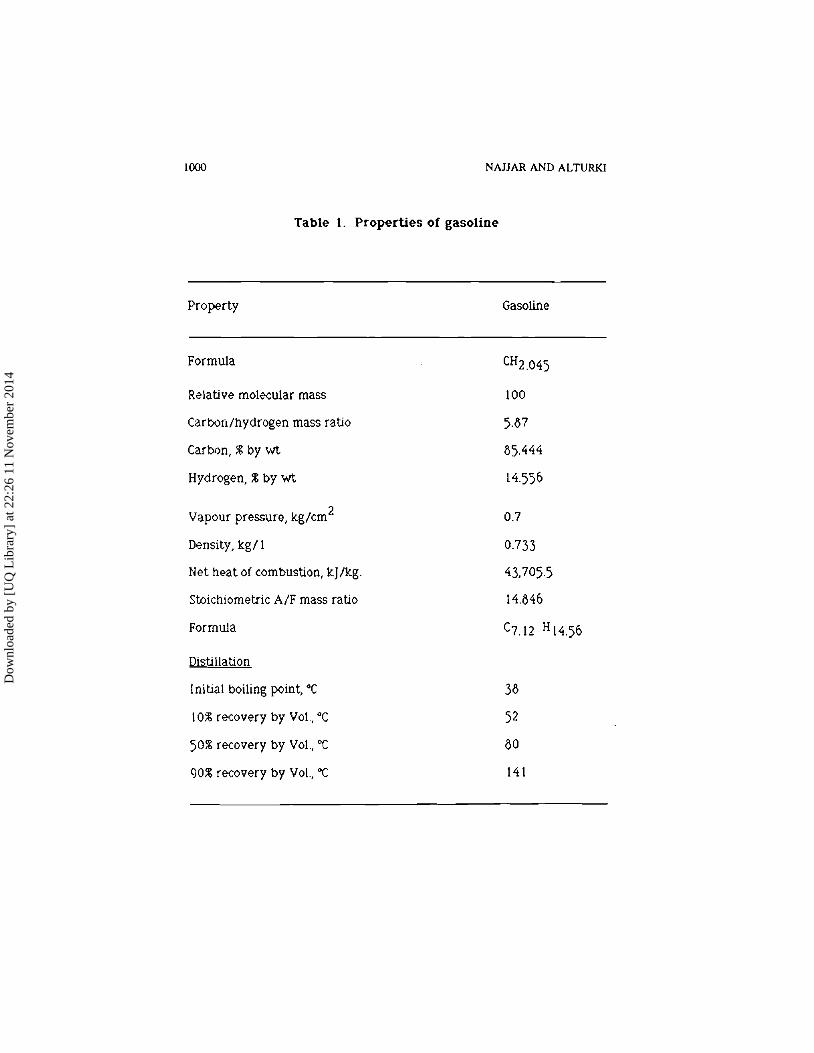
temperature. The properties of tlle fuel used is shown in table I.
MODELING AND SIMULATION
The ideal model used in this work is based on that of campell IS!.
However for the purpose of this work some modifications were done
namely fuel, compression ratio,spark advance,air mass fiw rate and heat
of reaction. In this ideal gas model, variation of thermodynamic
properties witll temperature for both reactants and products is
considered. Approximations are assumed to fit limited equilibrium
products to save computation time. Furthermore, compression and
expansion processesare isentropic.
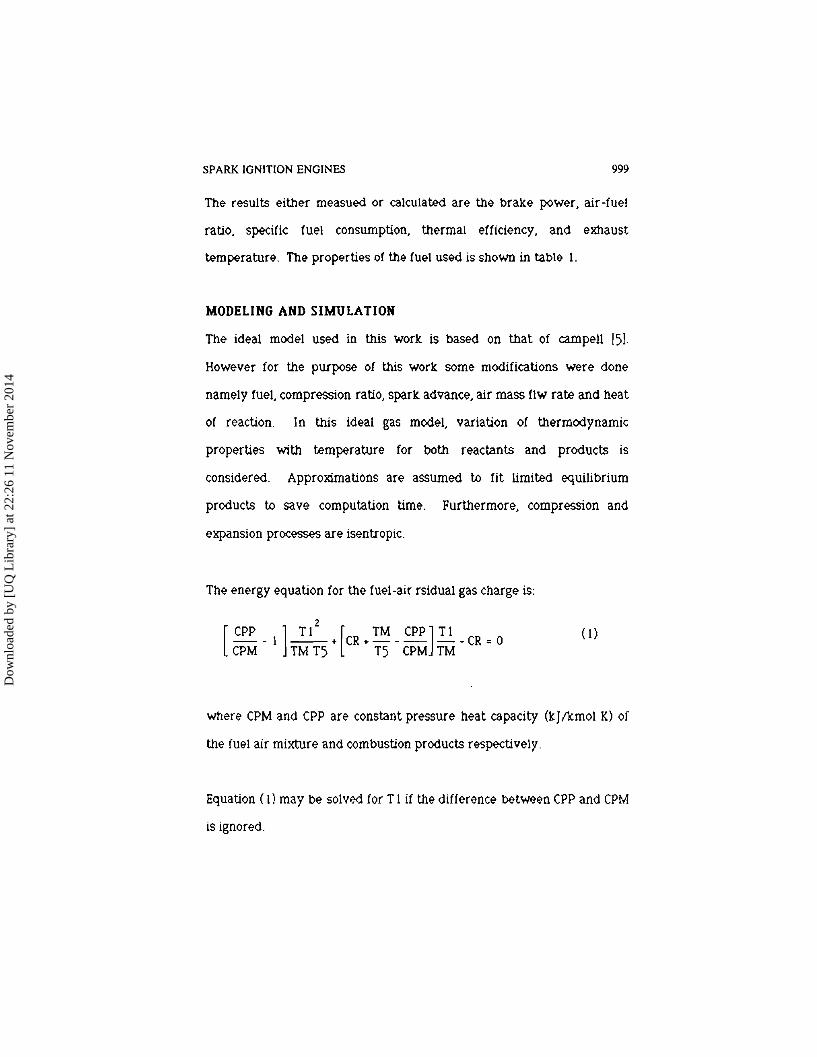
The energy equation for the fuel-air rsidual gas charge is:
2
[ CPP _ I ]~ + [CR + ™ _ CPP].:!:2. _CR = 0CPM TM TS TS CPM TM
where CPM and CPP are constant pressure heat capacity (kJlkmol K) of
tile fuel air mixture and combustion products respectively.
Equation (1) may be solved for T1if tne difference between CPP and CPM
is ignored.
Dow
nloa
ded
by [
UQ
Lib
rary
] at
22:
26 1
1 N
ovem
ber
2014
1000
Property
NAJJAR AND ALTURKI
Table 1. Properties of gasoline
Gasoline
Formula CHZ.045
Relative molecularmass 100
Carbon/hydrogen mass ratio 5.37
Carbon, %by wt 35.444
Hydrogen, %by wt 14·550
Vapour pressure, kg/cmZ 0.7
Density, kg/ I 0.733
Net heat of combustion, kJ/kg. 43,705.5
Stoichiometric A/F mass ratio 14.Mo
Formula C7.12 H14.5O
Distillation
Initial boiling point, O( 33
10% recovery by Vol., °C 52
50% recovery by Vol., °C 30
90% recovery by Vol., O( 141
Dow
nloa
ded
by [
UQ
Lib
rary
] at
22:
26 1
1 N
ovem
ber
2014
SPARK IGNITION ENGINES
T1~ CRTMCR - 1+TM!T5
(2)
1001
Tile energy equation for the combustion process can be written as:
Qv ~ r [N(I) {~ (T3) - ~ (T2)} I (3)
which can be conveniently solved by Newton-Raphson iterations,once we
have appropriate values for the product gas mole numbers, N(I) in Eq.
(3). Considering the general formula of fuel (CnHm) as a common
substitute for gasoline in thermodynamic analysis, assume the
correspondence between I values and product gases to be:-
with Yrepresenting moles 02/mole Cn Hm in the fuel/air mixture
CoHm + Y(02 + 3.76N2)
Hence NMO = 1+ 4.76 Y
Ymin ~ Ycc - n/4
NPO = m/4 + 4.76Y
NPO ~ (n + m/2) + 3.76Y
Urp ~ Hrp - RT (Np - Nr)
for Y > Ycc
for Ymin s y~ Ycc
(4)
(5)
Now the mole numbers and the value for QV required in Eq. (3) can be
set as follows:
Dow
nloa
ded
by [
UQ
Lib
rary
] at
22:
26 1
1 N
ovem
ber
2014
1002 NAJJAR AND ALTURKI
For Y 1 Ycc N( Il ~ 0.0, N(2) ~ n CM, N(3) ~ (m/2)CM, N(5)~3.76 Y CM,
and QV ~ -Urp NM/NMO
but for Ymin < Y < Ycc
N(l) ~ 2(Ycc-Y)CM, N(2) ~ (2Y-(n+m/2))CM, N(4)~0.0, N(5)~3.76 Y CM,
and QV ~ -(URP + 2 (Ycc-Y)(231400)NM/NMO
where the value of 231400 is the internal energy of dissociation of C02
(kJlKmol C02) and where
NM NXCM~--+
NMO NPO(6)
CM is a scale factor reducing the mole numbers to the proper size to fit
into engine.
Comparison of performance results of this model with experiment shows
a large discrepancy, which should be reduced by considering realistic
engine conditions, such as:
1) Progressive combustion process
2) Valve timing in the intake and exnaust processes
3) heat transfer
4) friction
Dow
nloa
ded
by [
UQ
Lib
rary
] at
22:
26 1
1 N
ovem
ber
2014
SPARK IGNITION ENGINES
1. Progressive Combustion
1003
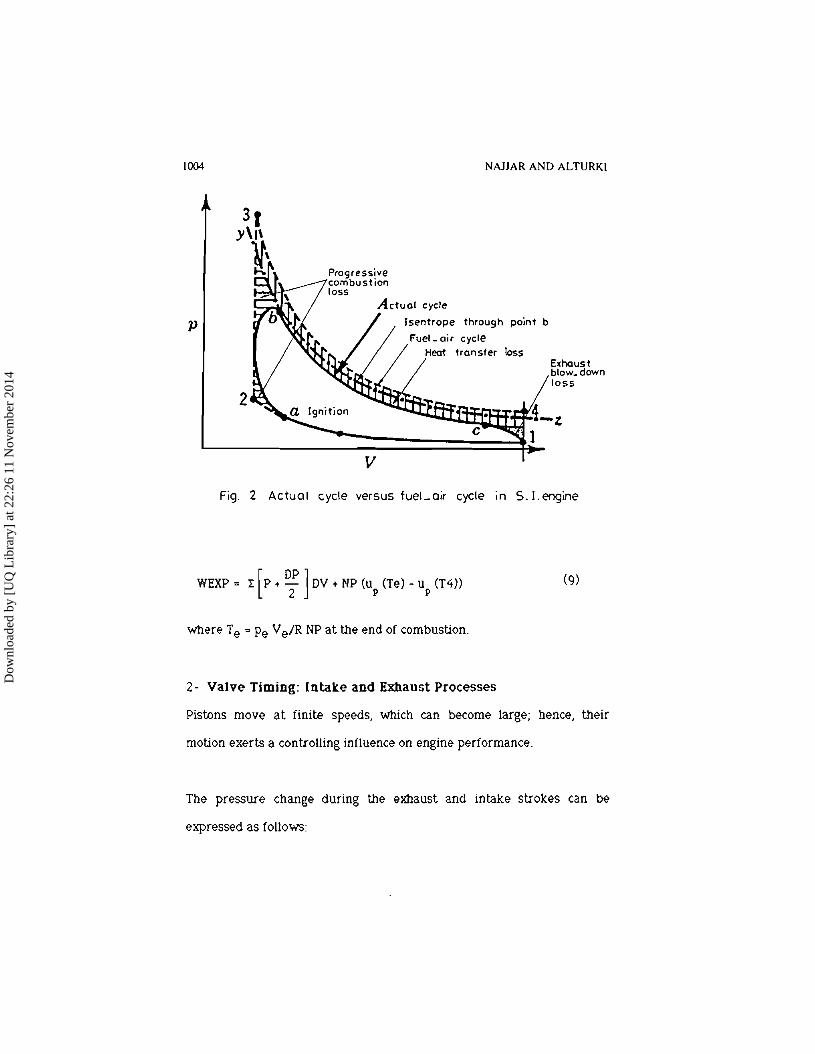
In tne fuel-air cycle instantaneous combustion is assumed. In the real
engine combustion occupies a finite time interval, as shown in fig. 2.
Ignition occurs before the piston reaches top dead center, and combustion
is not completed until the piston has moved beyond it.
In order to calculate the net work. done by gases between ignition and
the end of combustion, one needs to define where those two events occur
in the cycle in addition to the pressure-volume trace during combustion
[II. Hence,
DV VTDeDP = -P KB- + (p - P ) -- DN
V 3 2 V
relates the change in the cylinder pressure DP to the volume change DV
and the mass fracton of the gas ON that burns during the time interval
required for OV.
.If P and T are pressure and tempoature at ignition, the compression work
is [II
WCOtvlP = (NM + NX) CVR (T-T I) -1: [p + D: ] DV
and the expansion work. is
(8)
Dow
nloa
ded
by [
UQ
Lib
rary
] at
22:
26 1
1 N
ovem
ber
2014
1004
p
2
NAJJAR AND ALTURKI
Actual cycle
Isentrope through point b
Fuel , air cycle
Heat transfer lossExhaustbtow. downloss
vFig. 2 Actual cycle versus fuel_air cycle in S. I. engine
WEXP = r [p + DP ] DV + NP (u (Te) - u (T4)) (9)2 P P
Where Te = Pe VelR NP at the end of combustion.
2- Valve Timing: Intake and Exhaust Processes
Pistons move at finite speeds, which can become large; hence, their
motion exerts a controlling influence on engine performance.
The pressure change during the exhaust and intake strokes can be
expressed as Iollows:
Dow
nloa
ded
by [
UQ
Lib
rary
] at
22:
26 1
1 N
ovem
ber
2014
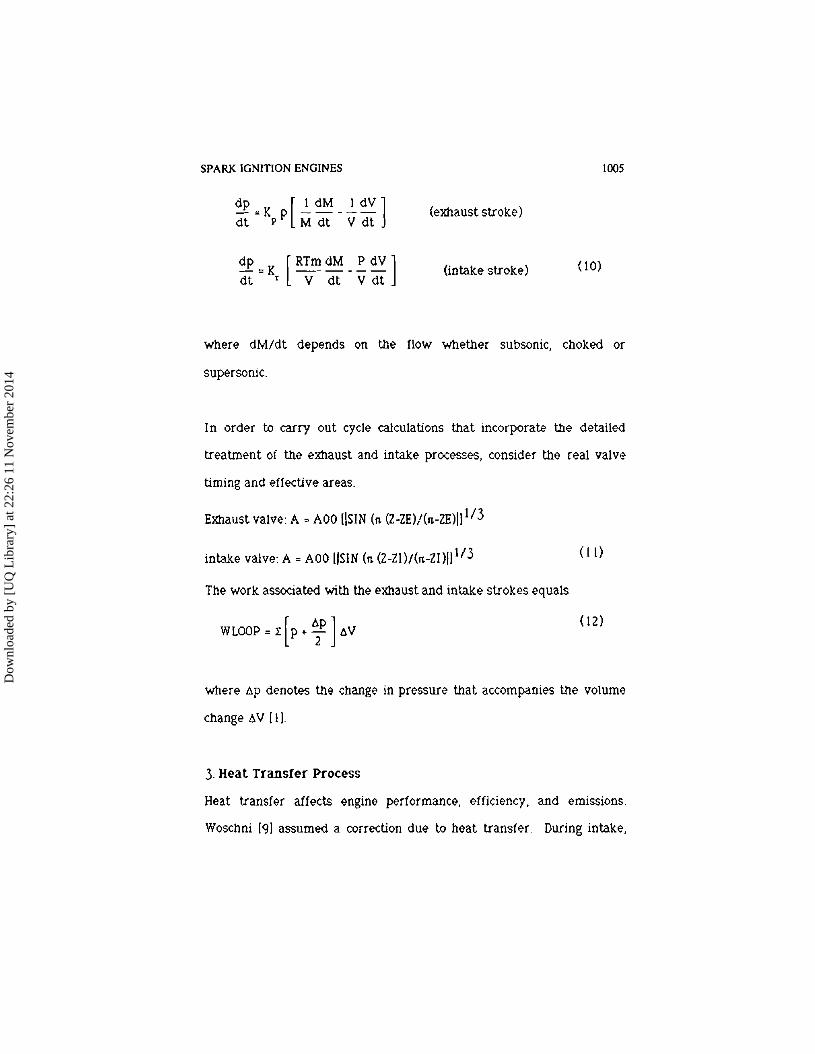
SPARK IGNITION ENGINES
dp = K [RIm dM _~ dV ]dt r V dt V dt
(exhaust stroke)
(intake stroke) (10)
1005
where dM/dt depends on the now whether subsonic, choked or
supersonic.
In order to carry out cycle calculations that incorporate the detailed
treatment of the exhaust and intake processes, consider the real valve
timing and enective areas.
Exhaust valve: A = AOO !\SIN (n (Z-ZE)/(n-ZE)Il I / 3
intake valve: A = AOO lISIN (n (Z-ZI)/(n-ZO!lI/3
The work associated with the exhaust and intake strokes equals
(II)
(12)
where ~p denotes the change in pressure that accompanies the volume
change tN [l J.
3.Heat Transfer Process
Heat transfer affects engine performance, efficiency, and emissions.
Woschni 19J assumed a correction due to heat transfer. During intake,
Dow
nloa
ded
by [
UQ
Lib
rary
] at
22:
26 1
1 N
ovem
ber
2014
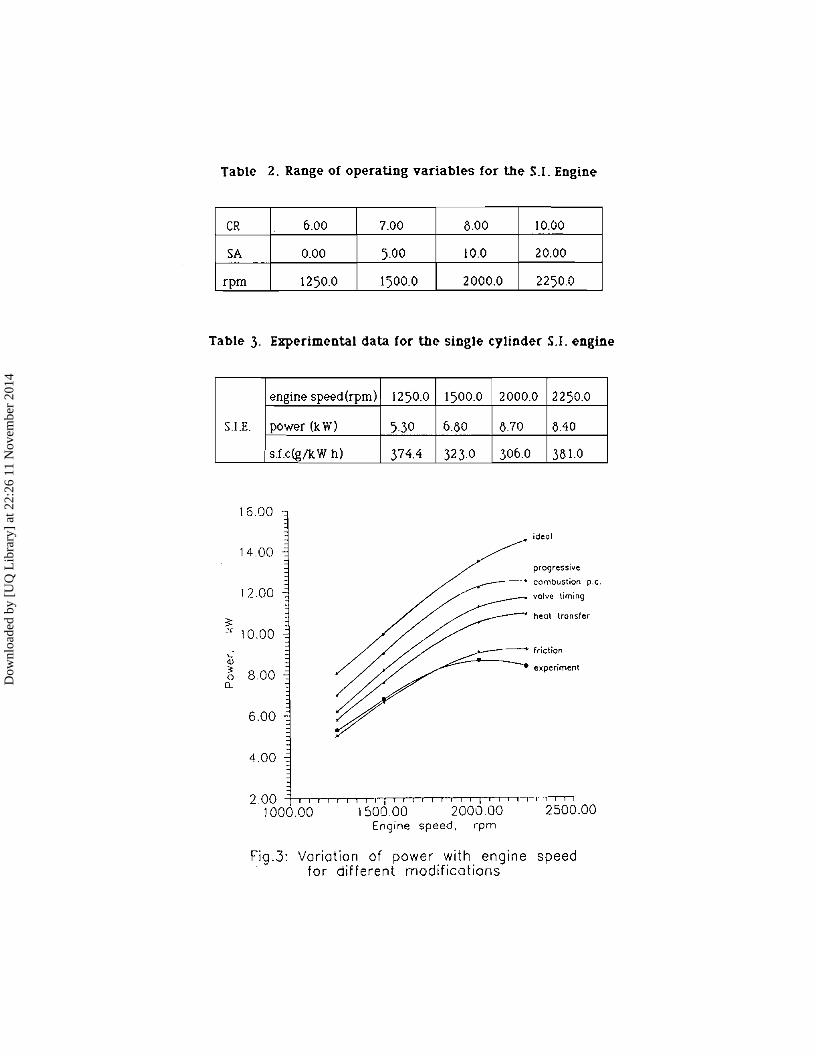
Table 2. Range of operating variables for the S.1. Engine
CR 6.00 7.00 8.00 10.00
SA 0.00 5.00 10.0 20.00
rpm 1250.0 1500.0 2000.0 2250.0
Table 3. Experimental data for the single cylinder S.1. engine
engine speedlrpm) 12500 1500.0 2000.0 2250.0
S.LE. power (l( IV) 530 6.30 370 3.40
sJ.c(g1k W h) 374.4 323-0 306.0 331.0
16.00
14.00
1200
~sc 10.00.,<l!3 8000
Q.
6.00
4.00
2.001000.00
ideo I
heat transfer
experiment
Iii Iii iii i I I i I I I IiI I1500.00 2000.00 2500.00
Engine speed. rpm
Fig.3: Variation of power with engine speedfor different modifications
Dow
nloa
ded
by [
UQ
Lib
rary
] at
22:
26 1
1 N
ovem
ber
2014
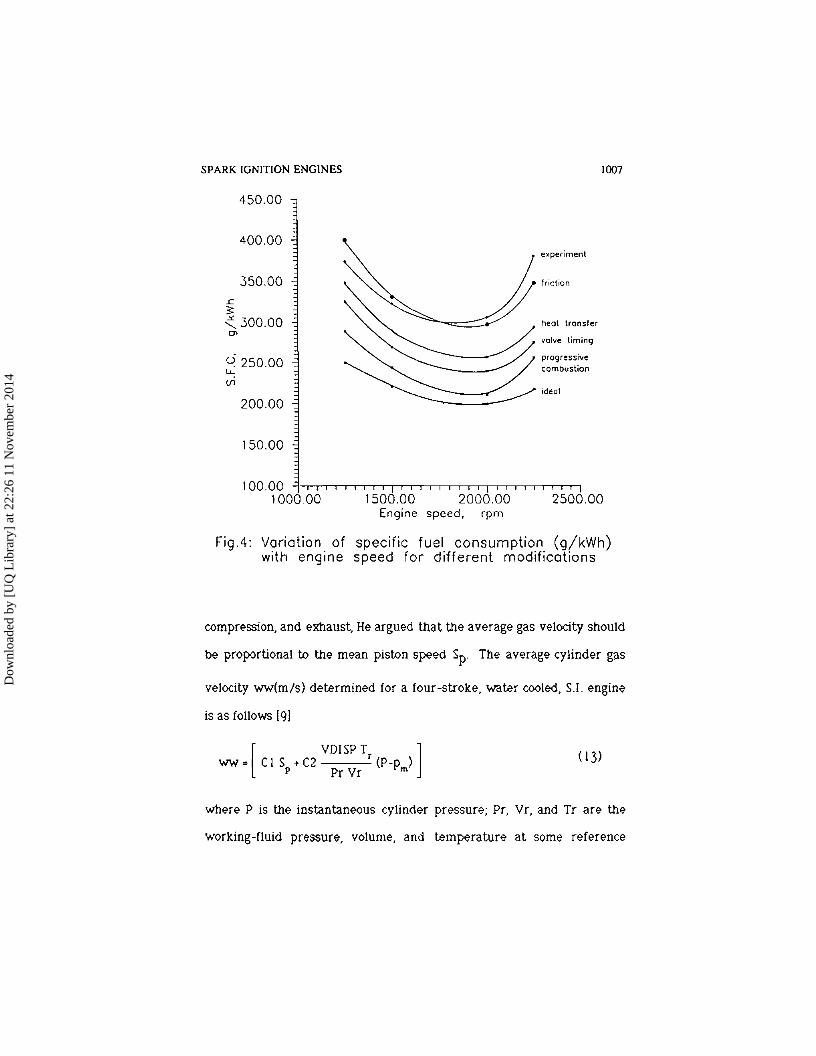
SPARK IGNITION ENGINES 1007
450.00
400.00 -
350.00s:3::<. 300.00o-
u 250.00LL
(fl
200.00
150.00
100.001000.00 1500.00 2000.00
Engine speed, rpm
experiment
f-iction
heat transfer
valve timing
progressivecombustion
ideal
2500.00
Fig.4: Variation of specific fuel consumption (g/kWh)with engine speed for different modifications
compression, and exhaust, He argued tnat tile average gas velocity should
be proportional to tile mean piston speed Sp' The average cylinder gas
velocity wwtm/s) determined for a four-stroke, water cooled, S.I. engine
is as follows 191
[VDISPTr ]
ww = CIS + C2 (P-p )P Pr Vr m
(13)
where P is tile instantaneous cylinder pressure; Pr, Vr, and Tr are the
working-fluid pressure, volume, and temperature at some reference
Dow
nloa
ded
by [
UQ
Lib
rary
] at
22:
26 1
1 N
ovem
ber
2014
45.00
40.00
c-35.00
>,u
.~ 30.00
.S!
<lJ
-025.00E~
<lJ0=f--
20.00
15.001000.00
~:y.;"o,/:/ -. \ proqressive
, r>:~.~~.COmbUSl<~n/ / / """ volve timing
:~~~ • heat transfer
:~ ~.,,,ion
/" • experiment•
II r-r-r-r-r-r-r-r-r-r-r-r-r-j
1500.00 2000.00 2500.00Engine speed, rpm
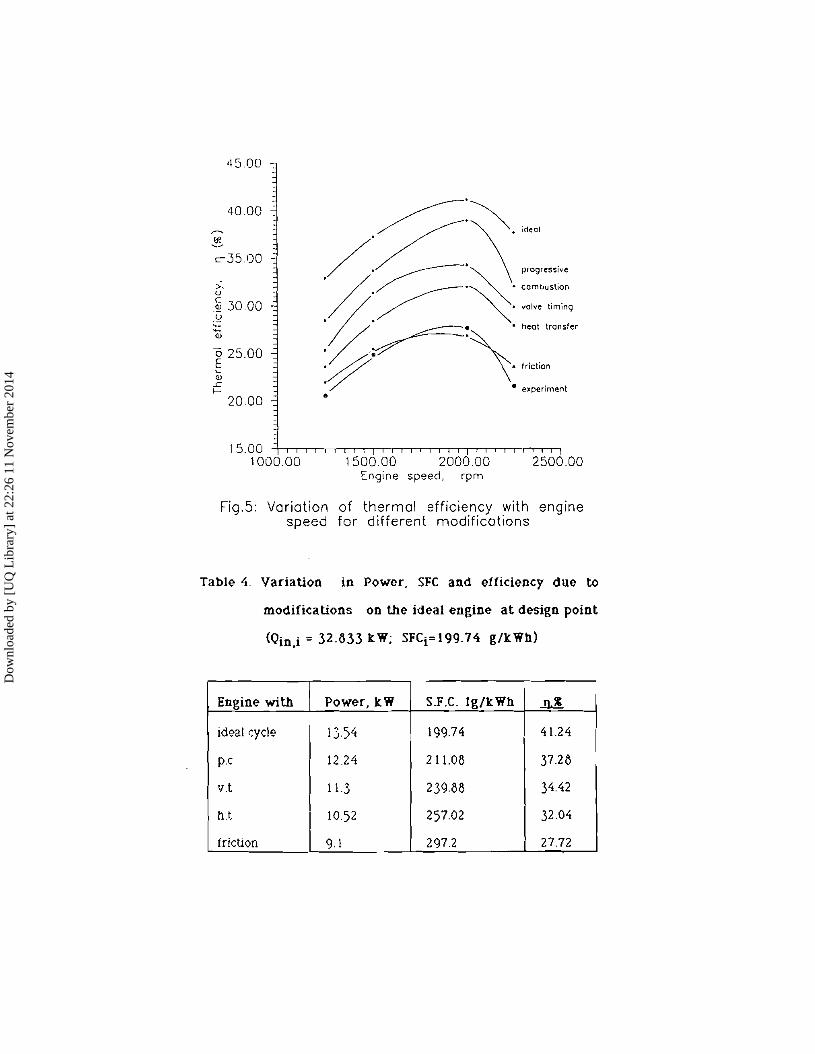
Fig.5: Variation of thermal efficiency with enginespeed for different modifications
Table 4. Variation in Power, SFC and efficiency due to
modifications on the ideal engine at design point
Engine with Power, k.W S.F.C. Ig/k.Wh ..n.X
ideal cycle 1354 199.74 41.24
pc 12.24 211.05 37.25
v.t 11.3 239.55 3442
h.t 1052 25702 32.04
iriction 9.1 2972 27.72
Dow
nloa
ded
by [
UQ
Lib
rary
] at
22:
26 1
1 N
ovem
ber
2014
SPARKIGNITION ENGINES 1009
1.20
1.00
~ 0.80~oQ.
o:i 0.60
0.40
CRSA
o.2a +nTTTTTTlrrTTTTTTTT'TTTTTTT'T'TTTT'T'TlrTTTTTT'nTTTTTT'T'Tl
0.00 0.50 1.00 1.50 200 2.50Non-dimentional variables (N, CR, SA)
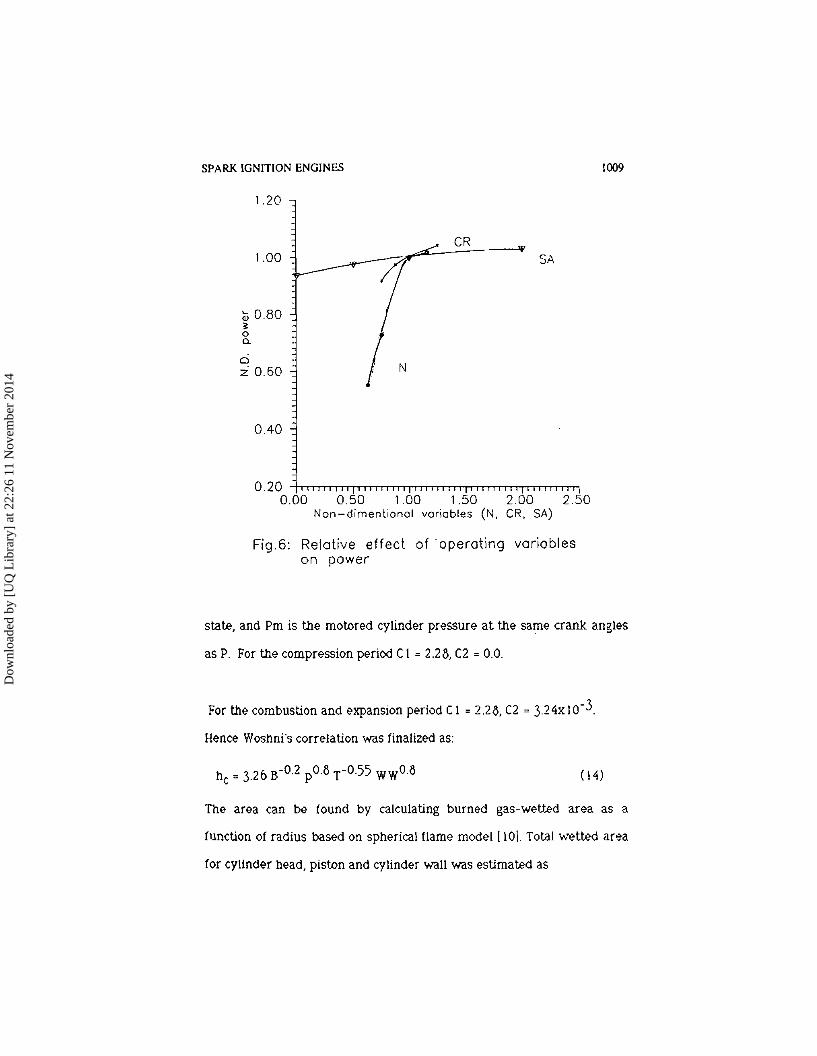
Fig.6: Relative effect of operating variableson power
state, and Pm is the motored cylinder pressure at the same crank angles
as P. For the compression period CI = 2.23, C2 = 0.0.
For the combustion and expansion period C1= 2.23, C2 =3-24XIO-3,
Hence Woshni's correlation was finalized as:
( 14)
The area can be found by calculating burned gas-wetted area as a
function of radius based on spherical flame model [10] Total Wetted area
for cylinder head, piston and cylinder wall was estimated as
Dow
nloa
ded
by [
UQ
Lib
rary
] at
22:
26 1
1 N
ovem
ber
2014
1010 NAJJAR AND ALTURKI
1.10
~-_ .. SA
0.60 -r-r-rt j j j IIII i I I II r-r-r-r-r-r-r I It i i II j j 1111 i I III j j j ii' I Ii
000 0.50 1.00 1.50 200 2.50Non-dimentional variables (1'1, CR, SA)
1.00
0.70
~ 0.90o~
AUCIV:~ 0.80
w
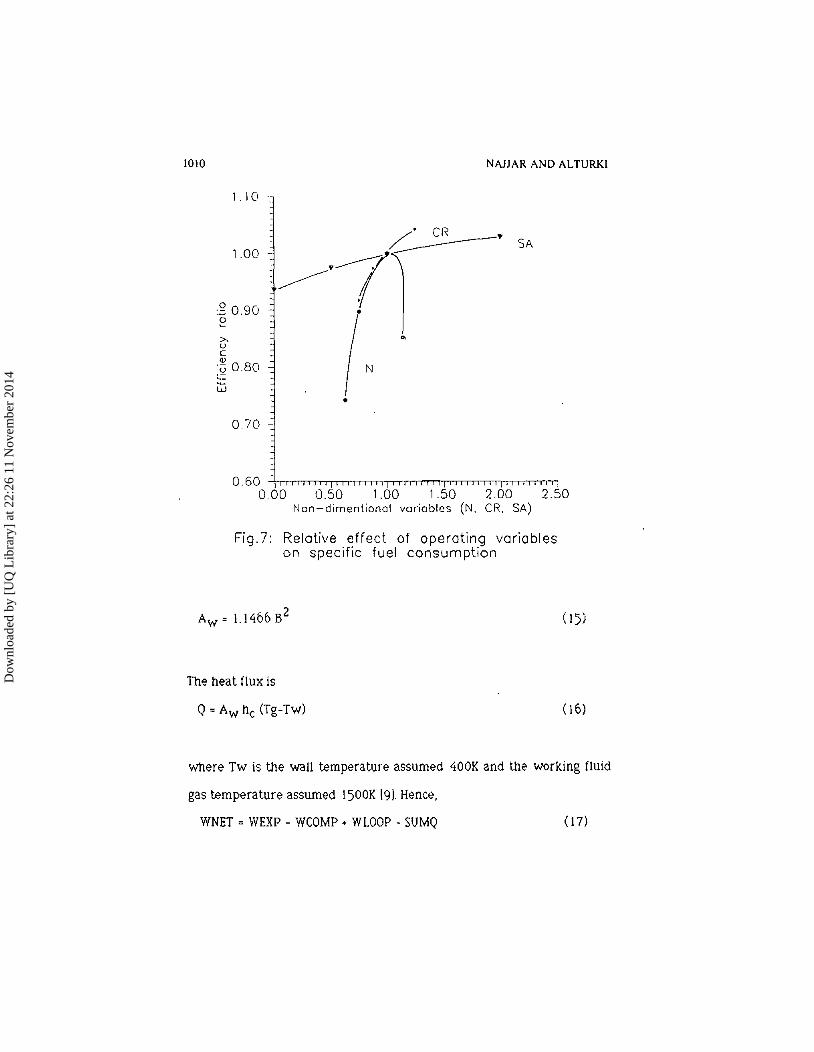
Fiq.7: Relative effect of operating variabl eson specific fuel consumption
2Aw = 1.1466B ( 15)
The heat flux is
Q= Aw hc (Tg-TW) (16)
where Tw is the wall temperature assumed 400K and the working fluid
gas temperature assumed 1500K [9). Hence,
WNET = WE..XP - WCOMP + WLOOP - SUMQ (17)
Dow
nloa
ded
by [
UQ
Lib
rary
] at
22:
26 1
1 N
ovem
ber
2014
SPARK IGNITION ENGINES 1011
.~ ... expenmemt
1500.00 2000.00Engine speed, rpm
,:.1•
-f-rT""'-'-'-""'''''--'-rT""-,--,r-r-,,,-,..,--rr..-r-'l2500.00
9.00
10.00
800:;:sc
.: 7.00OJ
"00..
6.00
5.00
4.001000.00
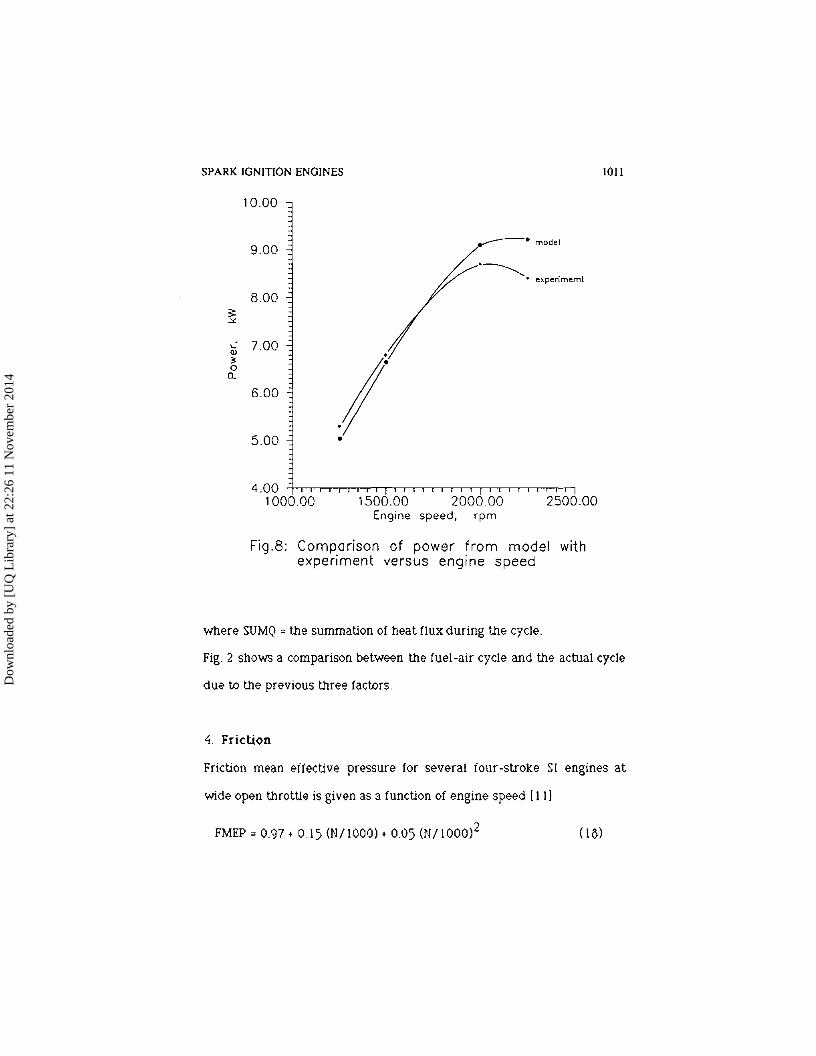
Fig.8: Comparison of power from model withexperiment versus engine speed
where SUMQ = the summation of heat flux during the cycle.
Fig. 2 shows a comparison between the fuel-air cycle and the actual cycle
due to the previous three factors.
4. Friction
Friction mean eifective pressure ior several iour -stroke SI engines at
wide op",n throttle is given as a function of engine spe"'d [II J
FMEP = 0.97 + 015 (N/IOOO) + 0.05 (NIl000)2
Dow
nloa
ded
by [
UQ
Lib
rary
] at
22:
26 1
1 N
ovem
ber
2014
1012 NAJJAR AND ALTURKI
44000
400.00
L
~ 360.00<,0'
uu.: 320.00(J1
280.00
240.001000.00
•
1500.00 2000.00Engine speed.· rpm
• experirnemt
2500.00
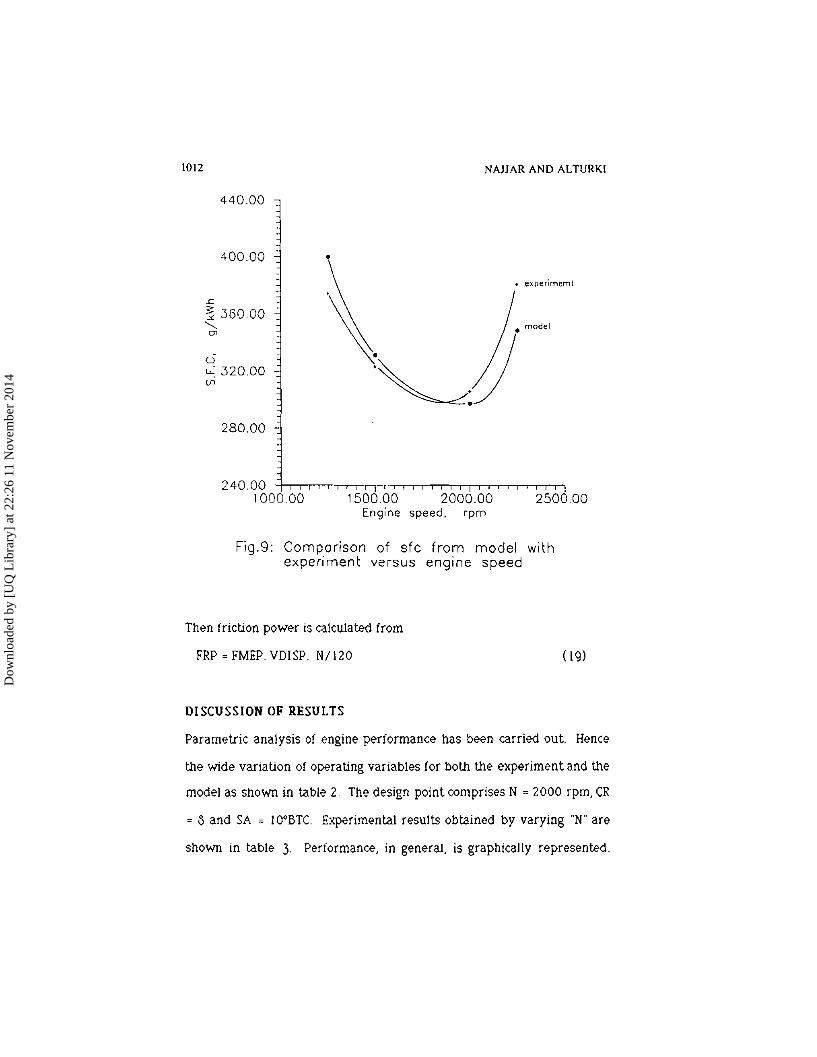
Fig.9: Comparison of sfc from model withexperiment versus engine speed
Then friction po.....er is calculated from
FRP ; FMEP. VDISP. NIl20
DISCUSSION OF RESULTS
( Ig)
Parametric analysis of engine performance has been carried out. Hence
the wide variation of operating variables for both the experiment and the
model as shown in table 2. Thedesign point comprises N ; 2000 rpm, CR
; <') and SA ; lOoBTC. Experimental results obtained by varying "Ware
shown in table 3. Performance, in general, is graphically represented.
Dow
nloa
ded
by [
UQ
Lib
rary
] at
22:
26 1
1 N
ovem
ber
2014
SPARK IGNITION ENGINES 1013
Fig. 3 shows the variation of power with engine speed for different
modifications from the ideal engine namely progressive combustion,
valve timing, and heat transfer to get the indicated power for the real
engine. Friction is then subtracted to produce the brake power, which is
compared with the experimental results. The percent deviation from
experiment is 4.6%. Fig. 4 shows the variation of SFC with speed for
similar modifications as in the case of power. Figurs 5 shows the
variation in efficiency with speed for the different modifications. Tale 4
shows tne variation in efficiency along with power and sfc due to these
modifications at the design point. The trends for power, SFC and
efficiency are as expected. Plots for variation of power and SFC ....ith
other variables such as compression ratio CR and spark advance SA have
been cancelled in favour of brevity. However, their relative effects on
power and SFC are shown in the non-dimensional plottings of figures 6
and 7. It is clearly seen that speed has the highest whereas spark
advance the lowest relative effect on performance.
Figures I) and 9 compare the model predictions with experimental results
for power and src. The percentage deviation from the experiment, at the
design point, is about 4.6% in power and 2.9% in SFC.
CONCLUSIONS
1- Losses due to imperfect construction of the real engine, including
progressive combustion, valve timing and heat transfer have been
Dow
nloa
ded
by [
UQ
Lib
rary
] at
22:
26 1
1 N
ovem
ber
2014
1014 NAJJAR AND ALTURKI
modeled besides engine friction, to convert the output of the fuel
air cycle into brake performance.
2- Simulation of engine performance was carried out by varying
engine speed N, compression ratio CR, and spark advance over wide
range.
3- Experiments were done with a single cylinder engine over a wide
range of the above-mentioned operating variables.
4- The model compares favourably with experiment, with a deviation
around 46% in power and 2.9% in SFC.
5- The relative importance of the losses are generally in the following
sequence: friction, progressive combustion, valve timing and heat
transfer. These losses amount to about 14% of the fuel energy input
at the design point.
ACKNOWLEDGEMENTS
The autors would like thank Mr. O. Bashir and Mr. H. Abu Kayyas for
assistance during this research work, and Dr. M. Zaamout for producing
most of the drawings.
NOMENCLATURE
AOO wide open valve effective area for both valves, m2
B bore, m
CPM specific heat of the fuel-air mixture, kJ/kmol K.
Dow
nloa
ded
by [
UQ
Lib
rary
] at
22:
26 1
1 N
ovem
ber
2014
SPARK IGNITION ENGINES 1015
CPR specific heat of fuel, air plus residual gas mixture kJ/kmot K
CR compression ratio
DN the fraction of fuel-air mixture burned during (DZ)
DP increment in pressure during DZ, kPa
DW work done by the gas on the piston during DZ, k]
DZ crank angle increment, degree
FMEP friction mean effective pressure, kPa
FRP friction power, kW.
hc heat transfer coefficient, W/m 2 K
NM number of moles of fuel-air mixture in the engine at the start of
compression stroke, kmol
NMO number of moles of fuel-air mixture with I kmol fuel, kmol
Nr number of molesof reactants for stoichiometricmixture, kmol
NP actual number of moles of products in the engine,kmol.
NPO number of moles of products per I krnot of fuel, kmol
Np number of moles of products for stoichiomettric mixture, kmol
NX number of moles of residual gas, kmol
N(l) product gas mole number, kmol
N engine speed, rev /rnin
SA spark advance, degrees
SFC speciric fuel consumption, kg/k Wh
TM intake manifold temperature, K
T I mixture temperature at start of compression, K
Dow
nloa
ded
by [
UQ
Lib
rary
] at
22:
26 1
1 N
ovem
ber
2014
NAJJAR AND ALTURKI1016
Tg the working gas temperature, K
T5 residual gas temperature, K
VDISP displacementvolume, m3
U(X) tile internal enegy of the exhaust gas mixture, kJ
WCOMP work done on the gas during compression, kJ
WEXP work done on the gas during expansion, kJ
WLOOP work done on the gas during exhaust and intake, kJ
WNET net work output during the cycle, kJ
Y moles 0Z/mole fuel
To: Yfor stoichiometric mixture
Z crank angle at the start of combustion, radians.
ZED crank angle for exhaust valve opening before BDC, degree
ZE crank angle for ZED, radians.
zm crank angle for intake valve closing after BDC, degree
ZI crank angle for zm, radian.
ZI I crank angle at start of injection in C.I. engine
TJ thermal efficiency, :t
REFERENCES
1- Primus, R.J. and Flynn, P.F., "Diagnosing the real performance impact
of diesel engine design parameter variation", Proceedings of
International Symposium on Diagnostics and Modeling of
Dow
nloa
ded
by [
UQ
Lib
rary
] at
22:
26 1
1 N
ovem
ber
2014
SPARK IGNITION ENGINES 1017
Combustion in Reciprocating Engines, COMODIA 85, pp. 529-538,
Tokyo, September 4-6, 1985.
2- Foster, D.E., and Myers, P.S., "Heavy-duty diesel fuel economy",
Mechanical Engineering pp. 50-56, Dec. 1932
3- Heywood, [B, "Internal Combustion Engine Fundamentals", McGraw
Hill, New York., 19M.
4- Clarke, JM., "The thermodynamic cycle requirements for very high
rational efficiencies", Paper C53/76, Institution of Mechanical
Engineers, J. Mech. Engrg. Sci, 1974.
5- Campen, AS, "Thermodynamic Analysis of Combustion Engines",
john Willey & Sons, New York, 1979.
6- Ballaney, P.L., "Internal Combustion Engine", Khanna Publishers,
Delhi, 19&0.
7- Kerley, RV" and Thuston, K.W., "The indicated performance of Otto
cycle.engines·, SAE Transactions, Vol. 70, pp. 5-37, 1962.
8- Shupe, DS, "Automobile fuel economy", Mechanical Engineering, pp.
30-34, Dec. 1977
9- Woschni, G. "Universally applicable equation for the instantaneous
heat transfer coefficient in the internal combustion engine", SAE
paper 670931, SAE Transactions Vol. 76, 1967.
10- Poulos, S.G. and Heywood, lB., "The effect of chamber geometry on
spark ignition engine combustion", SAE paper 830334, SAE Trans.,
Vol. 92, 1983
Dow
nloa
ded
by [
UQ
Lib
rary
] at
22:
26 1
1 N
ovem
ber
2014
1018 NAJJAR AND ALTURKI
11- Barnes-Moss, H.W., "A cesignrs viewpoint in passenger car engines",
conference procedings, pp. 133-147, Institution or Mechanical
Engineers, London 1975.
RECEIVED: June IS, 1995
ACCEPTED: September 23, 1995
Dow
nloa
ded
by [
UQ
Lib
rary
] at
22:
26 1
1 N
ovem
ber
2014