Embed Size (px)
Citation preview

Modeling and Simulation of Selected Operational IT Risks in the Banking Sector
Christoph Brandt1
Technical University of Berlin, Germany & Public Research Centre Henri Tudor, Luxembourgemail: [email protected], [email protected]
Francesco Santini2, Natallia Kokash and Farhad ArbabCentrum Wiskunde & Informatica, Netherlands
email: [email protected], [email protected], [email protected]
28 September 2012
KEYWORDS
Operational risks, hybrid simulation, control theory,banking sector
ABSTRACT
International banks need to estimate their operationalrisks due to external regulations. Based on their esti-mations they need to provide private capital to coverpotential losses caused by these risks. Therefore, opera-tional risks need to be properly measured and managedin order to reduce the required private capital. In thispaper we discuss operational risks related to a typicalbanking business process that is enabled by an IT land-scape. We present how risks related to the operationalbehavior of the IT landscape can be simulated. Thesimulation results help to estimate risk measures likethe expected loss, the value-at-risk and the expectedshortfall. We further sketch how control theory can beused to actively manage the dynamic reconfiguration ofa service landscape, in order to minimize modeled op-erational risks. First experimental simulation results il-lustrate our approach.
Introduction
We present a new approach to modeling and simulat-ing operational risks that shows some potential to suc-cessfully address open issues known from today’s best-practices. The research question is how to model andsimulate operational risks of real-world financial orga-nizations using organizational models (Brandt and Her-mann (2013)). The main contribution of our work con-sists of two parts: The first part is about simulating op-erational risks using an approach that is bottom up andtop down at the same time. The second part is aboutdynamic reconfiguration of service landscapes using con-trol theory, which helps to actively optimize modeledoperational risks. The rest of this paper is organized asfollows: We, firstly, reflect on the notion of operationalrisks, introduce a real-world scenario and present the
methods and tools that we use. Secondly, we show ourfirst experimental results of an assumed IT landscapeas well as a preliminary risk assessment based on theseresults, and potential next steps of our study. Finally,we discuss selected related work.
Operational Risks
According to the Basel Committee of Banking Super-vision “operational risk is defined as the risk of lossresulting from inadequate or failed internal processes,people and systems or from external events. This defi-nition includes legal risk, but excludes strategic and rep-utational risk” (on Banking Supervision (2011b;a; 2006;2012)). Operational risks complete the risk portfolio ofa bank, which also encompasses credit risks and marketrisks. Operational risks are largely firm-specific non-systematic risks (Tchernobai (2006)).
In the context of this paper, we focus on the techno-logical risk related to a business process that is enabledby an IT landscape. We measure operational risks bythe help of the expected loss, the value-at-risk and theexpected shortfall, because these measures nicely inte-grate with already existing risk frameworks in financialorganizations.
A real-world Scenario in Finance Industry
The concrete scenario we consider here was inspired bya study of real-world requirements at Credit Suisse. Wedecided to go for a business process that is about buy-ing shares over the internet by the help of an e-bankingsystem. In this scenario, people select shares they wantto buy, put them into a basket, and finally pay for themusing electronic means like credit cards. Once in a while,an account statement is sent to clients by email summa-rizing all their past transactions.
In order to be able to discuss operational risks relatedto IT systems, we decided to model a service landscape,which implements and enables this business process.The model is shown in Fig. 1. It comes as a Model-
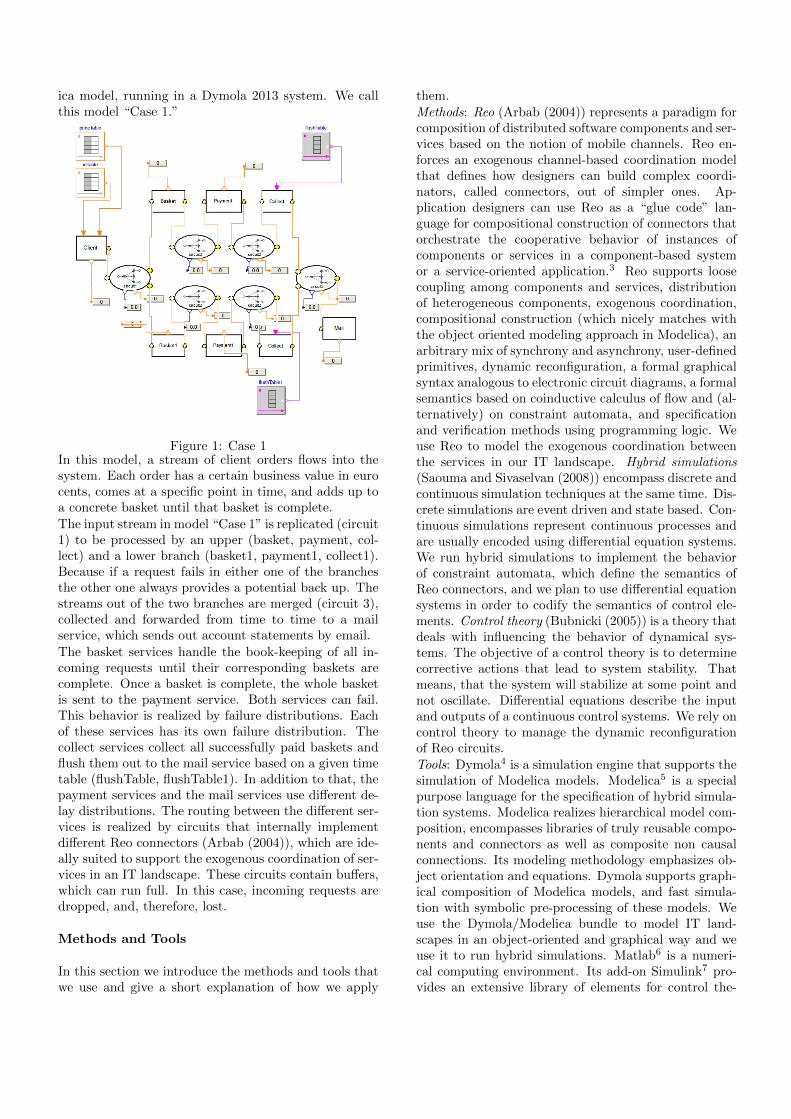
ica model, running in a Dymola 2013 system. We callthis model “Case 1.”
Figure 1: Case 1In this model, a stream of client orders flows into thesystem. Each order has a certain business value in eurocents, comes at a specific point in time, and adds up toa concrete basket until that basket is complete.The input stream in model “Case 1” is replicated (circuit1) to be processed by an upper (basket, payment, col-lect) and a lower branch (basket1, payment1, collect1).Because if a request fails in either one of the branchesthe other one always provides a potential back up. Thestreams out of the two branches are merged (circuit 3),collected and forwarded from time to time to a mailservice, which sends out account statements by email.The basket services handle the book-keeping of all in-coming requests until their corresponding baskets arecomplete. Once a basket is complete, the whole basketis sent to the payment service. Both services can fail.This behavior is realized by failure distributions. Eachof these services has its own failure distribution. Thecollect services collect all successfully paid baskets andflush them out to the mail service based on a given timetable (flushTable, flushTable1). In addition to that, thepayment services and the mail services use di↵erent de-lay distributions. The routing between the di↵erent ser-vices is realized by circuits that internally implementdi↵erent Reo connectors (Arbab (2004)), which are ide-ally suited to support the exogenous coordination of ser-vices in an IT landscape. These circuits contain bu↵ers,which can run full. In this case, incoming requests aredropped, and, therefore, lost.
Methods and Tools
In this section we introduce the methods and tools thatwe use and give a short explanation of how we apply
them.Methods: Reo (Arbab (2004)) represents a paradigm forcomposition of distributed software components and ser-vices based on the notion of mobile channels. Reo en-forces an exogenous channel-based coordination modelthat defines how designers can build complex coordi-nators, called connectors, out of simpler ones. Ap-plication designers can use Reo as a “glue code” lan-guage for compositional construction of connectors thatorchestrate the cooperative behavior of instances ofcomponents or services in a component-based systemor a service-oriented application.3 Reo supports loosecoupling among components and services, distributionof heterogeneous components, exogenous coordination,compositional construction (which nicely matches withthe object oriented modeling approach in Modelica), anarbitrary mix of synchrony and asynchrony, user-definedprimitives, dynamic reconfiguration, a formal graphicalsyntax analogous to electronic circuit diagrams, a formalsemantics based on coinductive calculus of flow and (al-ternatively) on constraint automata, and specificationand verification methods using programming logic. Weuse Reo to model the exogenous coordination betweenthe services in our IT landscape. Hybrid simulations(Saouma and Sivaselvan (2008)) encompass discrete andcontinuous simulation techniques at the same time. Dis-crete simulations are event driven and state based. Con-tinuous simulations represent continuous processes andare usually encoded using di↵erential equation systems.We run hybrid simulations to implement the behaviorof constraint automata, which define the semantics ofReo connectors, and we plan to use di↵erential equationsystems in order to codify the semantics of control ele-ments. Control theory (Bubnicki (2005)) is a theory thatdeals with influencing the behavior of dynamical sys-tems. The objective of a control theory is to determinecorrective actions that lead to system stability. Thatmeans, that the system will stabilize at some point andnot oscillate. Di↵erential equations describe the inputand outputs of a continuous control systems. We rely oncontrol theory to manage the dynamic reconfigurationof Reo circuits.Tools: Dymola4 is a simulation engine that supports thesimulation of Modelica models. Modelica5 is a specialpurpose language for the specification of hybrid simula-tion systems. Modelica realizes hierarchical model com-position, encompasses libraries of truly reusable compo-nents and connectors as well as composite non causalconnections. Its modeling methodology emphasizes ob-ject orientation and equations. Dymola supports graph-ical composition of Modelica models, and fast simula-tion with symbolic pre-processing of these models. Weuse the Dymola/Modelica bundle to model IT land-scapes in an object-oriented and graphical way and weuse it to run hybrid simulations. Matlab6 is a numeri-cal computing environment. Its add-on Simulink7 pro-vides an extensive library of elements for control the-
ory, which are ready to use o↵ the shelf. We use Mat-lab/Simulink to run control theory models, which ac-tively manage the dynamic reconfiguration of IT land-scapes coordinated by Reo circuits in order to optimizeoperational risks. Matlab/Simulink integrates nicelywith Dymola/Modelica as it is possible to run Modelicamodels, which have been compiled using Dymola, insidea Matlab/Simulink model. Mathematica8 is a concretecomputer algebra system. It comes with an extensivebuilt-in functionality for statistics. We use the symbolicand numerical methods implemented in Mathematicafor the risk analysis in our study.
Experimental Results
In this section we present selected experimental resultsto further illustrate our approach. These results arecurrently not based on empirical data, but on some ran-dom numbers, which we generated based on the insightsgained from the analysis of the requirements derivedfrom the real-world scenario at Credit Suisse9. Theassumptions are strongly simplified in order to complywith disclosure agreements.
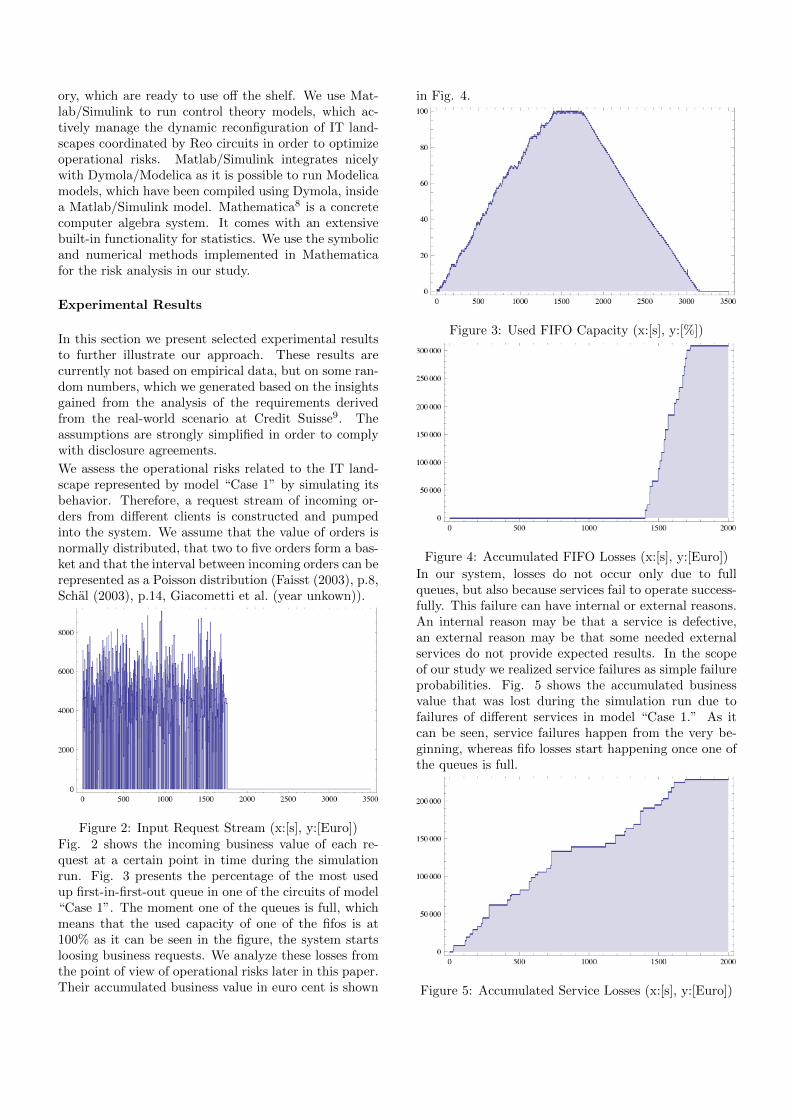
We assess the operational risks related to the IT land-scape represented by model “Case 1” by simulating itsbehavior. Therefore, a request stream of incoming or-ders from di↵erent clients is constructed and pumpedinto the system. We assume that the value of orders isnormally distributed, that two to five orders form a bas-ket and that the interval between incoming orders can berepresented as a Poisson distribution (Faisst (2003), p.8,Schal (2003), p.14, Giacometti et al. (year unkown)).
Figure 2: Input Request Stream (x:[s], y:[Euro])Fig. 2 shows the incoming business value of each re-quest at a certain point in time during the simulationrun. Fig. 3 presents the percentage of the most usedup first-in-first-out queue in one of the circuits of model“Case 1”. The moment one of the queues is full, whichmeans that the used capacity of one of the fifos is at100% as it can be seen in the figure, the system startsloosing business requests. We analyze these losses fromthe point of view of operational risks later in this paper.Their accumulated business value in euro cent is shown
in Fig. 4.
Figure 3: Used FIFO Capacity (x:[s], y:[%])
Figure 4: Accumulated FIFO Losses (x:[s], y:[Euro])In our system, losses do not occur only due to fullqueues, but also because services fail to operate success-fully. This failure can have internal or external reasons.An internal reason may be that a service is defective,an external reason may be that some needed externalservices do not provide expected results. In the scopeof our study we realized service failures as simple failureprobabilities. Fig. 5 shows the accumulated businessvalue that was lost during the simulation run due tofailures of di↵erent services in model “Case 1.” As itcan be seen, service failures happen from the very be-ginning, whereas fifo losses start happening once one ofthe queues is full.
Figure 5: Accumulated Service Losses (x:[s], y:[Euro])

We will see in the following that these di↵erent typesof losses result in di↵erent shapes of loss distributionsthat are counterintuitive, and which contradict today’sassumptions about the shape of loss distributions of op-erational risks.
In our model “Case 1” paid baskets are collected in thecollect services. Afterwards, account statements are sentout on a regular basis using a time table. Fig. 6 showsthe total business value related to these account state-ments that are sent out at certain points in time.
Figure 6: Simulated Cash Flow (x:[s], y:[Euro])We defined the accumulated business value as the ob-tained cash flow of successfully executed business pro-cesses.
Figure 7: Simulated Input Requests (x:[1/s], y:[Euro])In line with today’s practice for operational risks wepresent our finding using value and frequency distribu-tions. In Fig. 7 the copula of the value/frequency dis-tribution of the input requests is presented, which arebased on generated random numbers. Here, this cop-ula looks as if it is built out of two independent dis-
tributions, which is, in fact, in line with the setting ofour simulation run, and, therefore, not surprising, theoutcoming results correspond to the inserted variables.Assuming now independent value and frequency distri-butions, estimating their parameters and constructinga copula leads to the result presented in Fig. 8. Inthe given case, we used a normal distribution to ap-proximate the simulated value distribution and a Pois-son distribution to approximate the simulated frequencydistribution. Both theoretical distributions fit the sim-ulated distributions.
Figure 8: Estimated Input Requests (x:[1/s], y:[Euro])
Figure 9: Simulated FIFO Losses (x:[1/s], y:[Euro])
We see a completely di↵erent situation in Fig. 9. Here,

the copula of simulated losses due to full queues isshown. The picture indicates that the underlying fre-quency and value distributions are not independent.
We can see two centers of high value and low value lossesat a low frequency and one center of high value lossesat a high frequency. This experimental result supportsthe statement made in Tchernobai (2006) that “unlikemarket risk and perhaps credit risk, the [operational] riskfactors are largely internal to the bank.” What we seeis the structural impact a concrete IT landscape hasregarding the observable loss behavior.
Figure 10: Estimated FIFO Losses (x:[1/s], y:[Euro])
Figure 11: Simulated Service Losses (x:[1/s], y:[Euro])In Fig. 10 we present the estimated copula based on theobtained simulation data. It is based on the assump-
tions of independent value and frequency distributions.As suggested in (Tchernobai (2006)) the value distribu-tion is approximated using an alpha-stable distribution,the frequency distribution is built up using a Poissondistribution. However, as can be seen, the assumptionsdo not hold. The shape of the estimated copula is signif-icantly di↵erent from the shape of the simulated copula.This shape mismatch indicates that top down measure-ment approaches do not always work well. A much bet-ter match between the simulated and the estimated lossdistributions related to service failures can be seen inthe following. In Fig. 11 the simulated service lossesare shown.In Fig. 12 the estimated theoretical copula is presentedbased on the same assumptions as before, in Fig. 10.The potential reason for this match is that the overallstructure of the IT landscape has much less influence onindependent loss events in di↵erent services than rout-ing decisions of requests have when losses in queues areanalyzed.
Figure 12: Estimated Service Losses (x:[1/s], y:[Euro])However, what we can see is that the value of baskets isno longer normally distributed. There are two centersvisible in Fig. 11, and there are apparently two di↵er-ent loss distributions operating, one that causes manylosses, and one that cause only few losses. This ob-servation is in line with the settings of our simulationmodel, the outcoming results correspond to the insertedvariables. However, our settings should make sense be-cause, in practice, the individual loss behavior of a spe-cific service application should be specific to that serviceor application.Fig. 13 finally shows the simulated copula of the suc-cessfully obtained cash flow in the end. We can seefour centers. A low frequency/low value, a low fre-quency/high value, a high frequency/high value and a

high frequency/low value centers.
Figure 13: Simulated Cash Flow (x:[1/s], y:[Euro])As in previous cases, this phenomenon is caused by thespecific qualities of the IT landscape in model “Case 1.”Here, again, the estimated theoretical copula, in Fig.14, oversimplifies the situation. Therefore, the oftenadvertised top down approach recommended to estimatedistributions for operational risks does not successfullywork here.
Figure 14: Estimated Cash Flow (x:[1/s], y:[Euro])
Experimental Risk Assessment
In the literature (Tchernobai (2006), Daldrup (2005))the loss distribution is used to estimate the ex-
pected loss, the value-at-risk and the expected short-fall. Whereas the expected loss can be priced into theproducts and services, the value-at-risk is used to de-termine the needed capital to cover potential, but un-foreseen losses. In addition to that, the expected short-fall can be used to optimize a portfolio of operationalrisks. In the following, we suggest doing this using con-trol theory, whereby a controller governs the automaticre-configuration of Reo circuits that exogenously coor-dinates services in our assumed IT landscape.In Fig. 15 an alpha-stable distribution is shown de-scribing the loss behavior of the simulated system. Itsparameters have been estimated using bootstrap tech-niques applied to the simulated data. To take an alpha-stable distribution in order to model operational riskswas suggested by (Tchernobai (2006)). Here, the distri-bution fits the data generated by the simulation and wasaccepted by all goodness-of-fit tests we checked. Fromleft to right vertical lines represent the expected loss,the value-at-risk and the expected shortfall for the sim-ulated period and for a confidence level of 0.95 on a perbusiness request basis. According to Tchernobai (Tch-ernobai (2006)) di↵erent confidence levels lead to di↵er-ent capital requirements. In order to keep our underly-ing (numerical) simulation issues simple, we decided tocalculate the risk measures for the purpose of demon-stration in the scope of this paper for a confidence levelof 0.95. However, current regulations (on Banking Su-pervision (2006) p. 151) require a confidence level of0.99 or 0.999.
Figure 15: Risk Measurements for Losses (x:[Euro],y:[PDF])In principle, the same can be done for the cash flow ina symmetric way. The theoretical distributions here arestill under investigation and left for future work.However, the loss distribution covers all losses that oc-cur during the simulation, that is, losses of services andlosses because of full queues. As we have seen in ear-lier figures, some loss distributions are impacted by thestructural qualities of the simulated system, whereasothers are not. Therefore, the fit of the alpha-stabledistribution describing the loss behavior of a system inthe given case cannot yet be generalized as it was sug-

gested in Tchernobai (2006).
Therefore, the approach we apply is at the same timebottom up and top down. It is bottom up as it gener-ates simulation data of the potential future behavior of asystem, which can be used in exchange of past loss data.It is top down as it estimates parameters of theoreticaldistributions based on the generated simulation data,which are selected based on a priori assumptions. Theadvantage is clear. Past data do not necessarily reflectthe future loss behavior of a system because IT land-scapes constantly change. Simulation provides a look-ahead, which fixes this problem. Secondly, today’s ap-proaches to estimating operational risks are built on topof data pools. These pools no longer reflect structuralinformation needed to assess operational risks. Here,simulation can help as it is not (necessarily) built upon whole organizations, but on organizational elements,which may appear in di↵erent contexts and are more sta-ble than organizations as such. Therefore, we suggest tofocus on organizational building blocks, setting them upeach to represent a concrete organizational setting, andsimulating them in order to derive the necessary datafor risk assessment.
Next Steps
The next steps in our study will focusses on the sim-ulation of the model “Case 2”. Here, we assume thatincoming orders are not replicated and simultaneouslyprocessed by an upper and a lower branch, but arbi-trarily distributed to the available services in order tomaximize the overall capacity of requests the IT land-scape can process. Fig. 16 shows the Modelica modelof “Case 2” in the Dymola environment.
Figure 16: Case 2
The main di↵erences compared to model “Case 1” inFig. 1 are the di↵erent Reo circuits that coordinate theused services.Our assumption is that model “Case 1” is better interms of operational risks when few requests of highvalue need to be processed, whereas model “Case 2”excels when many requests of low value need to be han-dled. The corresponding simulations are left for futurework.Assuming that the nature of the incoming requests maychange over time, as for instance, typical business situa-tions at day and at night di↵er, model “Case 3” in Fig.17 combines both earlier models. It contains a switchthat either selects model “Case 1” or model “Case 2”for processing the incoming requests. From a theoreti-cal point of view, the switch enables the dynamic recon-figuration of the Reo circuits in the given IT landscapeby either selecting the first or the second configuration.We plan to control the switch by setting variables of theswitch to certain values through a control model. Weassume that the control model can at the same timeread certain variables indicating the situation of opera-tional risks from model “Case 1” and model “Case 2”,respectively.
Figure 17: Case 3Subsequently, we wrapped model “Case 3” in the Mat-lab/Simulink environment and defined input and outputports declared in the Dymola/Modelica setting. Thisenables us to use “Case 3” as a black-box in this envi-ronment. Currently, this Matlab/Simulink model justreads generated random data created using Mathemat-ica and writes simulation data into result files. In thefuture we plan to use the Matlab/Simulink libraries todevelop the control model which then either decides toswitch to the first or the second Reo configuration. Tothe best of our knowledge our suggested approach of us-ing a control model in order to switch between Reo con-figurations of a service landscape in order to optimizethe modeled operational risks is new and has not been
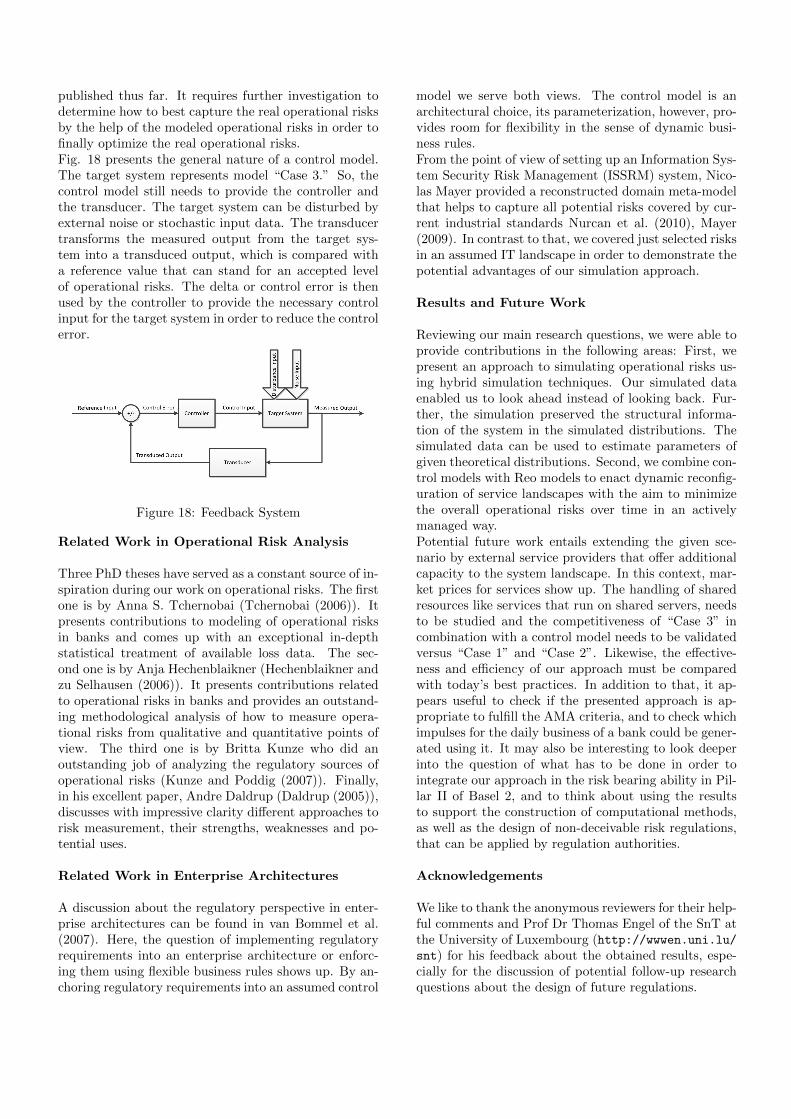
published thus far. It requires further investigation todetermine how to best capture the real operational risksby the help of the modeled operational risks in order tofinally optimize the real operational risks.Fig. 18 presents the general nature of a control model.The target system represents model “Case 3.” So, thecontrol model still needs to provide the controller andthe transducer. The target system can be disturbed byexternal noise or stochastic input data. The transducertransforms the measured output from the target sys-tem into a transduced output, which is compared witha reference value that can stand for an accepted levelof operational risks. The delta or control error is thenused by the controller to provide the necessary controlinput for the target system in order to reduce the controlerror.
Figure 18: Feedback System
Related Work in Operational Risk Analysis
Three PhD theses have served as a constant source of in-spiration during our work on operational risks. The firstone is by Anna S. Tchernobai (Tchernobai (2006)). Itpresents contributions to modeling of operational risksin banks and comes up with an exceptional in-depthstatistical treatment of available loss data. The sec-ond one is by Anja Hechenblaikner (Hechenblaikner andzu Selhausen (2006)). It presents contributions relatedto operational risks in banks and provides an outstand-ing methodological analysis of how to measure opera-tional risks from qualitative and quantitative points ofview. The third one is by Britta Kunze who did anoutstanding job of analyzing the regulatory sources ofoperational risks (Kunze and Poddig (2007)). Finally,in his excellent paper, Andre Daldrup (Daldrup (2005)),discusses with impressive clarity di↵erent approaches torisk measurement, their strengths, weaknesses and po-tential uses.
Related Work in Enterprise Architectures
A discussion about the regulatory perspective in enter-prise architectures can be found in van Bommel et al.(2007). Here, the question of implementing regulatoryrequirements into an enterprise architecture or enforc-ing them using flexible business rules shows up. By an-choring regulatory requirements into an assumed control
model we serve both views. The control model is anarchitectural choice, its parameterization, however, pro-vides room for flexibility in the sense of dynamic busi-ness rules.From the point of view of setting up an Information Sys-tem Security Risk Management (ISSRM) system, Nico-las Mayer provided a reconstructed domain meta-modelthat helps to capture all potential risks covered by cur-rent industrial standards Nurcan et al. (2010), Mayer(2009). In contrast to that, we covered just selected risksin an assumed IT landscape in order to demonstrate thepotential advantages of our simulation approach.
Results and Future Work
Reviewing our main research questions, we were able toprovide contributions in the following areas: First, wepresent an approach to simulating operational risks us-ing hybrid simulation techniques. Our simulated dataenabled us to look ahead instead of looking back. Fur-ther, the simulation preserved the structural informa-tion of the system in the simulated distributions. Thesimulated data can be used to estimate parameters ofgiven theoretical distributions. Second, we combine con-trol models with Reo models to enact dynamic reconfig-uration of service landscapes with the aim to minimizethe overall operational risks over time in an activelymanaged way.Potential future work entails extending the given sce-nario by external service providers that o↵er additionalcapacity to the system landscape. In this context, mar-ket prices for services show up. The handling of sharedresources like services that run on shared servers, needsto be studied and the competitiveness of “Case 3” incombination with a control model needs to be validatedversus “Case 1” and “Case 2”. Likewise, the e↵ective-ness and e�ciency of our approach must be comparedwith today’s best practices. In addition to that, it ap-pears useful to check if the presented approach is ap-propriate to fulfill the AMA criteria, and to check whichimpulses for the daily business of a bank could be gener-ated using it. It may also be interesting to look deeperinto the question of what has to be done in order tointegrate our approach in the risk bearing ability in Pil-lar II of Basel 2, and to think about using the resultsto support the construction of computational methods,as well as the design of non-deceivable risk regulations,that can be applied by regulation authorities.
Acknowledgements
We like to thank the anonymous reviewers for their help-ful comments and Prof Dr Thomas Engel of the SnT atthe University of Luxembourg (http://wwwen.uni.lu/snt) for his feedback about the obtained results, espe-cially for the discussion of potential follow-up researchquestions about the design of future regulations.

Notes
1This work has been partially sponsored by the Fonds National
de la Recherche Luxembourg (www.fnr.lu), via the PEARL pro-gramme.
2This work was carried out during the tenure of the ERCIM“Alain Bensoussan” Fellowship Programme. This Programme issupported by the Marie Curie Co-funding of Regional, Nationaland International Programmes (COFUND) of the European Com-mission.
3http://www.reo.project.cwi.nl
4http://www.3ds.com/products/catia/portfolio/dymola
5http://modelica.org/
6http://www.mathworks.nl/products/matlab/
7http://www.mathworks.nl/products/simulink/
8http://www.wolfram.com/mathematica/
9Credit Suisse (Luxembourg) S.A., P.O.BOX 40, 56, Grand-Rue, L-2010 Luxembourg.
REFERENCES
Arbab F., 2004. Reo: a channel-based coordinationmodel for component composition. MathematicalStructures in Computer Science, 14, no. 3, 329–366.
Brandt C. and Hermann F., 2013. Conformance Anal-ysis of Organizational Models in a new EnterpriseModeling Framework using Algebraic Graph Transfor-mation. International Journal of Information SystemModeling and Design (IJISMD), 4, no. 1.
Bubnicki Z., 2005. Modern control theory. Springer.ISBN 9783540239512.
Daldrup A., 2005. Kreditrisikomasse im Vergleich. Uni-versitat Gottingen, Wirtschaftsinformatik II - Ar-beitsbericht, , no. 13, 1–33. http://www2.as.wiwi.uni-goettingen.de/getfile?DateiID=571.
Faisst U., 2003. Ein Modell zur Steuerung operationellerRisiken in IT-unterstutzten Bankprozessen. InMultikonferenz Wirtschaftsinformatik 2004, Diskus-sionspapier WI-138. 1–19. http://www.wi-if.de/paperliste/paper/wi-138.pdf.
Giacometti R.; Rachev S.; Chernobai A.;Bertocchi M.; and Consigli G., year un-kown. Practical Operational Risk. http://statistik.ets.kit.edu/download/doc_secure1/JOR-Practical-Operational-Risk-GRCBC.pdf.
Hechenblaikner A. and zu Selhausen P., 2006. Opera-tional Risk in Banken: Eine Methodenkritische Anal-yse Der Messung Von It-Risiken. Bank- Und Fi-nanzwirtschaft. Deutscher Universitatsverlag. ISBN9783835004245.
Kunze B. and Poddig P., 2007. Uberwachung op-erationeller Risiken bei Banken: Interne und ex-terne Akteure im Rahmen qualitativer und quanti-tativer Uberwachung. Gabler Edition Wissenschaft.Deutscher Universitatsverlag. ISBN 9783835006430.
Mayer N., 2009. Model-based Management of Informa-tion System Security Risk. Ph.D. thesis, Universityof Namur. http://www.nmayer.eu/publis/Thesis_Mayer_2.0.pdf.
Nurcan S.; Salinesi C.; Souveyet C.; and Ra-lyte J., 2010. Intentional Perspectives on Infor-mation Systems Engineering. Springer. ISBN9783642125430. URL http://books.google.lu/books?id=4rc4_3gJPOIC.
on Banking Supervision B.C., 2006. International Con-vergence of Capital Measurement and Capital Stan-dards. Bank for International Settlements. http://www.bis.org/publ/bcbs128.pdf.
on Banking Supervision B.C., 2011a. Operational Risk- Supervisory Guidelines for the Advanced Measure-ment Approaches. Bank for International Settlements.ISBN 9789291318568. http://www.bis.org/publ/bcbs196.pdf.
on Banking Supervision B.C., 2011b. Principles forthe Sound Management of Operational Risk. Bankfor International Settlements. ISBN 9789291318575.http://www.bis.org/publ/bcbs195.pdf.
on Banking Supervision B.C., 2012. Consultative Docu-ment - Principles for e↵ective risk data aggregationand risk reporting. Bank for International Settle-ments. http://www.bis.org/publ/blbs222.pdf.
Saouma V. and Sivaselvan V., 2008. Hybrid Sim-ulation: Theory, Implementation and Applications.Balkema-proceedings and monographs in engineering,water, and earth sciences. Taylor & Francis. ISBN9780415465687.
Schal I., 2003. Die Quantifizierung und Steuerungvon operationellen Risiken. zeb. http://www4.wiwi.uni-karlsruhe.de/MITARBEITER/SCHAEL/OperationelleRisiken.pdf.
Tchernobai A.S., 2006. Contributions to Modeling ofOperational Risks in Banks. PhD Thesis. University ofCalifornia Santa Barbara. http://gradworks.umi.com/32/18/3218836.html.
van Bommel P.; Buitenhuis P.; Hoppenbrouwers S.; andProper E., 2007. Architecture Principles - A Regula-tive Perspective on Enterprise Architecture. In M. Re-ichert; S. Strecker; and K. Turowski (Eds.), EMISA.GI, LNI, vol. P-119. ISBN 978-3-88579-213-0, 47–60.