Embed Size (px)
Citation preview
K. K. Dagde, Y. T. Puyate / International Journal of Engineering Research and Applications
(IJERA) ISSN: 2248-9622 www.ijera.com
Vol. 2, Issue 5, September- October 2012, pp.698-714
698 | P a g e
Modelling And Simulation Of Industrial FCC Unit: Analysis
Based On Five-Lump Kinetic Scheme For Gas-Oil Cracking
K. K. Dagde* and Y. T. Puyate**
*(Department of Chemical/Petrochemical Engineering, Rivers State University of Science and Technology, Port
Harcourt, P. M. B. 5080, Port Harcourt, Nigeria)
**(Department of Chemical/Petrochemical Engineering, Rivers State University of Science and Technology,
Port Harcourt, P. M. B. 5080, Port Harcourt, Nigeria)
AbstractModels which describe the performance
of the riser and regenerator reactors of fluid
catalytic cracking (FCC) unit are presented. The
riser-reactor is modelled as a plug-flow reactor
operating adiabatically, using five-lump kinetics
for the cracking reactions. The regenerator-
reactor is divided into a dilute region and a dense
region, with the dense region divided into a
bubble-phase and an emulsion phase. The bubble-
phase of the regenerator is modelled as a plug-
flow reactor, while the emulsion phase is modelled
as a continuous stirred tank reactor. The models
are validated using plant data obtained from a
functional industrial FCC unit. It is shown that
predictions of the models compare very well with
plant data for both reactors. Simulation results
indicate that catalyst-to-gas oil ratio and inlet-air
velocity have significant effects on the
performance of the riser and regenerator reactors
respectively. The yield of gasoline and other
products of the catalytic cracking process increase
as the height of riser-reactor increases, with
maximum yield of gasoline (of about 0.45 mass
fraction) occurring about half-way up the riser-
height. Both the amount of coke on spent catalyst
and the riser-temperature decrease with time,
while the regenerator-temperature increases with
time. The riser-temperature varies from about
650K to 800K, while the regenerator-temperature
ranges from about 650K to 1080K. The optimum
values of process variables obtained for effective
operation of FCC are inlet-air velocity of 14m/s,
riser-temperature of about 653K, and catalyst-gas
oil ratio of 3.
Keywords: Riser, regenerator, kinetics, catalytic cracking, simulation.
1. Introduction Fluid catalytic cracking (FCC) is one of the
most important processes in the petroleum refinery;
employed for the conversion of straight-run
atmospheric gas-oil, vacuum residues, and other
related heavy stocks, into a broad spectrum of
products in the presence of a catalyst. The products
of catalytic cracking include fuel gases, liquefied
petroleum gas, high-octane gasoline, light fuel oil,
diesel fuel, heavy fuel oil, etc. FCC unit consists of a
reaction section and a fractionating section that
operates together as an integrated process unit. The
reaction section has two reactors: (i) the riser-reactor
where almost all the endothermic cracking reactions
and coke deposition on the catalyst occur, and (ii) the
regenerator-reactor, where air is used to burn-off the
accumulated coke on the catalyst. The catalyst-regeneration process also provides the heat required
for the endothermic cracking reactions in the riser-
reactor.
In the FCC unit, the catalyst enters the riser-
reactor as a dense bed and is pneumatically conveyed
upwards by the dispersing steam and vapourizing
gas-oil feed. It is during this period of conveying the
catalyst that catalytic cracking of gas-oil takes place
through efficient catalyst and gas-oil contact. The
catalyst later becomes deactivated due to coke
deposition on it, and the deactivated catalyst then passes through the spent-catalyst slide-valve in the
riser-reactor and enters the top of the regenerator.
The major purpose of the regenerator is to oxidize the
coke on the spent catalyst with oxygen to form CO,
CO2, and H2O, thereby reactivating the catalyst.
Compressed combustion-air enters the regenerator
from the bottom through a grid distribution pattern
designed to provide efficient mixing of air with
deactivated catalyst, resulting in a fluidized-bed
catalyst-regeneration operation. The regenerated
catalyst passes through the regenerated-catalyst slide-
valve and is mixed with gas-oil at the riser-reactor‟s base and the cycle is repeated. Provisions are made
for adding fresh catalyst makeup to maintain
inventory and for withdrawal of aged and
contaminated catalyst. The FCC unit is quite complex
from both the process modelling/simulation and
control points of view. The complexity of the FCC
unit is attributed to the strong interaction between the
riser and the regenerator reactors, and the uncertainty
in the cracking reactions, coke deposition, and coke
burning kinetics. The objective of FCC is to
maximize the yield of high octane gasoline and minimize coke formation to make it economically
attractive.

K. K. Dagde, Y. T. Puyate / International Journal of Engineering Research and Applications
(IJERA) ISSN: 2248-9622 www.ijera.com
Vol. 2, Issue 5, September- October 2012, pp.698-714
699 | P a g e
Lee and Grooves [1] developed a mathematical
model for fluid catalytic cracking using the three-
lump kinetic model of Weekman and Nace [2] for the
cracking reactions in the riser-reactor, where (1) gas-
oil (the feed and taken as one lump) is converted into
(2) light gases plus coke lump, and (3) gasoline. The
major disadvantage of this model is that it lumped coke and light hydrocarbon gases together despite the
different characteristics of these components.
However, the three-lump scheme is simple in
describing the cracking reactions and is able to
determine gas-oil conversion and gasoline yield
independently.
Several workers [3, 4, 5, 6] later used the
four-lump kinetic scheme of Lee et al. [7] which
accounts for coke formation on the catalyst, to model
and simulate fluid catalytic cracking process. In the
four-lump scheme, (1) gas-oil is converted into (2)
light gases (C1-C4), (3) coke, and (4) gasoline. The major disadvantage of this model is that it lumped the
hydrocarbon light gases and fuel gases (C1-C2)
together, making it impossible to predict the yield of
these gases independently.
Dagde et al. [8] applied five-lump kinetic
model for the cracking of vacuum gas-oil in which
(1) gas-oil is converted into (2) liquefied petroleum
gas (LPG, i.e. C3-C4), (3) gasoline, (4) coke, and (5)
fuel gases (dry gases, i.e. C1-C2). The riser-reactor
was modelled as a two-phase fluidized-bed reactor
assumed to operate isothermally, but the energy balance for the riser-reactor and analysis for catalyst-
regeneration in the regenerator-reactor were not
considered. Such a five-lump kinetic scheme allows
independent predictions of LPG and fuel gases which
are very significant and desirable in view of the
domestic, commercial, industrial, and laboratory
applications of these gases [9].
Other workers [10, 11, 12, 13] have also
presented models for fluid catalytic cracking using
ten-lump and eleven-lump kinetic schemes for the
cracking reactions in the riser-reactor, where the
various lumps are based on the molecular structure of the components. The feed was lumped into paraffins,
naphthenes, and aromatics, in both its heavy and light
fractions. The products were divided into two lumps,
with the first lump comprising products in the
gasoline range, while the second lump consists of
coke and light hydrocarbon gases. The drawbacks of
these models include mathematical complications in
the modelling procedures and lack of experimental
data to validate the models.
In the present paper, models for the riser and
regenerator reactors during catalytic cracking of gas-oil are presented. The coke combustion kinetics of
Morley and de Lasa [14] is employed in the
regenerator, while a five-lump kinetic scheme is
adopted for the catalytic cracking reactions where the
riser-reactor is modelled as a plug-flow reactor
operating adiabatically.
2. The FCC model
The fluid catalytic cracking (FCC) model equations
presented in this study are based on the schematic
flow diagram of the process depicted in Fig. 1. The
feed (gas-oil) enters the riser-reactor from the
bottom, and is cracked into various products in the
presence of a catalyst. The particle-separator vessel immediately above the riser acts as a disengaging
chamber where vapour products and heavy
components are separated from the catalyst using
stripping steam.
It is assumed that the stripping process completely
removes the hydrocarbon gases adsorbed inside the
catalyst pellets before the spent catalyst is sent to the
regenerator.
Figure 1: Schematic diagram of fluid catalytic
cracking unit.
The regenerator operates as a fluidized-bed
and consists of two regions, namely an upper “dilute
region” and a lower “dense region.” The dilute region
is the section between the top of the regenerator and
the boundary between the two regions, while the
dense region extends from the boundary between the two regions to the exit of the regenerator vessel (see
Fig. 1). The amount of solids entrained in the dilute
region is usually very small compared to the total
amount of catalyst retained in the regenerator vessel.
Most of the coke on the catalyst pellets is combusted
in the dense region, and full combustion of coke to
Flue Gas
Spent
catalyst
Hydrocarbon Products
Fresh
Catalyst
Gas Oil
REGENERATOR
RISER
Regenerated
catalyst
Particle separator Dilute Region
Dense Region
Heat
O2
CO2
CO
Emulsion
Phase
Bubble
Phase
Air
K. K. Dagde, Y. T. Puyate / International Journal of Engineering Research and Applications
(IJERA) ISSN: 2248-9622 www.ijera.com
Vol. 2, Issue 5, September- October 2012, pp.698-714
700 | P a g e
2CO is assumed in this region. Thus, the effect of
the dilute region on the overall performance of the
regenerator is ignored [4].
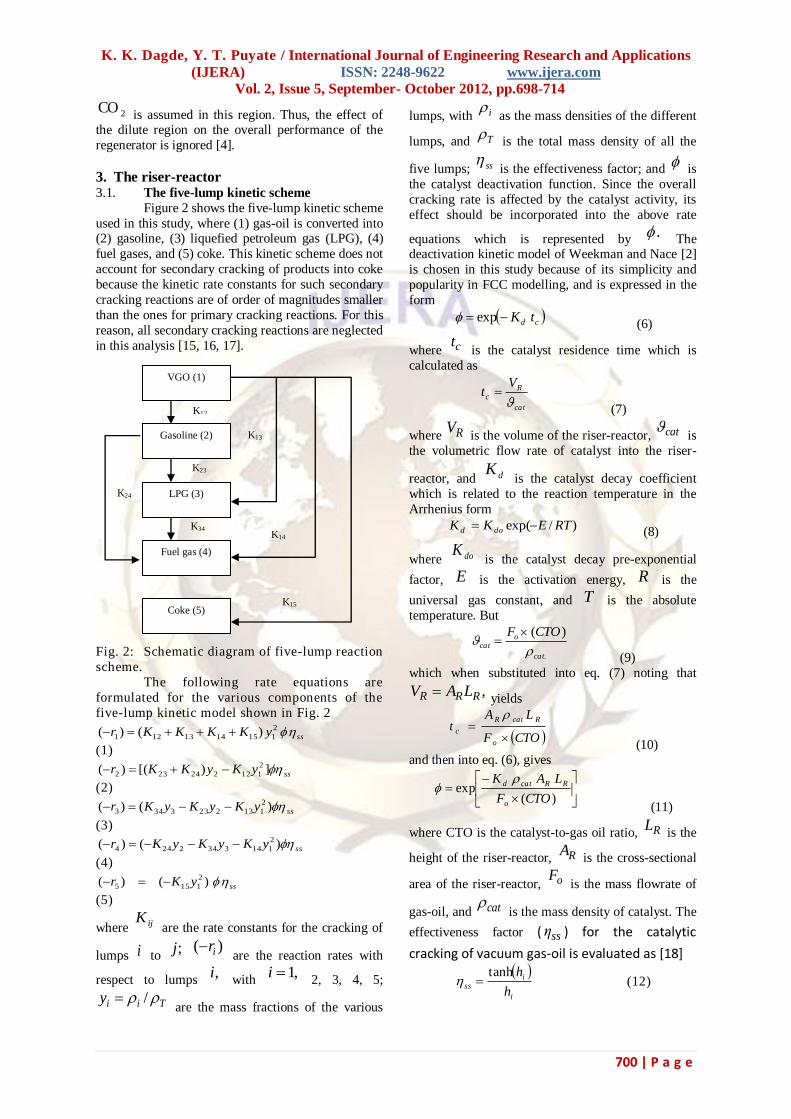
3. The riser-reactor 3.1. The five-lump kinetic scheme
Figure 2 shows the five-lump kinetic scheme
used in this study, where (1) gas-oil is converted into (2) gasoline, (3) liquefied petroleum gas (LPG), (4)
fuel gases, and (5) coke. This kinetic scheme does not
account for secondary cracking of products into coke
because the kinetic rate constants for such secondary
cracking reactions are of order of magnitudes smaller
than the ones for primary cracking reactions. For this
reason, all secondary cracking reactions are neglected
in this analysis [15, 16, 17].
Fig. 2: Schematic diagram of five-lump reaction
scheme.
The following rate equations are
formulated for the various components of the
five-lump kinetic model shown in Fig. 2
ssyKKKKr 2
1151413121 )()(
(1)
ssyKyKKr ])[()( 2
112224232
(2)
ssyKyKyKr )()( 2
1132233343
(3)
ssyKyKyKr )()( 2
1143342244
(4)
ssyKr )()( 2
1155
(5)
where ijK are the rate constants for the cracking of
lumps i to ;j
)( ir are the reaction rates with
respect to lumps ,i
with ,1i
2, 3, 4, 5;
Tiiy / are the mass fractions of the various
lumps, with i as the mass densities of the different
lumps, and T is the total mass density of all the
five lumps; ss is the effectiveness factor; and
is
the catalyst deactivation function. Since the overall
cracking rate is affected by the catalyst activity, its
effect should be incorporated into the above rate
equations which is represented by . The
deactivation kinetic model of Weekman and Nace [2]
is chosen in this study because of its simplicity and
popularity in FCC modelling, and is expressed in the
form
cd tK exp (6)
where ct is the catalyst residence time which is
calculated as
cat
Rc
Vt
(7)
where RV is the volume of the riser-reactor, cat
is
the volumetric flow rate of catalyst into the riser-
reactor, and dK is the catalyst decay coefficient
which is related to the reaction temperature in the
Arrhenius form
)/exp( RTEKK dod (8)
where doK is the catalyst decay pre-exponential
factor, E is the activation energy, R is the
universal gas constant, and T is the absolute
temperature. But
.
)(
cat
ocat
CTOF
(9)
which when substituted into eq. (7) noting that
,RRR LAV yields
CTOF
LAt
o
RcatR
c
(10) and then into eq. (6), gives
)(exp
CTOF
LAK
o
RRcatd
(11)
where CTO is the catalyst-to-gas oil ratio, RL is the
height of the riser-reactor, RA is the cross-sectional
area of the riser-reactor, oF is the mass flowrate of
gas-oil, and cat is the mass density of catalyst. The
effectiveness factor ( ssη ) for the catalytic
cracking of vacuum gas-oil is evaluated as [18]
i
iss
h
htanh (12)
VGO (1)
Gasoline (2)
LPG (3)
Fuel gas (4)
Coke (5)
K12
K34
K13
K14
K15
K23
K24
K. K. Dagde, Y. T. Puyate / International Journal of Engineering Research and Applications
(IJERA) ISSN: 2248-9622 www.ijera.com
Vol. 2, Issue 5, September- October 2012, pp.698-714
701 | P a g e
where ih is a modified Thiele modulus given as
eff
n
iicat
ext
iD
CKn
ah
1
2
)1(1
(13)
where n is the order of reaction (equal to 2 for gas-
oil cracking); extαis the catalyst-specific external
surface area; iK are the kinetic rate constants of the
respective lumps; effD is the effective diffusivity of
gas-oil through the catalyst, and iC is the molar
concentration of the various lumps.
It is important to note that extα in eq. (13) can be
defined using the characteristic dimension, ,ZL of
the Zeolite crystallite (i.e. catalyst particle size) since
all the cracking reactions take place in the Zeolite
crystallite with little influence from the matrix of the catalyst [19]. Therefore, approximating the crystallite
geometry to be a sphere, gives the catalyst-specific
external surface area as [17]
Z
extL
6
(14) which when substituted into eq. (13) yields the
following expression for gas-oil:
eff
ocatZ
oD
CKKKKKLh
)(
2
3
6
1615141312
(15)
where the subscript “o” indicates gas-oil. It is
expected that diffusion of gas-oil takes place in a
USY Zeolite, and the effective diffusion coefficient
of gas-oil ( effD) is given by the Erying equation
[20].
RTEDD Dpeff /exp (16)
where pD is the pre-exponential factor for diffusion,
and DE is the activation energy for diffusion.
Model of the riser-reactor
In the derivation of the mathematical model
of the riser-reactor, the following assumptions are
made:
Axial dispersion in the riser-reactor is negligible.
Catalyst particles have a uniform size in a given
differential element, and both gas-oil and gasoline
have identical activity decay function [21] The riser wall is adiabatic.
Feed viscosity and heat capacities of all components
are constant. Adsorption and dispersion inside the catalysts
particles are negligible.
Pressure changes throughout the riser-height are due
to static head of catalyst in the riser.
Coke deposition on the catalyst does not affect the
fluid flow.
In each section of the riser-reactor, the
catalyst and gas have the same temperature.
The coke has the same specific heat as the catalyst.
The riser dynamic is fast enough to justify plug-flow
characteristics and a quasi-steady state model. Instantaneous vaporization occurs at the entrance of
the riser-reactor [4].
Cracking reactions are completed in the
riser-reactor.
Applying the conservation principle to a control
volume (dLAR ) of a plug-flow riser-reactor based
on the above assumptions, where dL is the
differential height of the reactor‟s control volume,
gives the mass and energy balances as
ssR
R
yKKKK
rdL
dyU
dt
dy
2
115141312
111
)(
)(
(17)
ssR
R
yKyKK
rdL
dyU
dt
dy
])[(
)(
2
11222423
222
(18)
ssR
R
yKyKyK
rdL
dyU
dt
dy
)(
)(
2
113223334
333
(19)
ssR
R
yKyKyK
rdL
dyU
dt
dy
)(
)(
2
114334224
444
(20)
ssRR yKrdL
dyU
dt
dy )()( 2
115555 (21)
dL
dTR )( pooPcatcat
RoR
CFCF
A
)(
)()(
)()(
)()(
34343
242423232
15151414
131312122
1
HKy
HKHKy
HKHK
HKHKy
(22)
where R is the average void fraction in the riser-
reactor, RT is the temperature of the riser-reactor,
U is the riser superficial velocity, catF is the mass
flow rate of catalyst, pcatCand poC
are the
specific heat capacities of catalyst and gas-oil
respectively, ijH are the heat of reaction for the
cracking of component i to j
, and L is the variable height of the riser-reactor.
Since gas-oil is the feed which is cracked into the
various products, the mass fraction of gas-oil at the

K. K. Dagde, Y. T. Puyate / International Journal of Engineering Research and Applications
(IJERA) ISSN: 2248-9622 www.ijera.com
Vol. 2, Issue 5, September- October 2012, pp.698-714
702 | P a g e
inlet ( 0L ) of the riser-reactor is unity, while the
mass fractions of the products at the inlet are equal to
zero because no product is formed at the inlet of the riser-reactor. Also, at the inlet of the riser-reactor, the
feed temperature is taken to be a reference
temperature ( refT) equal to 800K [22]. These
boundary conditions at the inlet of the riser-reactor
are defined mathematically as
refR
i
TT
y
y
L 0
1
:0
1
i = 2, 3, 4, 5 (23)
We define the following dimensionless variables
RL
LZ (24)
ref
RR
T
T (25)
where Z is the dimensionless height of the riser-
reactor, and Rθ is the dimensionless riser-
temperature. Using eqs. (24) and (25) in eqs. (17) –
(22), and noting that
R
o
AU
=
Ro
o
A
F
(26)
gives
0)( 2
1151413121 ss
o
oRRR yKKKKF
LA
dZ
dy
(27)
0])[( 2
112224232 ss
o
oRRR yKyKKF
LA
dZ
dy
(28)
0)( 2
1132233343 ss
o
oRRR yKyKyKF
LA
dZ
dy
(29)
0)( 2
1143342244 ss
o
oRRR yKyKyKF
LA
dZ
dy
(30)
0)( 2115
5 sso
oRRR yKF
LA
dZ
dy
(31)
refpoopcatcat
oRRRR
TCFCF
LA
dZ
d
)(
0
)(
)()(
)()(
)()(
34343
242423232
15151414
131312122
1
HKy
HKHKy
HKHK
HKHKy
(32)
and the boundary conditions (23) become
:0Z
1
0
1
5432
1
R
yyyy
y
(33)
where o is the volumetric flow rate of gas-
oil. Equation (27)–(32) were solved numerically
using a fourth-order Runge-Kutta algorithm using the
boundary conditions (33).
4. The regenerator
4.1. Regenerator combustion kinetics
Usually, coke is a mixture of different
components (carbon, hydrogen, nitrogen, sulphur,
etc.), but mainly carbon [4] Thus, during catalyst
regeneration in FCC unit, coke is burnt to produce
carbon monoxide and carbon dioxide [11, 13]. Also,
the homogeneousCO
combustion reaction taking place in the bubble-phase is assumed to be negligible
compared with the catalytic CO combustion in the
emulsion phase [23,4]. The following irreversible
coke combustion reactions occur in the emulsion
phase of the regenerator [24].
HeatCOOC CK 22 (34)
HeatCOOC CK 22
1
(35)
HeatCOOCO COK 222
1
(36)
where CK is the reaction rate constant for coke
burning, and COK is the reaction rate constant for
the catalyticCO
combustion. Equation (36) is the “after-burning” reaction which takes place in the
dense region if sufficient oxygen is supplied to
support it. The reaction which goes to completion in
the dense region of the regenerator to fully regenerate the catalyst is called the “controlled-after-burning”
reaction. However, CO
burning is usually initiated
by using a promoter, which is a catalyst that speeds
up the reaction of carbon monoxide to carbon dioxide. The promoter, usually a metal like platinum,
is attached to the FCC catalyst during manufacturing.
Platinum-based combustion promoters have been
utilized in FCC units to catalyze the oxidation of CO
to 2CO for over 30 years [25, 26, 27]. The better
the dispersion of platinum, the more effective is the
combustion of coke. The rate expressions for the
component gases in the emulsion-phase are obtained
as follows.
Coke (C): 2)( COCKr CSCC (37)
Oxygen (O2): 2/1
2 22)( OCOCOCSO CCKCOCKr
(38)
Carbon dioxide (CO2): 2/1
2 22)( OCOCOCSCO CCKCOCKr
(39) Carbon monoxide (CO):
2/1
2 2)( OCSCOCSCO CCKCOCKr
(40)
where )( Cr is the rate of coke combustion;
)( ir
are the rates of combustion of individual components
of the flue gases (i.e. exit gases), with 2Oi,CO,

K. K. Dagde, Y. T. Puyate / International Journal of Engineering Research and Applications
(IJERA) ISSN: 2248-9622 www.ijera.com
Vol. 2, Issue 5, September- October 2012, pp.698-714
703 | P a g e
;CO 2 CSC is the molar concentration of coke on
spent catalyst; iC are the molar concentrations of the
flue gases; ,K
, K
and , K
are the rate constants in eqs. (37) – (40) defined as follows [4, 5]
CKK
1
1
for CO balance (41)
CKK
1
for CO2 balance (42)
CKK
22
2
for O2 balance (43)
where COCO /2
is the intrinsic ratio of carbon dioxide to carbon monoxide. The mole
fractions of the various flue gases are expressed with
respect to the molar concentration of oxygen in the
feed air, in the form
fO
O
OC
Cy
2
2
2
(44)
fO
COCO
C
Cy
2
(45)
fO
CO
COC
Cy
2
2
2
(46)
where fOC2 is the molar concentration of
oxygen in the feed air, and the prime indicates mole
fraction.
4.2. Model of the regenerator-reactor
Here, we are concerned with only the dense region since the effect of the dilute region on the
dynamics of the regenerator is ignored as indicated
above. The dense region is divided into a bubble-
phase and an emulsion-phase [28]. The emulsion-
phase is assumed to be a bed at minimum fluidization
velocity, and coke combustion reactions occur in this
phase. The air distributors, spent catalyst, and
cyclones recycles pipes in the emulsion-phase
produce enough turbulence which justifies this phase
to be modelled as a continuous stirred tank reactor.
The bubble-phase, on the other hand, is dominated by
gases at high velocity compared with the velocity in the emulsion-phase. Hence, the bubble-phase moves
as plug-flow and exchanges mass and heat with the
emulsion-phase without coke combustion reaction
due to its deficiency in catalyst particles [6]. In the
derivation of the mathematical model for catalyst
regeneration, the following assumptions are made:
Unsteady state conditions for the energy and
coke combustion balances in the emulsion-phase due
to the high density of catalyst [4], and Steady state
condition for the same operations in the bubble-phase
due to low solid density.
The homogeneous combustion reaction
taking place in the bubble-phase is negligible
compared with the catalytic CO combustion in the
emulsion-phase [14, 4]
Mass balance for coke combustion in the emulsion-
phase
Application of the law of conservation of mass to
coke combustion in the emulsion-phase based on the
above assumptions, gives
d
dL
L
y
U
Lr
UAL
yy
d
dy GI
GI
S
a
GSSC
aEGGI
SSRRS
)1( (47)
where the dimensionless rate of change of catalyst-
bed height is obtained as
aEcatG
RSGI
UAd
dL
)1(
(48) The dimensionless variables in eqs. (47) and (48),
and the volume of the regenerator, are defined as
cat
SSy
;
;cat
RRy
;1 EGGG LAV
;GSS
GGI
L
LL
GSS
a
L
tU
(49)
where Sy is the mass fraction of spent catalyst, Ry
is the mass fraction of regenerated catalyst, S is
the mass density of spent catalyst, R is the mass
density of regenerated catalyst, cat is the mass
density of catalyst, GV is the volume of the
regenerator, is the dimensionless time, GIL is the
dimensionless catalyst-bed height, GLis catalyst-bed
height, GA is the cross-sectional area of the
regenerator, E is the void fraction in the emulsion-
phase, GSSL is the steady-state catalyst-bed height,
and S and R are the volumetric flowrates of
spent and regenerated catalyst respectively.
Mass balance for gases in the bubble-phase
In the bubble-phase, steady-state operation
is assumed because of the high velocity of gases, and
it is also assumed that no combustion reaction takes
place in this phase due to low density of catalyst. Application of the law of conservation of mass to
gases in the bubble-phase, with the assumptions of no
accumulation of gases and without coke combustion
reactions, gives the material balance for the flue
gases as
ieibB
a
GSSbe
GI
ib yyU
LK
dL
dy
1
(50)

K. K. Dagde, Y. T. Puyate / International Journal of Engineering Research and Applications
(IJERA) ISSN: 2248-9622 www.ijera.com
Vol. 2, Issue 5, September- October 2012, pp.698-714
704 | P a g e
where beK is the mass-transfer coefficient
between the bubble and emulsion phases, B is the
void fraction in the bubble-phase, iey and iby
are
mass fractions of gases in the emulsion and bubble
phases respectively and are defined as
,TG
ibiby
TG
ieiey
(51)
with 2Oi, CO ,
;CO 2 ib and ie
are the mass densities of gases in the bubble and emulsion
phases respectively, and TG is the total mass
density of gases in the regenerator.
Mass balance for gases in the emulsion-
phase
Application of the law of conservation of mass to
gases in the emulsion-phase, with accumulation of
gases and coke combustion reactions, gives the
material balance for the flue gases as
a
GSSieibbe
a
GSSi
aEGI
ieieoieoie
U
LyyK
U
Lr
UL
yyU
d
dy
)1(
)(
(52)
where ieoU is the incipient velocity in the
emulsion-phase, ieoy are the initial mass fractions of
the respective gases in the emulsion-phase, and
)( ir are the reaction rates of the flue gases in the
emulsion-phase.
Energy balance in the bubble-phase
Application of the law of conservation of
energy to gases in the bubble-phase based on the
above assumptions, gives the energy balance in this
phase as
b
GSSBebbe
GI
b
U
LTTH
dL
Td )1()(
(53)
with
,ref
bb
T
TT
ref
ee
T
TT
(54)
where, bT and eT
are the dimensionless
temperatures in the bubble and emulsion phases
respectively, bT is the bubble-phase temperature, eT
is the temperature in the emulsion-phase, refT is a
reference temperature taken to be 960K [22], beH is
the heat-transfer coefficient between the bubble and
emulsion phases, and bU is the bubble velocity.
Energy balance in the emulsion-phase
Application of the law of conservation of
energy to coke on spent and regenerated catalysts as
well as the gases in the emulsion-phase, with coke
combustion reactions, accumulation of gases, and
transfer of heat between the bubble and emulsion
phases, gives the energy balance in this phase as
)(
)(
)()1(
)(
R
RS
R
pRpieieGIGa
eRpRRSpS
pRpieieEGIGa
epieieieaoieopieoieoe
CCLAU
TCTC
CCLAU
TCTC
d
Td
)(
))(())((1
2
refapRpieie
GSS
n
iRCCOiie
TUCC
LrHrH
R
d
dL
L
T
UCC
TTLH GI
GI
e
apRpieie
ebGSSbe
R
)(
)( (55)
with
ref
aoao
T
TT ,
ref
RR
T
TT (56)
where ieo and ie
are the volumetric flow rates of flue gases at the inlet and outlet of the
emulsion-phase; aoT is the dimensionless inlet air
temperature of the regenerator, ieo and ie
are the
mass densities of the flue gases at the inlet and outlet
of the emulsion-phase respectively, 2O is the mass
density of gas (oxygen) in the emulsion-phase, pieoC
and pieC
are the specific heat capacities of the flue gases at the inlet and outlet of the emulsion-phase
respectively, SpC and RpC
are the specific heat
capacities of spent catalyst and regenerated catalyst
respectively which are taken to be equal, ieΔH are
the heat of reaction of the flue gases in the emulsion-
phase, CΔH is the heat of reaction for coke
combustion,
is the specific area for heat transfer
between the bubble and emulsion phases, and RT is
the dimensionless temperature of the riser. Note that the inlet temperature of the regenerator is partly the
temperature of the spent catalysts entering the
regenerator from the riser, and partly the inlet-air
temperature.
5. Hydrodynamic specifications
The interchange mass-transfer coefficients
between the bubble and emulsion phases are related
in the form [28]
bccebe KKK
111
(57)
with
K. K. Dagde, Y. T. Puyate / International Journal of Engineering Research and Applications
(IJERA) ISSN: 2248-9622 www.ijera.com
Vol. 2, Issue 5, September- October 2012, pp.698-714
705 | P a g e
2/1
377.6
b
brmf
ced
DUK
(58)
and
4/5
4/12/185.55.4
bb
mf
bcd
gD
d
UK
(59)
where ceK is the mass-transfer coefficient between
the cloud and emulsion phases, bcK is mass-transfer
coefficient between the bubble and cloud phases, bd
is the effective bubble diameter, D is air diffusivity
through the catalyst, g
is the acceleration due to
gravity, mf is the voidage at minimum fluidization,
and brU is the rise-velocity of a single bubble in the
bed and is given by [29]
2/1)(711.0 bbr gdU (60)
Accordingly, the interchange heat-transfer
coefficients between the bubble and emulsion phases
may be expressed as
bccebe HHH
111
(61)
with (Kuni and Levenspiel, 1991)
4/5
4/12/1)(85.55.4
b
pgGoGo
b
pgGomf
bcd
gCK
d
CUH
(62)
where Go is the density of the gas mixture, pgC
is the specific heat capacity of the gas mixture, GoK
is the thermal conductivity of the gas mixture, ceH
is the heat-transfer coefficient between the cloud and
emulsion phases, and bcH is the heat-transfer
coefficient between the bubble and cloud phases. By
comparing the expressions for bcK and bcH
above,
a corresponding expression for ceH may be
obtained through the expression for ceK as
2/1
377.6
b
brmfpgGoGo
ced
UCKH
(63) The flow velocities in the analysis are related in the
form (Froment and Bischoff, 1990)
brmfab UUUU (64)
where mfU is the minimum fluidization
velocity in the emulsion-phase of the regenerator, and
aU is the superficial inlet-air velocity into the
regenerator. The exit concentrations of the flue gases
and exit temperatures from the emulsion and bubble
phases are given as [30]
eb OOO yyy
2221
(65)
eb COCOCO yyy
2221
(66)
eb COCOCO yyy 1
(67)
ebe TTT 1 (68)
where
a
mf
U
U 1
(69)
and the subscripts e and b indicate emulsion-phase
and bubble-phase respectively.
6. Estimation of kinetic parameters 6.1. Kinetic parameters for cracking reactions
in the riser-reactor
The riser-reactor model equations contain
unknown kinetic parameters such as the reaction rate
constants ( iK) for the various reaction paths, and the
catalyst deactivation function (
). These constants have to be determined before eqs. (27)-(32) can be
integrated. The kinetic parameters for the cracking
reactions based on the five-lump kinetic model are
presented in Table 1.
The reaction rate constants are functions of
temperature and are generally given by the Arrhenius
relation [18]
RT
EKK i
ioi exp
(70)
where the prime indicates values of iK predicted by
eq. (70), ioK are the preexponential kinetic
constants for the respective lumps, and iE are the
activation energies of the different lumps. The rate
constants ( iK) and the stoichiometric coefficients
( ijV) of the various lumps are expressed as [30]
;11 KVK og
g
o
ogM
MV (71)
;22 KVK oLPG LPG
ooLPG
M
MV (72)
;33 KVK od
d
ood
M
MV (73)
;44 KVK oc
c
ooc
M
MV (74)
;55 KVK gLPG
LPG
g
gLPGM
MV (75)
;66 KVK gd
d
g
gdM
MV (76)
K. K. Dagde, Y. T. Puyate / International Journal of Engineering Research and Applications
(IJERA) ISSN: 2248-9622 www.ijera.com
Vol. 2, Issue 5, September- October 2012, pp.698-714
706 | P a g e
;77 KVK LPGd
d
LPGLPGd
M
MV (77)
where oM is the molecular weight of gas-oil, gM
is
the molecular weight of gasoline, LPGMis the
molecular weight of LPG, cM is the molecular
weight of coke, and dM is the molecular weight of
dry gas.
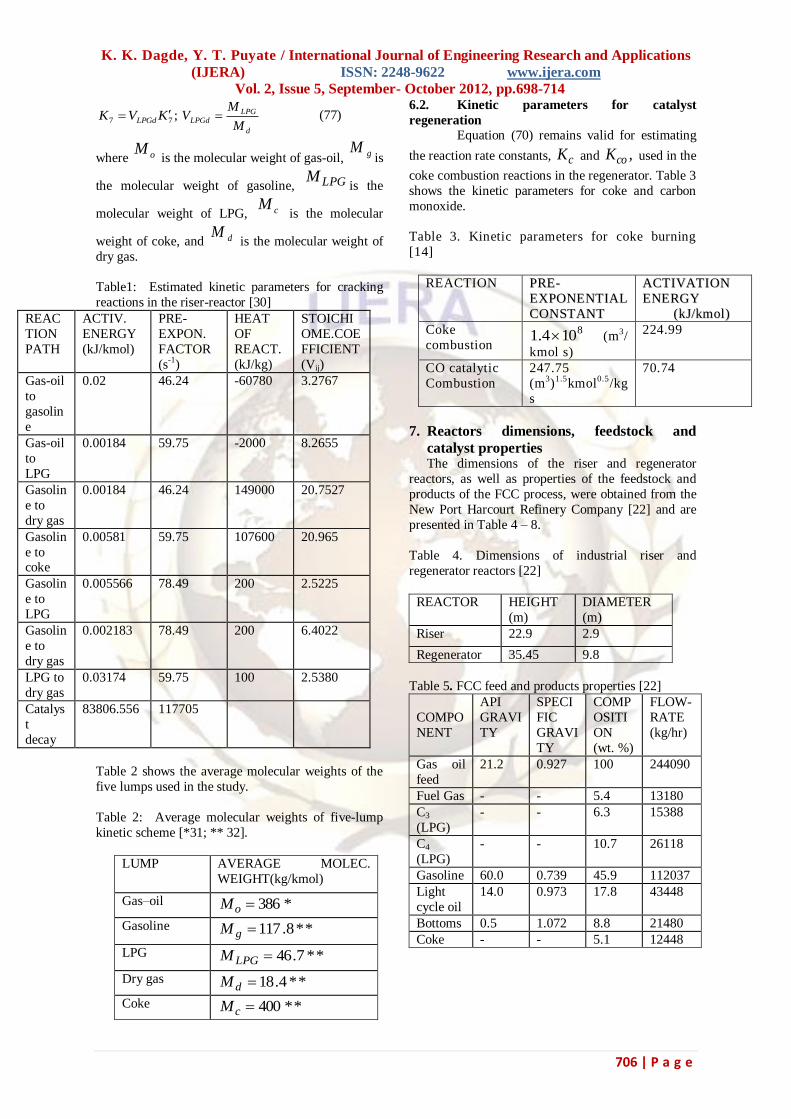
Table1: Estimated kinetic parameters for cracking
reactions in the riser-reactor [30]
REAC
TION
PATH
ACTIV.
ENERGY
(kJ/kmol)
PRE-
EXPON.
FACTOR
(s-1)
HEAT
OF
REACT.
(kJ/kg)
STOICHI
OME.COE
FFICIENT
(Vij)
Gas-oil
to
gasolin
e
0.02 46.24 -60780 3.2767
Gas-oil
to
LPG
0.00184 59.75 -2000 8.2655
Gasolin
e to
dry gas
0.00184 46.24 149000 20.7527
Gasolin
e to coke
0.00581 59.75 107600 20.965
Gasolin
e to
LPG
0.005566 78.49 200 2.5225
Gasolin
e to
dry gas
0.002183 78.49 200 6.4022
LPG to
dry gas
0.03174 59.75 100 2.5380
Catalys
t
decay
83806.556 117705
Table 2 shows the average molecular weights of the
five lumps used in the study.
Table 2: Average molecular weights of five-lump
kinetic scheme [*31; ** 32].
LUMP AVERAGE MOLEC.
WEIGHT(kg/kmol)
Gas–oil *386oM
Gasoline **8.117gM
LPG **7.46LPGM
Dry gas **4.18dM
Coke **400cM
6.2. Kinetic parameters for catalyst
regeneration
Equation (70) remains valid for estimating
the reaction rate constants, cK and ,coK used in the
coke combustion reactions in the regenerator. Table 3
shows the kinetic parameters for coke and carbon
monoxide.
Table 3. Kinetic parameters for coke burning
[14]
REACTION PPRREE--
EEXXPPOONNEENNTTIIAALL
CCOONNSSTTAANNTT
AACCTTIIVVAATTIIOONN
EENNEERRGGYY
((kkJJ//kkmmooll ))
Coke
combustion
8104.1 (m3/
kmol s)
224.99
CO catalytic
Combustion
247.75
(m3)1.5kmol0.5/kg
s
70.74
7. Reactors dimensions, feedstock and
catalyst properties The dimensions of the riser and regenerator
reactors, as well as properties of the feedstock and
products of the FCC process, were obtained from the
New Port Harcourt Refinery Company [22] and are
presented in Table 4 – 8.
Table 4. Dimensions of industrial riser and
regenerator reactors [22]
REACTOR HEIGHT
(m)
DIAMETER
(m)
Riser 22.9 2.9
Regenerator 35.45 9.8
Table 5. FCC feed and products properties [22]
COMPO
NENT
API
GRAVI
TY
SPECI
FIC
GRAVI
TY
COMP
OSITI
ON
(wt. %)
FLOW-
RATE
(kg/hr)
Gas oil
feed
21.2 0.927 100 244090
Fuel Gas - - 5.4 13180
C3
(LPG)
- - 6.3 15388
C4
(LPG)
- - 10.7 26118
Gasoline 60.0 0.739 45.9 112037
Light
cycle oil
14.0 0.973 17.8 43448
Bottoms 0.5 1.072 8.8 21480
Coke - - 5.1 12448

K. K. Dagde, Y. T. Puyate / International Journal of Engineering Research and Applications
(IJERA) ISSN: 2248-9622 www.ijera.com
Vol. 2, Issue 5, September- October 2012, pp.698-714
707 | P a g e
Table 6. Physical properties of gas–oil [22]
PARAMETER VALUE
Vapour density (kg/m3) 9.52
Liquid density at 288oK (kg/m3) 924.8
Specific heat (gas), (kJ/kg K) 3.3
Specific heat (liquid), (kJ/kg K) 2.67
Heat of vapourization (kJ/kg) 156
Vapourization temperature (K) 698
Flowrate (kg/s) 68.05
Inlet temperature (K) 797
Table 7. Physcial properties of catalyst [33, 22]
PARAMETER VALUE
Particle size (m) 61075
Specific heat capacity (kJ/kg K) 1.12
Mass flowrate from riser to
regenerator (kg/hr)
1729750
Bulk density (kg/m3) 975
Mass flowrate (kg/s) 480.49
Inlet temperature (K) 975
Holdup in the regenerator (kg)
5000–70000
Table 8. Physical properties of air [4].
PARAMETER VALUE
Density (kg/m3) 1.03
Specific heat capacity (kJ/kg K) 1.206
Bubble-emulsion
mass-transfer coefficient (s–1)
0.5
Bubble-emulsion
heat-transfer coefficient (kJ/m2s
K)
0.84
Flowrate (m3/s) 43.2466
Inlet temperature (K) 370
8. Results and Discussion
Table 9 shows the comparison between
model-predictions and plant data for the riser-
reactors, while the comparison between model-
predictions and plant data for the regenerator-reactor
is shown in Table 10.
Table 9. Comparison between model-predictions and
plant data for the riser- reactor
PARAMETER MODEL
PREDICTION
PLANT
DATA
Weight fraction of
LPG (C3-C4)
0.1704 0.17
Weight fraction of
hydrocarbon fuel
gases (C1-C2)
0.0546 0.054
Weight fraction of
coke 0.0511
0.051
Weight fraction of
gas oil 0.2654 0.266
Outlet temperature
of riser (K) 652.7 658.00
Table 10. Comparison between model-predictions
and plant data for the regenerator
PARAMETER MODEL
PREDICTION
PLANT
DATA
Temperature (K) 1015.07 1016.48
Coke (wt. %) 0.00686 0.007
O2 (mol. %) 0.0312 0.03
CO2 (mol. %) 0.161 0.16
CO (mol. %) 0.0568 0.00
It may be seen from Tables 9 and 10 that the model-
predictions compare very well with the plant data,
indicating that the models presented for the riser and
regenerator reactors are adequate. For proper catalyst regeneration with low carbon content on the
regenerated catalyst and complete burning of CO to
CO2, there must be excess oxygen concentration of 1
to 4 mol.% [34] in the regenerator which is consistent
with the plant-value of oxygen and model-prediction
in Table 10. Although carbon monoxide was not
detected in the flue gases of the plant data, the model-
predicted 5.7 mol.% of carbon monoxide in the flue
gases is recommended for combustion in the CO
boiler to generate superheated steam and energy for
the plant.
Figure 3 shows the variations of the mass fractions of gas-oil and products of the cracking
process along the height of the riser-reactor. The
mass fraction of gasoline increases with the
height of the riser-reactor to a maximum value of
about 0.45 corresponding to dimensionless riser-
height of about 0.55, where the total
dimensionless height of the riser-reactor is unity (
=1); thereafter, the mass fraction of gasoline
remains approximately constant at the maximum
value as the dimensionless riser-height increases
beyond 0.55. The mass fractions of LPG, fuel gases, and coke, increase steadily as the height of
riser-reactor increases, while the mass fraction
gas-oil decreases exponentially along the height
of the riser-reactor as it is cracked into the
various products.

K. K. Dagde, Y. T. Puyate / International Journal of Engineering Research and Applications
(IJERA) ISSN: 2248-9622 www.ijera.com
Vol. 2, Issue 5, September- October 2012, pp.698-714
708 | P a g e
0
0.1
0.2
0.3
0.4
0.5
0.6
0.7
0.8
0.9
1
0 0.2 0.4 0.6 0.8 1
Dimensionless Height of Riser-Reactor
Mass F
racti
on
Gas-Oil Gasoline
LPG Fuel Gases
Coke
Figure 3. Variations of mass fractions of gas–oil,
gasoline, LPG, fuel gases, and coke, along
dimensionless height of riser-reactor
Figure 4 shows plots of mole fraction of the
flue gases against dimensionless time, indicating that
the concentration of oxygen increases rapidly with time to a maximum value of 0.0742 at a
dimensionless time of 0.025, and then decreases
continuously to 0.0312 at a dimensionless time of
unity. We note in Fig. 4 that initial concentrations of
oxygen, carbon monoxide, and carbon dioxide were
chosen [5] in order to simulate the models. Thus, the
initial rapid increase in the concentrations of theses
gases in Fig. 4 may indicate that the chosen initial
concentrations of the gases are less than their „actual‟
concentrations at the beginning of coke combustion
As the combustion process progresses, oxygen from the inlet air reacts with coke on the spent catalyst to
produce carbon monoxide and carbon dioxide, so the
concentration of oxygen in the exit gases decreases
with time while the concentrations of carbon
monoxide and carbon dioxide increase with time.
Figure 4. Variation of mole percent of flue gases with
dimensionless time
In Fig. 4, the concentration of carbon
dioxide increases continuously with time, while the
concentration of carbon monoxide increases to a
maximum value and then decreases from the
maximum value with time. Although the decrease in
concentration of carbon monoxide with time from the
maximum value may be due to its conversion to carbon dioxide, this conversion process cannot be
attributed to the presence of significant quantity of
oxygen in the regenerator since oxygen also
decreases with time during the period of carbon
monoxide depletion. Hence, the decrease in
concentration of carbon monoxide with time in Fig. 4
after attaining the maximum value may be due to the
contribution of combustion promoter which sustains
and speeds up the reaction of carbon monoxide to
carbon dioxide.
Figure 5 shows the variations of the amount of coke
burnt in the regenerator, as well as riser and regenerator temperatures, with dimensionless time.
The amount of coke burnt in the regenerator
decreases tremendously with time, which is a result
of the decrease in the amount of coke on the spent
catalyst with time.
.

K. K. Dagde, Y. T. Puyate / International Journal of Engineering Research and Applications
(IJERA) ISSN: 2248-9622 www.ijera.com
Vol. 2, Issue 5, September- October 2012, pp.698-714
709 | P a g e
0.00E +00
1.00E -02
2.00E -02
3.00E -02
4.00E -02
5.00E -02
6.00E -02
0 0.2 0.4 0.6 0.8 1
Dimensionless Time
Coke B
urnt (
wt.%
)
200
300
400
500
600
700
800
900
1000
1100
Tem
perature (
K)
Coke Burnt
Riser Reactor Temperature
Regenerator Temperature
Figure 5. Variations of amount of coke burnt, riser
and regenerator temperatures,
with dimensionless time
The increase in temperature of the regenerator with time is due to the exothermic coke combustion
reaction taking place in this vessel, while the
decrease in temperature of the riser-reactor with time
is due the endothermic cracking reactions.
8.1 Sensitivity Analysis
A simulation model can be used to optimize
plant performance by choosing the optimal set of
operating conditions. However, before optimizing
such a process, it is important to determine how
sensitive a process is with respect to decision
variables. In this section, the effects of catalyst-to-gas oil ratio (CTO) and inlet-air velocity on the
performance of the FCC unit are investigated. Figure 6 shows the effect of catalyst-to-
gas oil ratio (CTO) on the conversion of gas-oil
and yield of products. The mass fraction of all the
products increases slightly as the CTO increases
to 3, thereafter the mass fraction of each product
remains constant for 3.CTO Increasing the
CTO means increasing the flowrate of catalyst
entering the riser-reactor. With more catalyst
available in the riser, the number of active sites of
catalyst for the cracking reactions also increases
resulting in increased conversion of gas-oil into
products for 3.CTO
0
0.1
0.2
0.3
0.4
0.5
0.6
0 5 10 15
Catalyst-to-Gas oil RatioM
ass F
racti
on
Gas Oil Gasoline
LPG Fuel Gas
Coke
Figure 6. Variation of mass fractions of gas-oil and
products with catalyst-to-gas oil ratio
Accordingly, the mass fraction of gas-oil
decreases slightly as the CTO increases to 3 (see
Fig. 6), thereafter the mass fraction of gas-oil
remains approximately constant. The slight
decrease in the mass fraction of gas-oil for
3CTO is a result of its conversion to
products. The catalyst spends less time in the
riser-reactor at high CTO than at low CTO, which
at high CTO reduces the contact time of gas-oil
and catalyst for effective cracking of gas-oil; this
effect is evident in Fig. 6 where conversion of
gas-oil and yield of products remain practically
constant for 3.CTO Thus, an optimum value
of 3CTO is obtained for the catalytic
cracking process. Figure 7 shows the effect of CTO on the
riser and regenerator temperatures, indicating that the
riser-temperature dropped from an initial value of
about 657.5K to about 653K as the CTO increases
from 1 to 3; thereafter, the riser-temperature remains
uniform for CTO > 3. The initial drop in riser-
temperature for CTO < 3 is due to increase in the
endothermic cracking of gas-oil within this range of
CTO. The rate of cracking of gas-oil is maximum at
CTO = 3 corresponding to a minimum mass fraction
of gas-oil (see Fig. 6), beyond which, the rate of
cracking of gas-oil remains constant at the maximum value resulting in a constant temperature of the riser-
reactor as obtained in Fig. 7 for CTO > 3.

K. K. Dagde, Y. T. Puyate / International Journal of Engineering Research and Applications
(IJERA) ISSN: 2248-9622 www.ijera.com
Vol. 2, Issue 5, September- October 2012, pp.698-714
710 | P a g e
640
645
650
655
660
665
670
0 5 10 15
Catalyst-to-Gas oil Ratio
Ris
er
Tem
pera
ture (
K)
0
200
400
600
800
1000
1200
Regenera
tor T
em
pera
ture (
K)
Riser Temperature
Regenerator Temperature
Figure 7. Variation of riser and regenerator
temperatures with catalyst-to-gas oil ratio
Thus, the optimum riser-temperature for maximum cracking of gas-oil is about 653K. We note
that the optimum temperature of the riser-reactor can
vary significantly depending on the process
conditions. It is interesting to observe that the
optimum riser-temperature of about 653K obtained in
Fig. 7 corresponds roughly to the temperature at the
point of intersection of the riser and regenerator
temperatures in Fig. 5. In other words, maximum
conversion of gas-oil and maximum yield of gasoline
occur at the optimum riser-temperature (obtained
here to be about 653K) which in the present analysis corresponds to dimensionless riser-height of about
0.55 (see Fig. 5), and is consistent with Fig. 3 for
gasoline yield. Figure 7 also indicates that the
regenerator-temperature remains practically constant
at about 1000K for all values of CTO, meaning that
CTO does not have significant effect on the
temperature of the regenerator. This is because CTO
mainly influences the catalytic cracking reactions in
the riser-reactor with attendant effect on the riser-
temperature for CTO < 3. The spent catalyst enters
the regenerator at a temperature equal to the outlet
temperature of the riser-reactor of about 653K (model-estimated value, see Table 9). This
temperature of spent catalyst is less than the
regenerator-temperature of about 1000K; hence, the
temperature of the regenerator is not affected by the
temperature of spent catalyst, and remains constant
irrespective of the CTO.
Figure 8 shows the effect of inlet-air
velocity on the regenerator-temperature and the
amount of coke burnt. As the inlet-air velocity
increases, the amount of coke burnt in the regenerator
increases continuously, but the regenerator-temperature initially increases to a maximum value of
about 1080K corresponding to inlet-air velocity of
about 14m/s, beyond which, the regenerator-
temperature decreases as the inlet-air velocity
increases. The increase in the amount of coke burnt
and the initial increase in regenerator-temperature as
the inlet-air velocity increases, are due to increase in
the rate of the exothermic coke combustion reactions
resulting from increased rate of supply of oxygen from the inlet-air. At the maximum regenerator-
temperature (obtained in Fig. 8 to be about 1080K),
the operation of the regenerator is said to have
reached „total combustion regime‟ and any carbon
monoxide present in the regenerator is converted to
carbon dioxide. For inlet-air velocity above 14m/s,
the spent catalyst spends less time (low residence
time of spent catalyst) in the regenerator caused by
channelling and by-passing effect inherent in typical
fluidized-bed reactors [35]
0.00E +00
2.00E -03
4.00E -03
6.00E -03
8.00E -03
1.00E -02
1.20E -02
1.40E -02
12 14 16 18 20
Air Velocity (m/s)
Co
ke B
urn
t (w
t.%
)
800
850
900
950
1000
1050
1100
1150
Reg
en
era
tor
tem
pera
ture
(K
)
Coke Burnt
Regenerator Temperature
Figure 8. Variation of coke burnt and regenerator-
temperature with air velocity.
Some portion of the spent catalyst also
escapes with the flue gases without proper contact with the combustion air. All these factors
associated with high inlet-air velocity result in
heat losses which reduce the temperature of the
regenerator and this effect increases as the inlet-
air velocity increases beyond 14m/s, as obtained
in Fig. 8. Even though the amount of coke burnt
and the rate of the exothermic coke combustion
reactions increase as the inlet-air velocity
increases, the overall quantity of heat generated
in the regenerator for inlet-air velocity greater
then 14m/s may be less than the quantity of heat lost from the regenerator to the surrounding;
hence, the decrease in regenerator-temperature for
inlet-air velocity greater than 14m/s. It is very
essential that the coke be burned off the spent
catalyst at the same rate as it is produced in the
riser-reactor. This can be achieved by maintaining
a small amount of excess oxygen in the

K. K. Dagde, Y. T. Puyate / International Journal of Engineering Research and Applications
(IJERA) ISSN: 2248-9622 www.ijera.com
Vol. 2, Issue 5, September- October 2012, pp.698-714
711 | P a g e
regenerator above that which is required to burn
the coke. When all the coke is not burnt, the unit
is said to be „behind-in-burning‟ with the result
that the catalyst turns grey [34] and looses its
activity thereby decreasing the yield of desired
products in the riser. To avoid this, the velocity
of air entering the regenerator should be increased gradually.
9. Conclusion Models which describe the operations of the
riser and regenerator reactors in an industrial FCC
unit have been presented. The five-lump kinetic
scheme adopted for the cracking reactions in the
riser-reactor, and the steady-state and unsteady-state
models developed from the mass and energy balances
for the riser and regenerator reactors, give adequate predictions of the feed and products of gas-oil
cracking and catalyst-regeneration processes. It is
shown that CTO and inlet-air velocity have
significant effects on the performance of the riser and
regenerator reactors respectively. The riser-
temperature varies from about 650K to 800K, while
the regenerator-temperature ranges from about 650K
to 1080K (see Figs. 5, 7, and 8). The optimum values
of process variables obtained in the analysis for
effective operation of FCC are inlet-air velocity of
about 14m/s, riser-temperature of about 653K, and catalyst-gas oil ratio of 3.
Notation
GA cross-sectional area of the regenerator, m2.
RA cross-sectional area of the riser reactor, m2
CSC molar concentration of coke on spent
catalyst, kmol/m3.
iC molar concentrations of the flue gases (i.e.
exit gases, i = O2, CO, CO2), kmol/m3.
fOC2 molar concentration of oxygen in the feed
air used in eqs. (44)-(46),
kmol/m3.
ieC molar concentrations of flue gases in the
emulsion-phase, kmol/m3.
ibC molar concentrations of flue gases in the
bubble-phase, kmol/m3.
catpC specific heat capacity of the catalyst in the
riser-reactor, kJ/kg K
poC specific heat capacity of gas-oil in the riser-
reactor, kJ/kg K
pieoC specific heat capacities of flue gases at the
inlet of the emulsion-phase, kJ/kg K.
pieC specific heat capacities of flue gases at the
outlet of the emulsion-phase, kJ/kg K.
pgC specific heat capacity of gas mixture used in
eq. (62), kJ/kg K
SpC specific heat capacity of spent catalyst,
kJ/kg K.
RpC specific heat capacity of regenerated
catalyst, kJ/kg K.
CTO catalyst-to-gas oil ratio
bd effective bubble diameter, m.
D air diffusivity through the catalyst in the
regenerator used in eq. (59), m2/s.
effD effective diffusivity of gas-oil through the
catalyst in the riser-reactor used in eq. (16), m2/s
pD pre-exponential factor for diffusion used in
eq.(16), m2/s
DE activation energy for diffusion used in eq.
(16), kJ/kmol
E activation energy used in Eq. (70), kJ/kmol.
oF mass flowrate of gas-oil, kg/s
catF mass flowrate of catalyst, kg/s
g acceleration due to gravity, m/s2.
ih modified Thiele modulus used in eq. (12).
oh modified Thiele modulus for gas-oil used in
eq. (15).
beH heat-transfer coefficient between the bubble
and emulsion phases, kJ/m2s K
bcH heat-transfer coefficient between the bubble
and cloud phases,
kJ/m2s K
ceH heat-transfer coefficient between the cloud
and emulsion phases,
kJ/m2s K
CK reaction rate constant for coke burning,
m3/kmol s.
COK reaction rate constant for the catalytic
CO
combustion, m3/kmol s.
dK catalysts decay coefficient used in eq. (8),
-1s
doK catalyst decay pre-exponential kinetic factor
used in eq. (8), -1s

K. K. Dagde, Y. T. Puyate / International Journal of Engineering Research and Applications
(IJERA) ISSN: 2248-9622 www.ijera.com
Vol. 2, Issue 5, September- October 2012, pp.698-714
712 | P a g e
beK mass-transfer coefficient between the bubble
and emulsion phases, -1s
ceK mass-transfer coefficient between the cloud
and emulsion phases, s-1.
bcK mass-transfer coefficient between the bubble
and cloud phases, s-1.
iK reaction rate constant used in Eq. (70),
m3/kmol s.
ioK pre-exponential constant used in Eq. (70),
m3/kmol s.
GoK thermal conductivity of gas mixture used in
eq. (62), W/m K
,K
, K
, K rate constants used in Eqs. (37) –
(40), m3/kmol s.
GIL dimensionless catalyst-bed height.
GL catalyst-bed height, m.
GSSL steady-state catalyst-bed height, m.
RL height of riser-reactor, m
zL characteristic dimension of Zeolite
crystallite size used in eq. (14), µm
iM molecular weight of component i used in
eqs. (71)-(77), kg/kmol
)( ir reaction rates of flue gases in the emulsion-phase, kmol/s.
)( Cr rate of coke combustion reaction; kmol/s.
R universal gas constant, kJ/kmol K.
t time, s
T absolute temperature, K.
bT dimensionless temperature in the bubble-
phase.
eT dimensionless temperature in the emulsion-
phase.
bT temperature in the bubble-phase, K.
eT temperature in the emulsion-phase, K.
aoT dimensionless inlet air temperature of the
regenerator.
RT temperature of riser-reactor, K
RT dimensionless temperature of the riser-
reactor.
RT riser-reactor temperature, K.
mfU minimum fluidization velocity, m/s.
aU superficial inlet air velocity, m/s.
ieoU incipient velocity into the emulsion-phase,
m/s.
brU rise velocity of a single bubble, m/s.
bU bubble velocity, m/s.
ijV stoichiometric ratio of component i to
component j
used in eqs (71)-(77).
GV volume of the regenerator, m3.
iey mass fractions of gases in the emulsion-
phase.
iby mass fractions of gases in the bubble-phase.
Sy mass fraction of spent catalyst.
Ry mass fraction of regenerated catalyst.
ieoy initial mass fraction of the respective gases
in the emulsion-
phase.
2Oy mole fraction of oxygen used in eq. (44).
COy mole fraction of carbon monoxide used in
eq. (45).
2COy mole fraction of carbon dioxide used in eq.
(46).
iy mass fraction of component i
Z dimensionless height of riser-reactor.
Greek Letters intrinsic ratio of carbon dioxide to carbon monoxide defined after eq. (43).
ext catalyst-specific external surface area used
in eq. (14), m-1
a dimensionless parameter defined in eq.
(69).
R average void fraction in the riser-reactor
E void fraction in the emulsion-phase.
B void fraction in the bubble-phase.
mf voidage at minimum fluidization.
o mass density of gas-oil, kg/m3
i mass density of lump ,i
kg/m3
T total mass density of all lumps defined after
eq. (6), kg/m3

K. K. Dagde, Y. T. Puyate / International Journal of Engineering Research and Applications
(IJERA) ISSN: 2248-9622 www.ijera.com
Vol. 2, Issue 5, September- October 2012, pp.698-714
713 | P a g e
S mass density of spent catalyst, kg/m3.
R mass density of regenerated catalyst, kg/m3.
cat mass density of catalyst, kg/m3.
ib mass densities of gases in the bubble-phase,
kg/m3.
ie mass densities of gases in the emulsion-
phase, kg/m3.
ieo mass densities of flue gases at the inlet of
the emulsion-phase, kg/m3.
ie mass densities of flue gases at the outlet of
the emulsion-phase, kg/m3.
2O mass density of gas (oxygen) in the
emulsion-phase, kg/m3.
TG total mass density of gases in the
regenerator, kg/m3.
Go mass density of gas mixture used in eq. (62),
kg/m3
S volumetric flow rate of spent catalyst, m3/s.
R volumetric flow rate of regenerated catalyst, m3/s.
ieo volumetric flow rates of flue gases at the
inlet of the emulsion-phase, m3/s.
ie volumetric flow rates of flue gases at the
outlet of the emulsion-phase, m3/s.
o volumetric flowrate of gas-oil used in eq.
(27), m3/s
ieΔH heat of reaction of flue gases in the
emulsion-phase, kJ/kmol.
CΔH heat of reaction for coke combustion,
kJ/kmol.
ijH heat of reaction for cracking lump i to
,j
kJ/kmol
specific area for heat transfer between the
bubble and emulsion
phases, m2/m3.
catalyst deactivation function.
R dimensionless temperature of riser-reactor
ss effectiveness factor
dimensionless time.
References [1] E. Lee, F, Grooves, Mathematical Model of
the Fluidized Bed Catalytic Cracking Plant,
Transaction of the Society of Computer
Simulation, 1985, 2, 3, 219-236. [2] V. W. Weekman, D. M. Nace, Kinetics of
Catalytic Cracking Selectivity in Fixed,
Moving and Fluidized-Bed Reactors, AIChE
Journal, 1970, 16, 3, 397-404.
[3] H. Ali, S. Rohani, Effect of Cracking
Reaction Kinetics on the Model Predictions
of an Industrial Fluid Catalytic Cracking
Unit, Chemical Engineering
Communications, 1996, 149: 163-184.
[4] H. Ali, S. Rohani, J. P. Corriou, Modeling
and Control of a Riser Type Fluid Catalytic
Cracking (FCC) Unit, Transactions of the Institution of Chemical Engineers, 1997, 75,
401 – 412.
[5] I. S. Han, C.B. Chung, Dynamic Modeling
and Simulation of a Fluidized Catalytic
Cracking Process. Part 1: Process Modeling,
Chemical Engineering Science, 2001, 56,
1951 – 1971.
[6] D. Krishnaiah, V. Gopikrishna, B. Awang,
S. Rosalam, “Steady State Simulation of a
Fluid Catalytic Cracking Unit, Journal of
Applied Science, 2007, 7, 15, 2137-2145. [7] L. S. Lee, V. W. Chen, T. N. Huang, Four-
Lump Kinetic Model for Catalytic Cracking
Process, Canadian Journal of Chemical
Engineering, 1989, 67, 615 – 623.
[8] K, K. Dagde, J. G. Akpa, Y. T. Puyate, E. O.
Oboho, Five-Lump Kinetic Model for Fluid
Catalytic Cracking of Gas-Oil in a Fluidized
Bed Reactor, Journal of the Nigerian
Society of Chemical Engineers, 23, 1&2, 1-
19. ISSN: 0794-6759
[9] O. Xu, S. E. Hong–Ye, M. U. Sheng–Jing, C. H. U. Jan, 7-Lump Kinetic Model for
Residual Oil Catalytic Cracking, Journal of
Zhejiang University Science A, 2006, 7, 11,
1932–1941.
[10] S. Kumar, A. Chadha, R. Gupta, R. Sharma,
A Process Simulator for an Integrated FCC
Regenerator System, Industrial and
Engineering Chemistry Research, 1995, 34,
3737-3748
[11] A. Arbel, Z. Huang, I. H. Rinard, R.
Shinnar, A. V. Sapre., Dynamic and Control
of Fluidized Catalytic Crackers. 1. Modelling of the Current Generation of
FCCs. Industrial and Engineering
Chemistry Research, 1995, 34, 1128-1243.
[12] I. M. Arandes, M.J. Azkoiti, H. I. de Lasa,
Modelling FCC Units Under Steady and
Unsteady State Conditions Canadian
Journal of Chemical Engineering, 2000, 78,
111-123.

K. K. Dagde, Y. T. Puyate / International Journal of Engineering Research and Applications
(IJERA) ISSN: 2248-9622 www.ijera.com
Vol. 2, Issue 5, September- October 2012, pp.698-714
714 | P a g e
[13] R. M. Rao, R. Rengaswamy, A.K. Suresh,
K. S.Balaraman Industrial experience with
Object Oriented Modelling, FCC Case
Study. Chemical Engineering Research and
Design,” 2004, 82, 527-552
[14] K. Morley, H. I. de Lasa, On the
Determination of Kinetic Parameters for the Regeneration of Cracking Catalyst,
Canadian Journal of Chemical Engineering,
1987, 65, 773 – 777.
[15] J. Ancheyta-Juarez, L. F. Isunza, E. A,
Rodriguez, 5 – Lump Kinetic Model for Gas
Oil Catalytic Cracking, Applied Catalysis A,
1999, 177, 2, 227 – 235.
[16] L. L. Oliveira, E. C. Biscaia, “Catalytic
Cracking Kinetic Models, Parameter
Estimation and Model Evaluation Industrial
and Engineering Chemistry Research, 1989,
28, 3, 264 – 271. [17] M. Al-Sabawi, A. A. Jesus, H.I. de Lasa,
Kinetic Modeling of Catalytic Cracking of
Gas Oil Feedstocks: Reaction and Diffusion
Phenomena, Industrial and Engineering
Chemistry Research, 2006, 45, 1583 – 1593.
[18] O. Levenspiel, Chemical Reaction
Engineering, 2001, 3rd ed., (John Wiley,
New York).
[19] G. Tonetto, J. A. Atias, H. I. de Lasa, FCC
Catalysts with Different Zeolite Crystallite
Sizes: Activity, Structural Properties and Reactivity, Applied Catalysis A, 2004, 40, 9-
25
[20] D. M. Ruthven, Principles of Adsorption
and Adsorption Processes, 1984, (John
Willey, New York).
[21] J. S. Ahari, A. Farshi, K. Forsat, A
Mathematical Modeling of the Riser Reactor
in Industrial FCC unit, Petroleum and Coal,
2008, 50, 2, 15 – 24.
[22] NPHRC, New Port Harcourt Refinery
Training Project: Specific for Junior Staff,”
Area 3, Process Description, 1, (Comerint, 1987).
[23] S. S. E. H. Elnashaie, S. S. Elshishini,
Digital Simulation of Industrial Fluid
Catalytic Units – IV: Dynamic Behaviour,
Chemical Engineering Science, 1993, 48,
567
[24] P. B. Weisz, R. B.Godwin, Combustion of
Carbonaceous Deposits within Porous
Catalyst Particles, Part II: Intrinsic Burning
Rate, Journal of Catalysis, 1966, 6, 227-236
[25] W. C. Yang, Handbook of Fluidization and Fluid Particle Systems, 2003, (CRC Press,
New York, ISBN0-8247-0259-X)
[26] J. H. Gary, G. E. Handwerk, Petroleum
Refining: Technology and Economics, 2001,
4th ed., (CRC Press, London, ISBN 0-8247-
0482-7).
[27] T. Gauthier, J. Bayle, P. Leroy, FCC:
Fluidization Phenomena and Technologies,
Oil and Gas Science and Technology, 2000,
55, 2, 187-207.
[28] D. Kunii, O. Levenspiel, Fluidization
engineering, 2nd ed., 1991 (Butterworth–
Heinemann, London.) [29] G. F. Froment, K. B. Bischoff, Chemical
reactor analysis and design, 2nd ed., 1990
(John Willey, London).
[30] K. K. Dagde,, Development of Model
Equations for the Simulation of Fluid
Catalytic Cracking Reactors PhD Thesis,
Department of Chemical/Petrochemical
Engineering, Rivers State University of
Science and Technology, Port Harcourt,
Nigeria, 2009.
[31] J. Ren, H. X. Weng, F. Y. Liu, Study on
Composition and Structure of Heavy Oil, Petroleum Processing, 1993, 24, 9, 56 – 61.
[32] F. C. Peixoto, J. L. Medeiros, Reaction in
Multi-indexed Continuous Mixtures:
Catalytic Cracking of Petroleum Fractions,
AIChE Journal, 2001, 47, 4, 935 – 947.
[33] E. O. Oboho, J. G. Akpa, Modelling of a
Fluid Catalytic (FCC) Riser Reactor: The
Four-Lump Model, Journal of Modeling,
Design and Management of Engineering
Systems, 2002, 1, 1, 39–52
[34] D. Bai, J. X. Zhu, Y. Yin, Z. Yu, Simulation of FCC Catalyst Regeneration in a Riser
Regenerator, Chemical Engineering
Journal, 1998, 71, 97 – 109.
[35] N. P. Cheremisinoff, P. N. Cheremisinoff,
Hydrodynamics of Gas-Solid Fluidization,
1984, (Gulf Publishing Company, Houston).