Embed Size (px)
Citation preview
Abstract- Modeling tools are useful for educational and
industrial use. Such tools help the new engineers to
simulate the power system under normal and faulted
conditions. This paper presents the design and various
data conversion steps of a digital frequency relay. The
designed relay will cover both over and under
frequency conditions. The digital relay has superiority
over electromechanical relay in terms of accuracy and
speed. The large frequency variations could lead to
complete power system blackout. History has seen
several blackouts due to frequency instability, either
due to supply-demand unbalance or N-1 contingency.
After distributed generation and the possible islanding
issues, frequency relay has again gain the attention of
the researchers and industrialists. The performance of
proposed digital frequency relay will be observed under
different system dynamics on MATLAB/ SIMULINK®.
Keywords — Frequency Relay; Swing Equation; Relay
Modeling.
I. INTRODUCTION
tability of system is one of the major issues of power
system. Voltage, Angle and Frequency instability are
the basic instability problems [1]. After power system
restructuring and the incorporation of distributed generation
in power system, stability and protection coordination
issues have become a centre of concern for power
researchers. Modelling tools are utilized to simulate the
system and see the possible impacts during abnormalities.
MATLAB, most widely used educational and research
software, is also among these tools [2-4]. However,
currently MATLAB power system library has no tool box
for power system protection. In this paper, a digital
frequency block is designed. The design block offers
flexibility in terms of further research and improvement.
Frequency instability problem arises when there is a
large mismatch between demand and supply or due to N-1
contingency. Mechanical power is produced from turbine
and transferred to the generator shaft. A generator converts
1 Muhammad Mohsin Aman, Ghauth Bin Jasmon, Hazlie Bin Mokhlis,
Ab Halim Bin Abu Bakar and Mazaher Karimi are working with University of Malaya, Malaysia. First author can be reached at
[email protected]. 2 Muhammad Qadeer Ahmed Khan is working with ENI Corporate
University, Italy. He can be reached at [email protected].
the mechanical power into the electrical power Pe.
Mechanical Torque Tm is created on the turbine from the
water or steam power and electrical torque Te is as a result
of load connection. The difference between the two torques
(known as acceleration torque), causes the fluctuation on
the generators speed, and thus resulting in speed variation
of the frequency of the power system.
The swing Eqn. (1) demonstrates the relationship
between the deviation of the torque and variation of angular
acceleration [5].
em TTdt
dJ
(1)
emm PPdt
dJ
(2)
Where J is the total moment of inertia of the rotor mass,
ɷm is the angular mechanical velocity, Pm and Pe are the
mechanical and electrical power , given by Eqn. (3).
mmm TP ; eme TP (3)
A normalized inertia constant (H) is defined as:
ratingMVAGenerator
)MJ(speedsync.atenergykineticStoredH
(4)
rated
s
S
JH
2
2
(5)
If P is the number of poles in synchronous machine then
the mechanical speed (ɷm) is related to the electrical speed
(ɷ) by Eqn. (6)
m*P
2
(6)
Substituting Eqns. (5) and (6) into Eqn. (2) results in
emrated
s
PPdt
dS
H
2 (7)
Dividing the Eqn. (7) by Sbase
base
e
base
mrated
s S
P
S
P
dt
dS
H
2 (8)
Modeling and Simulation of Digital Frequency
Relay for Generator Protection Muhammad Mohsin Aman
1, Ghauth Bin Jasmon
1, Hazlie Bin Mokhlis
1,
Qadeer Ahmed Khan2, Ab. Halim Bin Abu Bakar
1, Mazaher Karimi
1
S
2012 IEEE International Conference on Power and Energy (PECon), 2-5 December 2012, Kota Kinabalu Sabah, Malaysia
978-1-4673-5019-8/12/$31.00 ©2012 IEEE 701
Now, the Eqn. (8) can appear in per unit
)pu(e)pu(m
s
PPdt
dH
2 (9)
Where Pe (pu) and Pm (pu) are the per unit electrical
power and mechanical power.
From Eqn. (9), the relation between change in frequency
and power could be developed, given by Eqn. (10).
PH
f
dt
df n 2
(10)
Where fn is the system frequency or rated frequency.
From Eqn. (10), it can be observed that the mismatches
between demand and supply results in frequency change.
Thus in order to measure the real time power frequency,
different techniques have been developed namely; Newton
method; level crossing technique; modified zero-crossing
technique least-square error technique; Discrete Fourier
Transform (DFT); leakage effect technique; Kalman filter
technique; and phasor-based technique and Prony Method
[6-7]. However in practical system, most of the relays
worked on the principle of zero crossing detection [8-9].
II. OVER-UNDER FREQUENCY RELAY
Frequency relay is commonly used in order to protect the
power system from blackout in case of major
generation/load loss or during N-1 contingency. The relay
is also used to detect the islanding operation. Islanding
operation normally occurs in case of distributed generation
due to loss of mains. The resulting system consisting of
distributed generator and local load is often known as
"Power Island". This presents a threat to the system in
terms of power balancing and controlling. A major threat
comes when the power island is reconnected to the rest of
the system without synchronising first. Loss of mains is
often detected by measuring rate of change of frequency
(ROCOF). However ROCOF method cannot reliably
discriminate between changes in frequency due to loss of
mains and changes due to other disturbances [10]. In [10],
the author has also proposed the comparison of rate of
change of frequency (COROCOF) for loss of main
protection.
Stable frequency operation is always demand of
customer. Different countries have their own grid codes to
ensure that the quality (voltage and frequency) of electricity
supply is maintained within specified standards. For
example, in UK following the Electricity Supply
Regulations 1989 and the Grid Code the frequency
delivered to the consumer must not vary more than ±1%.
Also ±6% variation in voltages is allowed below 132 kV
whereas ±10% regulation is allowed for voltages higher
than 132 kV [11].
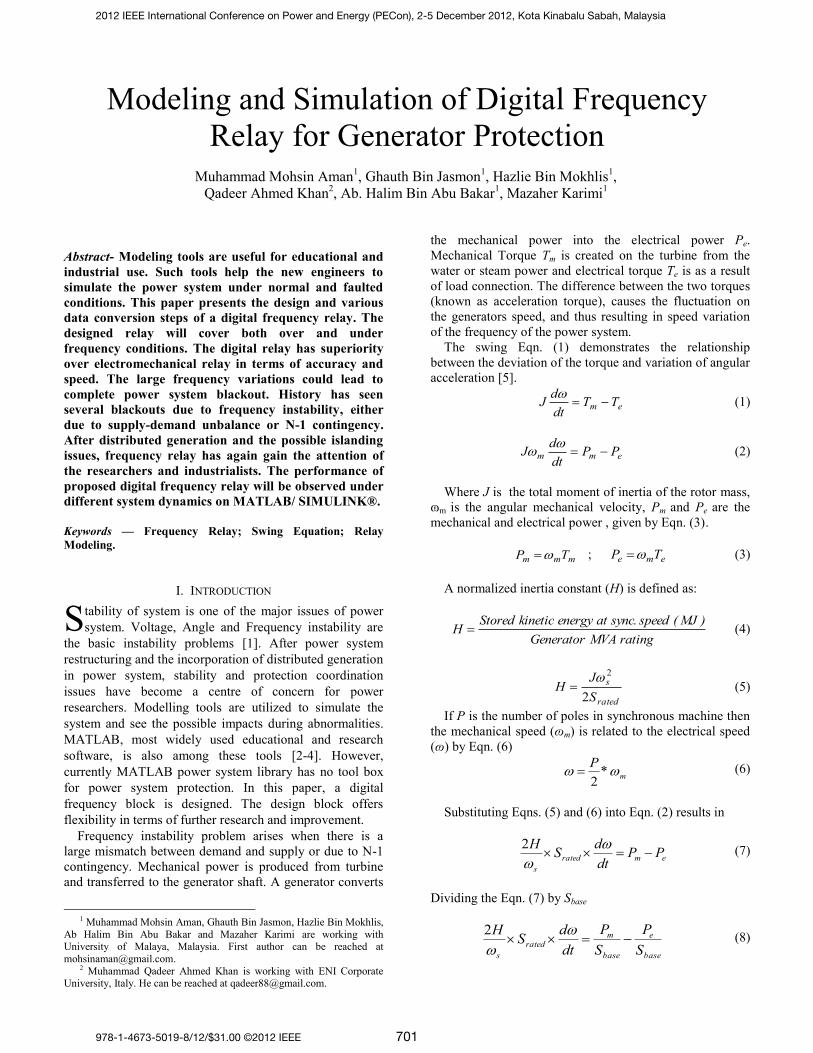
III. MODELING OF DIGITAL FREQUENCY RELAY
The Digital Frequency Relay consists of two parts,
Frequency Measuring Unit (FMU) and Under-Over
Frequency Detection Element (FDE), as shown in Fig. 1.
FMU is used to measure the digital value of frequency from
the PT while FDE takes appropriate action based on Over-
Under frequency limit.
Fig. 1. Block Diagram for Implementing Over-Under Frequency Relay
A. Frequency Measuring Unit (FMU)
The FMU is used to measure the frequency of a voltage
signal from the Potential Transformer (PT). To measure the
frequency, the time difference between the two consecutive
zero crossing (T1 and T2) is measured, as shown in Fig 2.
Fig. 2. Measuring Frequency of a Signal
However to measure the total time of a complete
waveform, the difference between T1 and T2 is multiplied
by factor of 2, as shown in Eqn. (11).
122 TTT (11)
)TT()T(TimePeriodFrequency
122
11
(12)
The FMU unit implemented on SIMULINK is shown in
Fig. 3.
Fig. 3. Measuring Frequency of Voltage Signal on Simulink®.
2012 IEEE International Conference on Power and Energy (PECon), 2-5 December 2012, Kota Kinabalu Sabah, Malaysia
702
‘Hit Crossing’ block is used to detect the zero crossing.
The block passes the input signal at its zero crossings to the
‘if’ block, which in starts sending ramp signal to the output.
The time duration of generated ramp is measured and saved
to a variable ‘A’. The variable A is stored in another
variable B using the ‘Transport Delay’ block and the time
of the next zero crossing is measured. Subtracting B from A
at any instant will give half the time period whose value is
held by the ‘Sample and Hold’ block, till the next zero
crossing. After performing the necessary computations,
given by Eqn. (13), the instantaneous frequency is
achieved. The output (measured frequency) from FMU
sends to the FDE for necessary tripping action, in case of
fault.
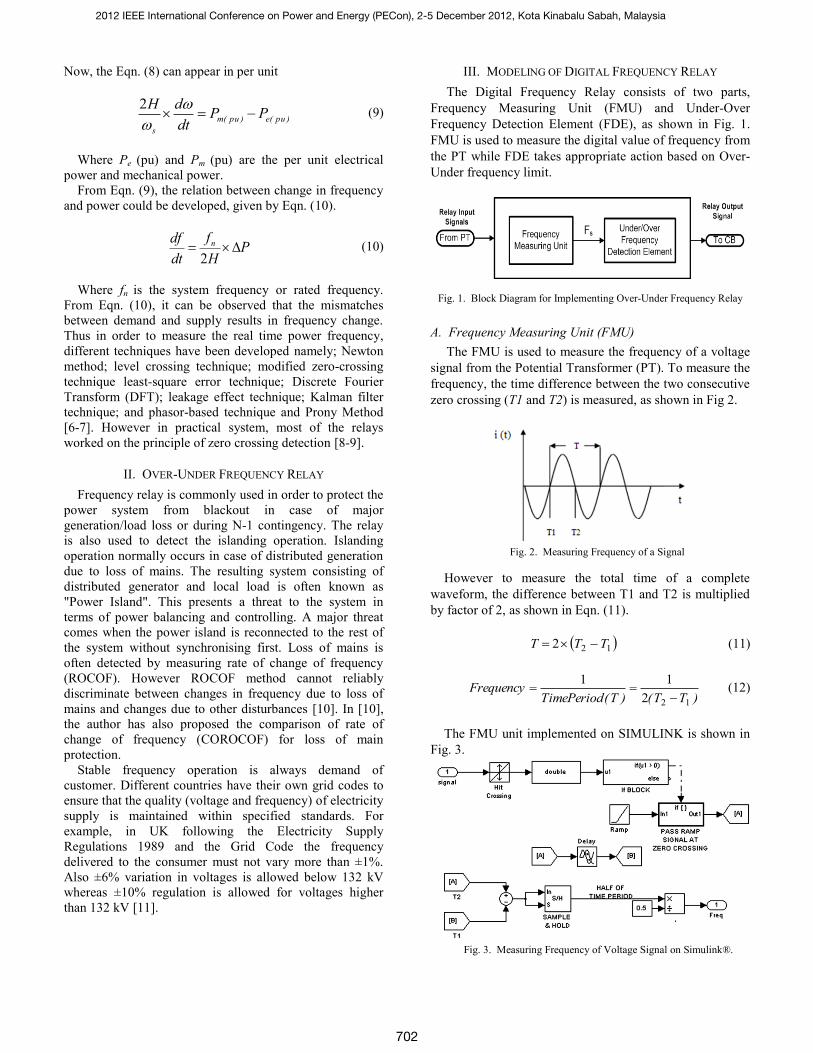
B. Frequency Detection Element
The FDE is used to take the necessary action in case of
Over Frequency (OF) and Under Frequency (UF). The
output from OF and UF are logically AND. The output of
FDE or relay under normal case is set at 1, otherwise 0 (for
tripping). The complete block diagram of the FDE is shown
in Fig. 4.
Fig. 4. Frequency Detection Element
The relay setting is given in Table 1. These limits are
generalized and could be set to some other values based on
country standards.
TABLE I
FREQUENCY RELAY SETTINGS
Nominal
Frequency Frequency
Relay Limit
Threshold
Time
50 OF 51 5 sec UF 48.6 5 sec
Fig.5 shows the logic diagram for the implementation of
a frequency relay in case of an under-frequency situation.
The frequency of the voltage signal is first measured by the
frequency measuring unit (FMU) and then compared with
the threshold under frequency limit i.e. Fu (48.6Hz). If
under-frequency condition occurs, the measured frequency
‘f’ less than Fu), 1 will be sent to the integrator and
integration will occur. The output of the integrator is then
compared with the set value of K (5secs). If the integrator
output exceeds the K value, the relay will trip. This is also a
check to see the abnormality is transient or continuous. If
the abnormality persists for K seconds the relay trips.
Otherwise either integrator is reset by the reset logic or no
integration occurs under normal conditions. Under normal
condition, the integrator input is set at "0", thus the relay
does not operate.
The inside Simulink® model of Under and Over
frequency block is shown in Fig. 6 and Fig. 7 respectively.
The explanations of the blocks are left to the reader.
Fig. 6. Under Frequency Detection Block
Fig. 7. Over Frequency Detection Block
Fig. 5. Logic Diagram for Implementing Under Frequency Block
Pass 1If f < FU else 0
∫1. dt Trip CB if Integral > K Hold
Reset Logic
IntegratorComparison With K
(Thershold)
Comparison
With FU
Trip Signal
to CB
Input from
FMU
2012 IEEE International Conference on Power and Energy (PECon), 2-5 December 2012, Kota Kinabalu Sabah, Malaysia
703
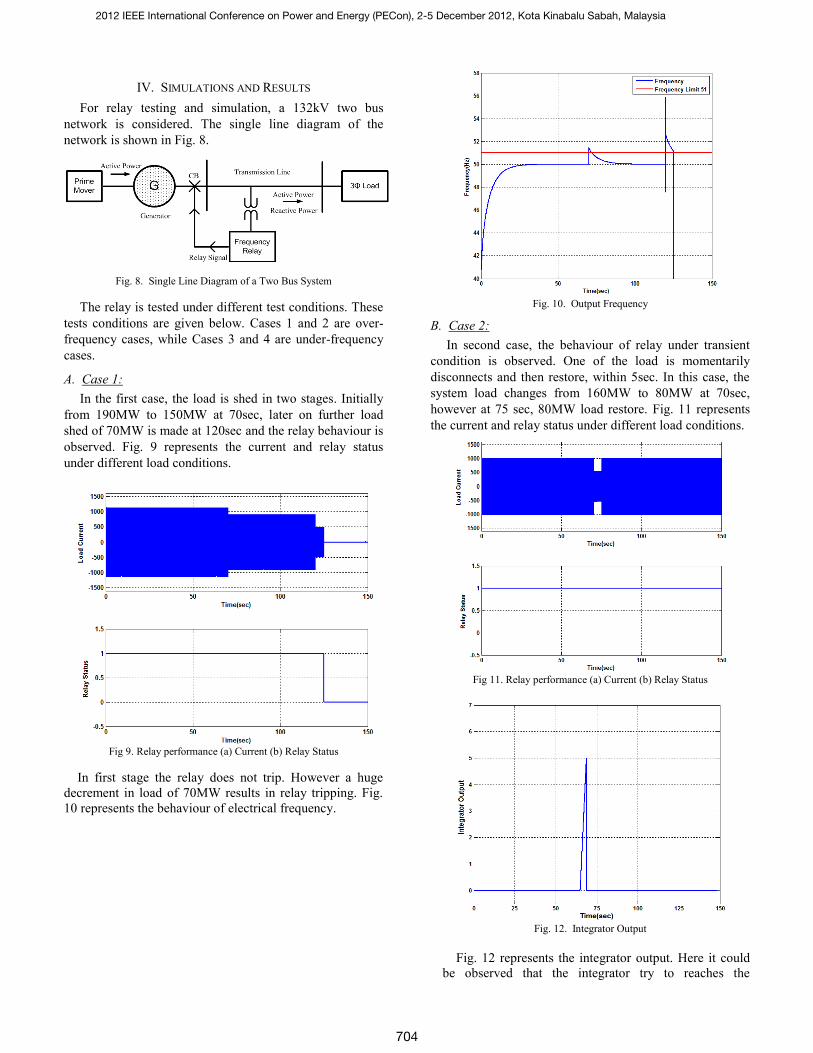
IV. SIMULATIONS AND RESULTS
For relay testing and simulation, a 132kV two bus
network is considered. The single line diagram of the
network is shown in Fig. 8.
Fig. 8. Single Line Diagram of a Two Bus System
The relay is tested under different test conditions. These
tests conditions are given below. Cases 1 and 2 are over-
frequency cases, while Cases 3 and 4 are under-frequency
cases.
A. Case 1:
In the first case, the load is shed in two stages. Initially
from 190MW to 150MW at 70sec, later on further load
shed of 70MW is made at 120sec and the relay behaviour is
observed. Fig. 9 represents the current and relay status
under different load conditions.
Fig 9. Relay performance (a) Current (b) Relay Status
In first stage the relay does not trip. However a huge
decrement in load of 70MW results in relay tripping. Fig.
10 represents the behaviour of electrical frequency.
Fig. 10. Output Frequency
B. Case 2:
In second case, the behaviour of relay under transient
condition is observed. One of the load is momentarily
disconnects and then restore, within 5sec. In this case, the
system load changes from 160MW to 80MW at 70sec,
however at 75 sec, 80MW load restore. Fig. 11 represents
the current and relay status under different load conditions.
Fig 11. Relay performance (a) Current (b) Relay Status
Fig. 12. Integrator Output
Fig. 12 represents the integrator output. Here it could
be observed that the integrator try to reaches the
2012 IEEE International Conference on Power and Energy (PECon), 2-5 December 2012, Kota Kinabalu Sabah, Malaysia
704
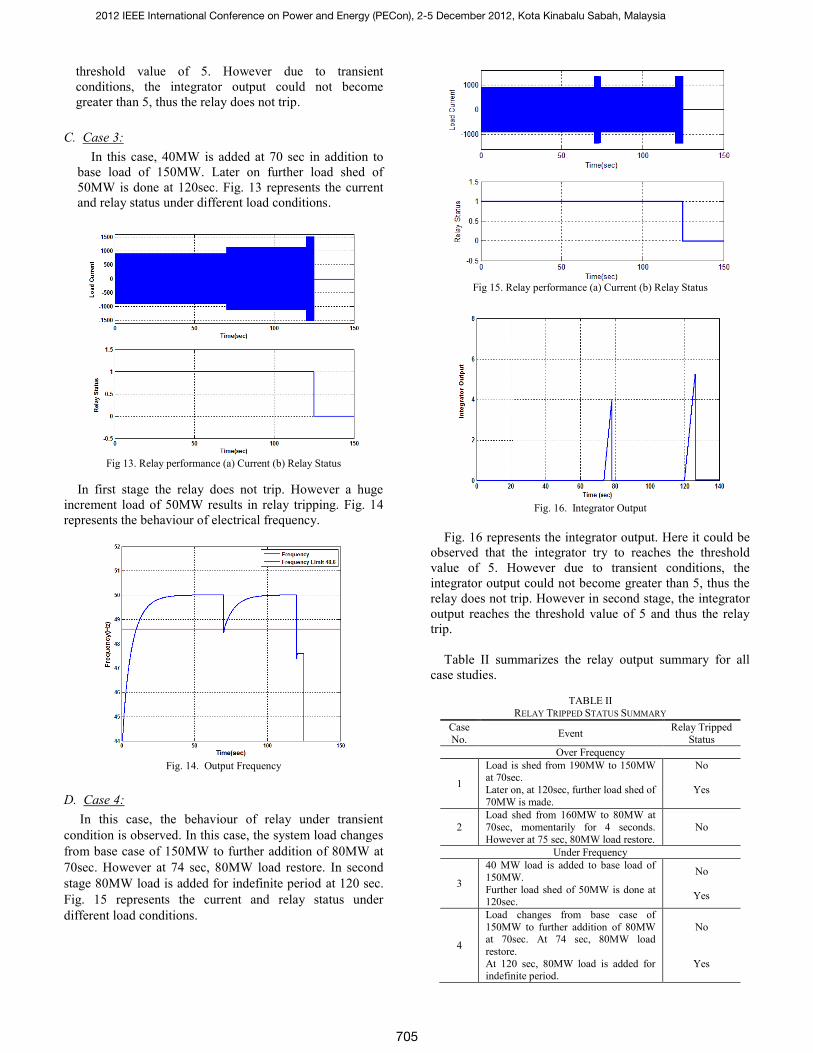
threshold value of 5. However due to transient
conditions, the integrator output could not become
greater than 5, thus the relay does not trip.
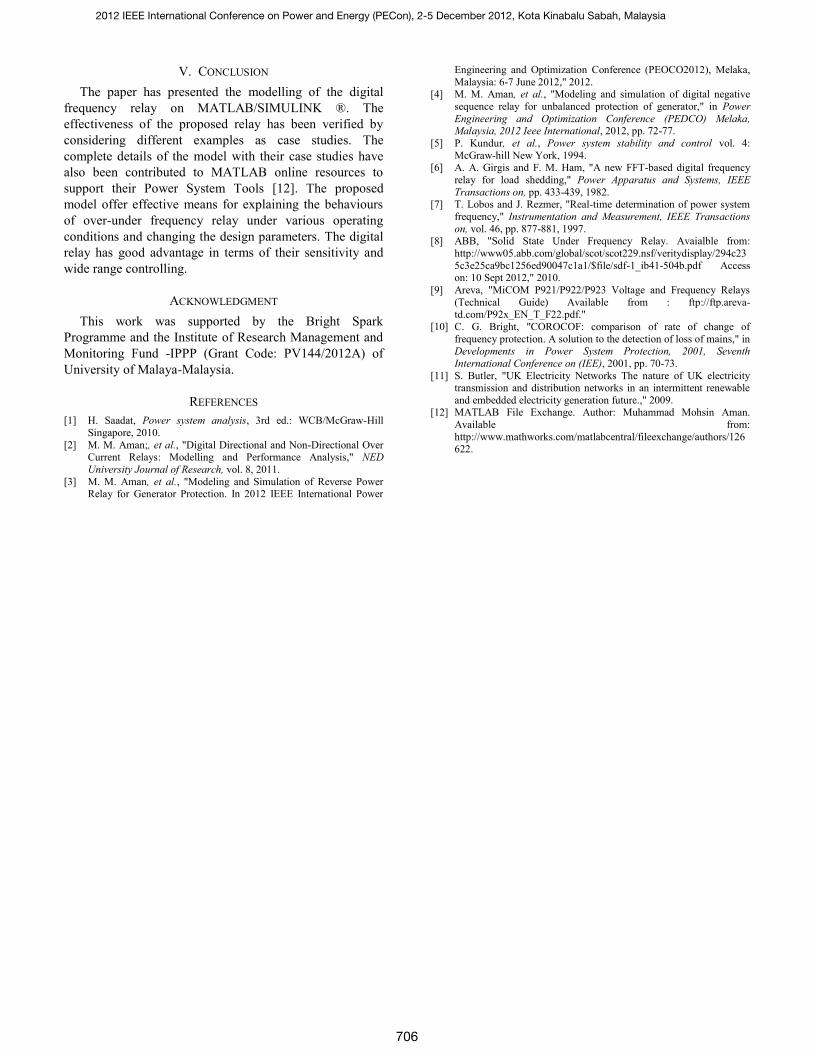
C. Case 3:
In this case, 40MW is added at 70 sec in addition to
base load of 150MW. Later on further load shed of
50MW is done at 120sec. Fig. 13 represents the current
and relay status under different load conditions.
Fig 13. Relay performance (a) Current (b) Relay Status
In first stage the relay does not trip. However a huge
increment load of 50MW results in relay tripping. Fig. 14
represents the behaviour of electrical frequency.
Fig. 14. Output Frequency
D. Case 4:
In this case, the behaviour of relay under transient
condition is observed. In this case, the system load changes
from base case of 150MW to further addition of 80MW at
70sec. However at 74 sec, 80MW load restore. In second
stage 80MW load is added for indefinite period at 120 sec.
Fig. 15 represents the current and relay status under
different load conditions.
Fig 15. Relay performance (a) Current (b) Relay Status
Fig. 16. Integrator Output
Fig. 16 represents the integrator output. Here it could be
observed that the integrator try to reaches the threshold
value of 5. However due to transient conditions, the
integrator output could not become greater than 5, thus the
relay does not trip. However in second stage, the integrator
output reaches the threshold value of 5 and thus the relay
trip.
Table II summarizes the relay output summary for all
case studies.
TABLE II
RELAY TRIPPED STATUS SUMMARY
Case
No. Event
Relay Tripped
Status
Over Frequency
1
Load is shed from 190MW to 150MW at 70sec.
Later on, at 120sec, further load shed of
70MW is made.
No
Yes
2
Load shed from 160MW to 80MW at
70sec, momentarily for 4 seconds.
However at 75 sec, 80MW load restore.
No
Under Frequency
3
40 MW load is added to base load of
150MW.
Further load shed of 50MW is done at 120sec.
No
Yes
4
Load changes from base case of
150MW to further addition of 80MW at 70sec. At 74 sec, 80MW load
restore.
At 120 sec, 80MW load is added for indefinite period.
No
Yes
2012 IEEE International Conference on Power and Energy (PECon), 2-5 December 2012, Kota Kinabalu Sabah, Malaysia
705
V. CONCLUSION
The paper has presented the modelling of the digital
frequency relay on MATLAB/SIMULINK ®. The
effectiveness of the proposed relay has been verified by
considering different examples as case studies. The
complete details of the model with their case studies have
also been contributed to MATLAB online resources to
support their Power System Tools [12]. The proposed
model offer effective means for explaining the behaviours
of over-under frequency relay under various operating
conditions and changing the design parameters. The digital
relay has good advantage in terms of their sensitivity and
wide range controlling.
ACKNOWLEDGMENT
This work was supported by the Bright Spark
Programme and the Institute of Research Management and
Monitoring Fund -IPPP (Grant Code: PV144/2012A) of
University of Malaya-Malaysia.
REFERENCES
[1] H. Saadat, Power system analysis, 3rd ed.: WCB/McGraw-Hill
Singapore, 2010.
[2] M. M. Aman;, et al., "Digital Directional and Non-Directional Over Current Relays: Modelling and Performance Analysis," NED
University Journal of Research, vol. 8, 2011.
[3] M. M. Aman, et al., "Modeling and Simulation of Reverse Power Relay for Generator Protection. In 2012 IEEE International Power
Engineering and Optimization Conference (PEOCO2012), Melaka,
Malaysia: 6-7 June 2012," 2012. [4] M. M. Aman, et al., "Modeling and simulation of digital negative
sequence relay for unbalanced protection of generator," in Power
Engineering and Optimization Conference (PEDCO) Melaka, Malaysia, 2012 Ieee International, 2012, pp. 72-77.
[5] P. Kundur, et al., Power system stability and control vol. 4:
McGraw-hill New York, 1994. [6] A. A. Girgis and F. M. Ham, "A new FFT-based digital frequency
relay for load shedding," Power Apparatus and Systems, IEEE
Transactions on, pp. 433-439, 1982. [7] T. Lobos and J. Rezmer, "Real-time determination of power system
frequency," Instrumentation and Measurement, IEEE Transactions
on, vol. 46, pp. 877-881, 1997. [8] ABB, "Solid State Under Frequency Relay. Avaialble from:
http://www05.abb.com/global/scot/scot229.nsf/veritydisplay/294c23
5c3e25ca9bc1256ed90047c1a1/$file/sdf-1_ib41-504b.pdf Access on: 10 Sept 2012," 2010.
[9] Areva, "MiCOM P921/P922/P923 Voltage and Frequency Relays
(Technical Guide) Available from : ftp://ftp.areva-td.com/P92x_EN_T_F22.pdf."
[10] C. G. Bright, "COROCOF: comparison of rate of change of
frequency protection. A solution to the detection of loss of mains," in
Developments in Power System Protection, 2001, Seventh
International Conference on (IEE), 2001, pp. 70-73.
[11] S. Butler, "UK Electricity Networks The nature of UK electricity transmission and distribution networks in an intermittent renewable
and embedded electricity generation future.," 2009. [12] MATLAB File Exchange. Author: Muhammad Mohsin Aman.
Available from:
http://www.mathworks.com/matlabcentral/fileexchange/authors/126622.
2012 IEEE International Conference on Power and Energy (PECon), 2-5 December 2012, Kota Kinabalu Sabah, Malaysia
706


![LUXEON Z - Mouser Electronics · Bin 3U[1] Bin 3L[2] Bin 5A Bin 5B Bin 5C Bin 5D NOTE: Color bin space illustration for 2700K, 3000K and 3500K. For CCT above 4000K, the ellipse centers](https://img.pdfslide.us/doc/110x75/5e7f177fcf08133c0416f5d3/luxeon-z-mouser-electronics-bin-3u1-bin-3l2-bin-5a-bin-5b-bin-5c-bin-5d-note.jpg)