Embed Size (px)
Citation preview

1
EDS/ETD Deployment Program:EDS/ETD Deployment Program:Modeling Modeling andand Simulation ApproachSimulation Approach
Presentation at the TRB Annual Sunday Simulation WorkshopOmni Shoreham Hotel, Washington, D.C., January 12, 2003
By:
Evert Meyer, Ph.D. Principal, Leigh Fisher Associates
Mark Lunsford Principal, Leigh Fisher Associates

2
Role of Modeling and Simulation
Develop and test new generic screening concepts:Hybrid screening solutions,Pre-ticketing versus post-ticketing screening,Simultaneous ticketing/screening (e.g., ETD-on-a-Stick), andIn-line/bag room solutions.
Estimate EDS and ETD equipment requirements for each airport.
Assess system performance at each airport:Queue lengths; and Average, 95th percentile, and max waiting times.
Assist with selection of preferred solution for each airport.
Continuous improvement (beyond December 31, 2002).
3
Use of Simulation for Terminal Planning in a New Environment
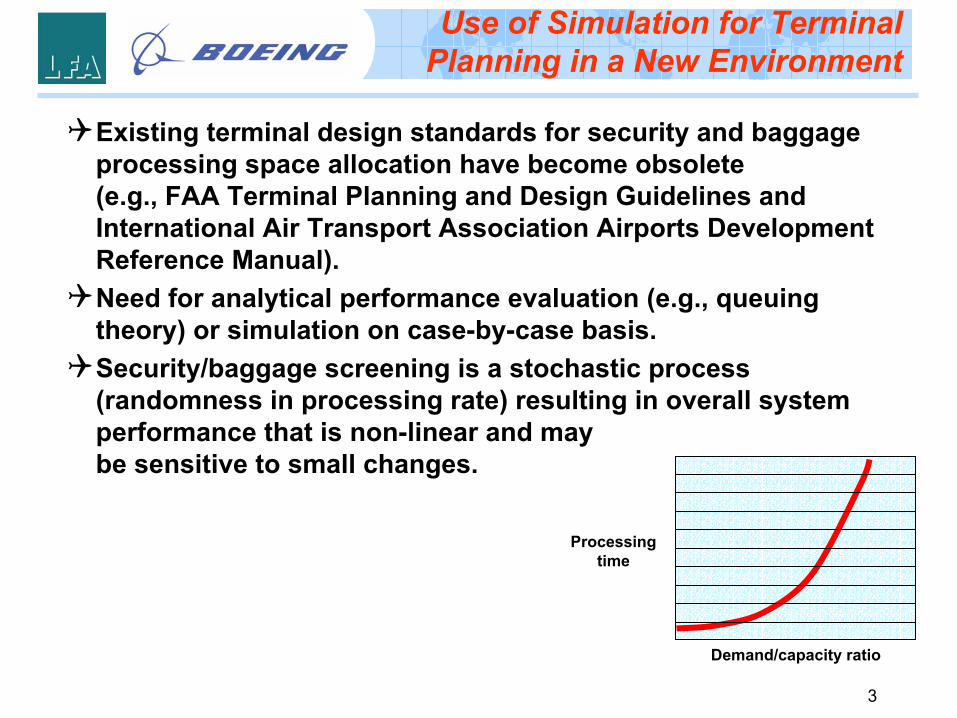
Existing terminal design standards for security and baggage processing space allocation have become obsolete (e.g., FAA Terminal Planning and Design Guidelines and International Air Transport Association Airports Development Reference Manual).Need for analytical performance evaluation (e.g., queuing theory) or simulation on case-by-case basis.Security/baggage screening is a stochastic process (randomness in processing rate) resulting in overall system performance that is non-linear and may be sensitive to small changes.
Processing time
Demand/capacity ratio

4
Example of Nonlinear Queuing Effects and Variable Passenger Processing Times
Potential risks of using manufacturers’ processing times and rates:
Idealized laboratory rates versus real-world achievable rates oftendiffer by a factor of 2; ndCould result in underestimating waiting times and queue lengths by a factor of 4.
Potential risks of using average processing times as constants:Example: System “A” has a constant service time of 2 min;System “B” has a variable service time with an average of 2 minand a standard deviation of 1.5 min.Then, a standard rule of thumb from queuing theory predicts that, for the same demand pattern, the waiting times and queues at System “B” could be twice as long as those at System “A”.
Potential combined risks:Using manufacturers’ rates and ignoring the variance in processing times rates could result in underestimating waiting times and queue lengths by a factor of 8 (say 5 to 10).

5
Alarm Rates and EDS Throughput
EDS Alarm Rate
EDS
Thro
ughp
ut R
ate
(bag
s pe
r ho
ur)
A 5-point reduction in alarm rate results in about a 25% increase in EDS throughput.
0
50
100
150
200
250
300
0 0.05 0.1 0.15 0.2 0.25 0.3 0.35 0.4 0.45
4 Secondary screeners3 Secondary screeners2 Secondary screeners1 Secondary screener

6
Boeing Team Modeling andSimulation Tools
Total Design Day Bags
Avg % of Bags Screened with
EDS
Avg % of Bags Screened with
ETD
4,025 91.1% 8.9%
Hours of Active Use in Design Day
Avg. EDS Utilization
During Active Hours
Avg. ETD Utilization
During Active Hours
20.7 49.3% 8.5%
Airlines served : AA_INT @ 46%, IB @ 100%, LO @ 100%
565 bph
Capaci ty
Req'd
EDS
Capaci ty
360 bph
0
100
200
300
400
500
600
0:00
1:00
2:00
3:00
4:00
5:00
6:00
7:00
8:00
9:00
10:0
011
:00
12:0
013
:00
14:0
015
:00
16:0
017
:00
18:0
019
:00
20:0
021
:00
22:0
023
:00
Ti me of Day
Ba
gs p
er
Ho
ur
EDS throuhput ETD throughputDesign Confidence Interval Expected Mean Flow Rate
ZONE LEVEL DESIGN DAY BAGGAGE FLOW
JFK - NEW YORK(KENNEDY) NY
Zone : 8B
8B
ZONE
EDS CAPACITY
RECORD
AutoMod (commercially available proprietary model)
PaxSim (Preston)
Flow Model (LFA)
EDS-SIM (LFA)

7
Modeling and Simulation Strategy
Assessment TSA Review
SurveyDesign
Flow Model PaxSim
PaxSim or AutoMod (as necessary)
Airport Types
GROUPS A/B
* Most challengingterminals
* Others
GROUP C
GROUP D
EDS-Sim
Flow Model
EDS-Sim
PaxSIm
= High-level queuing model (concept stage; preliminary requirements)
= Discrete-event simulation model (design stage; final requirements)
= Discrete-event simulation model with animation output (design stage; final requirements)
= Discrete-event simulation model with 3D animation output (design stage; final requirements)
Flow Model
Flow Model
Flow Model
EDS-Sim (as necessary)
AutoMod (as necessary)
AutoMod

8
Flow Model
Total Design Day Bags
Avg % of Bags Screened with
EDS
Avg % of Bags Screened with
ETD
4,025 91.1% 8.9%
Hours of Active Use in Design Day
Avg. EDS Utilization
During Active Hours
Avg. ETD Utilization
During Active Hours
20.7 49.3% 8.5%
Airlines served : AA_INT @ 46%, IB @ 100%, LO @ 100%
565 bph
Capaci ty
Req'd
EDS
Capaci ty
360 bph
0
100
200
300
400
500
600
0:00
1:00
2:00
3:00
4:00
5:00
6:00
7:00
8:00
9:00
10:0
011
:00
12:0
013
:00
14:0
015
:00
16:0
017
:00
18:0
019
:00
20:0
021
:00
22:0
023
:00
Ti me of Day
Ba
gs
pe
r H
ou
r
EDS throuhput ETD throughputDesign Confidence Interval Expected Mean Flow Rate
ZONE LEVEL DESIGN DAY BAGGAGE FLOW
JFK - NEW YORK(KENNEDY) NY
Zone : 8B
8B
ZONE
EDS CAPACITY
RECORD
Based on fluid approximations with statistical surging.Used for quickly estimating EDS and ETD equipment requirements for a variety of protocols.Integrated with database containing:
Official Airline Guide (OAG) schedules,Industry average trends/data,Airline/airport-specific data, andData collected in field.
Calibrated to the 10-minperformance criteria and redundancy.Rapid set-up and application—typically less than 8 h.

9
EDS-SIM
Used for rapid concept evaluation and requirements for most airports where a standard solution is proposed:
Modular design to implement solutions from standard set of templates; Captures unique metering/dependency effects associated with pre-ticketing or post-ticketing solutions; andEvaluates requirements based on 95-percentile, 10-min design objective.
Relatively rapid set up and processing time:Group A: 3 to 5 days;Group B: 2 to 3 days; andGroup C: 0.5 to 1 days.
Integrated with database containing:OAG schedules,Industry average trends/data,Airline/airport-specific data, andData collected in field.
Technical details:Discrete event, simulation model; and Pre-processor, a simulation engine, and a post processor modules.

10
PaxSim
Fully animated simulation program:Passengers and their luggage modeled visually as individual objects;State-of-the-art, object-oriented modeling environment; andSuperior graphics capabilities.
Appropriate for difficult, controversial layouts:Assist with the refinement of requirements and concept layouts as well as their visualization;Quantify and visualize the impact of congestion on passenger flows and dwell times; andObtain buy-in for concepts with unique flow/queuing characteristics.
Relatively rapid set up and processing time:Group A: 8 to 10 days;Group B: 5 to 10 days; andGroup C: 4 to 8 days.
Technical details:Object Oriented Model DevelopmentEnvironment,C/C++ Native Code, Linux Platform,Rule-based decision structure, andFree-flow grid paradigm (not node-link structure as used older technology products).

11
Data Management
Fitted Distributions
0.0000
0.0500
0.1000
0.1500
0.2000
0.2500
0 50 100 150
Passenger process time (seconds)
Prob
abili
ty
GAMMA NORMAL Observed
Data sourcesSchedule (OAG)Airline Data
Transaction statisticsCheck-in SplitsLoad Factors% O&D
Field dataDetailed time and queue statistics for 60 airports including all CAT I & IISite survey data for all other airports (429+)
Database RepositoryRelational DatabaseProcessing scripts (SQL/Delphi)Schedules
August 2000–March 2003Charter Activity
Processed data for:Bags/party distributionParty size distributionCheck-in splitsLoad FactorsO&D splitsProcess time distributions

12
Major Modeling and Simulation Tasks
Every airport has received some type of modeling:Flow Models: 429 airportsEDS-Sim models: 127 terminals, 90 airportsPaxSim models: 60 terminals, 30 airports
Development of automation processes and tools necessary for airport system analysis:
System-wide model to evaluate policy/machine allocation strategies;Flow model development and support for use by planners/architects to assess machine requirements; andAnalysis tools in support of continuous improvement program.

13
MCO—Post-Ticketing“Drop-n-Go” Concept

14
LAX Terminal 1 (SWA)—Simultaneous Screening/Ticketing

15
MCI—SimultaneousTicketing/Screening

16
ORD T1 Animation (Original Concept)

17
ORD T1 Animation (Revised Concept)

18
ORD T1 Animation (Close-Up)

19
LAX TBIT