Embed Size (px)
Citation preview
Modeling and Forecasting Implications of Driverless Cars
Joan WalkerUC Berkeley
@ Workshop on ATB Impacts and TDM Implications of Driverless Cars
TRB 2014

Determining the modeling implications
• What’s different? On both supply and demand• What can be captured within existing models?– Analogs of existing modes– Existing attributes (value or preference)– Existing decisions
• What structural changes are necessary?– New attributes, modes, choice sets, decisions– Disruptive/Transformative (major behavioral shifts)

Levels of automation (NHTSA)• No-Automation (Level 0): Driver is in complete and sole control
• Function-specific Automation (Level 1): Automation of one or more specific control functions (e.g., automatic braking)
• Combined Function Automation (Level 2): Automation of at least two primary control functions working together (e.g., adaptive cruise control with lane centering).
• Limited Self-Driving Automation (Level 3): Automation enables driver to cede full control of all safety-critical functions under certain conditions. Driver is expected to be available.
• Full Self-Driving Automation (Level 4): The vehicle is designed to perform all safety-critical driving functions for an entire trip. This includes both occupied and unoccupied vehicles.
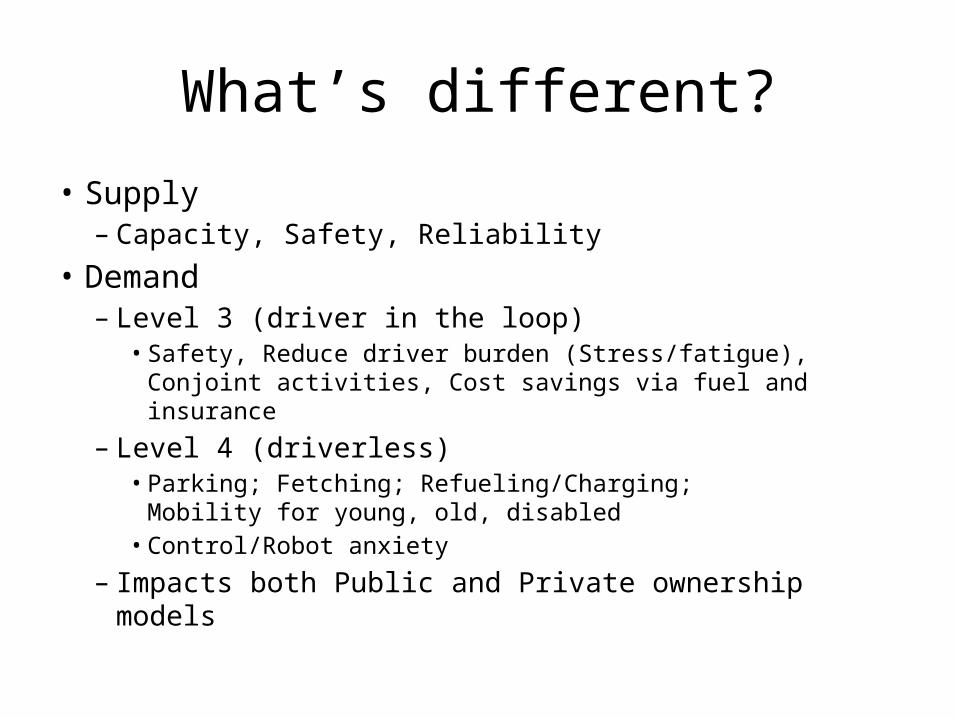
What’s different?
• Supply– Capacity, Safety, Reliability
• Demand– Level 3 (driver in the loop)
• Safety, Reduce driver burden (Stress/fatigue), Conjoint activities, Cost savings via fuel and insurance
– Level 4 (driverless)• Parking; Fetching; Refueling/Charging;
Mobility for young, old, disabled• Control/Robot anxiety
– Impacts both Public and Private ownership models
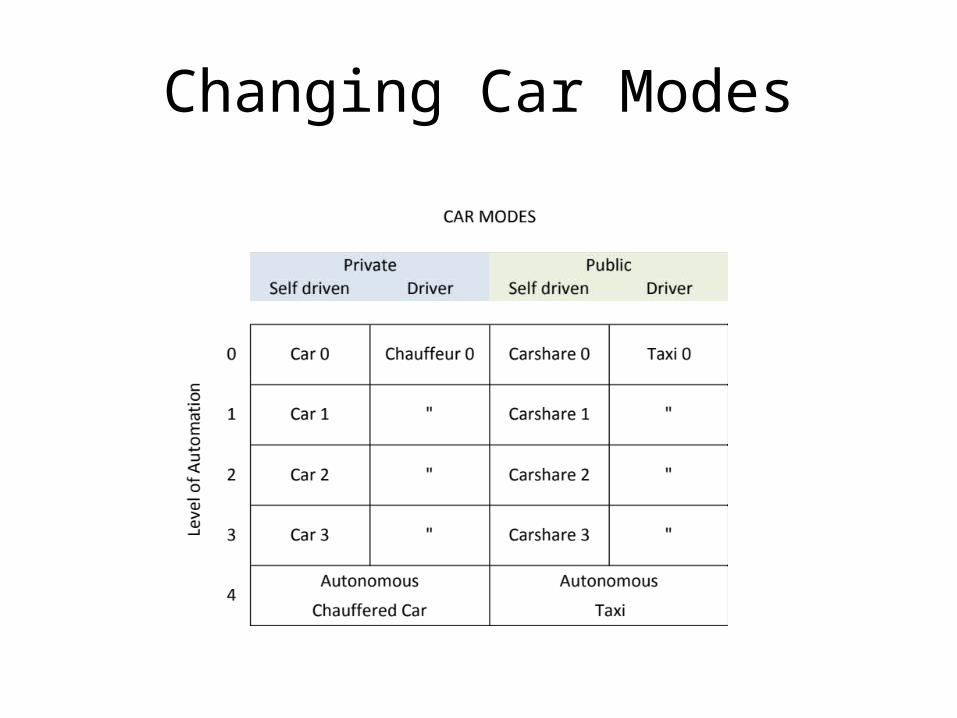
Changing Car Modes
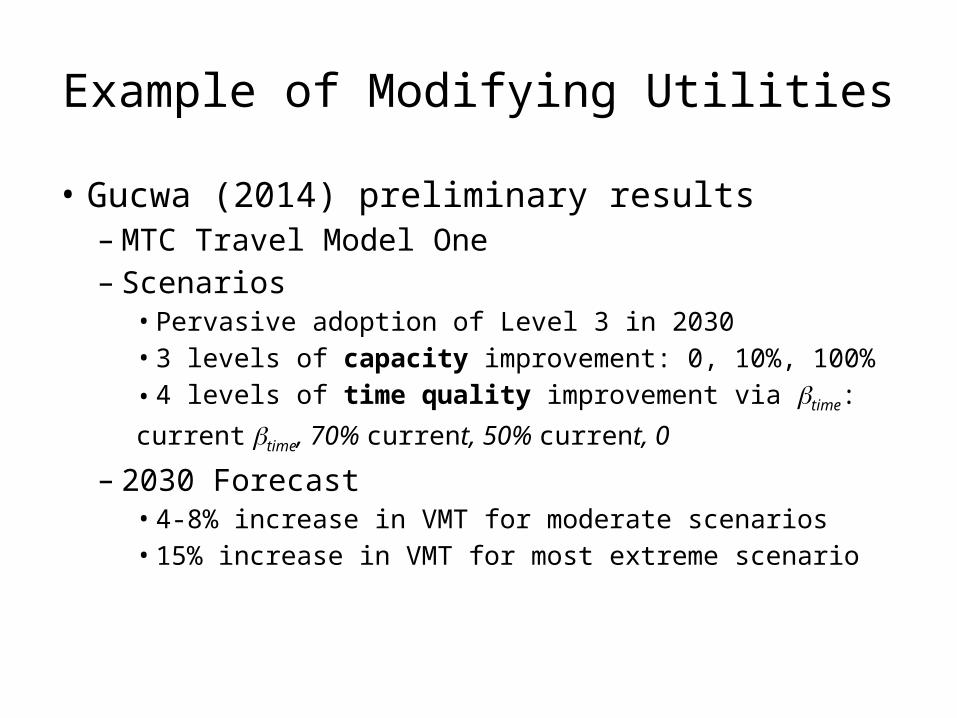
Example of Modifying Utilities
• Gucwa (2014) preliminary results– MTC Travel Model One– Scenarios
• Pervasive adoption of Level 3 in 2030• 3 levels of capacity improvement: 0, 10%, 100%• 4 levels of time quality improvement via btime:
current btime, 70% current, 50% current, 0
– 2030 Forecast• 4-8% increase in VMT for moderate scenarios• 15% increase in VMT for most extreme scenario
7
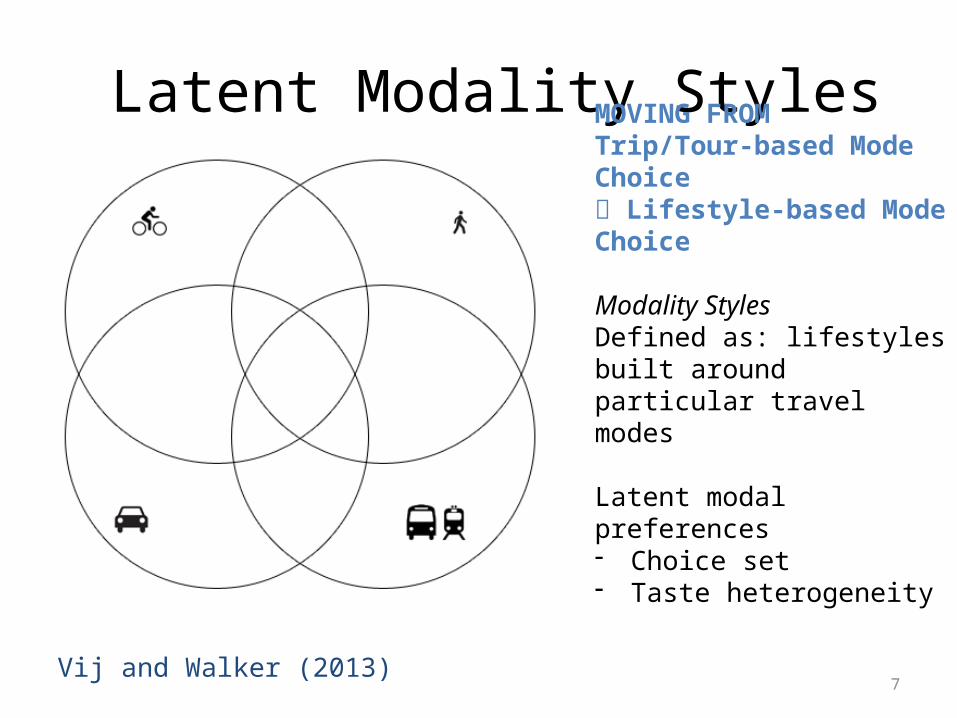
Latent Modality Styles
MOVING FROMTrip/Tour-based Mode Choice Lifestyle-based Mode Choice
Modality StylesDefined as: lifestyles built around particular travel modes
Latent modal preferences- Choice set- Taste heterogeneity
Vij and Walker (2013)

8
1. Inveterate Drivers 2. Car Commuters 3. Moms in Cars
4. Transit Takers 5. Multimodals 6. Empty Nesters
(Vij, 2014)
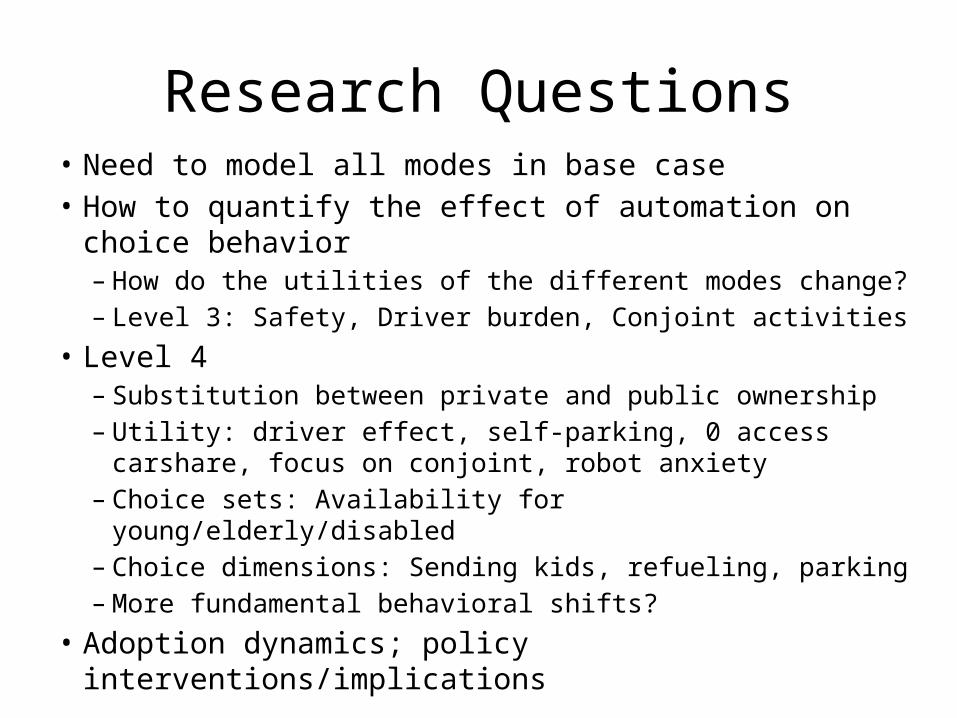
Research Questions• Need to model all modes in base case• How to quantify the effect of automation on choice
behavior– How do the utilities of the different modes change?– Level 3: Safety, Driver burden, Conjoint activities
• Level 4– Substitution between private and public ownership– Utility: driver effect, self-parking, 0 access carshare, focus on
conjoint, robot anxiety – Choice sets: Availability for young/elderly/disabled – Choice dimensions: Sending kids, refueling, parking– More fundamental behavioral shifts?
• Adoption dynamics; policy interventions/implications
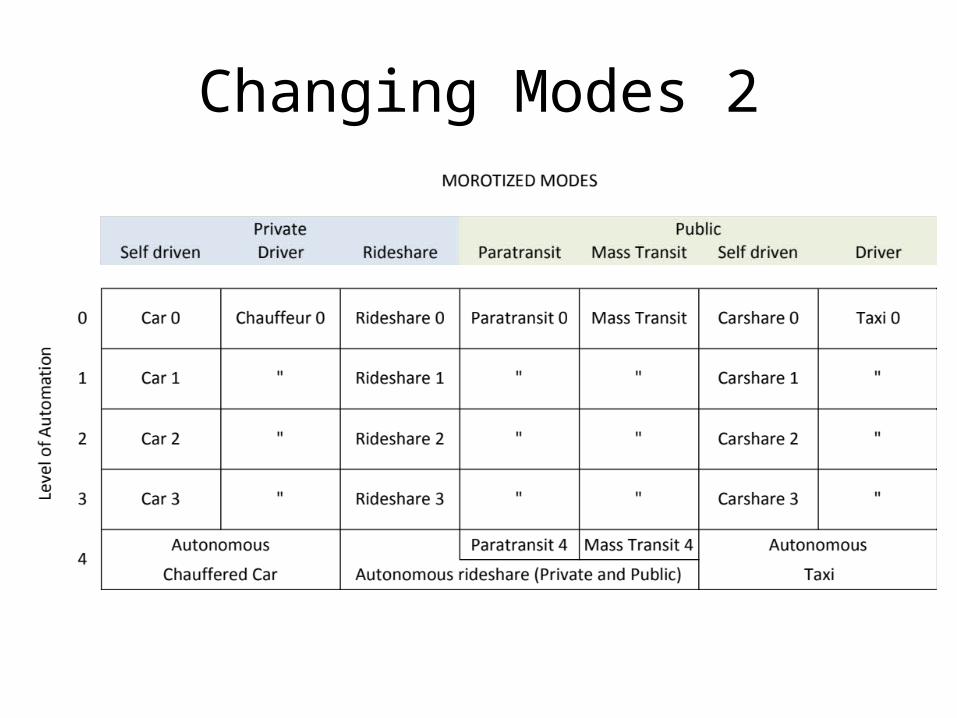
Changing Modes 2