Embed Size (px)
Citation preview

International Journal of Science and Research (IJSR) ISSN (Online): 2319-7064
Index Copernicus Value (2013): 6.14 | Impact Factor (2013): 4.438
Volume 4 Issue 4, April 2015
www.ijsr.net Licensed Under Creative Commons Attribution CC BY
Modeling and Control of the Crude Atmospheric
Unit in Khartoum Refinery
Moutaz M. Eldirderi1, Salah Eldeen F. M. Hegazi
2
1Department of Chemical Engineering, Faculty of Engineering, King Khalid University, Saudi Arabia
2Department of Chemical Engineering, Faculty of Engineering, Jazan University, Saudi Arabia
Abstract: The work undertaken, lead to a mathematical model of the distillation column that can separate multicomponent systems in
Khartoum refinery. Software was developed and might be used for research and development as well as at the stage of starting – up and
shut down periods. A case study taking Distillation Column Units (DCU) of Khartoum Refinery was studied and investigated. This work
investigates the experimental data for the equilibrium of the Nile blend crude was determined. The equilibrium data were correlated
(using short cut methods) and an equilibrium model was constructed. This model coupled with a multicomponent material balance was
used for the determination of the number of theoretical stages, stage efficiency, and composition and temperature profiles. Three
transfer functions around the condenser, the re boiler and the feed plate were determined. Software of MATLAB 7 was used to analyze
the system stability; these were Nyquist diagram, Bode plot and Routh Hurwtz. The transfer functions of the reboiler, condenser, and
feed plate were obtained. From the transfer functions created Nyquist diagrams, Bode plots, were converted from Laplace domain to Z
domain, using MATLAB7 Software. A closed loop control strategy for the system was recommended.
Keywords: Equilibrium; Distillation; Matlab; Multi-components; Software; Condenser
1. Introduction
1.1 Distillation Column Model Formulation
Distillation is the most popular and important separation
method in the petroleum industries for purification of final
products. Distillation columns are made up of several
components, each of which is used either to transfer heat
energy or to enhance mass transfer. [1]
In forming a model for the distillation column, general
assumptions about the operation of a distillation column
must be made. The assumptions a model makes are the
major distinctions between the models found in the
distillation literature. A complete set of dynamic equations
would be of a daunting size considering that a stage
contains many forms of energy transformations and that a
distillation column or a set of columns can contain
hundreds of stages. Of course, simplifying assumptions are
desirable in such a complex apparatus [2], [3], [4].
Model specifications are re-used in the design evaluation
of large integrated processes and control systems. In
addition, the models once made are used to support
operator training. Computerized dynamic simulation
models are useful for verification of both conceptual and
detailed process designs. They make in-house pre-testing
of automation systems, user interfaces, and operational
procedures possible, as well. They are used for generic
teaching and learning of basic principles, detailed pre-
training of new personnel, and re-training of experienced
operators. [5]
Improved distillation control is characterized by a
reduction in the variability of the impurities in the
products. Meeting the specification requirements on the
variability of final products can make the difference
between the product being a high value-added product
with large market demand and being a low-valued product
with a small market demand [6].
1.2 Optimum Design of Plate
Calming zones are used for drop forth velocity, for
smoothly in let in down comer. [7]
1.2.1 Flooding
Flow rate is depend on difference pressure (∆p)in tower,
when increased over proper level and to be high than the
flow is to be impossible in tower and the liquid is perhaps
in zones and the tower then a unstable process. [7]
1.2.2 Weeping
The lower limit of the operating range when liquid leakage
through the holes becomes excessive. The vapor velocity
at the weep point is the minimum value for stable
operation. The hole area must be chosen so that at lowest
operating rate the vapor flow velocity is still well above
the weep point. [7]
1.2.3 Entrainment
Entrainment can be estimated from the correlation given
by Fair1961, which gives the fractional (kg/kg gross liquid
flow) as a function of the liquid – vapor factor FLv. With
the percentage approach to flooding as a parameter. [7]
Paper ID: SUB153640 2534

International Journal of Science and Research (IJSR) ISSN (Online): 2319-7064
Index Copernicus Value (2013): 6.14 | Impact Factor (2013): 4.438
Volume 4 Issue 4, April 2015
www.ijsr.net Licensed Under Creative Commons Attribution CC BY
Figure 1: Zone of satisfactory operation for plate columns
[7]
1.3 Material of Construction
Material of construction of the tower and trays is carbon
steel because has long period in operation but it's
expensive.
2. Models Section
2.1 Development of transfer function
Transfer function is an expression that represents the
functional relationship between the input to any particular
element and that output from that element.
It relates the input – output pair of variables and it
indicates the dynamic response of the system component
or elements.
The transfer function, G, is the ratio of output to the input,
or the ratio of their Laplace transforms and is generally
defined as:
G = Y (Laplace Transform of output)/X (Laplace
Transform of input)
The transfer function, G, may be a constant or an operator
or any combination of them. [8]
2.1.1 Re boiler transfer function
Feed m0, Ө0
Figure 2: Energy balance around re boiler
(1)
101
1
mcpmcpqt
cpv
Divided by mCp
(2) 10
11
mcp
q
tm
v
(3)
0111
mcp
q
tm
v
Put
(4)
m
v1
(5)
01
1
mcp
q
t
(6)
smcp
sss 011
smcp
s s 01 1
(7)
(8)
11
01
ss
s
mcps
(9) 1
1
1 00
1
ss smcps
s
𝜏𝜑 + 𝜏𝑚𝑐𝑝𝜃0 s + 𝜑 + mcpθ0
𝑠2 + 2𝜏𝑠
+1𝜏2
Using MATLAB to find the transfer function
Num= 𝜏𝜑 + 𝜏𝑚𝑐𝑝𝜃0 𝜑 + 𝑚𝑐𝑝𝜃0
Den= 1 2
𝜏
1
𝜏2
Condenser Transfer Function 2.1.2
Feed m0, Ө0
Figure3: Energy balance around condenser
(10)
101
1
mcpmcpqt
cpv
Divided by mCp
(11)
1011
mcp
q
tm
v
0111
mcp
q
tm
v
(12)
Paper ID: SUB153640 2535

International Journal of Science and Research (IJSR) ISSN (Online): 2319-7064
Index Copernicus Value (2013): 6.14 | Impact Factor (2013): 4.438
Volume 4 Issue 4, April 2015
www.ijsr.net Licensed Under Creative Commons Attribution CC BY
Put
(13)
m
v1
(14)
01
1
mcp
q
t
(15) smcp
sss 011
(16)
smcp
s s 01 1
(17)
11
01
ss
s
mcps
(18) 1
1
1 00
1
ss smcps
s
𝜏𝜑 − 𝜏𝑚𝑐𝑝𝜃0 s − mcpθ0 − 𝜑
𝑠2 + 2𝜏𝑠
+1𝜏2
Num= 𝜏𝜑 − 𝜏𝑚𝑐𝑝𝜃0 mcpθ0 − 𝜑
Den= 1 2
𝜏
1
𝜏2
2.1.3 Feed Plate Transfer Function
Figure 4: Energy balance around feed plates
(19)
210..
211
mcpmcpmcpqq
tcpv core
Divided by mCp
(20)
210
..211
mcp
q
mcp
q
tm
v core
Put
Ԏ =𝑣 𝛅
𝑚 (21)
210
..21
mcp
q
mcp
q
t
core (22)
(23) sssmcpmcp
s cores 210
..21
(24)
smcpmcp
s cores 0
..21 1
(25)
111
0..21
ss
co
s
re s
mcpmcps
(26)
1
1
1
.
1 00
.
0
21
ss
co
s
re
smcpsmcps
s
𝜑re. τ − φco. τ + mcpθ0τ 𝑠2 + 2𝜑𝑟𝑒. −2𝜑𝑐𝑜. +𝑚𝑐𝑝𝜃0 𝑠 +
𝜑𝑟𝑒. −𝜑𝑐𝑜. +𝑚𝑐𝑝𝜃0 𝜏
τ2mcpθ0s3 + 2τθ0mcp + θ0mcpτ s2 + 3θ0mcps +θ0mcp
τ
Num=
𝜑re. τ − φco. τ + mcpθ0τ 𝑠2 +
2𝜑𝑟𝑒. −2𝜑𝑐𝑜. +𝑚𝑐𝑝𝜃0 𝑠 + 𝜑𝑟𝑒 .−𝜑𝑐𝑜 .+𝑚𝑐𝑝 𝜃0
𝜏
Den = 1 3
𝜏
1
𝜏3 3
𝜏2
3. Results and Discussions
3.1 Reboile Transfer Function
Convert to discrete or digital scheme
= 𝑛𝑢𝑚𝐷𝑍
0.1993 − 0.1998 0
= 𝑑𝑒𝑛𝐷𝑍
0.9950 1.9950 − 1.000
The transfer function is:
Paper ID: SUB153640 2536
International Journal of Science and Research (IJSR) ISSN (Online): 2319-7064
Index Copernicus Value (2013): 6.14 | Impact Factor (2013): 4.438
Volume 4 Issue 4, April 2015
www.ijsr.net Licensed Under Creative Commons Attribution CC BY
𝑠 + 0.1993
𝑠2 + 1.995 𝑠 + 0.995
By this equation we obtained negative roots there for the
system is stable.
Result Z-Plane
Figure 5: Z – Plane
3.1.1 Result Nyquist Diagrams
Figure 6: Nyquist Diagrams
3.1.2 Result Bode Plots
Figure7: Bode Plots
3.2 Condenser Transfer Function
Result converts to discrete or digital scheme
= 𝑛𝑢𝑚𝐷𝑍
0.1993 0.1998 − 0
= 𝑑𝑒𝑛𝐷𝑍
0.9950 1.9950 − 1.000
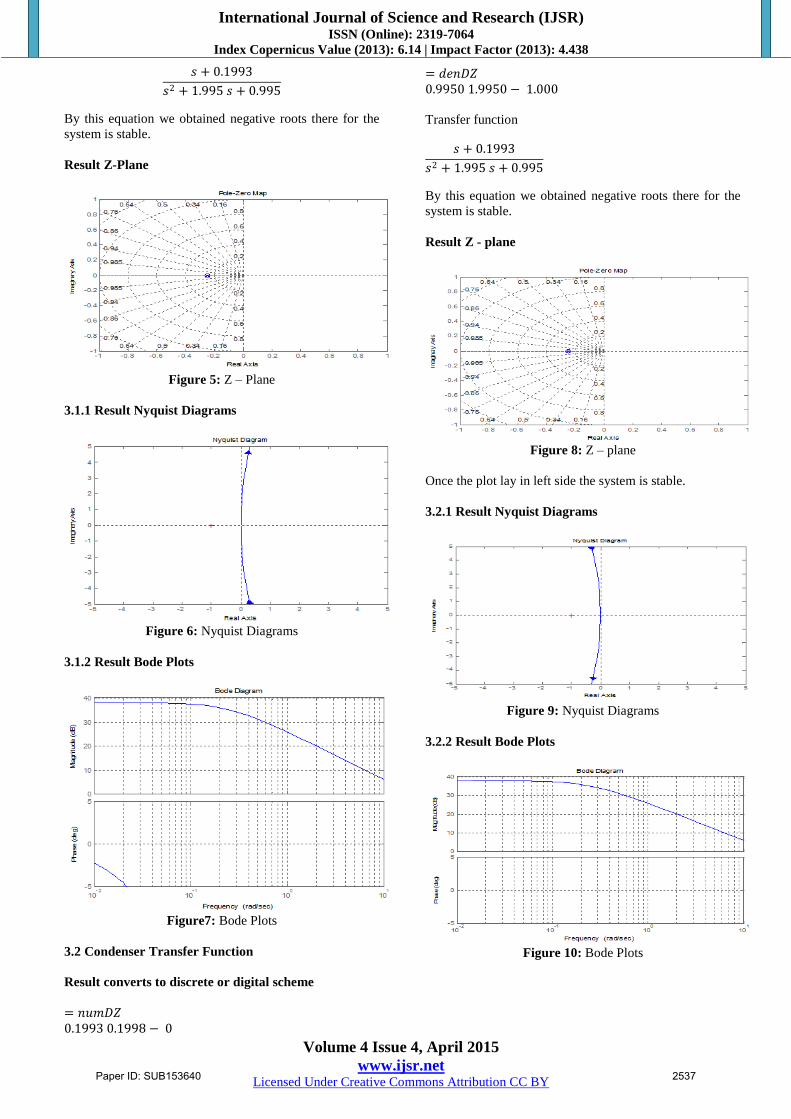
Transfer function
𝑠 + 0.1993
𝑠2 + 1.995 𝑠 + 0.995
By this equation we obtained negative roots there for the
system is stable.
Result Z - plane
Figure 8: Z – plane
Once the plot lay in left side the system is stable.
3.2.1 Result Nyquist Diagrams
Figure 9: Nyquist Diagrams
3.2.2 Result Bode Plots
Figure 10: Bode Plots
Paper ID: SUB153640 2537

International Journal of Science and Research (IJSR) ISSN (Online): 2319-7064
Index Copernicus Value (2013): 6.14 | Impact Factor (2013): 4.438
Volume 4 Issue 4, April 2015
www.ijsr.net Licensed Under Creative Commons Attribution CC BY
3.3 Feed Plate Transfer Function
Result converts to discrete or digital scheme
= 𝑛𝑢𝑚𝐷𝑍
0.0498 0.0997 − 0.0500 0
= 𝑑𝑒𝑛𝐷𝑍
0.9940 − 2.9880 2.9940 − 1.000
Transfer function
𝑠2 + 0.0997𝑠 + 0.04975
𝑠3 + 2. 994𝑠2 + 2.988𝑠 − 0.994
By this equation we obtained negative roots there for the
system is stable.
Result Z – plane
Figure 11: Z – plane
Once the plot lay in left side the system is stable.
3.3.1 Result Nyquist Diagrams
Figure 12: Nyquist Diagrams
3.3.2 Result Bode Plots
Figure 13: Body plots
From the previous results obtained that our system is
stable.
4. Discussions
The control analysis and stability investigation of the
crude distillation unit (CDU) in Khartoum refinery
initiated by the modeling of the condenser, feed plate and
the reboiler. The modeling equation were developed for
each system and the transfer function for each were
developed. Roots locus, Nyquist criterion and Bode
technique were used to check the stability of the systems.
Figures (5) illustrates the roots location for the Z—plane
lies in the left side which indicates the system is stable for
the re-boiler. In figure 8 indicates the system is stable for
the condenser. Figure 11 shows the roots in left side which
indicates the system is stable.
5. Recommendations
To avoid disturbance of the flooding for the flow rate is
depend on difference pressure (∆p) in tower, when
increased over proper level and to be high than the flow so
cascade control should be used.
References
[1] Vu Trieu Minh and Ahmad Majdi Abdul Rani,
2009.Modeling and Control of Distillation Column in
a Petroleum Process, Article ID 404702, pages14,
Hindawi Publishing Corporation
[2] R. S. H. Mah, S. Michaelson, and R. W. H. Sargent,
―Dynamic Behavior of Multi-component Multi-stage
Systems. Numerical Methods for the Solution,‖
Chemical Engineering Science, vol. 17, pp. 619-639,
August 1962.
[3] E. L. Meadows, ―Multicomponent Batch-distillation
Calculations on a Digital Computer,‖ Chemical
Engineering Progress Symposium Series #46: Process
Systems Engineering, vol. 59, pp. 48-55, 1963.
Paper ID: SUB153640 2538

International Journal of Science and Research (IJSR) ISSN (Online): 2319-7064
Index Copernicus Value (2013): 6.14 | Impact Factor (2013): 4.438
Volume 4 Issue 4, April 2015
www.ijsr.net Licensed Under Creative Commons Attribution CC BY
[4] G. P. Distefano, ―Mathematical Modeling and
Numerical Integration of Multicomponent Batch
Distillation Equations,‖ AIChE Journal, vol. 14, no. 1,
pp. 190-199, January 1968.
[5] Kister, Henry Z. Distillation Design (1st Edition ed.).
McGraw-hill. (1992).
[6] M.T.Tham, Distillation an introduction "Distillation
column design"(1998)
[7] R.K.Sinnolt1993;Chemical Engineering Volume6
Pergaman press-Oxford, NewYork, Toranto, Paris
&Sydeny
[8] Pradeep B.Deshpande Initials; Distillation Dynamic
&Control Printed in United State of America, 1998
Paper ID: SUB153640 2539