Embed Size (px)
Citation preview

Takashi OTSUKI
Researcher, Asia Pacific Energy Research Centre (APERC)
Email: takashi.otsuki[at]aperc.ieej.or.jp The 4th Northeast Asia Energy Security Forum
15 December 2016, Seoul
2
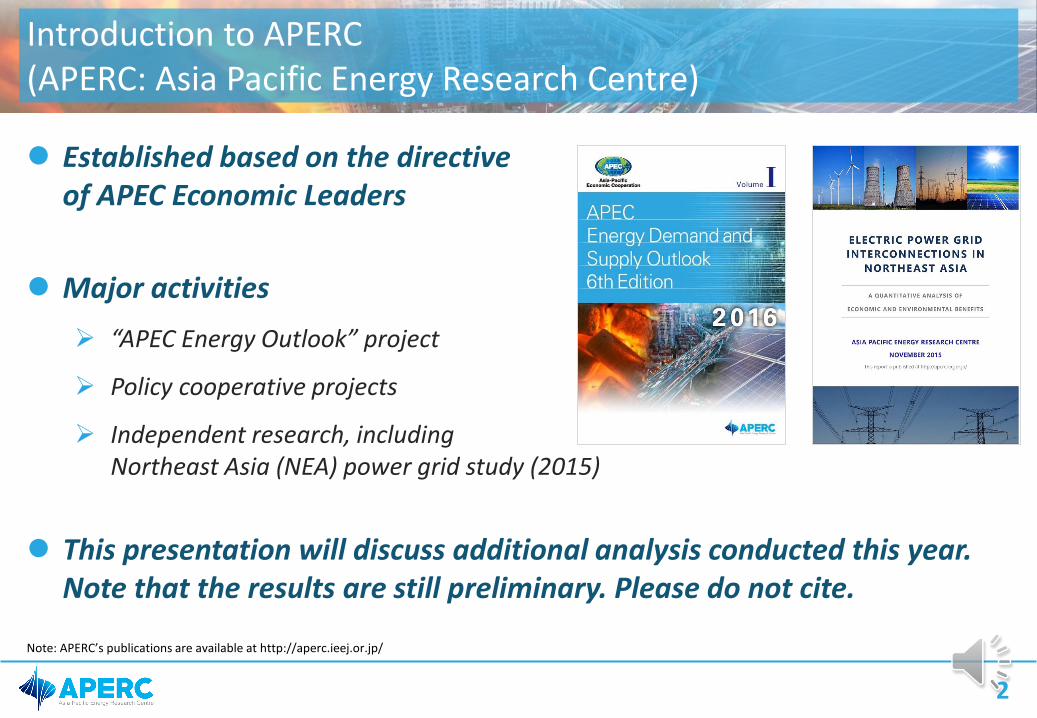
Established based on the directive of APEC Economic Leaders
Major activities
“APEC Energy Outlook” project
Policy cooperative projects
Independent research, including Northeast Asia (NEA) power grid study (2015)
This presentation will discuss additional analysis conducted this year. Note that the results are still preliminary. Please do not cite.
Introduction to APERC (APERC: Asia Pacific Energy Research Centre)
Note: APERC’s publications are available at http://aperc.ieej.or.jp/

3
• Introduction Background and methodology
• Early insights and discussion
Contents

4
Limited grid interconnections exist in NEA partially due to current national policies of energy self-sufficiency and sometimes volatility in diplomatic and political relationships
Recently, however, several regional events, such as air pollution issues in China and the nuclear disaster in Japan, have potentially increased the attractiveness of interconnections as a means of promoting renewables
One of the resources highlighted in several interconnection concepts is the abundancy of renewable power available in Mongolia
Background and objective
To discuss costs and benefits of massive renewable developments in Mongolia for international power exports
Objective

5
1 M. Son, 2011. Paradigm Shift in Energy. 2 Energy Charter, et al., 2014. Gobitec and Asian Super Grid for Renewable Energies in Northeast Asia, : Energy Charter Secretariat 3 Elliott, D. et al., 2001. Wind Energy Resource Atlas of Mongolia. Colorado: NREL/TP- 500-28972.
• Estimated solar and wind potential in Mongolia reaches 1100GW and 1400GW, respectively.2,3
Numerous possibilities has been drawn by various organizations
Asia Super Grid (Son, 2011)1 Gobitec (Energy Charter, et al., 2014)2

6
City node
Supply node
Japan-East
(JP-E)
Japan-
Hokkaido
(JP-H)
Japan-West
(JP-W)
Russia-Far East
(RU-FE)
Mongolia
(MN)
Korea
(KR)
China-Northeast
(CH-NE)
China-Northwest
(CH-NW)
China-Central
(CH-C)
China-Southern
(CH-S)
China-North
(CH-N)
China-East
(CH-E)
Least cost model
Linear programming
Optimize capacity and operation of power plants, storage and transmission
Hourly dispatch for a single year
Objective function
Methodology: An NEA-wide power system model
Note: The two transmission routes through the DPRK (dotted lines) in the top-right figure are not considered in the cases discussed below.
𝒎𝒊𝒏. 𝑺𝒚𝒔𝒕𝒆𝒎𝑪𝒐𝒔𝒕 = (𝑰𝒏,𝒕 + 𝑭𝒏,𝒕 + 𝑶𝒏,𝒕 + 𝑪𝒏,𝒕)𝒏,𝒕
𝒏 = node index 𝒕 = technology index (power plant, storage facilities and transmission lines) 𝑰𝒏,𝒕 : annualized capital costs of technology type t at node n 𝑭𝒏,𝒕 : annual fuel costs of technology type t at node n 𝑶𝒏,𝒕 : annual operation and maintenance (O&M) costs of technology type t at node n 𝑪𝒏,𝒕 : annual carbon penalties for emissions from technology t at node n
Suppression control
Power grid
• Wind
• Photovoltaics (PV)
• Nuclear
• Coal-fired
• Gas-fired
• Oil-fired
• Hydro
Electricity imports
Electricity load
(exogenous variable)
Electricity exports• Pumped hydro
• Battery
Electricity
Electricity
Electricity Electricity
From other nodes To other nodes

7
Hourly dispatch (May, year 2030 as an example)
• Hourly load curve and intermittency of variable renewables are considered in our analysis.
The model allows us to discuss economic viability considering power system characteristics in detail
Note: These figures show the results in the Base case, which will be discussed later in this presentation.
Source: APERC.
Japan-Hokkaido
Korea
- 40
0
40
80
120
HydroNuclearCoalGasOilPVWindSuppressed PVSuppressed windPumpedBatteryTransmission (China)Transmission (Japan)Transmission (Other)Load
GW
Coal Nuclear
Gas
- 2
0
2
4
6
8
HydroNuclearCoalGasOilPVWindSuppressed PVSuppressed windPumpedBatteryDomestic transmissionTransmission (Russia)Load
GW Wind Solar PV
Coal Nuclear
Pumped (charge) Transmission to East Japan
May
1st
May
15
th
May
31
st

8
112
24
0%20%40%60%80%
100%
Jan
.
Feb
.
Mar
.
Ap
r.
May
Jun
.
Jul.
Au
g.
Sep
.
Oct
.
No
v.
Dec
.
0%-20% 20%-40% 40%-60% 60%-80% 80%-100%
Estimated wind and solar PV output profile for a year, Mongolia1
Variable renewables’ output estimated using meteorological data
1 We estimated these profiles using meteorological data published by NREL. For estimating the wind profile, we also used data from the Inner Mongolia province in China.
Source: NREL and APERC.
Solar PV
112
24
0%20%40%60%80%
100%
Jan
.
Feb
.
Mar
.
Ap
r.
May
Jun
.
Jul.
Au
g.
Sep
.
Oct
.
No
v.
Dec
.
0%-20% 20%-40% 40%-60% 60%-80% 80%-100%
Wind power

9
This presentation discusses five cases for the NEA power system of 2030
1 APERC, 2016. “APEC Energy Demand and Supply Outlook 6th edition”.
Source: APERC.
Base case:
Four Mongolian renewables cases (new int’l transmissions are decided endogenously)
“100GW”: 50GW wind power and 50GW solar PV in Mongolia (exogenous).
“500GW”: 250GW each
“1,000GW”: 500GW each
“2,000GW”: 1000GW each
These assumptions are also applied to the following four cases
No new int’l transmission No renewables installation in Mongolia for power exports Renewable capacity in other countries is fixed to projected capacity for 20301 Fossil fuel capacities are based on optimization Carbon price of 30$/tCO2

10
• Introduction
• Early insights and discussion Generation, Cost, Emissions
Contents

11
Generated electricity, NEA, 2030
• Even “100GW” Mongolian renewables have modest effects on the whole NEA
• Accelerated installation would bring significant changes
Large-scale Mongolian renewables are necessary to change the NEA power mix significantly
Source: APERC.
-25%
0%
25%
50%
75%
-5 000
0
5 000
10 000
15 000
10
0G
W
50
0G
W
10
00
GW
20
00
GW
Base Mongolian renewables
HydroNuclearCoalGasOilPV (except for MN)Wind (except for MN)PV (MN)Wind (MN)Suppressed PVSuppressed windPumped (in)Pumped (out)Battery (in)Battery (out)Transmission lossesShare of renewables
TWh
(right axis)
Coal
Hydro Nuclear
Gas
Wind (Mongolia) PV (Mongolia)
12
-40%
-30%
-20%
-10%
0%
0
2 000
4 000
6 000
8 000
100GW 500GW 1000GW 2000GW
Base Mongolian renewables
RU-FEKoreaJapanChinaNEA emissions changes from the Base case(right axis)
MtCO2/yr
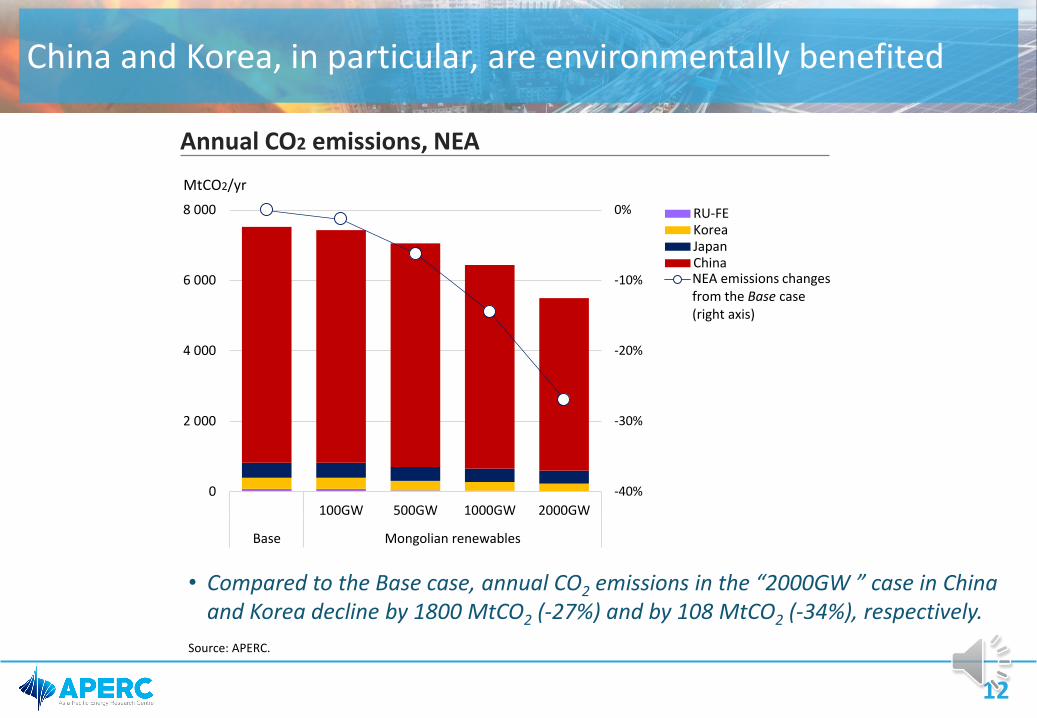
Annual CO2 emissions, NEA
• Compared to the Base case, annual CO2 emissions in the “2000GW ” case in China and Korea decline by 1800 MtCO2 (-27%) and by 108 MtCO2 (-34%), respectively.
China and Korea, in particular, are environmentally benefited
Source: APERC.

13
3
2256
119
44
3
0 (0)
1
333
1
69
19
152
2862
66
TWh/yr
0 - 50
50 - 100
100 - 500
500 - 1000
1000 ~
81
22
1
1
66
19
1111
4
TWh/yr
0 - 50
50 - 100
100 - 500
500 - 1000
1000 ~
8
Net electricity flow
Vast amounts of electricity flows from Mongolia in the “2000GW” case
“2000GW” case
• Main consumer of “Mongolian renewable power” would be the China-North area
Source: APERC.
Base case
China-North

14
- 100
0
100
200
300
400
HydroNuclearCoalGasOilPVWindSuppressed PVSuppressed windPumpedBatteryDomestic trans.Transmission (Korea)Transmission (Other)Load
GW
-1 000
0
1 000
2 000
HydroNuclearCoalGasOilPVWindSuppressed PVSuppressed windPumpedBatteryTransmission (China)Transmission (Other)Load
GW
Coal is one of the major sources of generation in China-North and Korea in the Base case
Source: APERC.
Mongolia
China-North
Korea
Hourly dispatch in selected nodes, May, Base case
- 40
0
40
80
120
HydroNuclearCoalGasOilPVWindSuppressed PVSuppressed windPumpedBatteryTransmission (China)Transmission (Japan)Transmission (Other)Load
GW
Coal Nuclear
Gas
Coal
No renewables assumed in Mongolia in the Base case
Wind

15
Significant amounts of power flow, and quick backup is needed in the “2000GW” case
Source: APERC.
Mongolia
China-North
Korea
- 40
0
40
80
120
HydroNuclearCoalGasOilPVWindSuppressed PVSuppressed windPumpedBatteryTransmission (China)Transmission (Japan)Transmission (Other)Load
GW
- 300
0
300
600
HydroNuclearCoalGasOilPVWindSuppressed PVSuppressed windPumpedBatteryDomestic trans.Transmission (Korea)Transmission (Other)Load
GW
-1 000
0
1 000
2 000
HydroNuclearCoalGasOilPVWindSuppressed PVSuppressed windPumpedBatteryTransmission (China)Transmission (Other)Load
GW
Hourly dispatch in selected nodes, August, “2000GW” case
Nuclear
Wind Solar PV
Suppressed PV Suppressed wind
Exports to China-North
Imports from Mongolia
Transmission to other Chinese nodes Exports to Korea
Imports from China
Exports to Japan

16
Annual generation cost, NEA
• Higher capital costs increase average generation costs, e.g., by 40% in the “2000GW” case
The huge investment cost of renewables and transmission lines is likely to pose economic challenges
Note: References to costs and investments are expressed in 2014 USD. Source: APERC.
0
50
100
150
0
500
1 000
1 500
10
0G
W
50
0G
W
10
00
GW
20
00
GW
Base Mongolian renewables
Capital (PV and wind)
Capital (storage)
Capital (transmission)
Capital (other generation)
O&M
Fuel
Carbon
Average cost (right axis)
Billion USD per year USD/MWh

17
-20
-10
0
10
20
0$ 100$ 200$ 300$ 500$
Carbon price [per tCO2]
Billion USD per year
Economic benefits of “100GW” cases1
• Improved economic viability with higher carbon prices
• Very high carbon price would be important to make the concept economically attractive
Strong emissions reduction policies would be important for implementation
1 Difference between the total cost of the Base case and that of the “100GW” case.
Source: APERC.
Economically beneficial (cost reduction)

18
The Paris Agreement and the “450” scenario Appendix
Source: UNFCCC and IEA.
Article 2 of the Paris Agreement
“This Agreement ... aims to strengthen the global response to the threat of climate change …, including by (a) Holding the increase in the global average temperature to well below 2°C above pre-industrial levels and to pursue efforts to limit the temperature increase to 1.5°C above pre-industrial levels, … ”
Carbon price assumptions in the IEA’s 450 scenario (WEO2015)
[$/tCO2] 2030 2040
China and Russia 75 125
Japan and Korea 100 140
• IEA’s assumed carbon prices are lower than the level required to make the Mongolian renewables cases economically attractive (see the previous & next slides)
• This implies that massive Mongolian renewables may be an option for “beyond 2°C”

19
-300
-200
-100
0
100
0$ 100$ 200$ 300$ 500$
Carbon price [per tCO2]
Billion USD per year
-100
-50
0
50
100
0$ 100$ 200$ 300$ 500$
Carbon price [per tCO2]
Billion USD per year
Economic benefits of selected Mongolian renewables cases1
Economic viability of larger-scale Mongolian renewables cases
1 Difference between the total cost of the Base case and that of respective Mongolian renewables cases.
Source: APERC.
“500GW” case “1000GW” case

20
Large-scale deployments of Mongolian renewables brings environmental benefits, in terms of CO2 emissions reductions; China and Korea, in particular, are benefited
However, a smaller-scale “100GW” of renewables has modest effects on the whole NEA power mix; accelerated installation would be necessary to make the environmental benefits significant
Capital costs for Mongolian renewables and transmission lines would push up electricity supply costs in NEA, posing economic challenges
Strong CO2 reduction policies would make the concept more economically attractive
Conclusion

http://aperc.ieej.or.jp/
Thank you for your kind attention!