Embed Size (px)
Citation preview

Modeling Aerosol Growth in Amine Scrubbing
for Carbon Capture
Yue Zhang, University of Texas at Austin
Gary T. Rochelle, University of Texas at Austin

Executive Summary• Research Objective: understand growth mechanisms and develop strategies to
remove aerosols by quantitative and accurate modeling
• Growth mechanisms:
o as part. conc increases, aerosol growth decreases due to amine driving forcedepletion
o the limiting driving force of aerosol growth is amine
o high amine volatility increases growth
• Strategies to remove aerosols:
o reduce aerosol nuclei below 106 part./cm3
o choose solvents with moderate volatility, avoid solvents with low volatility
o expand WW and pre-humidify dry bed
2

Amine Scrubbing Carbon Capture
Flue gas4~12% CO2
7% H2O
CrossExchanger
Rich Solvent
Absorber1atm40-60 oC
Stripper5 bar150 °C
Lean Solvent
Condenser
CO2 to Compressor
Reboiler
Water Wash40-50 oC
Stack
3

Amine Scrubbing Carbon Capture
Flue gas4~12% CO2
7% H2O
CrossExchanger
Rich Solvent
Absorber1atm40-60 oC
Stripper5 bar150 °C
Lean Solvent
Condenser
CO2 to Compressor
Reboiler
Water Wash40-50 oC
Stack
Nuclei for aerosolsSOx, fly ash
4

Amine Scrubbing Carbon Capture
Flue gas4~12% CO2
7% H2O
CrossExchanger
Rich Solvent
Absorber1atm40-60 oC
Stripper5 bar150 °C
Lean Solvent
Condenser
CO2 to Compressor
Reboiler
Water Wash40-50 oC
Stack
Nuclei for aerosolsSOx, fly ash
5
Bad
• if aerosol is not captured: emissions resultin solvent loss & environmental impact
Good
• if aerosol grows enough: will be captured.> 3 µm, captured by impaction
This work
• How much aerosol grows
• How we can manage aerosol growth

PZ Makes Aerosol• April 2017 UT-SRP pilot plant with 5 m PZ and 52 ppm SO3
Before SO3 injection
6
After SO3 injection
4/26/20174/26/2017

• Limiting driving force for growth
• Solvent selection
• Operating conditions
• Effective process configurations
Growth Mechanisms Are NOT Well-understood
7

Industrial Configurations for Emissions Control
Configurations demonstrated in field
• Acid Wash by Aker Solutions1,2
• Two-stage Water Wash by Linde-BASF3
• Dry Bed by BASF-Linde-RWE Power4,5
In this study
• Aerosol with a wide range of particle number conc
• Amine with different volatility
• Dry Bed, Intercoolers, Multi-stage Water WashJ. Knudsen, et al., 20131
O. Bade, et al., 20142
T. Stoffregen, et al., 20143
P. Moser, et al., 20134
P. Moser, et al., 20145
8

PZ Model by Fulk1, Kang2, and Zhang
• Steady-state absorber and water wash simulations in Aspen Plus, andaerosol calculations in gPROMS
• Proposed gas phase amine driving force depletion
MEA Model by Majeed3
• Steady-state absorber simulations in NTNU in-house simulator, andaerosol calculations in MATLAB
• Also proved gas phase MEA depletion
9
Sequential Aerosol Growth Model
Fulk, et al., 20161
Kang, et al., 20172
Majeed, et al, 20173

Sequential Aerosol Growth Model
Bulk liquid
Aerosol
CO2 (g)CO2 (aq)
Bulk gas
T, Pxi,yi
𝒑𝒓𝒐𝒑𝒆𝒓𝒕𝒊𝒆𝒔
Aerosol-gas
H2O (g) H2O (l)H2O (l)
CO2 (aq)
PZ (g)PZ (aq)PZ (aq)
User defined closed-formequations for P*
CO2& P*
PZ
10

Sequential Aerosol Growth Model
Bulk liquid
Aerosol
CO2 (g)CO2 (aq)
Bulk gas
T, Pxi,yi
𝒑𝒓𝒐𝒑𝒆𝒓𝒕𝒊𝒆𝒔
Aerosol-gas
H2O (g) H2O (l)H2O (l)
CO2 (aq)
PZ (g)PZ (aq)PZ (aq)
User defined closed-formequations for P*
CO2& P*
PZ
11

Bulk liquid
Aerosol
CO2 (g)CO2 (aq)
Bulk gas
T, Pxi,yi
𝒑𝒓𝒐𝒑𝒆𝒓𝒕𝒊𝒆𝒔
Aerosol-gas
H2O (g) H2O (l)H2O (l)
CO2 (aq)
PZ (aq)PZ (aq)
12
PZ (g)
Model Assumptions
PZ mass transfer decreases gas phase PZ
CO2, H2O, N2, T, P still remain constant

Preliminary Modeling Results
Aerosol Growth at Realistic Plant Conditions
13

14
10’
30’
20’
20’
40 oC
40 oC
National Carbon Capture Center(NCCC) Absorber
• Nov 2017 NCCC Campaign
• 0.5 MWe Pilot Solvent Test Unit
• 90% removal

Rate-based Absorber Modeling
• Independence Model
• Developed in Aspen Plus® RateSepTM,1
• Rigorous e-NRTL thermodynamic framework
• Rigorous kinetics with reactions in boundary layer
• Solvent
• 5 m PZ: fast absorption rate, low viscosity, good energy performance
• Lean Loading at 0.22 (mol CO2/mol alk)
P. Frailie, 20141
15

Assumptions for Aerosols
• Well-mixed
• Particle conc at 107 part./cm3
< 106 : emits < 1ppm amine
> 108 : starts coagulation
~ 107 : most often observed at site
• Initial conditions
0.1 µm, 5 m PZ, 0.36 CO2 loading
H2O (l)
CO2 (aq)
PZ (aq)
16

0
2
4
6
8
10
0 0.1 0.2 0.3 0.4 0.5 0.6 0.7 0.8 0.9 1
Dia
met
er (
µm
)
Z/Ztot
WWABS Dry Bed
General aerosol growth profile
• Aerosols grow from 0.1µm to 4.4 in ABS, and 10 in WW (collectable)
• Aerosol initial diameter is not critical
107 part./cm3
17

1.E-07
1.E-06
1.E-05
1.E-04
1.E-03
1.E-02
1.E-01
0 0.1 0.2 0.3 0.4 0.5 0.6 0.7 0.8 0.9 1
Na
no
mole
Z/Ztot
ABS WW
CO2
PZ
H2O
Dry Bed
Component pickup in aerosol
• Aerosols grow in WW by picking up water
107 part./cm3
18

0
1
2
3
4
5
6
7
8
9
10
0 0.1 0.2 0.3 0.4 0.5 0.6 0.7 0.8 0.9 1
Dia
met
er (
µm
)
Z/Ztot
1 part./cm3
107
5*107
108
ABS Dry Bed WW
High part. conc reduces aerosol growth
19

0.0
0.5
1.0
1.5
2.0
2.5
3.0
3.5
0 0.1 0.2 0.3 0.4 0.5 0.6 0.7 0.8 0.9 1
Gas
Ph
ase
PP
Z(P
a)
Z/ZtotABS BOT ABS TOP
1 part./cm3
107
108
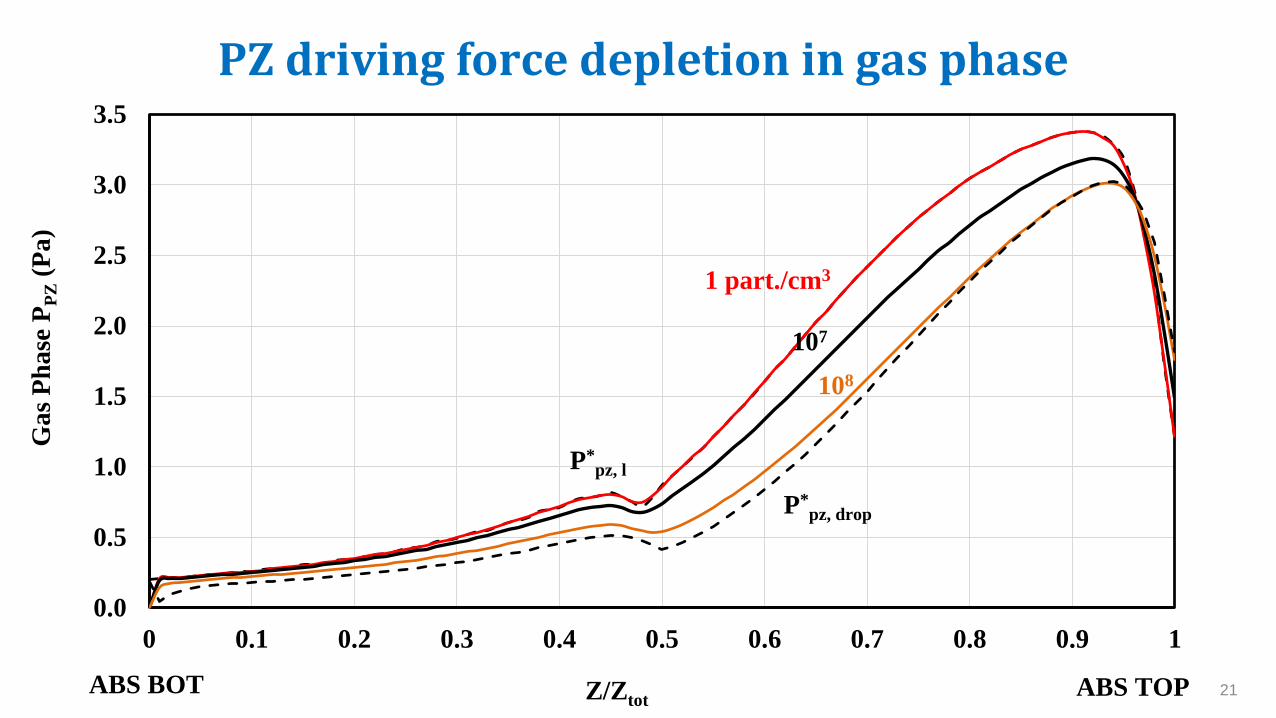
PZ driving force depletion in gas phase
20
0.0
0.5
1.0
1.5
2.0
2.5
3.0
3.5
0 0.1 0.2 0.3 0.4 0.5 0.6 0.7 0.8 0.9 1
Gas
Ph
ase
PP
Z(P
a)
Z/ZtotABS BOT ABS TOP
1 part./cm3
107
108
P*pz, drop
P*pz, l
PZ driving force depletion in gas phase
21

Relative driving force ratio between g-d
• The limiting driving force of growth is PZ
• As part. conc increases, limiting driving force (PZ) shifts from g-d to l-g
• Aerosol is always in equilibrium with water in gas
P*lPg
P*d Pg
∅𝑔𝑑 = 100%
∅𝑔𝑑 = 0%
1 part./cm3 107 108
Avg ∅𝑔𝑑, PZ 100% 72% 32%
Avg ∅𝑔𝑑, water 0% 0% 0%
bulk liquid
22

0
2
4
6
8
10
12
14
16
18
0 0.1 0.2 0.3 0.4 0.5 0.6 0.7 0.8 0.9 1
Dia
met
er (
µm
)
Z/Ztot
ABS WW 40 oC WW
40 oC
Dry
Bed
(Dry Bed)
Base Case
Dry bed needs to be pre-humidified to grow aerosols
107 part./cm3
23

ABS
0
2
4
6
8
10
12
14
16
18
0 0.1 0.2 0.3 0.4 0.5 0.6 0.7 0.8 0.9 1
Dia
met
er (
µm
)
Z/Ztot
WWDry Bed
10x PPZ
0.1x PPZ
Base Case
• Choose solvents with moderate volatility, like PZ (collectable)
• Avoid solvents with low volatility (non-collectable) 24
Increase and decrease PZ volatility by 10x
107 part./cm3

Conclusions - growth mechanisms
• As part. conc increases, aerosol growth decreases due to amine driving
force depletion. The limiting driving force shifts from g-d to l-g
• In NCCC with 5 m PZ
o 107 part./cm3 are collectable
o w/o water wash, 108 part./cm3 are non-collectable
• In water wash, aerosol grows by picking up water
• Higher amine volatility increases growth
25

Recommendations
• Nuclei
o Reduce aerosol nuclei below 106 part./cm3
• Solvent selection
o Choose solvents with moderate volatility, like PZ
o Avoid solvents with low volatility
• Process configurations
o Expand WW
o Pre-humidify dry bed
26

Possible Future Work
• Test a wide variety of amines/blends
• Particle size/residence time distribution
27

For more information
Yue Zhang, Ph.D. Candidate, University of Texas at Austin
Gary T. Rochelle, Professor, University of Texas at Austin