Embed Size (px)
Citation preview

©2017 Tecumseh Products Company LLC
Modeling a Rotary Compressor in GT-SUITE
Dr. Eng Sidnei OliveiraGT Conference 2017

Refrigeration Cycle
HeatAbsorbed
HeatRejected
Compressor Tasks:- Fluid circulation- Gas compression
PressureEnthalpy Diagram
GT Conference 2017
Rotary Compressor
GT Conference 2017
Vane
Block
Roller

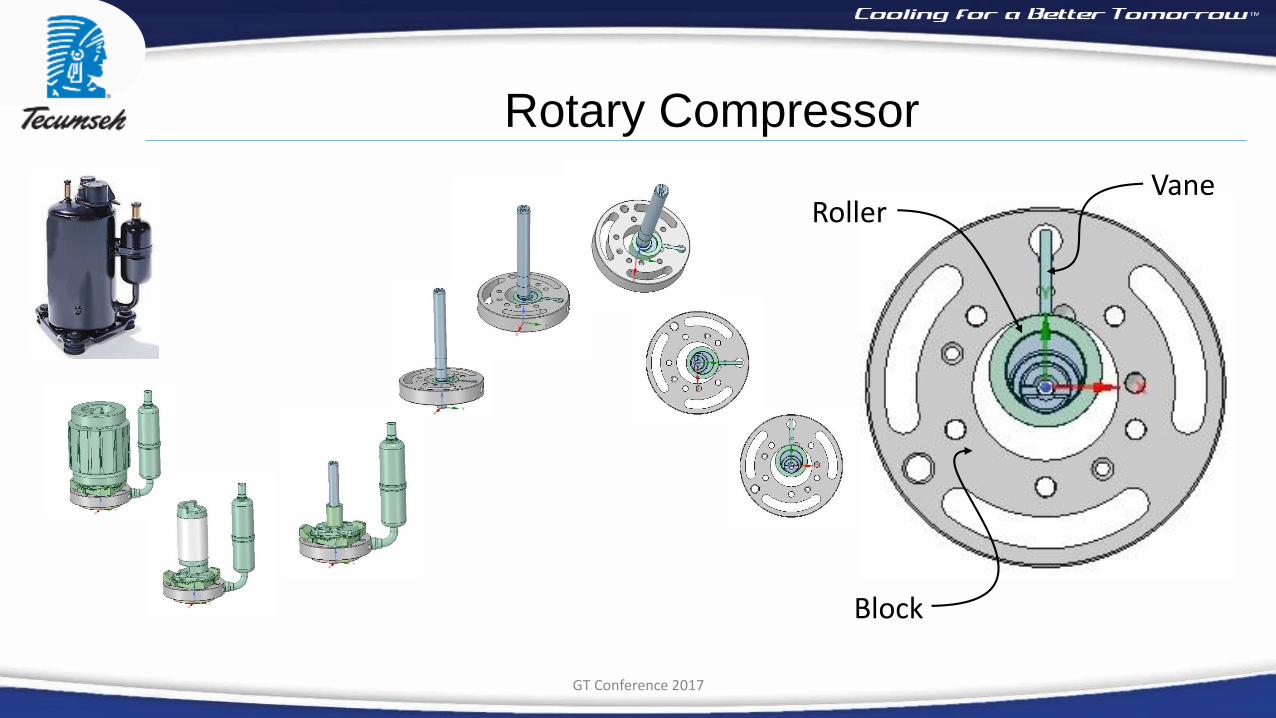
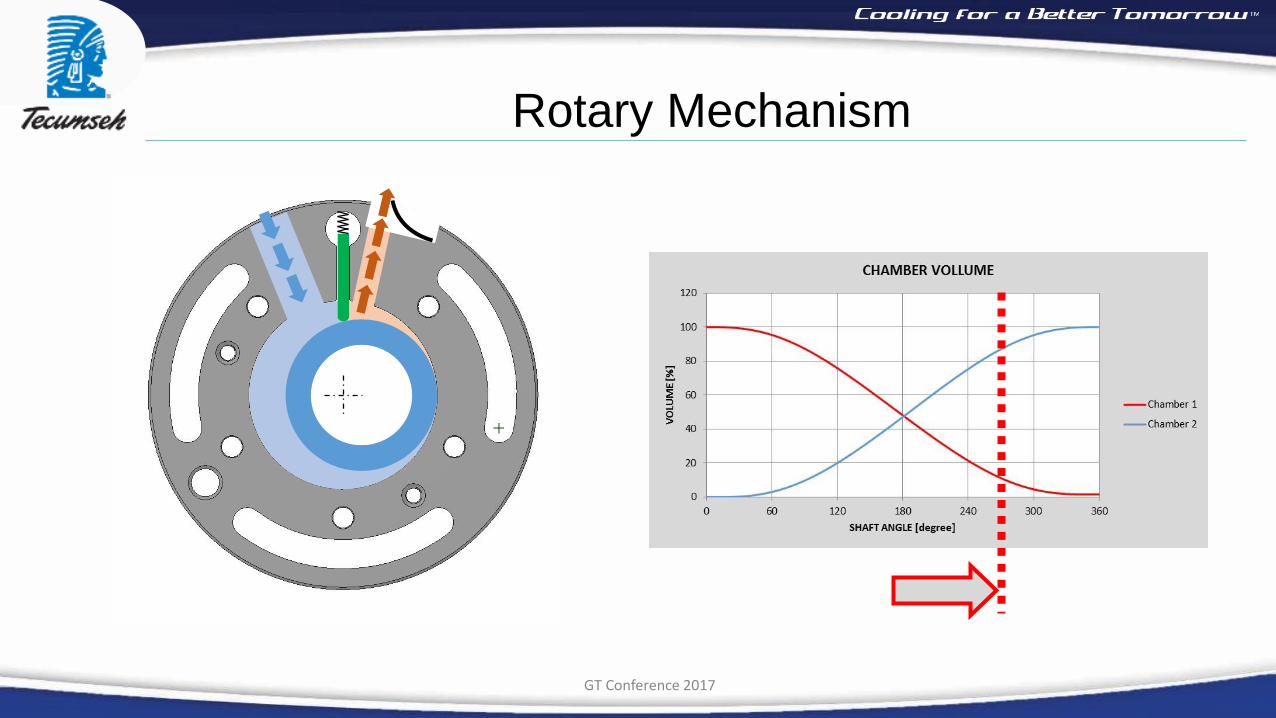
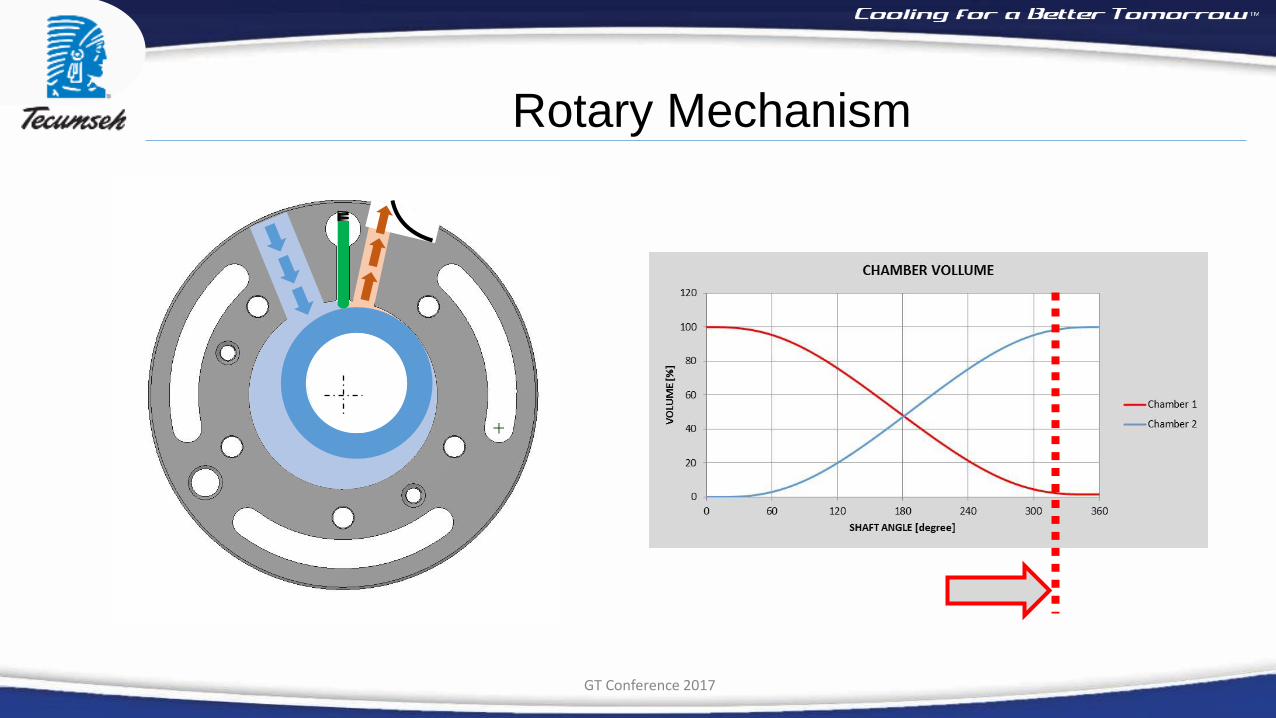
Rotary Mechanism
GT Conference 2017

Rotary Mechanism
GT Conference 2017

Rotary Mechanism
GT Conference 2017
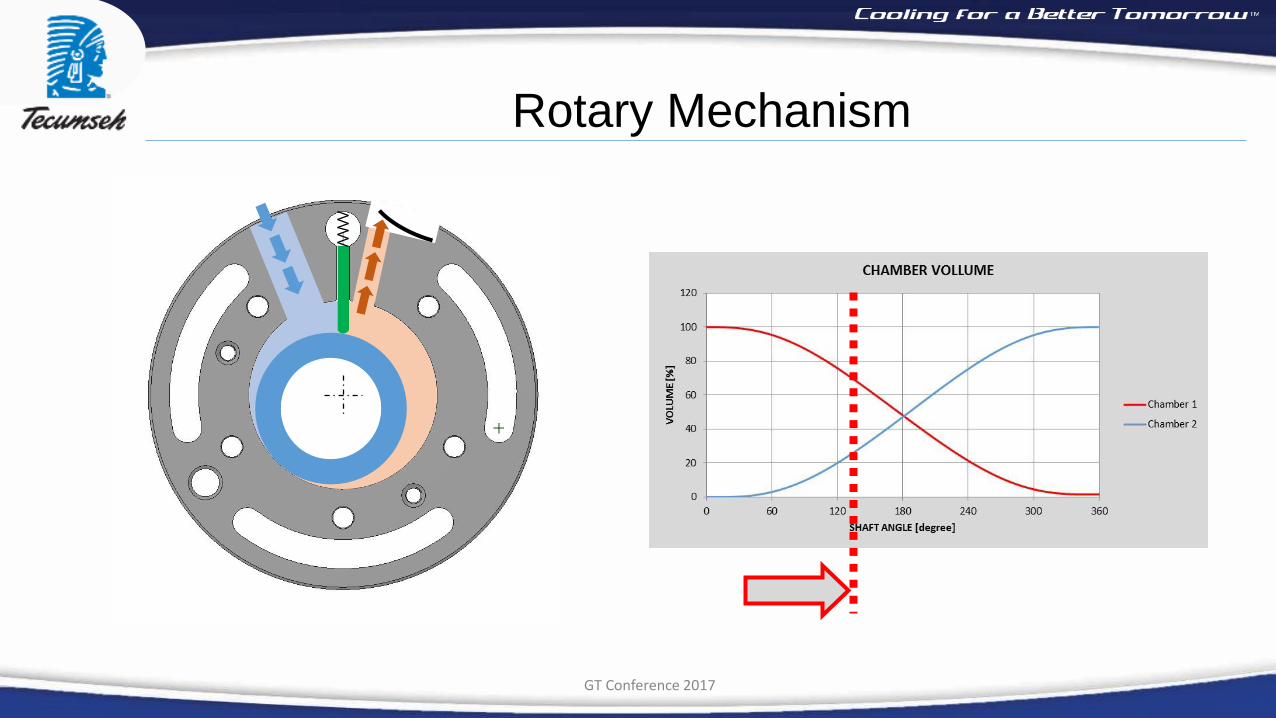
Rotary Mechanism
GT Conference 2017
Rotary Mechanism
GT Conference 2017

Rotary Mechanism
GT Conference 2017
Rotary Mechanism
GT Conference 2017
Rotary Mechanism
GT Conference 2017

Rotary Mechanism
GT Conference 2017 GT Conference 2017

COVERED IN THIS PRESENTATION
REGULAR TEMPLATESFROM
GT LIBRARY
Model Development
▪Regular Templates: Flow (Refrigerant, Lubrication Oil)
Thermal
Bearings
▪Customizations Implemented: Friction Losses
Refrigerant Leakage• Roller/Block
• Roller Top/Bottom
• Vane Top/Bottom
GT Conference 2017
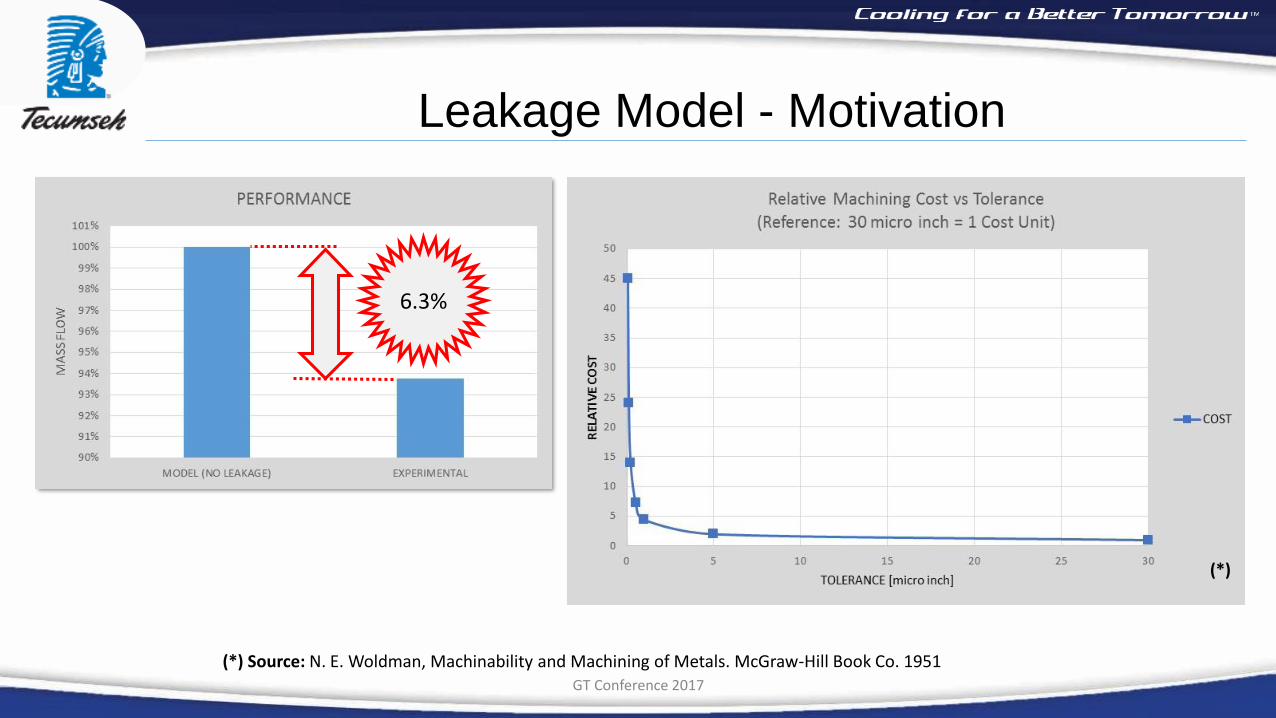
Leakage Model - Motivation
6.3%
(*) Source: N. E. Woldman, Machinability and Machining of Metals. McGraw-Hill Book Co. 1951 GT Conference 2017
(*)

Model Development - Leakages Considered
GT Conference 2017
Roller/Block Leakage
d
Vane Top/Bottom Leakage
Roller Top/Bottom Leakage

Mixture: R410A and Oil
GT Conference 2017
v R410A
Lubricating Oil
Pcc
Psc
ሶ𝑚
CompressionChamber
SuctionChamber
PccPsc
Roller/Block Leakage
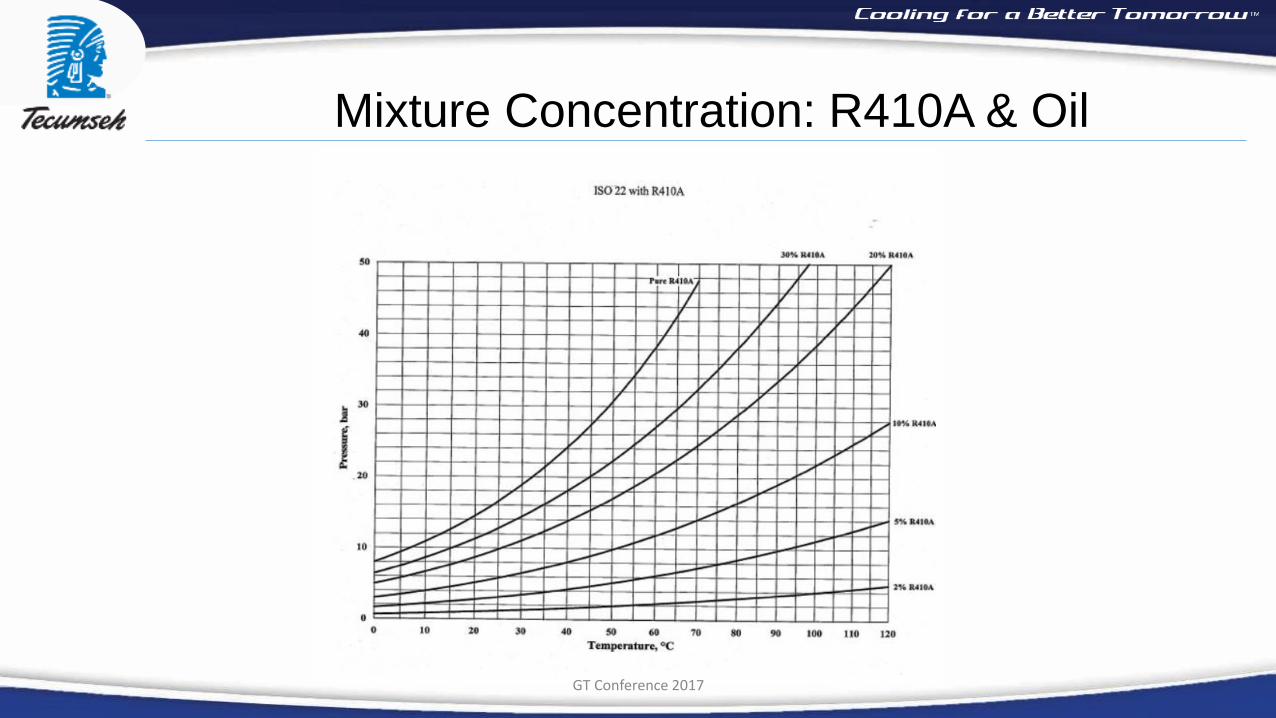
Mixture Concentration: R410A & Oil
GT Conference 2017

Mixture Density: R410A and Oil
GT Conference 2017

Mixture Viscosity: R410A and Oil Lubricant
GT Conference 2017

Leakage Equation – Roller Top/Bottom
ሶ𝑚𝑚 =൯𝜋. ҧ𝜌𝑚(𝛿𝑠𝑢𝑝
3 + 𝛿𝑖𝑛𝑓3)(𝑃𝑐 − 𝑃𝑠
)6. ҧ𝜇𝑚. l n( Τ𝑅𝑟 𝑅𝑖
ሶ𝑚𝑔𝑎𝑠 = 𝑤 ሶ.𝑚𝑚
WORKING CONDITION
Pressure Drop
Source: Brancher, R. D. (2013). Desenvolvimento e Validacao Experimental de um Modelo para Previsao do Desempenhode Compressores Rotativos de Pistao Rolante. Florianopolis. Master Thesis – Federal University of Santa Catarina. Brazil.
Clearance (sup. & inf.)
DIMENSIONS & CONSTANTS
Roller Diam. (ext. & int.)Constants)
RESULTS
Mixture Leakage
Gas Leakage Dynamic viscosity
Density
Concentration
MIXTUREPROPERTIES
FUNCTION OF
TemperaturePressure
GT Conference 2017

Leakage Equation – Roller/Block
ሶ𝑚𝑚 = 0,0162. 𝜇𝑚. 𝛿𝑚(𝑃𝑐 − 𝑃𝑠)𝜌𝑚𝛿𝑚𝜇𝑚
2ℎ𝑟𝛿𝑚
0,504
ሶ𝑚𝑔𝑎𝑠 = 𝑤 ሶ.𝑚𝑚
WORKING CONDITION
Pressure Drop
Source: Brancher, R. D. (2013). Desenvolvimento e Validacao Experimental de um Modelo para Previsao do Desempenhode Compressores Rotativos de Pistao Rolante. Florianopolis. Master Thesis – Federal University of Santa Catarina. Brazil.
RESULTS
Mixture Leakage
Refrigerant Leakage
Roller height
Clearance
DIMENSIONS & CONSTANTS
Constant
Dynamic viscosity
Density
Concentration
MIXTUREPROPERTIES FUNCTION OF
TemperaturePressure
GT Conference 2017

Leakage Equation – Vane Top/Bottom
Source: Brancher, R. D. (2013). Desenvolvimento e Validacao Experimental de um Modelo para Previsao do Desempenhode Compressores Rotativos de Pistao Rolante. Florianopolis. Master Thesis – Federal University of Santa Catarina. Brazil.
ሶ𝑚 = 𝛿𝑠𝑢𝑝 + 𝛿𝑖𝑛𝑓 . 𝑙𝑣 . 𝑃𝑐𝑐2𝑘
)𝑅. 𝑇𝑐𝑐 (𝑘 − 1𝑟𝑝
2𝑘 − 𝑟𝑝
𝑘+1𝑘
Vane Height
DIMENSIONS & CONSTANTS
Clearance (sup. & inf.)
Pressure Ratio
WORKING CONDITION
Temperature Compr. Chamber
Pressure Compr. Chamber
Gas Constant
Cp/Cv
IDEAL GASPROPERTIES
RESULT
Gas Leakage
GT Conference 2017

“FlowMap” Template
GT Conference 2017

“FlowMap” Template
GT Conference 2017
DIMENSIONS&
CONSTANTS
Temperature
Pressure
MIXTUREPROPERTIES
WORKING CONDITIONPressure Drop RESULT
Leakage Flow

Results
GT Conference 2017
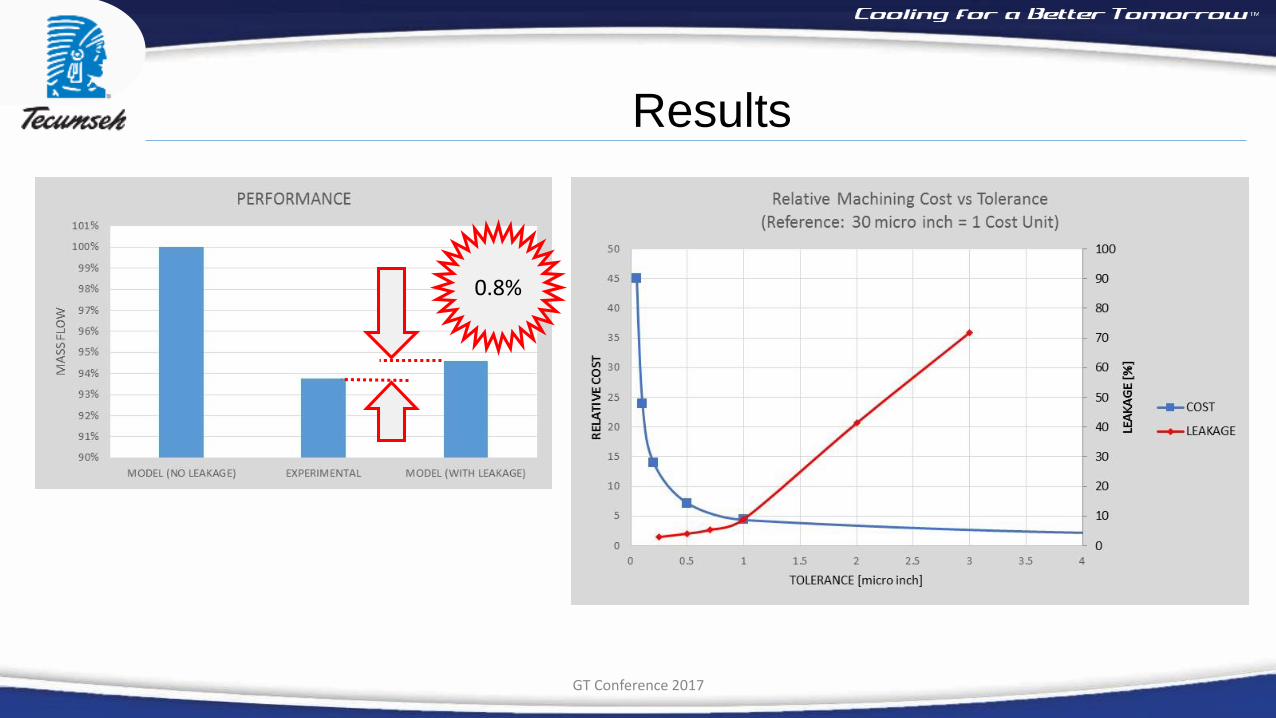
Results
0.8%
GT Conference 2017

Conclusions
▪ The leakage was explained by the model accordingly,
▪ The leakage model reduced from 6.8 to 0.8% the mass flow error estimate,
▪ Tolerance levels could be evaluated based on the leakage estimative,
▪Good agreement was observed between simulated and experimental PV Diagram.
GT Conference 2017

GT Conference 2017
Thank You for your Attention