Embed Size (px)
Citation preview
L. PELKMANS, S. BRAM, F.-S. BOUREIMA , L. TURCKSIN, E.LIEVENS
“BIOSES”
BIOFUELS SUSTAINABLE END USE
Energy
SCIENCE FOR A SUSTAINABLE DEVELOPMENT (SSD)
FINAL REPORT (PHASE 1)
BIOFUELS SUSTAINABLE END USE
“BIOSES”
SD/EN/03A
Promotors
Luc Pelkmans VITO – Vlaamse Instelling voor Technologisch Onderzoek
Boeretang 200, B-2400 Mol Tel. +32 14 33 58 30 ; fax +32 14 32 11 85
Joeri Van Mierlo VUB - Vrije Universiteit Brussel
Faculty of Applied Sciences, dept. Electrical Engineering and Energy Technology (ETEC)
Jacques De Ruyck
VUB - Vrije Universiteit Brussel Faculty of Applied Sciences, dept. Mechanical Engineering (MECH)
Cathy Macharis
VUB - Vrije Universiteit Brussel Faculty of Economic, Social and Political Sciences and Solvay Business School,
dept. MOSI-T Transport and Logistics
Jean-Marc Jossart UCL - Université Catholique de Louvain
Unité d'écophysiologie et amélioration végétale (ECAV)
Authors Luc Pelkmans (VITO)
Svend Bram, Faycal-Siddikou Boureima, Laurence Turcksin (VUB), Elsy Lievens (UCL)
June 2009
Rue de la Science 8 Wetenschapsstraat 8 B-1000 Brussels Belgium Tel: +32 (0)2 238 34 11 – Fax: +32 (0)2 230 59 12 http://www.belspo.be/SSD Contact person: Igor Struyf +32 (0)2 238 35 07 Project Website: www.vito.be/BIOSES Neither the Belgian Science Policy nor any person acting on behalf of the Belgian Science Policy is responsible for the use which might be made of the following information. The authors are responsible for the content.
No part of this publication may be reproduced, stored in a retrieval system, or transmitted in any form or by any means, electronic, mechanical, photocopying, recording, or otherwise, without indicating the reference :
L. Pelkmans, S. Bram, F.-S.Boureima , L. Turcksin, E.Lievens. Biofuels sustainable end use “BIOSES”. Final Report Phase 1. Brussels : Belgian Science Policy 2009 – 51 p. (Research Programme Science for a Sustainable Development)
Project SD/EN/03A - Biofuels Sustainable End uSe “BIOSES”
TABLE OF CONTENT
0 EXECUTIVE SUMMARY 5 1 INTRODUCTION 8 2 BIOFUEL INTRODUCTION SCENARIOS 9 2.1 Overview different biofuel options 9
2.1.1 Biofuels in brief 9 2.2 Vehicle application 10
2.2.1 Link between Euro norm and biofuels compatibility 10 2.2.2 End user groups 13
2.3 Scenarios 14 3 WELL-TO-WHEEL EMISSIONS AND ENERGY CONSUMPTION 18 3.1 Emission-impact Well-to-Tank 18
3.1.1 Distribution of biofuels in the Belgian context. 19 3.2 Vehicle fuel consumption and emissions 21
3.2.1 Biodiesel 21 3.2.2 Bio-ethanol 22 3.2.3 Pure plant oil 23 3.2.4 Synthetic diesel fuels from biomass 23 3.2.5 Vehicle tests 23
4 SOCIO-ECONOMIC FEASIBILITY 26 4.1 Barriers for biofuel introduction 26
4.1.1 Legal aspect and development of biofuels market in Belgium 26 4.1.2 Barriers 26
4.2 Cost aspects 28 4.2.1 Micro-economic cost overview 28 4.2.2 Life cycle cost analysis 31
5 IMPACT ON BELGIAN LEVEL 34 5.1 SPA analysis 34
5.1.1 Methodology 34 5.1.2 System perturbations 35 5.1.3 Exact system boundaries 36 5.1.4 New version of the SPA software 37
5.2 Macro-economic analysis 38 5.3 MAMCA exercise for stakeholder consultation 41 6 PRELIMINARY CONCLUSIONS AND POLICY RECOMMENDATIONS 44 7 FUTURE PERSPECTIVES AND PLANNING FOR PHASE 2 OF THE PROJECT 46 REFERENCES 49
SSD “Science for a Sustainable Development” - Energy 3
Project SD/EN/03A - Biofuels Sustainable End uSe “BIOSES”
ACRONYMS, ABBREVIATIONS AND UNITS AHP Analytical Hierarchical Process B5, B30, … 5, 30% biodiesel blend in diesel BELSPO Belgian Science Policy BTL biomass to liquid biofuel CH4 methane CNG compressed natural gas CO2 carbon dioxide CO carbon monoxide DB database DME Di-methyl ether DUBDC Dutch Urban Bus Driving Cycle E5, E7, … E85 5, 7, …, 85% ethanol blend in petrol EPA Environmental Protection Agency ETBE ethyl tertiary buthyl ether EC European Commission FFV flexi-fuel vehicle FT Fischer-Tropsch GHG Greenhouse gas
Giga (109)Joule GJ GDSM Group Decision Support Methods GTL gas-to-liquid GUI graphical user interface HC hydrocarbons HD heavy duty HVO hydrogenated vegetable oil LCA Life Cycle Analysis LCC Life Cycle Cost analysis LCI Life Cycle Inventory LD light duty LPG Liquefied Petroleum Gas MAMCA Multi-Actor-Multi-Criteria Analysis MCDA Multi-Criteria-Decision Analysis MM manmonths MTBE methyl tertiary buthyl ether N2O di-nitrogen oxide NGO Non Governmental Organization NMVOC non-methane volatile organic carbon NOx nitrogen oxides PM10 particulate matter (size < 10�m) PPO pure plant oil RME rapeseed methyl ester RVP Reid Vapour Pressure SO2 sulpur dioxide TTW Tank-to-wheel SPA System Perturbation Analysis SORT Standardised On-Road Test Cycles SUV Sport Utility Vehicle US United States VW Volkswagen WTT Well-to-tank WTW Well-to-wheel
SSD “Science for a Sustainable Development” - Energy 4

Project SD/EN/03A - Biofuels Sustainable End uSe “BIOSES”
0 Executive summary Biofuels are currently in the middle of the attention. The European Parliament has recently accepted a new European ‘Renewable Energy Directive’, which includes a binding target of 10% renewable fuels (mostly biofuels) in transport in 2020. Different scenarios are possible to reach this. With biofuels now reaching a visible scale at the European level, discussions are emerging about the sustainability of biofuels compared to fossil fuels. They focus mostly on the origin of the feedstock and the greenhouse gas emissions associated to its production; however the effects due to the use of vehicles running on biofuels should also be considered. The use of biofuels in the transport sector should happen in a sustainable way that balances the main transport related challenges of greenhouse gas reduction, reducing oil dependency and improving air quality. The BIOSES project analyses the impact of different market introduction scenarios of biofuels in the Belgian transport system, with the focus on the end user perspective (demand side). Time horizon for the analyses goes from short term (2010) over medium term (2020) up to long term (2030). Based on up-to-date data (complemented with own measurements) of energy use, emissions and cost, the project looks into the practical feasibility and the ecological, socio-economic and macro-economic impact of the introduction of biofuels in Belgium. The project will use the results to create a roadmap for the introduction of biofuels in Belgium, with the emphasis on the demand side (end users), identifying technical and policy needs on short, medium and long term. The project runs from begin 2007 till end 2010. This report shows the results of the first phase of the project (2007-2008), which focused on
- defining possible biofuel introduction scenarios, in consultation with stakeholders; - gathering up-to-date data on energy use and emissions on well-to-wheel basis for different
biofuels; this also includes own emission measurements on vehicles; - gathering cost figures and estimations for future costs of different biofuels, from user
perspective; - feasibility and practical barriers for the introduction of biofuels, including first policy
suggestions; - preparing the necessary tools and methods for analysis on macro-level (system
perturbation analysis, macro-economic analysis). Scenarios There are various strategies to introduce biofuels in transport. The most obvious choice is to blend a limited percentage of biodiesel, HVO or BTL to all diesel fuel and a certain share of ethanol (or derived ETBE) to all gasoline fuel. Future, current, and even older vehicles need to be compatible to these biofuel blends. The general blending of biofuels should be dealt with on European level, in cooperation with the fuel and vehicle sectors. On the other hand there are number of advantages to introduce higher biofuel blends, and even pure biofuels. (1) using high blends is much more visible. The application can be supported through clear incentives on vehicle level (which is not possible for general blending). (2) Only high blends / pure biofuels can really provide an alternative to become independent from fossil fuels. (3) Certain high blend biofuels provide very low exhaust gas emissions, so these can be promoted for direct environmental reasons (air quality) in city traffic. Based on the technological evolution in vehicle models, the likely biofuel blends on the European markets, and the possible interest of certain end user groups (e.g. public transport, agriculture, …), 10 scenarios were described. One was the business-as-usual scenario, basing assumptions on actual policy. Further we have two scenarios with increased general blending of biodiesel to diesel,
SSD “Science for a Sustainable Development” - Energy 5
Project SD/EN/03A - Biofuels Sustainable End uSe “BIOSES”
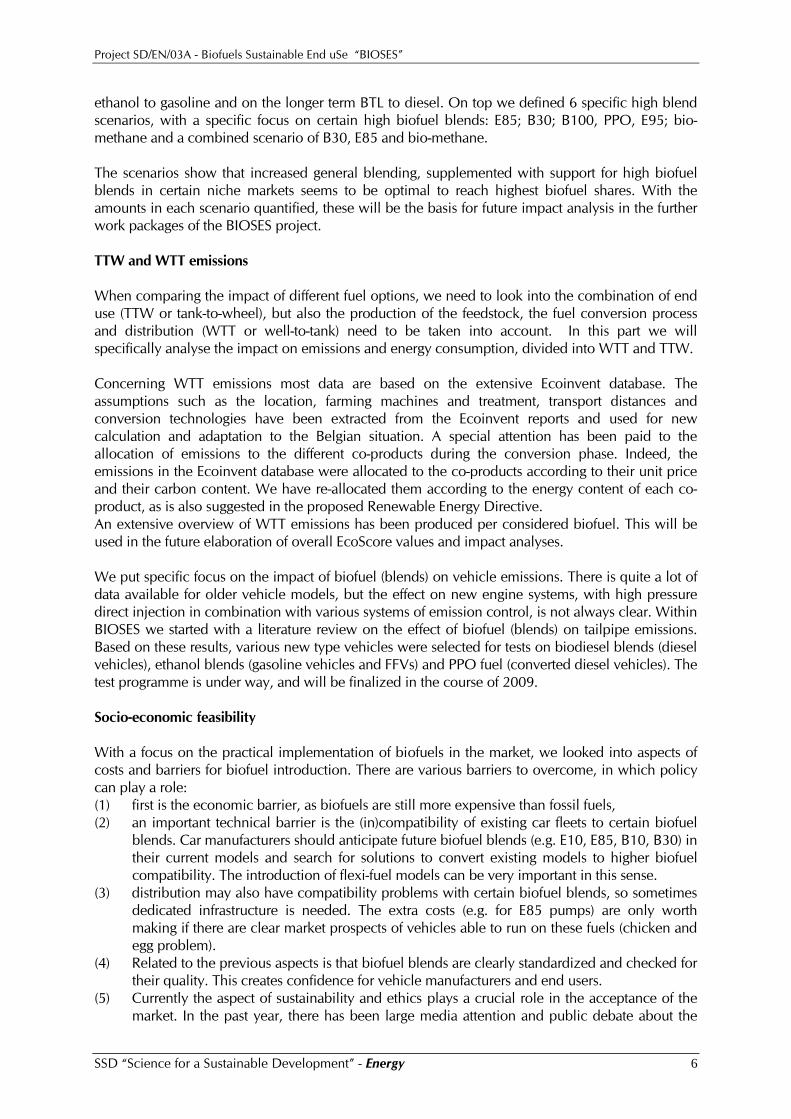
ethanol to gasoline and on the longer term BTL to diesel. On top we defined 6 specific high blend scenarios, with a specific focus on certain high biofuel blends: E85; B30; B100, PPO, E95; bio-methane and a combined scenario of B30, E85 and bio-methane. The scenarios show that increased general blending, supplemented with support for high biofuel blends in certain niche markets seems to be optimal to reach highest biofuel shares. With the amounts in each scenario quantified, these will be the basis for future impact analysis in the further work packages of the BIOSES project. TTW and WTT emissions When comparing the impact of different fuel options, we need to look into the combination of end use (TTW or tank-to-wheel), but also the production of the feedstock, the fuel conversion process and distribution (WTT or well-to-tank) need to be taken into account. In this part we will specifically analyse the impact on emissions and energy consumption, divided into WTT and TTW. Concerning WTT emissions most data are based on the extensive Ecoinvent database. The assumptions such as the location, farming machines and treatment, transport distances and conversion technologies have been extracted from the Ecoinvent reports and used for new calculation and adaptation to the Belgian situation. A special attention has been paid to the allocation of emissions to the different co-products during the conversion phase. Indeed, the emissions in the Ecoinvent database were allocated to the co-products according to their unit price and their carbon content. We have re-allocated them according to the energy content of each co-product, as is also suggested in the proposed Renewable Energy Directive. An extensive overview of WTT emissions has been produced per considered biofuel. This will be used in the future elaboration of overall EcoScore values and impact analyses. We put specific focus on the impact of biofuel (blends) on vehicle emissions. There is quite a lot of data available for older vehicle models, but the effect on new engine systems, with high pressure direct injection in combination with various systems of emission control, is not always clear. Within BIOSES we started with a literature review on the effect of biofuel (blends) on tailpipe emissions. Based on these results, various new type vehicles were selected for tests on biodiesel blends (diesel vehicles), ethanol blends (gasoline vehicles and FFVs) and PPO fuel (converted diesel vehicles). The test programme is under way, and will be finalized in the course of 2009. Socio-economic feasibility With a focus on the practical implementation of biofuels in the market, we looked into aspects of costs and barriers for biofuel introduction. There are various barriers to overcome, in which policy can play a role: (1) first is the economic barrier, as biofuels are still more expensive than fossil fuels, (2) an important technical barrier is the (in)compatibility of existing car fleets to certain biofuel
blends. Car manufacturers should anticipate future biofuel blends (e.g. E10, E85, B10, B30) in their current models and search for solutions to convert existing models to higher biofuel compatibility. The introduction of flexi-fuel models can be very important in this sense.
(3) distribution may also have compatibility problems with certain biofuel blends, so sometimes dedicated infrastructure is needed. The extra costs (e.g. for E85 pumps) are only worth making if there are clear market prospects of vehicles able to run on these fuels (chicken and egg problem).
(4) Related to the previous aspects is that biofuel blends are clearly standardized and checked for their quality. This creates confidence for vehicle manufacturers and end users.
(5) Currently the aspect of sustainability and ethics plays a crucial role in the acceptance of the market. In the past year, there has been large media attention and public debate about the
SSD “Science for a Sustainable Development” - Energy 6
Project SD/EN/03A - Biofuels Sustainable End uSe “BIOSES”
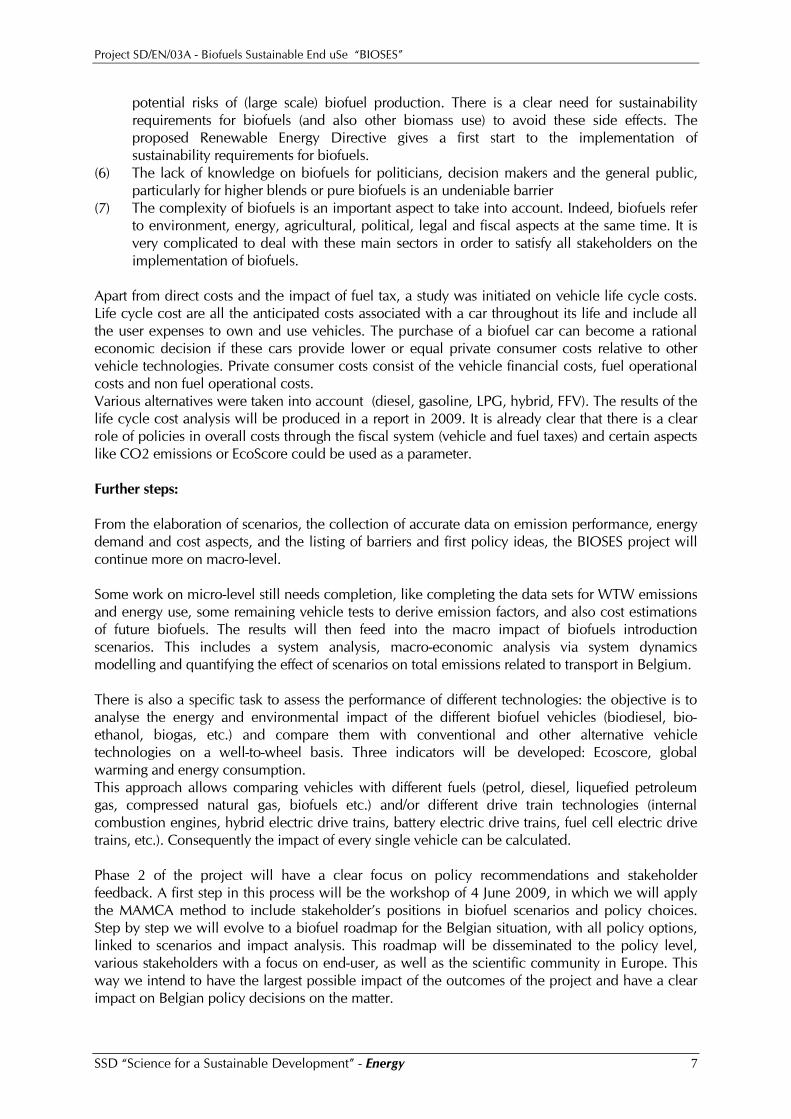
potential risks of (large scale) biofuel production. There is a clear need for sustainability requirements for biofuels (and also other biomass use) to avoid these side effects. The proposed Renewable Energy Directive gives a first start to the implementation of sustainability requirements for biofuels.
(6) The lack of knowledge on biofuels for politicians, decision makers and the general public, particularly for higher blends or pure biofuels is an undeniable barrier
(7) The complexity of biofuels is an important aspect to take into account. Indeed, biofuels refer to environment, energy, agricultural, political, legal and fiscal aspects at the same time. It is very complicated to deal with these main sectors in order to satisfy all stakeholders on the implementation of biofuels.
Apart from direct costs and the impact of fuel tax, a study was initiated on vehicle life cycle costs. Life cycle cost are all the anticipated costs associated with a car throughout its life and include all the user expenses to own and use vehicles. The purchase of a biofuel car can become a rational economic decision if these cars provide lower or equal private consumer costs relative to other vehicle technologies. Private consumer costs consist of the vehicle financial costs, fuel operational costs and non fuel operational costs. Various alternatives were taken into account (diesel, gasoline, LPG, hybrid, FFV). The results of the life cycle cost analysis will be produced in a report in 2009. It is already clear that there is a clear role of policies in overall costs through the fiscal system (vehicle and fuel taxes) and certain aspects like CO2 emissions or EcoScore could be used as a parameter. Further steps: From the elaboration of scenarios, the collection of accurate data on emission performance, energy demand and cost aspects, and the listing of barriers and first policy ideas, the BIOSES project will continue more on macro-level. Some work on micro-level still needs completion, like completing the data sets for WTW emissions and energy use, some remaining vehicle tests to derive emission factors, and also cost estimations of future biofuels. The results will then feed into the macro impact of biofuels introduction scenarios. This includes a system analysis, macro-economic analysis via system dynamics modelling and quantifying the effect of scenarios on total emissions related to transport in Belgium. There is also a specific task to assess the performance of different technologies: the objective is to analyse the energy and environmental impact of the different biofuel vehicles (biodiesel, bio-ethanol, biogas, etc.) and compare them with conventional and other alternative vehicle technologies on a well-to-wheel basis. Three indicators will be developed: Ecoscore, global warming and energy consumption. This approach allows comparing vehicles with different fuels (petrol, diesel, liquefied petroleum gas, compressed natural gas, biofuels etc.) and/or different drive train technologies (internal combustion engines, hybrid electric drive trains, battery electric drive trains, fuel cell electric drive trains, etc.). Consequently the impact of every single vehicle can be calculated. Phase 2 of the project will have a clear focus on policy recommendations and stakeholder feedback. A first step in this process will be the workshop of 4 June 2009, in which we will apply the MAMCA method to include stakeholder’s positions in biofuel scenarios and policy choices. Step by step we will evolve to a biofuel roadmap for the Belgian situation, with all policy options, linked to scenarios and impact analysis. This roadmap will be disseminated to the policy level, various stakeholders with a focus on end-user, as well as the scientific community in Europe. This way we intend to have the largest possible impact of the outcomes of the project and have a clear impact on Belgian policy decisions on the matter.
SSD “Science for a Sustainable Development” - Energy 7
Project SD/EN/03A - Biofuels Sustainable End uSe “BIOSES”
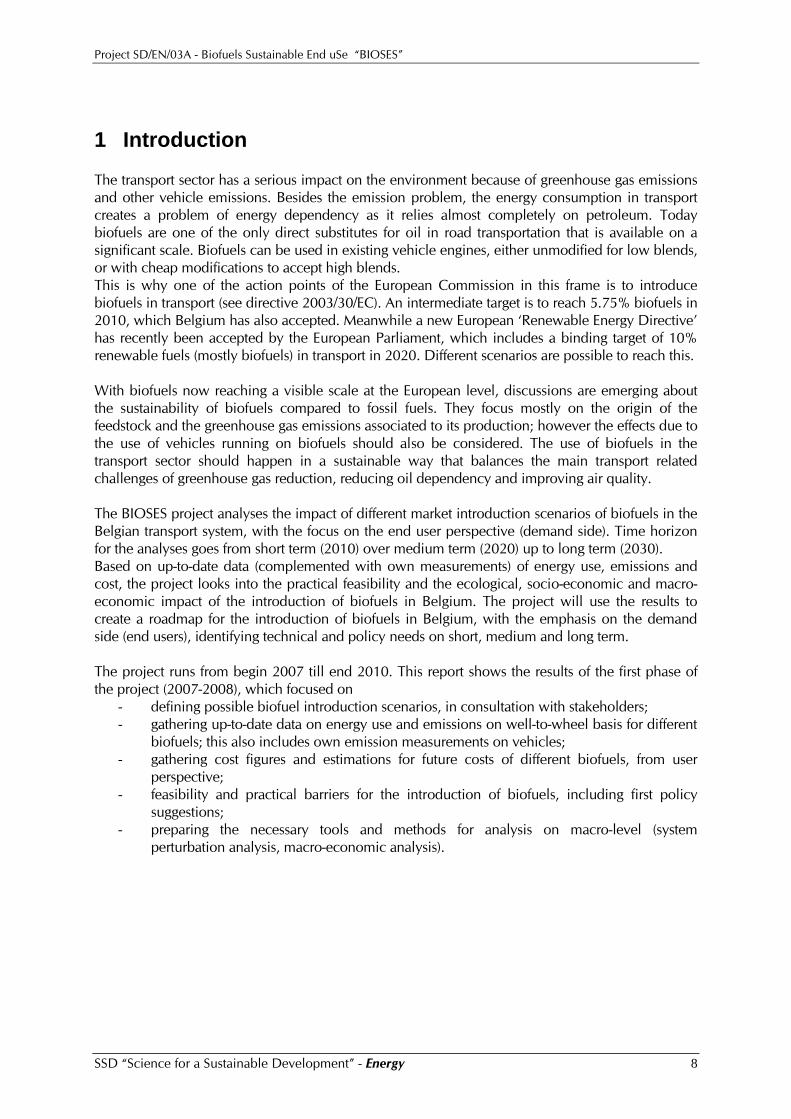
1 Introduction The transport sector has a serious impact on the environment because of greenhouse gas emissions and other vehicle emissions. Besides the emission problem, the energy consumption in transport creates a problem of energy dependency as it relies almost completely on petroleum. Today biofuels are one of the only direct substitutes for oil in road transportation that is available on a significant scale. Biofuels can be used in existing vehicle engines, either unmodified for low blends, or with cheap modifications to accept high blends. This is why one of the action points of the European Commission in this frame is to introduce biofuels in transport (see directive 2003/30/EC). An intermediate target is to reach 5.75% biofuels in 2010, which Belgium has also accepted. Meanwhile a new European ‘Renewable Energy Directive’ has recently been accepted by the European Parliament, which includes a binding target of 10% renewable fuels (mostly biofuels) in transport in 2020. Different scenarios are possible to reach this. With biofuels now reaching a visible scale at the European level, discussions are emerging about the sustainability of biofuels compared to fossil fuels. They focus mostly on the origin of the feedstock and the greenhouse gas emissions associated to its production; however the effects due to the use of vehicles running on biofuels should also be considered. The use of biofuels in the transport sector should happen in a sustainable way that balances the main transport related challenges of greenhouse gas reduction, reducing oil dependency and improving air quality. The BIOSES project analyses the impact of different market introduction scenarios of biofuels in the Belgian transport system, with the focus on the end user perspective (demand side). Time horizon for the analyses goes from short term (2010) over medium term (2020) up to long term (2030). Based on up-to-date data (complemented with own measurements) of energy use, emissions and cost, the project looks into the practical feasibility and the ecological, socio-economic and macro-economic impact of the introduction of biofuels in Belgium. The project will use the results to create a roadmap for the introduction of biofuels in Belgium, with the emphasis on the demand side (end users), identifying technical and policy needs on short, medium and long term. The project runs from begin 2007 till end 2010. This report shows the results of the first phase of the project (2007-2008), which focused on
- defining possible biofuel introduction scenarios, in consultation with stakeholders; - gathering up-to-date data on energy use and emissions on well-to-wheel basis for different
biofuels; this also includes own emission measurements on vehicles; - gathering cost figures and estimations for future costs of different biofuels, from user
perspective; - feasibility and practical barriers for the introduction of biofuels, including first policy
suggestions; - preparing the necessary tools and methods for analysis on macro-level (system
perturbation analysis, macro-economic analysis).
SSD “Science for a Sustainable Development” - Energy 8

Project SD/EN/03A - Biofuels Sustainable End uSe “BIOSES”
2 Biofuel introduction scenarios
2.1 Overview different biofuel options Biofuels are usually categorised into ‘conventional’ and ‘advanced’ biofuels (often also referred to as 1st and 2nd generation) [Pelkmans et al., 2007]. The term ‘conventional biofuels’ refers to ethanol from sugar or starch crops, biodiesel from vegetable oils, as well as bio-methane and pure vegetable oil. The production of these biofuels is based on traditional chemistry like fermentation and esterification and other well-established processes that in essence are quite mature. ‘Advanced biofuels’ are the product of more technology-challenging processes that are still in the research or demonstration phase, at the same time implying great potentials with respect to life cycle energy, greenhouse gas emissions and cost reduction, especially on the feedstock side. Their main advantage lies in their ability to use a broad range of feedstock, including by-products, woody materials etc.
2.1.1 Biofuels in brief Bio-ethanol is mainly produced by fermentation of sugar or starch crops, such as sugarcane, corn, sugar beet and wheat. It can be used in different ways to replace fossil based gasoline: as low blends in the car fleet (up to 25% in Brazil, 10% in the USA and currently 5% in Europe) or high blends (85% and above) in dedicated flexi-fuel vehicles, or as ETBE (ethyl tertiary butyl ether) to replace MTBE in the fuel production processes. Currently, around 75% of bio-ethanol in Europe is used as ETBE. ETBE is less volatile than ethanol, but requires an additional production process step with isobutylene. Bio-ethanol and ETBE share the advantage of being high-octane products. The European gasoline norm EN228 accepts up to 5%volume ethanol and up to 15%volume ETBE (ethanol share of ETBE is 47%). An increase up to 10%volume ethanol is suggested in the proposed Revision of the Fuel Quality Directive [EC, 2007b]. Advanced or lignocellulosic ethanol does not depend on a sugar- or starch-based feedstock but can use a much broader variety of feedstock, such as straw, maize stalks and woody material. The lignocellulosic biomass is firstly pre-treated (acid or vapour process), then treated with enzymes and hydrolysis in order to extract sugar for ethanol production by fermentation. While this is still a process in R&D and demonstration phase, it can build on major parts of conventional bioethanol plants. The final product is chemically identical with first generation bioethanol, but generally emits less greenhouse gas emissions on a well-to-wheel basis. Biodiesel (also fatty acid methyl ester, FAME) is mainly produced from oil crops (such as rapeseed and sunflower), waste cooking oils or animal fats. The extracted oils are converted by transesterification with an alcohol (usually methanol) to produce biodiesel. Biodiesel is used in diesel engines and can be applied in different blend rates with fossil diesel fuel: blending up to 5% is compatible with all existing diesel vehicles, for higher blends some changes to the engine and fuel system may be necessary (mainly rubber and plastic materials in older engine types), but overall the required adjustments are minor. Currently there are also concerns on the compatibility of higher biodiesel blends with new particulate filter control systems. In Germany biodiesel represents more than 10% of diesel fuel use in transport (2006-2007). Hundreds of thousands of diesel vehicles are running on pure biodiesel. The European diesel norm EN590 accepts up to 5%volume FAME. The European standardisation institute CEN was mandated by the European Commission to work towards an increase up to 10%volume FAME [EC, 2006]. Meanwhile in Germany, France and Austria there is an agreement to increase the accepted biodiesel fraction to 7%volume from 2008.
SSD “Science for a Sustainable Development” - Energy 9
Project SD/EN/03A - Biofuels Sustainable End uSe “BIOSES”
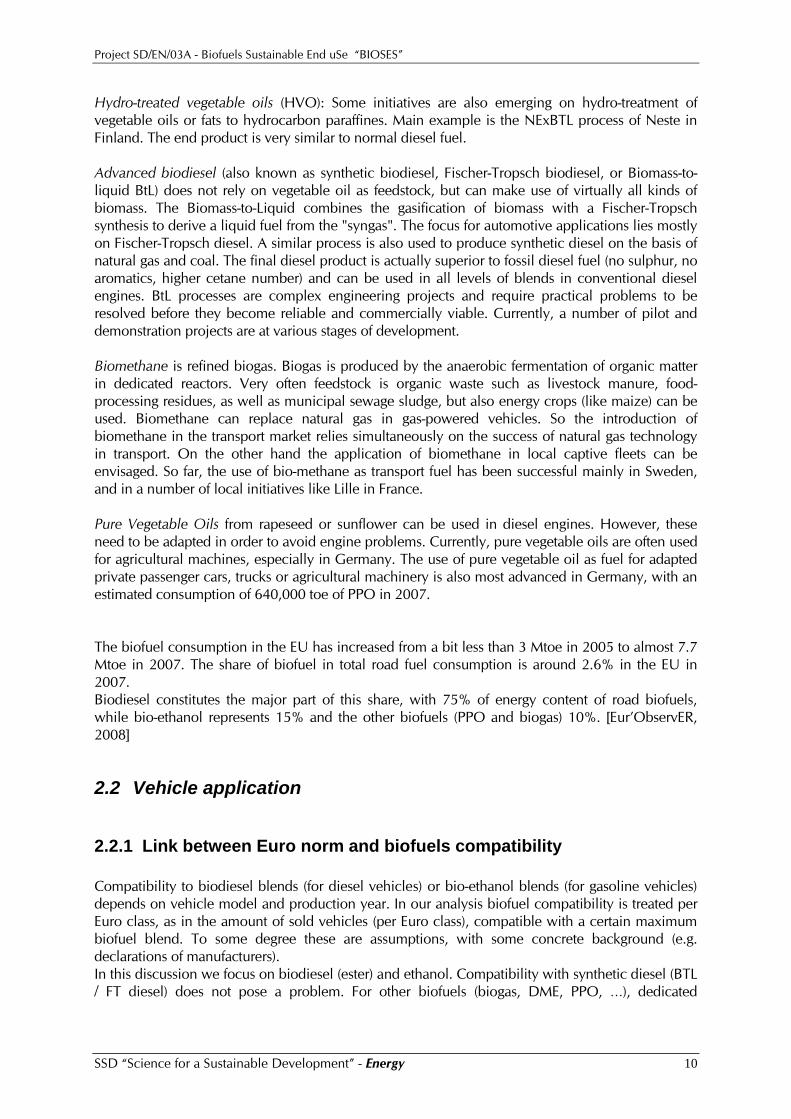
Hydro-treated vegetable oils (HVO): Some initiatives are also emerging on hydro-treatment of vegetable oils or fats to hydrocarbon paraffines. Main example is the NExBTL process of Neste in Finland. The end product is very similar to normal diesel fuel. Advanced biodiesel (also known as synthetic biodiesel, Fischer-Tropsch biodiesel, or Biomass-to-liquid BtL) does not rely on vegetable oil as feedstock, but can make use of virtually all kinds of biomass. The Biomass-to-Liquid combines the gasification of biomass with a Fischer-Tropsch synthesis to derive a liquid fuel from the "syngas". The focus for automotive applications lies mostly on Fischer-Tropsch diesel. A similar process is also used to produce synthetic diesel on the basis of natural gas and coal. The final diesel product is actually superior to fossil diesel fuel (no sulphur, no aromatics, higher cetane number) and can be used in all levels of blends in conventional diesel engines. BtL processes are complex engineering projects and require practical problems to be resolved before they become reliable and commercially viable. Currently, a number of pilot and demonstration projects are at various stages of development. Biomethane is refined biogas. Biogas is produced by the anaerobic fermentation of organic matter in dedicated reactors. Very often feedstock is organic waste such as livestock manure, food-processing residues, as well as municipal sewage sludge, but also energy crops (like maize) can be used. Biomethane can replace natural gas in gas-powered vehicles. So the introduction of biomethane in the transport market relies simultaneously on the success of natural gas technology in transport. On the other hand the application of biomethane in local captive fleets can be envisaged. So far, the use of bio-methane as transport fuel has been successful mainly in Sweden, and in a number of local initiatives like Lille in France. Pure Vegetable Oils from rapeseed or sunflower can be used in diesel engines. However, these need to be adapted in order to avoid engine problems. Currently, pure vegetable oils are often used for agricultural machines, especially in Germany. The use of pure vegetable oil as fuel for adapted private passenger cars, trucks or agricultural machinery is also most advanced in Germany, with an estimated consumption of 640,000 toe of PPO in 2007. The biofuel consumption in the EU has increased from a bit less than 3 Mtoe in 2005 to almost 7.7 Mtoe in 2007. The share of biofuel in total road fuel consumption is around 2.6% in the EU in 2007. Biodiesel constitutes the major part of this share, with 75% of energy content of road biofuels, while bio-ethanol represents 15% and the other biofuels (PPO and biogas) 10%. [Eur’ObservER, 2008]
2.2 Vehicle application
2.2.1 Link between Euro norm and biofuels compatibility Compatibility to biodiesel blends (for diesel vehicles) or bio-ethanol blends (for gasoline vehicles) depends on vehicle model and production year. In our analysis biofuel compatibility is treated per Euro class, as in the amount of sold vehicles (per Euro class), compatible with a certain maximum biofuel blend. To some degree these are assumptions, with some concrete background (e.g. declarations of manufacturers). In this discussion we focus on biodiesel (ester) and ethanol. Compatibility with synthetic diesel (BTL / FT diesel) does not pose a problem. For other biofuels (biogas, DME, PPO, …), dedicated
SSD “Science for a Sustainable Development” - Energy 10
Project SD/EN/03A - Biofuels Sustainable End uSe “BIOSES”
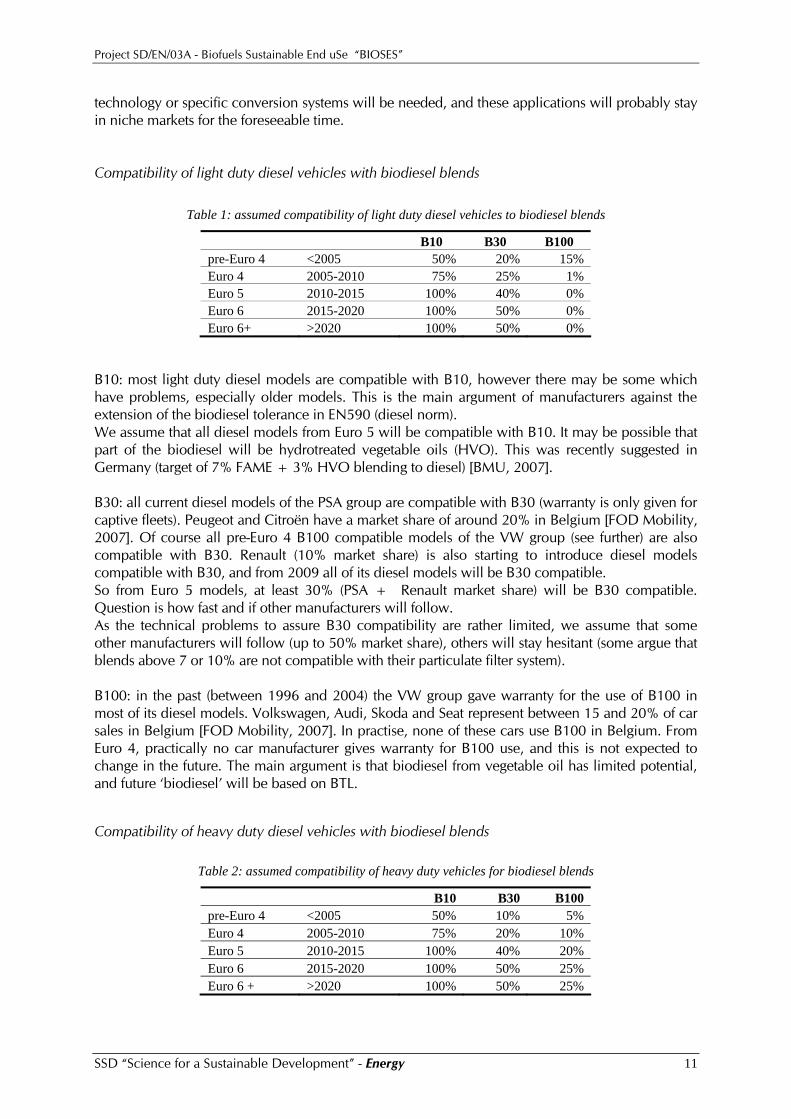
technology or specific conversion systems will be needed, and these applications will probably stay in niche markets for the foreseeable time. Compatibility of light duty diesel vehicles with biodiesel blends
Table 1: assumed compatibility of light duty diesel vehicles to biodiesel blends
B10 B30 B100 pre-Euro 4 <2005 50% 20% 15% Euro 4 2005-2010 75% 25% 1% Euro 5 2010-2015 100% 40% 0% Euro 6 2015-2020 100% 50% 0% Euro 6+ >2020 100% 50% 0%
B10: most light duty diesel models are compatible with B10, however there may be some which have problems, especially older models. This is the main argument of manufacturers against the extension of the biodiesel tolerance in EN590 (diesel norm). We assume that all diesel models from Euro 5 will be compatible with B10. It may be possible that part of the biodiesel will be hydrotreated vegetable oils (HVO). This was recently suggested in Germany (target of 7% FAME + 3% HVO blending to diesel) [BMU, 2007]. B30: all current diesel models of the PSA group are compatible with B30 (warranty is only given for captive fleets). Peugeot and Citroën have a market share of around 20% in Belgium [FOD Mobility, 2007]. Of course all pre-Euro 4 B100 compatible models of the VW group (see further) are also compatible with B30. Renault (10% market share) is also starting to introduce diesel models compatible with B30, and from 2009 all of its diesel models will be B30 compatible. So from Euro 5 models, at least 30% (PSA + Renault market share) will be B30 compatible. Question is how fast and if other manufacturers will follow. As the technical problems to assure B30 compatibility are rather limited, we assume that some other manufacturers will follow (up to 50% market share), others will stay hesitant (some argue that blends above 7 or 10% are not compatible with their particulate filter system). B100: in the past (between 1996 and 2004) the VW group gave warranty for the use of B100 in most of its diesel models. Volkswagen, Audi, Skoda and Seat represent between 15 and 20% of car sales in Belgium [FOD Mobility, 2007]. In practise, none of these cars use B100 in Belgium. From Euro 4, practically no car manufacturer gives warranty for B100 use, and this is not expected to change in the future. The main argument is that biodiesel from vegetable oil has limited potential, and future ‘biodiesel’ will be based on BTL. Compatibility of heavy duty diesel vehicles with biodiesel blends
Table 2: assumed compatibility of heavy duty vehicles for biodiesel blends
B10 B30 B100 pre-Euro 4 <2005 50% 10% 5% Euro 4 2005-2010 75% 20% 10% Euro 5 2010-2015 100% 40% 20% Euro 6 2015-2020 100% 50% 25% Euro 6 + >2020 100% 50% 25%
SSD “Science for a Sustainable Development” - Energy 11
Project SD/EN/03A - Biofuels Sustainable End uSe “BIOSES”
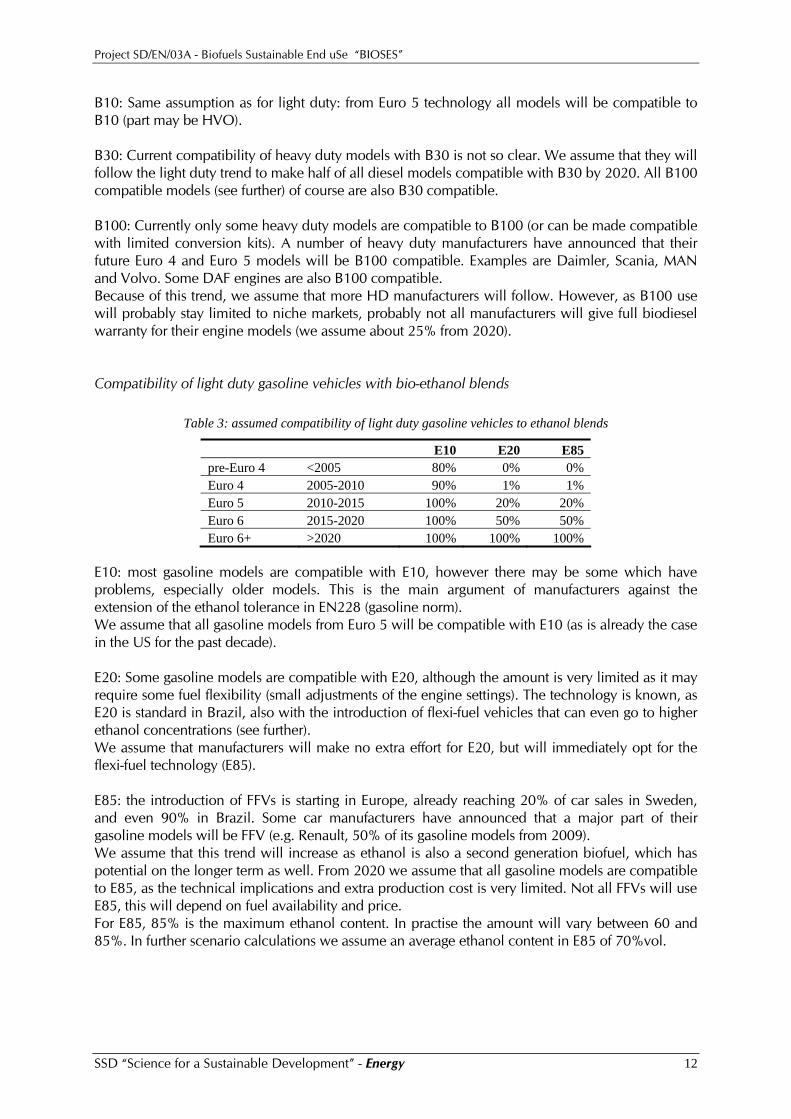
B10: Same assumption as for light duty: from Euro 5 technology all models will be compatible to B10 (part may be HVO). B30: Current compatibility of heavy duty models with B30 is not so clear. We assume that they will follow the light duty trend to make half of all diesel models compatible with B30 by 2020. All B100 compatible models (see further) of course are also B30 compatible. B100: Currently only some heavy duty models are compatible to B100 (or can be made compatible with limited conversion kits). A number of heavy duty manufacturers have announced that their future Euro 4 and Euro 5 models will be B100 compatible. Examples are Daimler, Scania, MAN and Volvo. Some DAF engines are also B100 compatible. Because of this trend, we assume that more HD manufacturers will follow. However, as B100 use will probably stay limited to niche markets, probably not all manufacturers will give full biodiesel warranty for their engine models (we assume about 25% from 2020). Compatibility of light duty gasoline vehicles with bio-ethanol blends
Table 3: assumed compatibility of light duty gasoline vehicles to ethanol blends
E10 E20 E85 pre-Euro 4 <2005 80% 0% 0% Euro 4 2005-2010 90% 1% 1% Euro 5 2010-2015 100% 20% 20% Euro 6 2015-2020 100% 50% 50% Euro 6+ >2020 100% 100% 100%
E10: most gasoline models are compatible with E10, however there may be some which have problems, especially older models. This is the main argument of manufacturers against the extension of the ethanol tolerance in EN228 (gasoline norm). We assume that all gasoline models from Euro 5 will be compatible with E10 (as is already the case in the US for the past decade). E20: Some gasoline models are compatible with E20, although the amount is very limited as it may require some fuel flexibility (small adjustments of the engine settings). The technology is known, as E20 is standard in Brazil, also with the introduction of flexi-fuel vehicles that can even go to higher ethanol concentrations (see further). We assume that manufacturers will make no extra effort for E20, but will immediately opt for the flexi-fuel technology (E85). E85: the introduction of FFVs is starting in Europe, already reaching 20% of car sales in Sweden, and even 90% in Brazil. Some car manufacturers have announced that a major part of their gasoline models will be FFV (e.g. Renault, 50% of its gasoline models from 2009). We assume that this trend will increase as ethanol is also a second generation biofuel, which has potential on the longer term as well. From 2020 we assume that all gasoline models are compatible to E85, as the technical implications and extra production cost is very limited. Not all FFVs will use E85, this will depend on fuel availability and price. For E85, 85% is the maximum ethanol content. In practise the amount will vary between 60 and 85%. In further scenario calculations we assume an average ethanol content in E85 of 70%vol.
SSD “Science for a Sustainable Development” - Energy 12

Project SD/EN/03A - Biofuels Sustainable End uSe “BIOSES”
2.2.2 End user groups When it comes to biofuels there is an important distinction between common vehicle technology (focus on general blending) and dedicated or converted vehicle technology (higher blends). When looking at the experience outside Belgium, only a few countries have chosen to offer high biofuel blends in public filling stations (e.g. B100 in Germany, E85 in Sweden). Most application of high blends is in captive fleets, using private filling facilities. So in terms of distribution of biofuels it is important to know if fleets depend on the public network of fuel stations, or if they merely depend on local private filling stations. Private filling stations – where usually owners refuel their own vehicles – are subjected to less stringent regulation and economic situation. Therefore, it may be important to mention for each end-user group which type of filling station is normally used. On the basis of statistics of the Belgian Petroleum Balance it is assumed that about 50 % of the diesel consumed in Belgium comes from private filling stations; for gasoline it is 25 %. Furthermore, it is important to make a distinction between diesel for road vehicles and (red) gas oil for off-road vehicles, as filling systems and fuels specifications could be different.
Figure 1: end-user groups vs typical type of fueling
Private Regional distribution (trucks, vans)
Special services (e.g. refuse collection) Public transport (buses) On-site company fleet
Public Private passenger cars
Moto’s Leasing cars
Public and/or private Company passenger cars
Fleets of authorities Taxi services
Long distance trucks Long distance bus (coaches)
Private – off-road Agricultural machinery
Off-road and construction vehicles
In-land shipping Diesel trains
Within this project we defined several end-user groups, as each of them may call for a less or more specific approach to come to a faster introduction of biofuels or the use of higher biofuel blends: - cars:
o company cars; o double use company cars (incl private use); o private cars;
- buses o public buses (De Lijn, MIVB/STIB, TEC & subcontractors); o private buses (coaches – mainly used for long-distance).
- light duty freight vehicles (vans); - heavy duty vehicles;
o small trucks (mainly used for regional distribution) o medium trucks (used for regional and long-distance distribution) o heavy trucks (mainly used for long-distance distribution)
- (motorcycles) - non-stationary agricultural machinery; - railway traffic (diesel trains); - inland navigation.
SSD “Science for a Sustainable Development” - Energy 13
Project SD/EN/03A - Biofuels Sustainable End uSe “BIOSES”
2.3 Scenarios There are various strategies to introduce biofuels in transport. The most obvious choice is to blend a limited percentage of biodiesel, HVO or BTL to all diesel fuel and a certain share of ethanol (or derived ETBE) to all gasoline fuel. Future, current, and even older vehicles need to be compatible to these biofuel blends. The general blending of biofuels should be dealt with on European level, in cooperation with the fuel and vehicle sectors. On the other hand there are number of advantages to introduce higher biofuel blends, and even pure biofuels. Some examples: - using high blends is much more visible. The application can be supported through clear
incentives on vehicle level (which is not possible for general blending). - only high blends / pure biofuels can really provide an alternative to become independent
from fossil fuels. - certain high blend biofuels provide very low exhaust gas emissions, so these can be
promoted for direct environmental reasons (air quality) in city traffic. First step to derive biofuel introduction scenarios is to determine the expected evolution of fuel consumption in traffic up to 2030, a so-called baseline scenario. The baseline scenario makes a distinction between different fuel and vehicle types. Very striking is the ever increasing trend towards dieselification. This creates an unbalance with the output of petroleum refineries, specifically if this trend also continues on European scale. The current European fuel market needs to import diesel fuel (mainly from Russia), while gasoline fuel is exported (mainly to the US). This creates a less favourable position for gasoline replacing fuels like ethanol, which would lead to even higher exports of gasoline. The baseline scenario, with a continuying growth in energy consumption, especially in heavy duty freight traffic, will eventually be problematic in terms of energy supply, so we also looked into an alternative baseline, which includes energy saving and a reversal shift from diesel to gasoline. In comparison to the baseline scenario HD freight is expected to stabilize after 2015 because of high energy prices (or other policy measures), while energy use of passenger cars is expected to decline (also through stimulation of energy saving in this sector). Some measures are also assumed to increase the attractiveness of gasoline vehicles (including hybrid) in relation to diesel vehicles to get a more balanced use of gasoline versus diesel (more in line with refinery output). The effect will be visible on longer term, with a slightly growing share of gasoline from 2015-2020. More detailed analysis on various energy scenarios in transport will be performed in the project LIMOBEL in 2009. BIOSES will share these scenarios at that time. Based on the technological evolution in vehicle models, the likely biofuel blends on the European markets, and the possible interest of certain end user groups (e.g. public transport, agriculture, …), 10 scenarios were described. One was the business-as-usual scenario, basing assumptions on actual policy. Further we have two scenarios with increased general blending of biodiesel to diesel, ethanol to gasoline and on the longer term BTL to diesel. On top we defined 6 specific high blend scenarios, with a specific focus on certain high biofuel blends: E85; B30; B100, PPO, E95; bio-methane and a combined scenario of B30, E85 and bio-methane. For a detailed explanation of the different scenarios, we refer to the report “Introduction of biofuels in Belgium - Scenarios for 2010 - 2020 – 2030” [Pelkmans et al, 2008].
SSD “Science for a Sustainable Development” - Energy 14
Project SD/EN/03A - Biofuels Sustainable End uSe “BIOSES”
Business as usual
General Blend 1 General Blend 2
Focus B30
Focus B100
Focus PPO
Focus E95 Focus bioCH4
Focus E85
Combined scenario B30 - E85 – biomethane
Business as usual
General Blend 1 General Blend 2
Focus B30
Focus B100
Focus PPO
Focus E95 Focus bioCH4
Focus E85
Combined scenario B30 - E85 – biomethane
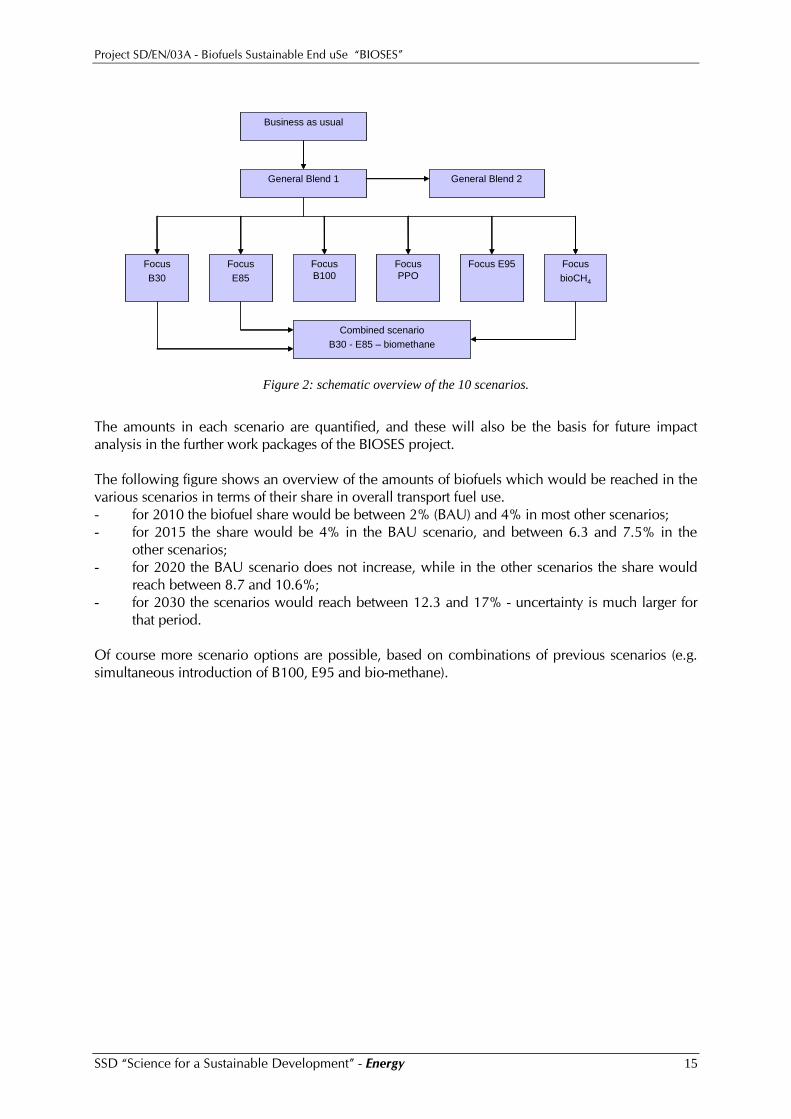
Figure 2: schematic overview of the 10 scenarios.
The amounts in each scenario are quantified, and these will also be the basis for future impact analysis in the further work packages of the BIOSES project. The following figure shows an overview of the amounts of biofuels which would be reached in the various scenarios in terms of their share in overall transport fuel use. - for 2010 the biofuel share would be between 2% (BAU) and 4% in most other scenarios; - for 2015 the share would be 4% in the BAU scenario, and between 6.3 and 7.5% in the
other scenarios; - for 2020 the BAU scenario does not increase, while in the other scenarios the share would
reach between 8.7 and 10.6%; - for 2030 the scenarios would reach between 12.3 and 17% - uncertainty is much larger for
that period. Of course more scenario options are possible, based on combinations of previous scenarios (e.g. simultaneous introduction of B100, E95 and bio-methane).
SSD “Science for a Sustainable Development” - Energy 15
Project SD/EN/03A - Biofuels Sustainable End uSe “BIOSES”
0%
2%
4%
6%
8%
10%
12%
14%
16%
18%
BAU
Gen. BL1
Gen. BL2
Focus B30
Focus E85
Focus B100
Focus PPO
Focus E95
Focus biogas
Comb. B30-E85-biogas
Bio
fuel
sha
re p
er s
cena
rio (%
)
2010
2015
2020
2025
2030
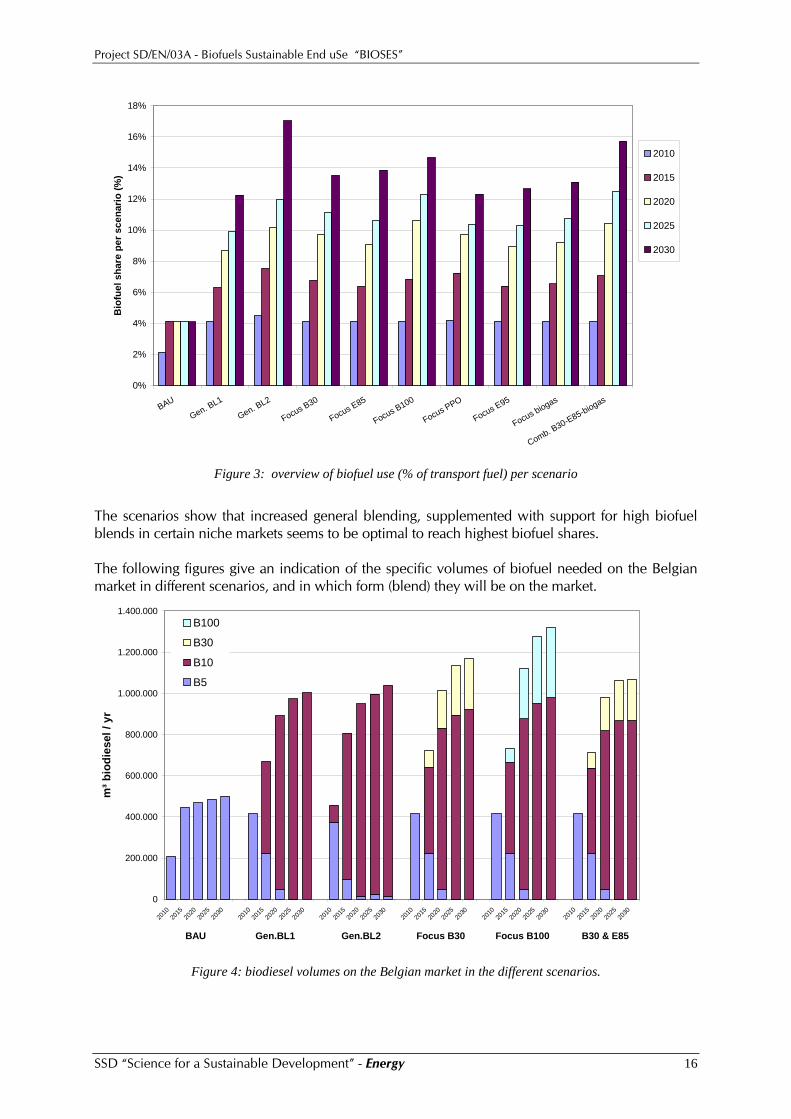
Figure 3: overview of biofuel use (% of transport fuel) per scenario
The scenarios show that increased general blending, supplemented with support for high biofuel blends in certain niche markets seems to be optimal to reach highest biofuel shares. The following figures give an indication of the specific volumes of biofuel needed on the Belgian market in different scenarios, and in which form (blend) they will be on the market.
0
200.000
400.000
600.000
800.000
1.000.000
1.200.000
1.400.000
2010
2015
2020
2025
2030
2010
2015
2020
2025
2030
2010
2015
2020
2025
2030
2010
2015
2020
2025
2030
2010
2015
2020
2025
2030
2010
2015
2020
2025
2030
m³ b
iodi
esel
/ yr
B100
B30
B10
B5
BAU Gen.BL1 Gen.BL2 Focus B30 Focus B100 B30 & E85
Figure 4: biodiesel volumes on the Belgian market in the different scenarios.
SSD “Science for a Sustainable Development” - Energy 16
Project SD/EN/03A - Biofuels Sustainable End uSe “BIOSES”
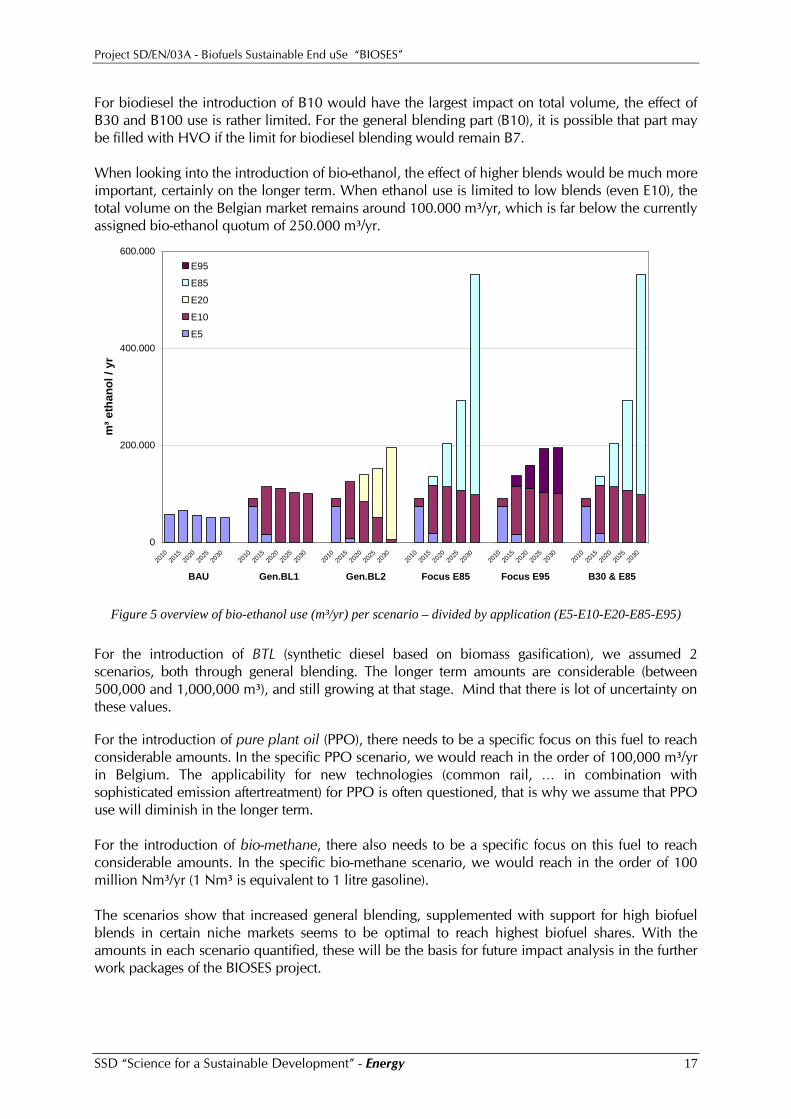
For biodiesel the introduction of B10 would have the largest impact on total volume, the effect of B30 and B100 use is rather limited. For the general blending part (B10), it is possible that part may be filled with HVO if the limit for biodiesel blending would remain B7. When looking into the introduction of bio-ethanol, the effect of higher blends would be much more important, certainly on the longer term. When ethanol use is limited to low blends (even E10), the total volume on the Belgian market remains around 100.000 m³/yr, which is far below the currently assigned bio-ethanol quotum of 250.000 m³/yr.
0
200.000
400.000
600.000
2010
2015
2020
2025
2030
2010
2015
2020
2025
2030
2010
2015
2020
2025
2030
2010
2015
2020
2025
2030
2010
2015
2020
2025
2030
2010
2015
2020
2025
2030
m³ e
than
ol /
yr
E95
E85
E20
E10
E5
BAU Gen.BL1 Gen.BL2 Focus E85 Focus E95 B30 & E85
Figure 5 overview of bio-ethanol use (m³/yr) per scenario – divided by application (E5-E10-E20-E85-E95)
For the introduction of BTL (synthetic diesel based on biomass gasification), we assumed 2 scenarios, both through general blending. The longer term amounts are considerable (between 500,000 and 1,000,000 m³), and still growing at that stage. Mind that there is lot of uncertainty on these values. For the introduction of pure plant oil (PPO), there needs to be a specific focus on this fuel to reach considerable amounts. In the specific PPO scenario, we would reach in the order of 100,000 m³/yr in Belgium. The applicability for new technologies (common rail, … in combination with sophisticated emission aftertreatment) for PPO is often questioned, that is why we assume that PPO use will diminish in the longer term. For the introduction of bio-methane, there also needs to be a specific focus on this fuel to reach considerable amounts. In the specific bio-methane scenario, we would reach in the order of 100 million Nm³/yr (1 Nm³ is equivalent to 1 litre gasoline). The scenarios show that increased general blending, supplemented with support for high biofuel blends in certain niche markets seems to be optimal to reach highest biofuel shares. With the amounts in each scenario quantified, these will be the basis for future impact analysis in the further work packages of the BIOSES project.
SSD “Science for a Sustainable Development” - Energy 17
Project SD/EN/03A - Biofuels Sustainable End uSe “BIOSES”
3 Well-to-wheel emissions and energy consumption When comparing the impact of different fuel options, we need to look into the combination of end use (TTW or tank-to-wheel), but also the production of the feedstock, the fuel conversion process and distribution (WTT or well-to-tank) need to be taken into account. In this part we will specifically analyse the impact on emissions and energy consumption, divided into WTT and TTW.
3.1 Emission-impact Well-to-Tank After the acquisition of the version 2 of the Ecoinvent database, a complete and detailed well-to-tank assessment of biofuels has been performed. A detailed overview of the most important biofuels as well as their production stages has been made on the basis of the information contained in the Ecoinvent report entitled “life cycle Inventories of Bioenergy” (Jungbluth et al., 2007) and the Ecoinvent website (www.ecoinvent.org). In general, three stages of production can be distinguished (feedstock production, conversion to a fuel and distribution). The transport phase between the feedstock production and the conversion is included in the conversion stage. According to the type of feedstock, the biofuels have been classified into two groups. The first group of biofuels (often called 1st generation biofuels) are produced from food crops such as rapeseed, sugar cane, sugar beet, corn, rye and wheat, while the second group (often called 2nd generation biofuels) are produced from cellulose crops or wood, the residual non-food parts of crops and different types of waste such as waste cooking oil, whey, manure,…. Typical biofuel production routes or pathways have been assessed. The most important ones are:
• Oil-based biofuels: feedstock production, solvent and cold-press oil extraction, esterification and distribution
• Biogas: feedstock, gasification or digestion, purification and distribution • Ethanol: feedstock, fermentation, distillation and distribution • Wood based Biofuels : BTL, methanol and methane from synthetic gas
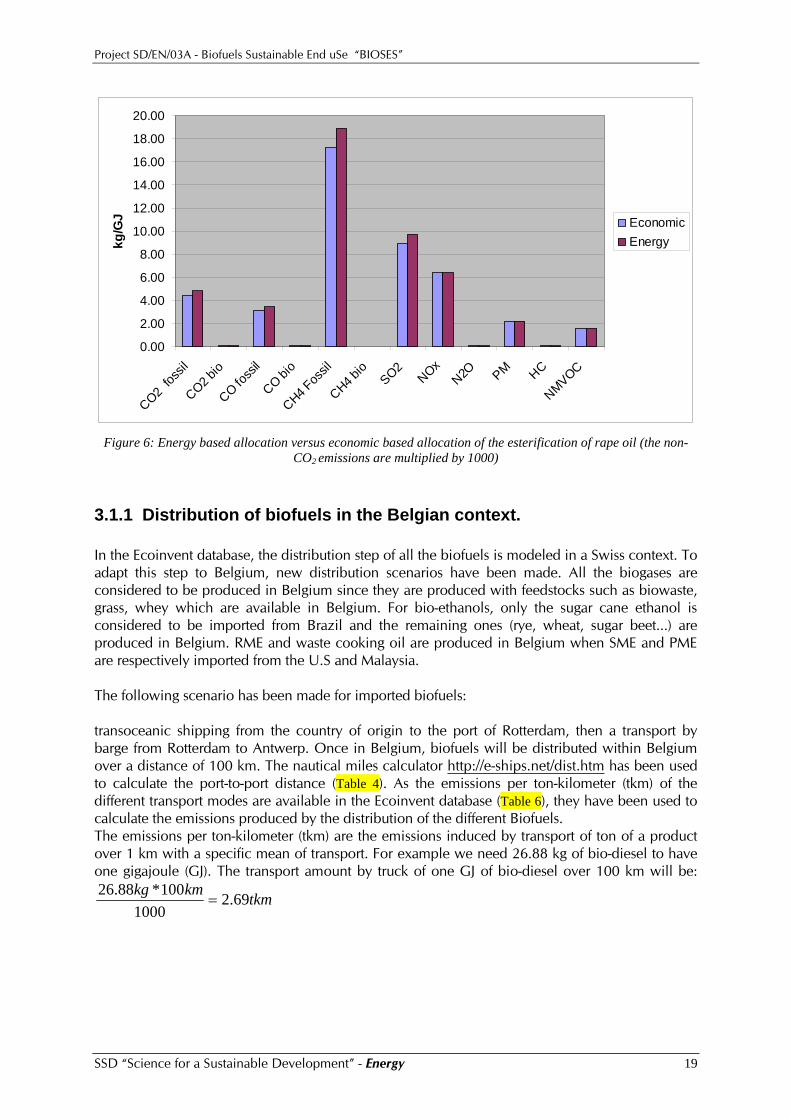
The assumptions such as the location, farming machines and treatment, transport distances and conversion technologies have been extracted from the Ecoinvent reports and used for new calculation and adaptation to the Belgian situation. A special attention has been paid to the allocation of emissions to the different co-products during the conversion phase. Indeed, the emissions in the Ecoinvent database were allocated to the co-products according to their unit price and their carbon content. We have re-allocated them according to the energy content of each co-product (see figure 6), as is also suggested in the proposed Renewable Energy Directive.
SSD “Science for a Sustainable Development” - Energy 18
Project SD/EN/03A - Biofuels Sustainable End uSe “BIOSES”
0.00
2.00
4.00
6.00
8.00
10.00
12.00
14.00
16.00
18.00
20.00
CO2 fos
sil
CO2 bio
CO foss
il
CO bio
CH4 Fos
sil
CH4 bio
SO2NOx
N2O PM HC
NMVOC
kg/G
J EconomicEnergy
Figure 6: Energy based allocation versus economic based allocation of the esterification of rape oil (the non-
CO2 emissions are multiplied by 1000)
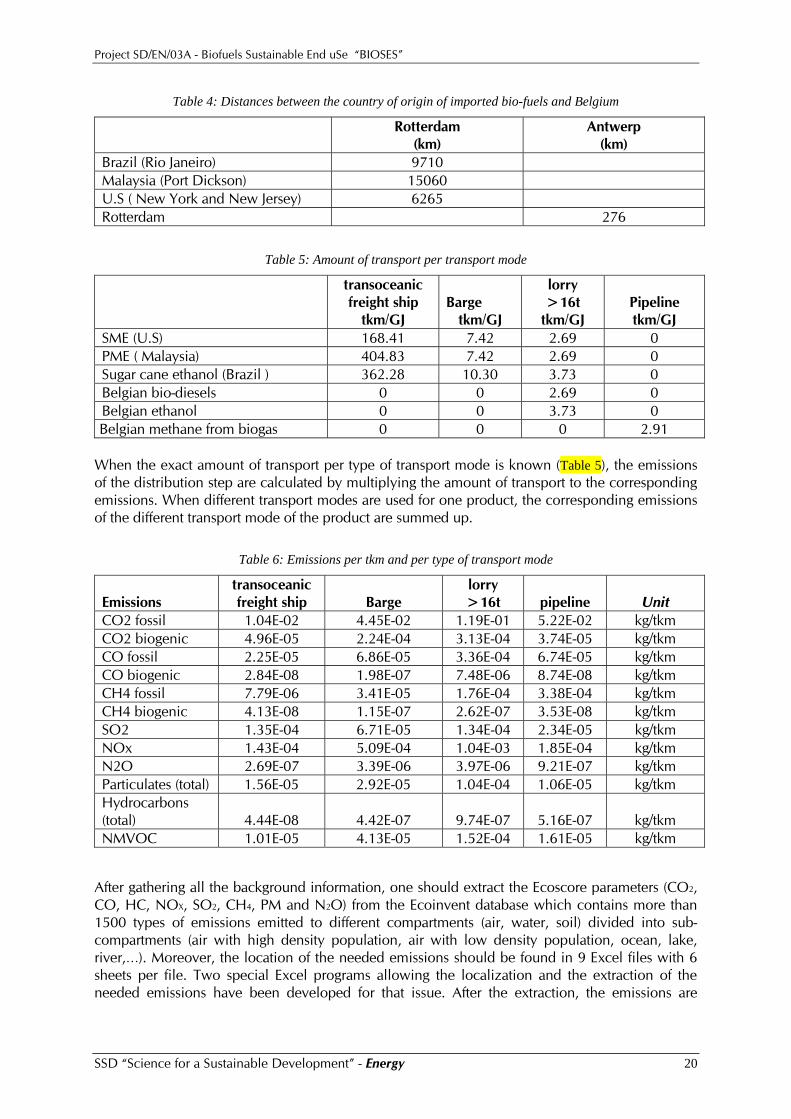
3.1.1 Distribution of biofuels in the Belgian context. In the Ecoinvent database, the distribution step of all the biofuels is modeled in a Swiss context. To adapt this step to Belgium, new distribution scenarios have been made. All the biogases are considered to be produced in Belgium since they are produced with feedstocks such as biowaste, grass, whey which are available in Belgium. For bio-ethanols, only the sugar cane ethanol is considered to be imported from Brazil and the remaining ones (rye, wheat, sugar beet...) are produced in Belgium. RME and waste cooking oil are produced in Belgium when SME and PME are respectively imported from the U.S and Malaysia. The following scenario has been made for imported biofuels: transoceanic shipping from the country of origin to the port of Rotterdam, then a transport by barge from Rotterdam to Antwerp. Once in Belgium, biofuels will be distributed within Belgium over a distance of 100 km. The nautical miles calculator http://e-ships.net/dist.htm has been used to calculate the port-to-port distance (Table 4). As the emissions per ton-kilometer (tkm) of the different transport modes are available in the Ecoinvent database (Table 6), they have been used to calculate the emissions produced by the distribution of the different Biofuels. The emissions per ton-kilometer (tkm) are the emissions induced by transport of ton of a product over 1 km with a specific mean of transport. For example we need 26.88 kg of bio-diesel to have one gigajoule (GJ). The transport amount by truck of one GJ of bio-diesel over 100 km will be:
tkmkmkg 69.21000
100*88.26=
SSD “Science for a Sustainable Development” - Energy 19
Project SD/EN/03A - Biofuels Sustainable End uSe “BIOSES”
Table 4: Distances between the country of origin of imported bio-fuels and Belgium
Rotterdam (km)
Antwerp (km)
Brazil (Rio Janeiro) 9710 Malaysia (Port Dickson) 15060 U.S ( New York and New Jersey) 6265 Rotterdam 276
Table 5: Amount of transport per transport mode
transoceanic freight ship
tkm/GJ Barge
tkm/GJ
lorry >16t
tkm/GJ Pipeline tkm/GJ
SME (U.S) 168.41 7.42 2.69 0 PME ( Malaysia) 404.83 7.42 2.69 0 Sugar cane ethanol (Brazil ) 362.28 10.30 3.73 0 Belgian bio-diesels 0 0 2.69 0 Belgian ethanol 0 0 3.73 0 Belgian methane from biogas 0 0 0 2.91
When the exact amount of transport per type of transport mode is known (Table 5), the emissions of the distribution step are calculated by multiplying the amount of transport to the corresponding emissions. When different transport modes are used for one product, the corresponding emissions of the different transport mode of the product are summed up.
Table 6: Emissions per tkm and per type of transport mode
transoceanic freight ship Barge
lorry >16t pipeline Unit Emissions
CO2 fossil 1.04E-02 4.45E-02 1.19E-01 5.22E-02 kg/tkm CO2 biogenic 4.96E-05 2.24E-04 3.13E-04 3.74E-05 kg/tkm CO fossil 2.25E-05 6.86E-05 3.36E-04 6.74E-05 kg/tkm CO biogenic 2.84E-08 1.98E-07 7.48E-06 8.74E-08 kg/tkm CH4 fossil 7.79E-06 3.41E-05 1.76E-04 3.38E-04 kg/tkm CH4 biogenic 4.13E-08 1.15E-07 2.62E-07 3.53E-08 kg/tkm SO2 1.35E-04 6.71E-05 1.34E-04 2.34E-05 kg/tkm NOx 1.43E-04 5.09E-04 1.04E-03 1.85E-04 kg/tkm N2O 2.69E-07 3.39E-06 3.97E-06 9.21E-07 kg/tkm Particulates (total) 1.56E-05 2.92E-05 1.04E-04 1.06E-05 kg/tkm Hydrocarbons (total) 4.44E-08 4.42E-07 9.74E-07 5.16E-07 kg/tkm NMVOC 1.01E-05 4.13E-05 1.52E-04 1.61E-05 kg/tkm
After gathering all the background information, one should extract the Ecoscore parameters (CO2, CO, HC, NOX, SO2, CH4, PM and N2O) from the Ecoinvent database which contains more than 1500 types of emissions emitted to different compartments (air, water, soil) divided into sub-compartments (air with high density population, air with low density population, ocean, lake, river,…). Moreover, the location of the needed emissions should be found in 9 Excel files with 6 sheets per file. Two special Excel programs allowing the localization and the extraction of the needed emissions have been developed for that issue. After the extraction, the emissions are
SSD “Science for a Sustainable Development” - Energy 20
Project SD/EN/03A - Biofuels Sustainable End uSe “BIOSES”
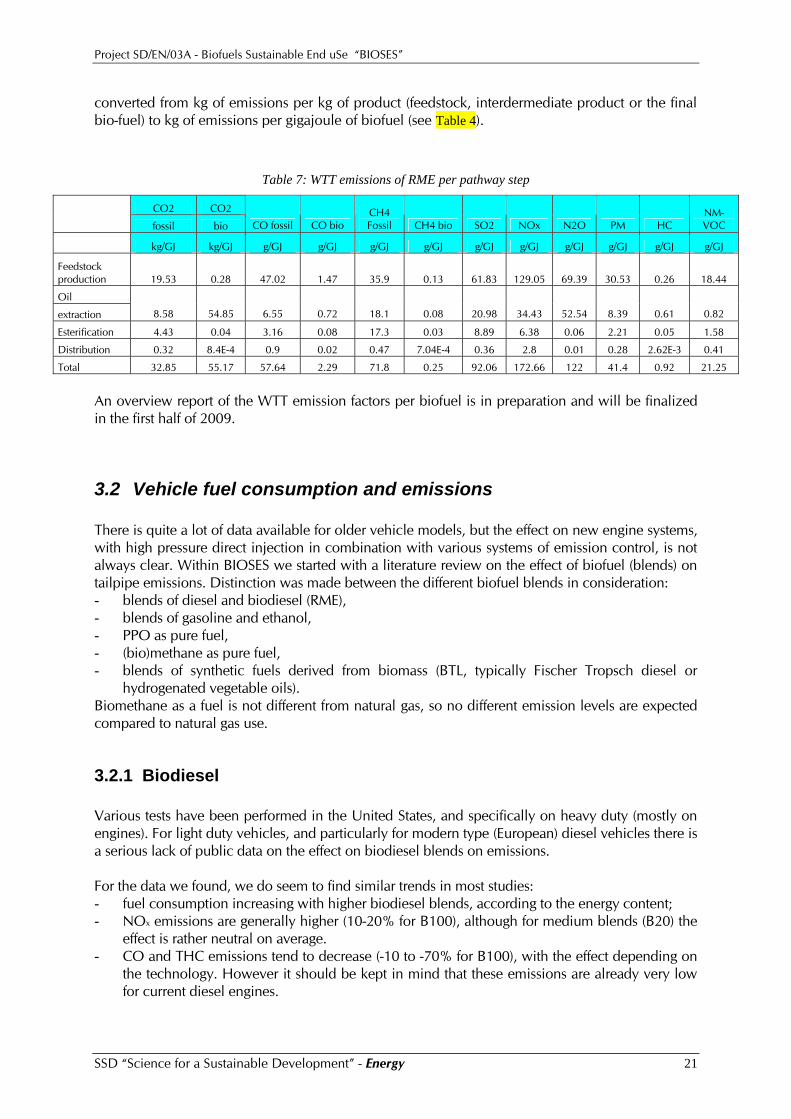
converted from kg of emissions per kg of product (feedstock, interdermediate product or the final bio-fuel) to kg of emissions per gigajoule of biofuel (see Table 4).
Table 7: WTT emissions of RME per pathway step
CO2 CO2
fossil bio CO fossil CO bio CH4 Fossil CH4 bio SO2 NOx N2O PM HC
NM-VOC
kg/GJ kg/GJ g/GJ g/GJ g/GJ g/GJ g/GJ g/GJ g/GJ g/GJ g/GJ g/GJ
Feedstock production 19.53 0.28 47.02 1.47 35.9 0.13 61.83 129.05 69.39 30.53 0.26 18.44
Oil
8.58 54.85 6.55 0.72 18.1 0.08 20.98 34.43 52.54 8.39 0.61 0.82 extraction
Esterification 4.43 0.04 3.16 0.08 17.3 0.03 8.89 6.38 0.06 2.21 0.05 1.58
Distribution 0.32 8.4E-4 0.9 0.02 0.47 7.04E-4 0.36 2.8 0.01 0.28 2.62E-3 0.41
Total 32.85 55.17 57.64 2.29 71.8 0.25 92.06 172.66 122 41.4 0.92 21.25
An overview report of the WTT emission factors per biofuel is in preparation and will be finalized in the first half of 2009.
3.2 Vehicle fuel consumption and emissions There is quite a lot of data available for older vehicle models, but the effect on new engine systems, with high pressure direct injection in combination with various systems of emission control, is not always clear. Within BIOSES we started with a literature review on the effect of biofuel (blends) on tailpipe emissions. Distinction was made between the different biofuel blends in consideration: - blends of diesel and biodiesel (RME), - blends of gasoline and ethanol, - PPO as pure fuel, - (bio)methane as pure fuel, - blends of synthetic fuels derived from biomass (BTL, typically Fischer Tropsch diesel or
hydrogenated vegetable oils). Biomethane as a fuel is not different from natural gas, so no different emission levels are expected compared to natural gas use.
3.2.1 Biodiesel Various tests have been performed in the United States, and specifically on heavy duty (mostly on engines). For light duty vehicles, and particularly for modern type (European) diesel vehicles there is a serious lack of public data on the effect on biodiesel blends on emissions. For the data we found, we do seem to find similar trends in most studies: - fuel consumption increasing with higher biodiesel blends, according to the energy content; - NOx emissions are generally higher (10-20% for B100), although for medium blends (B20) the
effect is rather neutral on average. - CO and THC emissions tend to decrease (-10 to -70% for B100), with the effect depending on
the technology. However it should be kept in mind that these emissions are already very low for current diesel engines.
SSD “Science for a Sustainable Development” - Energy 21

Project SD/EN/03A - Biofuels Sustainable End uSe “BIOSES”
- PM emissions seem to go down in all cases (-20% to -50% for B100). Also for medium blends the effect is often very positive. Even in the presence of an oxidation catalyst or PM filter the effect of biodiesel blending seems to be positive.
3.2.2 Bio-ethanol Various tests have been performed on flexifuel vehicles (FFVs), and some have been made public. In literature we found test results of 4 FFVs and a few normal gasoline cars on ethanol blends. The results are taken together to see general trends. Volumetric fuel consumption goes up with increasing ethanol content. On average E85 operation will have 30-35% higher fuel consumption compared to E5. The low blends E5 and E10 mostly have comparable fuel consumption as regular gasoline.
Relative volumetric fuel consumption
0,80
0,90
1,00
1,10
1,20
1,30
1,40
1,50
0 10 20 30 40 50 60 70 80 9
ethanol content (%)
fuel
con
s co
mpa
red
to E
5
0
Figure 7: fuel consumption measurements on different ethanol blends compared to gaoline operation (data
derived from [Westerholm, 2008], [van Rooijen, 2008], [de Serves, 2005] and [Shockey, 2007])
Ethanol has lower energy content per litre, so if these results are transformed into energy consumption per km, we see a reduction up to 5% compared to gasoline operation. For emissions there is a lot of spreading in the results, but in general the emissions are in the same range for gasoline and most ethanol blends, which is quite low as these vehicles need to comply with Euro 4. Only CO emissions are somewhat higher in some cases, but the norms are less stringent for CO. There is a tendency of higher evaporative emissions for low ethanol blends (E5-E10) because of their higher vapour pressure. This may give an increase of around 30% in evaporative HC emissions. Most hydrocarbon emissions go down, but there may be increases in formaldehyde, acetaldehyde and PAH emissions. This is mostly controlled when the engine is warm, but in cold condition there can be a substantial increase of these emissions.
SSD “Science for a Sustainable Development” - Energy 22

Project SD/EN/03A - Biofuels Sustainable End uSe “BIOSES”
3.2.3 Pure plant oil Pure plant oil (PPO), also referred as PVO (Pure Vegetable Oil) or SVO (Straight Vegetable Oil), can be used in diesel engines. However, opposed to biodiesel, the engine should be modified more thoroughly. The main problem is that vegetable oil is much more viscous than conventional diesel fuel. It must be pre-heated so that it can be properly atomised by the fuel injectors. If it is not properly atomised, it will not burn properly, forming deposits on the injectors and in the cylinder head, leading to poor performance, higher emissions, and reduced engine life. In Europe mostly rapeseed oil is used as PPO. There are limited data available for the emissions of PPO converted vehicles compared to their operation on regular diesel fuel. In most cases the effects on CO, HC and PM is rather positive (comparable to the effect of biodiesel), but there are also cases where problematic increases are detected. NOx emissions tend to increase up to 20 – 30%. The condition of the vehicle, the quality of the conversion system, and the fuel quality play an important role.
3.2.4 Synthetic diesel fuels from biomass By synthetic fuel the products are indicated which are made by Fischer-Tropsch (FT) from “syngas”, the mixture of carbon monoxide (CO) and hydrogen (H2) obtained by partial oxidation of hydrocarbons or wood or by steam reforming of natural gas. The products of this process scheme are long-chain paraffins, free of sulphur. Fischer-Tropsch diesel is similar to mineral-oil diesel with regard to its energy content, density, viscosity and flash point. It is also in liquid phase at ambient conditions. The fuel has even some characteristics that are more favourable than those of regular diesel. First of all, Fischer-Tropsch diesel has higher cetane number, which indicates better auto-ignition qualities. Moreover, it has a very low aromatic content, which leads to cleaner combustion. In the same category we qualify the product HVO (hydrogenated vegetable oils). Neste Oil has developed a diesel component NExBTL utilizing a proprietary conversion process for vegetable oils and animal fats. This non-oxygenated hydrocarbon biodiesel has similar chemistry and properties to the present synthetic (Fischer Tropsch) GTL and BTL diesel fuels. The fuel is free of sulphur, oxygen, nitrogen and aromatics and has a very high cetane number [Rantanen, 2005]. Not so many figures are available for the effect of synthetic diesel fuels on emissions of diesel engines. The general trend is that combustion is more homogenous and complete, leading to lower CO, HC and PM emissions, while at the same time NOx emissions are also slightly reduced.
3.2.5 Vehicle tests As public data on the effect of biofuel blends is quite scarse, within BIOSES we also selected specific vehicles for emissions and fuel consumption tests. The test programme is as follows: Diesel - Biodiesel blends (B5-10-30-100) - Citroën C4 1.6HDI May 2008 - VW Crafter 2.5TDI February 2008 - Scania P230 September 2008 - VanHool A360 (MAN engine)* May 2007
SSD “Science for a Sustainable Development” - Energy 23
Project SD/EN/03A - Biofuels Sustainable End uSe “BIOSES”
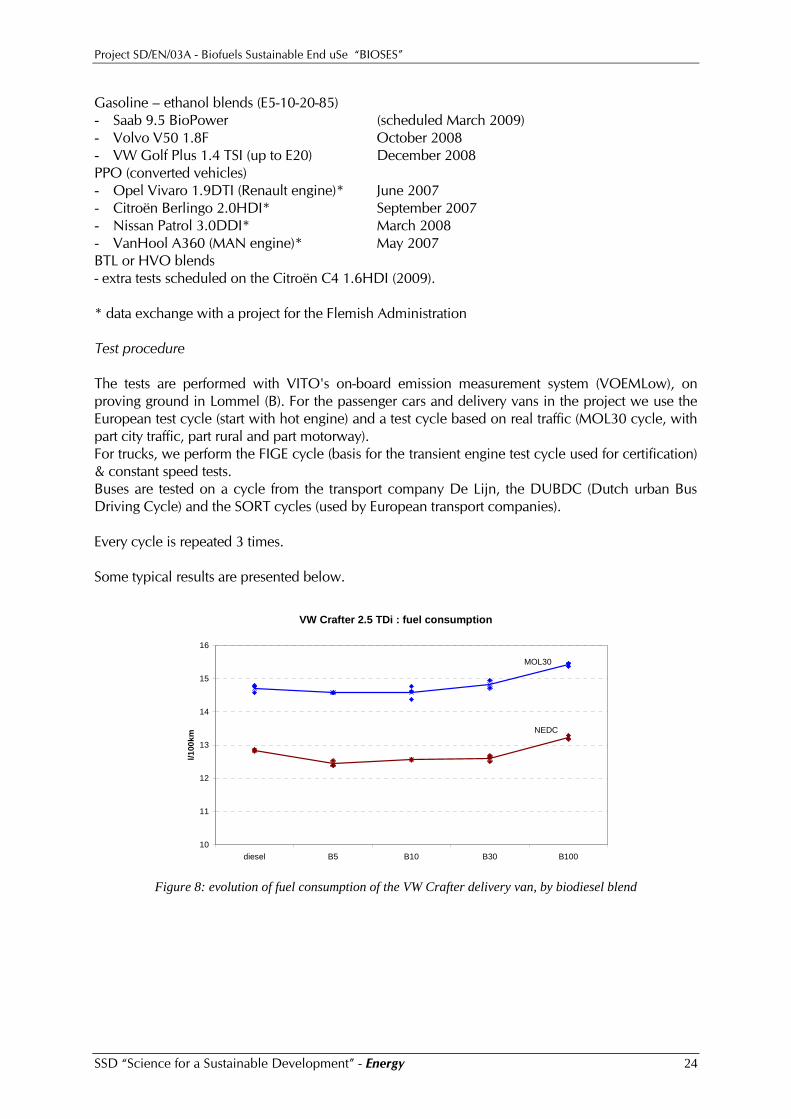
Gasoline – ethanol blends (E5-10-20-85) - Saab 9.5 BioPower (scheduled March 2009) - Volvo V50 1.8F October 2008 - VW Golf Plus 1.4 TSI (up to E20) December 2008 PPO (converted vehicles) - Opel Vivaro 1.9DTI (Renault engine)* June 2007 - Citroën Berlingo 2.0HDI* September 2007 - Nissan Patrol 3.0DDI* March 2008 - VanHool A360 (MAN engine)* May 2007 BTL or HVO blends - extra tests scheduled on the Citroën C4 1.6HDI (2009). * data exchange with a project for the Flemish Administration Test procedure The tests are performed with VITO's on-board emission measurement system (VOEMLow), on proving ground in Lommel (B). For the passenger cars and delivery vans in the project we use the European test cycle (start with hot engine) and a test cycle based on real traffic (MOL30 cycle, with part city traffic, part rural and part motorway). For trucks, we perform the FIGE cycle (basis for the transient engine test cycle used for certification) & constant speed tests. Buses are tested on a cycle from the transport company De Lijn, the DUBDC (Dutch urban Bus Driving Cycle) and the SORT cycles (used by European transport companies). Every cycle is repeated 3 times. Some typical results are presented below.
VW Crafter 2.5 TDi : fuel consumption
10
11
12
13
14
15
16
diesel B5 B10 B30 B100
l/100
km
MOL30
NEDC
Figure 8: evolution of fuel consumption of the VW Crafter delivery van, by biodiesel blend
SSD “Science for a Sustainable Development” - Energy 24

Project SD/EN/03A - Biofuels Sustainable End uSe “BIOSES”
Scania P230: PM emissions
0%
20%
40%
60%
80%
100%
120%
diesel B5 B10 B30 B100
% c
ompa
red
to d
iese
lFIGE
Figure 9: evolution of particulate mass emissions of the Scania P230 truck by biodiesel blend
Citroën C4: NOx emissions
0,00
0,50
1,00
1,50
2,00
diesel B5 B10 B30 B100
g/km
MOL30
NEDC
Figure 10: evolution of NOx emissions of the Citroën C4 diesel car by biodiesel blend
Volvo V50 1.8f : fuel consumption
6
7
8
9
10
11
12
13
14
Euro95 E5 E10 E20 E85
l/100
km
MOL30
NEDC
Figure 11: evolution of fuel consumption of the Volvo V50 flexifuel by bio-ethanol blend
The report of the vehicle tests will be produced in 2009.
SSD “Science for a Sustainable Development” - Energy 25
Project SD/EN/03A - Biofuels Sustainable End uSe “BIOSES”
4 Socio-economic feasibility
4.1 Barriers for biofuel introduction Barriers specific to biofuels in Belgium are related to several general aspects such as economical, technical, distribution, implementation, ethical, knowledge, political, legal, environmental aspects,…
4.1.1 Legal aspect and development of biofuels market in Belgium The European Directive 2003/30/EC1 has set reference targets for the market share of biofuels: 2% (based on energy content) at the end of 2005 and 5,75% at the end of 2010. Therefore, Belgium has set a national target to reach 5,75% (in energy) biofuels in 2010. A Belgian legal frame is implemented in order to favour yearly quotas of 380.000 m3 of biodiesel and 250.000 m3 of bioethanol with tax reductions maintaining the budgetary neutrality for the Government. Belgian quotas will represent theoretically at maximum 4,3% (in energy) of foreseen consumption of fuels in Belgium for 2010. In practice, the implementation of biofuels on the Belgian market will be lower (probably almost the half) in the current conditions. In other terms, the present legislation and the quota system are not sufficient to reach the 5,75% target. Without additional measures, it is impossible for Belgium to reach this objective.
4.1.2 Barriers Economical aspect The volatility in the price of feedstock and the uncertainty surrounding feedstock availability constitute the main economical barriers involving high production costs for biofuels. Higher purchasing and converting costs of biofuel compatible vehicles, commercial risks linked to the immaturity of the market and not accounted beneficial externalities, high costs to construct a refuelling infrastructure or convert existing infrastructure are the most important economical barriers involving an impact on the competitiveness of biofuels compared to fossil fuels. If the Belgian quota system implemented for biofuel plants disappears after 2013, biofuel producers will have to compete with imports from the international market with lower prices (e.g. from Brazil, Argentina and from the US). Technical aspect The limited compatibility of the conventional vehicles with biofuels (high blends scenario), the shortage of experience on technical aspects with biofuels, the immaturity of some conversion technologies and the lack of warranty given by vehicle manufacturers to ensure the compatibility of their vehicles are important technical barriers. Distribution aspect 1 Directive 2003/30/EC of the European Parliament and of the council of 8 May 2003on the promotion of the use of biofuels or other renewable fuels for transport.
SSD “Science for a Sustainable Development” - Energy 26
Project SD/EN/03A - Biofuels Sustainable End uSe “BIOSES”
Currently, the market and the end users can be directly or indirectly affected by the unavailability of biofuels, especially high blends at filling stations. Until now, the infrastructure related to the transport sector, particularly for filling stations, is only dedicated to diesel and to petrol and LPG. Standards aspects
The standards authorized under the current conditions (EN590 for diesel which allows a maximum biodiesel content up to 5% by volume and EN228 for gasoline which limits the maximum amount of bioethanol in gasoline up to 5% by volume and up to 15% by volume for ETBE) are not sufficient to achieve the 5,75% (in energy) target of biofuels in 2010 through general blending in existing fossil fuels. Implementation aspect Biofuels are facing a chicken and egg dilemma for E85. Indeed, owners of filling stations argue with automotive industry to know who will begin first: either fuel distributors develop the adequate infrastructure first, or vehicle manufacturers sell compatible cars first. This dilemma includes a lack of confidence among manufacturers and vehicle and fuel suppliers concerning the viability of such market. Ethical aspect The public opinion towards biofuels is rather negative because of their implication in a variety of international sensitive issues, including: suspicion about real carbon emissions savings level, competition with food production (e.g. "food or fuel" debate), deforestation and soil erosion, impact on water resources and negative social impacts in developing countries. Political aspect The lack of political stand of decision makers creates a huge barrier, especially in taking measures to develop the Belgian market of biofuels and in reaching objectives. Until now, the quota system implemented in Belgium involves some administrative follow-up which can constitute barriers to the introduction of biofuels on the Belgian market. The fixation of quota amounts with tax reductions is depending of political willingness. No incentive to go beyond the quota exists for the market. There are little private initiatives (investments, capacity building) because of the control of the government of the market. The main concerns for the politicians remain administrative and tax burdens. The lack of an alternative fuels strategy on national, regional or local level is a barrier. The short term view and the absence of a proactive approach to decrease our dependence on oil is problematic.
Knowledge and psychological aspect In the past months, there has been large media attention and public debate about the potential risks of (large scale) biofuel production. Opinions vary greatly and the debate is often based not only on facts, but also on emotions. The media impact consists of a huge barrier to the introduction of biofuels in the Belgian market. The lack of knowledge on biofuels for politicians, decision makers and the general public, particularly for higher blends or pure biofuels is an undeniable barrier. The shortage of readily available (independent) information and the absence of customer awareness,
SSD “Science for a Sustainable Development” - Energy 27
Project SD/EN/03A - Biofuels Sustainable End uSe “BIOSES”
market acceptance and the consumer passivity are inevitable barriers. Also, the change of habits and the fear of the unknown may constitute a huge psychological barrier for the end users when having to choose a fuel at the pump. Conflict of interest aspect Different lobby groups and institutions with different interests (oil companies, agrofood industry, environmental groups, automobile industry …) have feeded this discussion to influence the public opinion, mostly based on uncertainties, risks and missed opportunities. They influence politicians sometimes against biofuels and can constitute an important barrier. Such lobbying may contribute to a lack of political stand concerning the issue of biofuels. Also, the competition between first and second generation biofuels promoters may be a barrier to their development (do not develop biofuels now because new environmentally sound generation will come soon !).
Environmental aspect The increased demand for biofuel feedstock demand can, directly or indirectly, lead to some pressure on the available arable land involving the conversion of forests and other natural ecosystems into plantations or cropland. These changes in land-use often cause so much carbon release from vegetation and soil that the savings from the use of biofuels are negated. Moreover, a degradation of soils and water bodies may be due to the biomass production. Also, land-use change can involve the loss of important habitats for plants and animals and the endangerment of rare species. Therefore, the lack and uncertainty about sustainability requirements for biofuels may be a barrier. Complex aspect of biofuels The complexity of biofuels is an important aspect to take into account. Indeed, biofuels refer to environment, energy, agricultural, political, legal and fiscal aspects at the same time. It is very complicated to deal with these main sectors in order to satisfy all stakeholders on the implementation of biofuels.
4.2 Cost aspects
4.2.1 Micro-economic cost overview Concerning the cost aspects, a micro-economic cost overview to the implementation of biofuels in Belgium for the end consumers is carried out focusing on: 1. the cost for end users during the purchase of a vehicle compatible with high biofuel blends
compared to its gasoline or diesel equivalent 2. the cost generated by the adaptation of a conventional vehicle 3. the cost for the end users by using biofuels at different percentages blended with fossil fuels
(1) In order to obtain data on the biofuel compatible vehicle cost, several motorists have been contacted by phone or by e-mail to get a clear view on the cost increase for the end users. For the light duty, the motorists were: Volvo, PSA-group, Ford, Renault, Cadillac and Saab. For vehicle
SSD “Science for a Sustainable Development” - Energy 28
Project SD/EN/03A - Biofuels Sustainable End uSe “BIOSES”
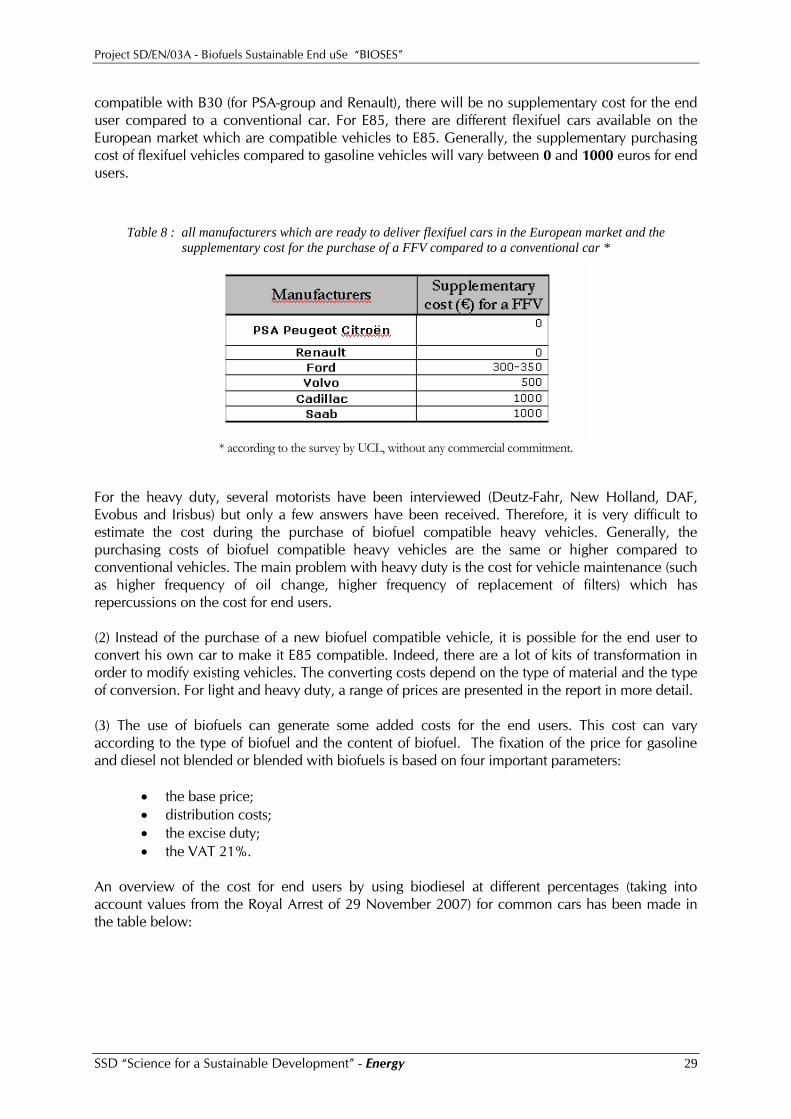
compatible with B30 (for PSA-group and Renault), there will be no supplementary cost for the end user compared to a conventional car. For E85, there are different flexifuel cars available on the European market which are compatible vehicles to E85. Generally, the supplementary purchasing cost of flexifuel vehicles compared to gasoline vehicles will vary between 0 and 1000 euros for end users.
Table 8 : all manufacturers which are ready to deliver flexifuel cars in the European market and the supplementary cost for the purchase of a FFV compared to a conventional car *
* according to the survey by UCL, without any commercial commitment.
For the heavy duty, several motorists have been interviewed (Deutz-Fahr, New Holland, DAF, Evobus and Irisbus) but only a few answers have been received. Therefore, it is very difficult to estimate the cost during the purchase of biofuel compatible heavy vehicles. Generally, the purchasing costs of biofuel compatible heavy vehicles are the same or higher compared to conventional vehicles. The main problem with heavy duty is the cost for vehicle maintenance (such as higher frequency of oil change, higher frequency of replacement of filters) which has repercussions on the cost for end users. (2) Instead of the purchase of a new biofuel compatible vehicle, it is possible for the end user to convert his own car to make it E85 compatible. Indeed, there are a lot of kits of transformation in order to modify existing vehicles. The converting costs depend on the type of material and the type of conversion. For light and heavy duty, a range of prices are presented in the report in more detail. (3) The use of biofuels can generate some added costs for the end users. This cost can vary according to the type of biofuel and the content of biofuel. The fixation of the price for gasoline and diesel not blended or blended with biofuels is based on four important parameters:
• the base price; • distribution costs; • the excise duty; • the VAT 21%.
An overview of the cost for end users by using biodiesel at different percentages (taking into account values from the Royal Arrest of 29 November 2007) for common cars has been made in the table below:
SSD “Science for a Sustainable Development” - Energy 29
Project SD/EN/03A - Biofuels Sustainable End uSe “BIOSES”
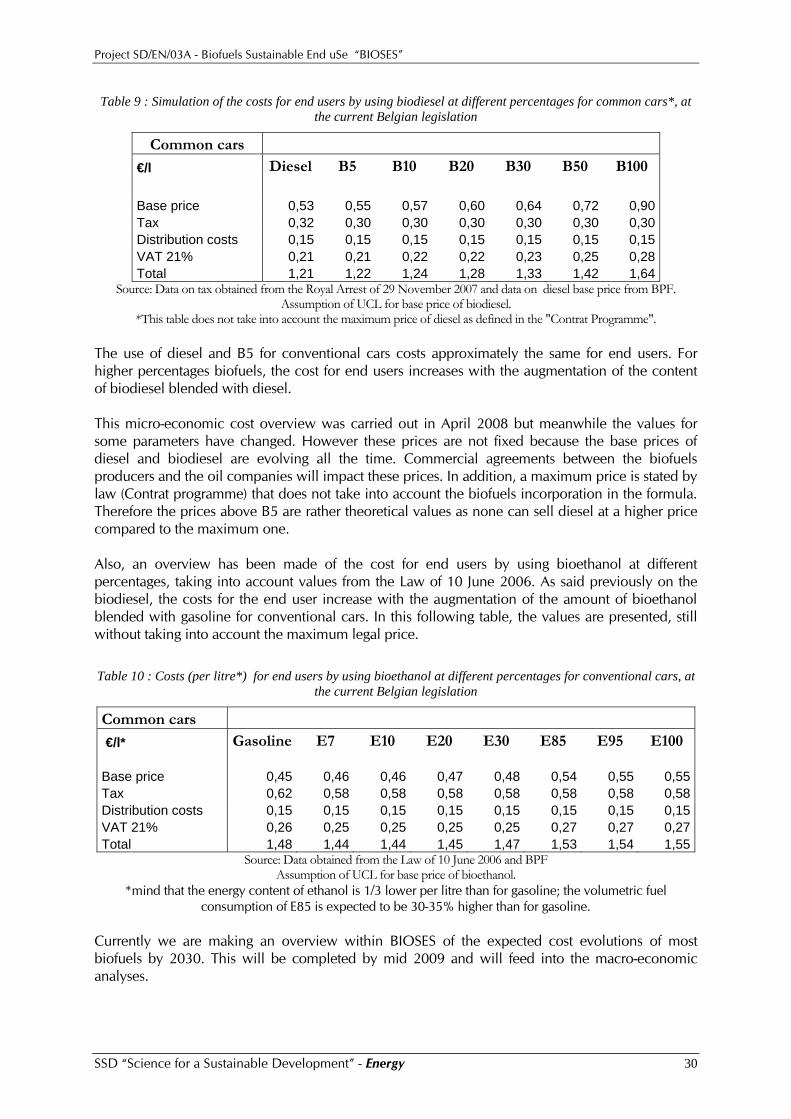
Table 9 : Simulation of the costs for end users by using biodiesel at different percentages for common cars*, at the current Belgian legislation
Common cars Diesel B5 B10 B20 B30 B50 B100 €/l
Base price 0,53 0,55 0,57 0,60 0,64 0,72 0,90Tax 0,32 0,30 0,30 0,30 0,30 0,30 0,30Distribution costs 0,15 0,15 0,15 0,15 0,15 0,15 0,15VAT 21% 0,21 0,21 0,22 0,22 0,23 0,25 0,28Total 1,21 1,22 1,24 1,28 1,33 1,42 1,64
Source: Data on tax obtained from the Royal Arrest of 29 November 2007 and data on diesel base price from BPF. Assumption of UCL for base price of biodiesel.
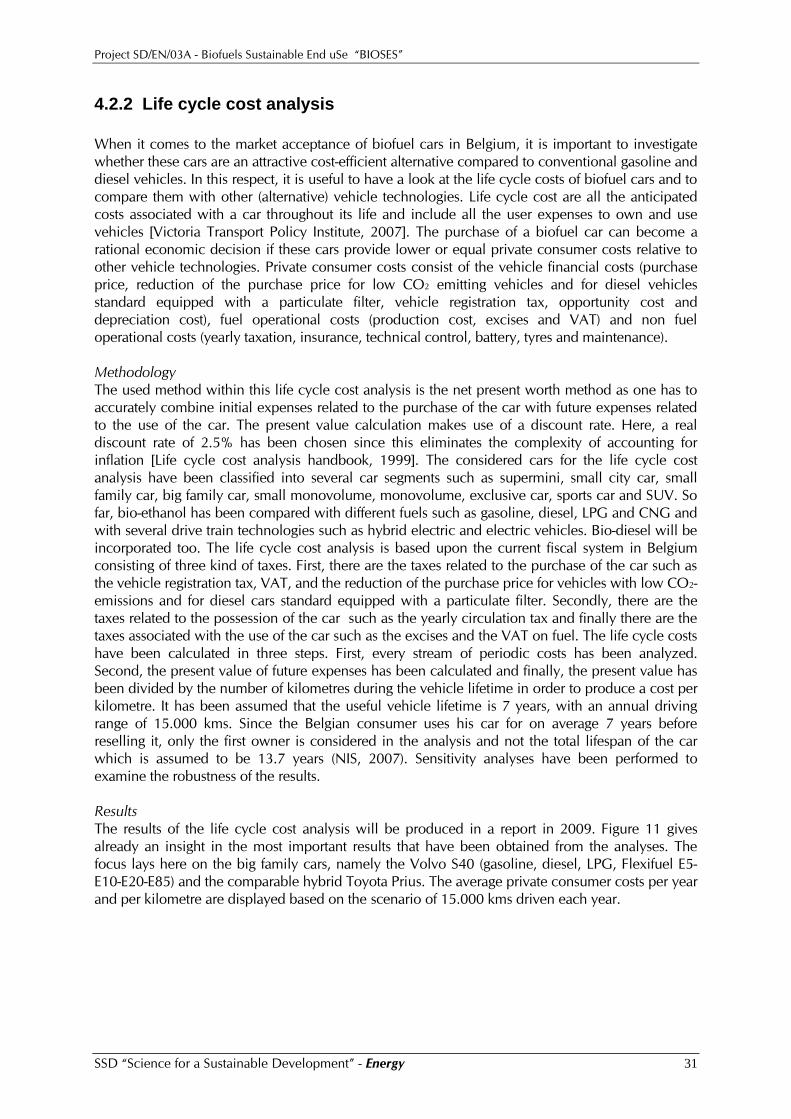
*This table does not take into account the maximum price of diesel as defined in the "Contrat Programme". The use of diesel and B5 for conventional cars costs approximately the same for end users. For higher percentages biofuels, the cost for end users increases with the augmentation of the content of biodiesel blended with diesel. This micro-economic cost overview was carried out in April 2008 but meanwhile the values for some parameters have changed. However these prices are not fixed because the base prices of diesel and biodiesel are evolving all the time. Commercial agreements between the biofuels producers and the oil companies will impact these prices. In addition, a maximum price is stated by law (Contrat programme) that does not take into account the biofuels incorporation in the formula. Therefore the prices above B5 are rather theoretical values as none can sell diesel at a higher price compared to the maximum one. Also, an overview has been made of the cost for end users by using bioethanol at different percentages, taking into account values from the Law of 10 June 2006. As said previously on the biodiesel, the costs for the end user increase with the augmentation of the amount of bioethanol blended with gasoline for conventional cars. In this following table, the values are presented, still without taking into account the maximum legal price.
Table 10 : Costs (per litre*) for end users by using bioethanol at different percentages for conventional cars, at the current Belgian legislation
Common cars €/l* Gasoline E7 E10 E20 E30 E85 E95 E100 Base price 0,45 0,46 0,46 0,47 0,48 0,54 0,55 0,55Tax 0,62 0,58 0,58 0,58 0,58 0,58 0,58 0,58Distribution costs 0,15 0,15 0,15 0,15 0,15 0,15 0,15 0,15VAT 21% 0,26 0,25 0,25 0,25 0,25 0,27 0,27 0,27Total 1,48 1,44 1,44 1,45 1,47 1,53 1,54 1,55
Source: Data obtained from the Law of 10 June 2006 and BPF Assumption of UCL for base price of bioethanol.
*mind that the energy content of ethanol is 1/3 lower per litre than for gasoline; the volumetric fuel consumption of E85 is expected to be 30-35% higher than for gasoline.
Currently we are making an overview within BIOSES of the expected cost evolutions of most biofuels by 2030. This will be completed by mid 2009 and will feed into the macro-economic analyses.
SSD “Science for a Sustainable Development” - Energy 30
Project SD/EN/03A - Biofuels Sustainable End uSe “BIOSES”
4.2.2 Life cycle cost analysis When it comes to the market acceptance of biofuel cars in Belgium, it is important to investigate whether these cars are an attractive cost-efficient alternative compared to conventional gasoline and diesel vehicles. In this respect, it is useful to have a look at the life cycle costs of biofuel cars and to compare them with other (alternative) vehicle technologies. Life cycle cost are all the anticipated costs associated with a car throughout its life and include all the user expenses to own and use vehicles [Victoria Transport Policy Institute, 2007]. The purchase of a biofuel car can become a rational economic decision if these cars provide lower or equal private consumer costs relative to other vehicle technologies. Private consumer costs consist of the vehicle financial costs (purchase price, reduction of the purchase price for low CO2 emitting vehicles and for diesel vehicles standard equipped with a particulate filter, vehicle registration tax, opportunity cost and depreciation cost), fuel operational costs (production cost, excises and VAT) and non fuel operational costs (yearly taxation, insurance, technical control, battery, tyres and maintenance). Methodology The used method within this life cycle cost analysis is the net present worth method as one has to accurately combine initial expenses related to the purchase of the car with future expenses related to the use of the car. The present value calculation makes use of a discount rate. Here, a real discount rate of 2.5% has been chosen since this eliminates the complexity of accounting for inflation [Life cycle cost analysis handbook, 1999]. The considered cars for the life cycle cost analysis have been classified into several car segments such as supermini, small city car, small family car, big family car, small monovolume, monovolume, exclusive car, sports car and SUV. So far, bio-ethanol has been compared with different fuels such as gasoline, diesel, LPG and CNG and with several drive train technologies such as hybrid electric and electric vehicles. Bio-diesel will be incorporated too. The life cycle cost analysis is based upon the current fiscal system in Belgium consisting of three kind of taxes. First, there are the taxes related to the purchase of the car such as the vehicle registration tax, VAT, and the reduction of the purchase price for vehicles with low CO2- emissions and for diesel cars standard equipped with a particulate filter. Secondly, there are the taxes related to the possession of the car such as the yearly circulation tax and finally there are the taxes associated with the use of the car such as the excises and the VAT on fuel. The life cycle costs have been calculated in three steps. First, every stream of periodic costs has been analyzed. Second, the present value of future expenses has been calculated and finally, the present value has been divided by the number of kilometres during the vehicle lifetime in order to produce a cost per kilometre. It has been assumed that the useful vehicle lifetime is 7 years, with an annual driving range of 15.000 kms. Since the Belgian consumer uses his car for on average 7 years before reselling it, only the first owner is considered in the analysis and not the total lifespan of the car which is assumed to be 13.7 years (NIS, 2007). Sensitivity analyses have been performed to examine the robustness of the results. Results The results of the life cycle cost analysis will be produced in a report in 2009. Figure 11 gives already an insight in the most important results that have been obtained from the analyses. The focus lays here on the big family cars, namely the Volvo S40 (gasoline, diesel, LPG, Flexifuel E5-E10-E20-E85) and the comparable hybrid Toyota Prius. The average private consumer costs per year and per kilometre are displayed based on the scenario of 15.000 kms driven each year.
SSD “Science for a Sustainable Development” - Energy 31
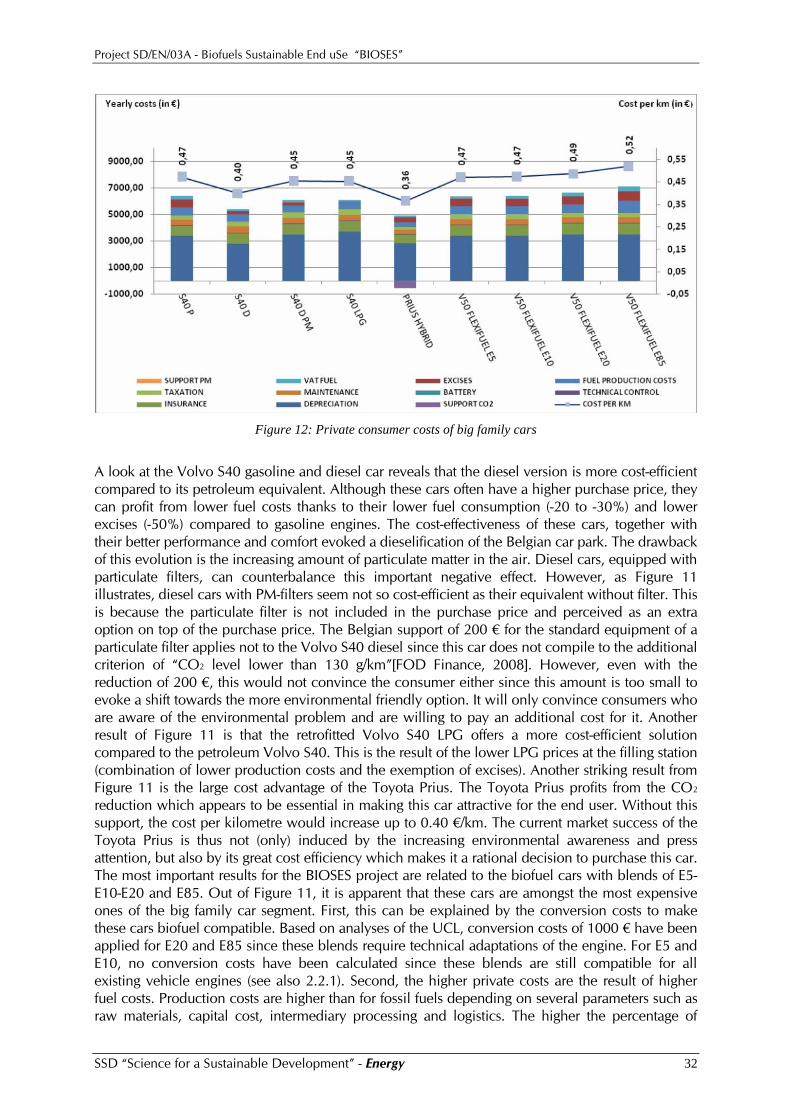
Project SD/EN/03A - Biofuels Sustainable End uSe “BIOSES”
Figure 12: Private consumer costs of big family cars
A look at the Volvo S40 gasoline and diesel car reveals that the diesel version is more cost-efficient compared to its petroleum equivalent. Although these cars often have a higher purchase price, they can profit from lower fuel costs thanks to their lower fuel consumption (-20 to -30%) and lower excises (-50%) compared to gasoline engines. The cost-effectiveness of these cars, together with their better performance and comfort evoked a dieselification of the Belgian car park. The drawback of this evolution is the increasing amount of particulate matter in the air. Diesel cars, equipped with particulate filters, can counterbalance this important negative effect. However, as Figure 11 illustrates, diesel cars with PM-filters seem not so cost-efficient as their equivalent without filter. This is because the particulate filter is not included in the purchase price and perceived as an extra option on top of the purchase price. The Belgian support of 200 € for the standard equipment of a particulate filter applies not to the Volvo S40 diesel since this car does not compile to the additional criterion of “CO2 level lower than 130 g/km”[FOD Finance, 2008]. However, even with the reduction of 200 €, this would not convince the consumer either since this amount is too small to evoke a shift towards the more environmental friendly option. It will only convince consumers who are aware of the environmental problem and are willing to pay an additional cost for it. Another result of Figure 11 is that the retrofitted Volvo S40 LPG offers a more cost-efficient solution compared to the petroleum Volvo S40. This is the result of the lower LPG prices at the filling station (combination of lower production costs and the exemption of excises). Another striking result from Figure 11 is the large cost advantage of the Toyota Prius. The Toyota Prius profits from the CO2 reduction which appears to be essential in making this car attractive for the end user. Without this support, the cost per kilometre would increase up to 0.40 €/km. The current market success of the Toyota Prius is thus not (only) induced by the increasing environmental awareness and press attention, but also by its great cost efficiency which makes it a rational decision to purchase this car. The most important results for the BIOSES project are related to the biofuel cars with blends of E5-E10-E20 and E85. Out of Figure 11, it is apparent that these cars are amongst the most expensive ones of the big family car segment. First, this can be explained by the conversion costs to make these cars biofuel compatible. Based on analyses of the UCL, conversion costs of 1000 € have been applied for E20 and E85 since these blends require technical adaptations of the engine. For E5 and E10, no conversion costs have been calculated since these blends are still compatible for all existing vehicle engines (see also 2.2.1). Second, the higher private costs are the result of higher fuel costs. Production costs are higher than for fossil fuels depending on several parameters such as raw materials, capital cost, intermediary processing and logistics. The higher the percentage of
SSD “Science for a Sustainable Development” - Energy 32
Project SD/EN/03A - Biofuels Sustainable End uSe “BIOSES”
biofuels in the blend, the higher the private consumer cost for the end user. It may be useful to introduce a reduction of excises proportional to the biofuel content in order to make them more attractive for potential users. A reduction of excises related to the share of the incorporated biofuel blends would produce a cost per kilometre of 0.47€ for the Volvo V50 E85 instead of 0.52€/km which is a far more attractive result within this big family car segment. Finally, it is also important to mention that the use of bio-ethanol involves supplementary fuel consumption at some percentages due to its lower energy density. High bio-ethanol blends (E85) will have a higher fuel consumption of on average 30 to 35%, while low blends of E5 and E10 will have a comparable fuel consumption as regular gasoline (see also 3.2.2). Overall, these three reasons explain why biofuel cars are not a very attractive option for end users within the current Belgian fiscal system and it points out the need for policy measures to make these cars more attractive.
SSD “Science for a Sustainable Development” - Energy 33
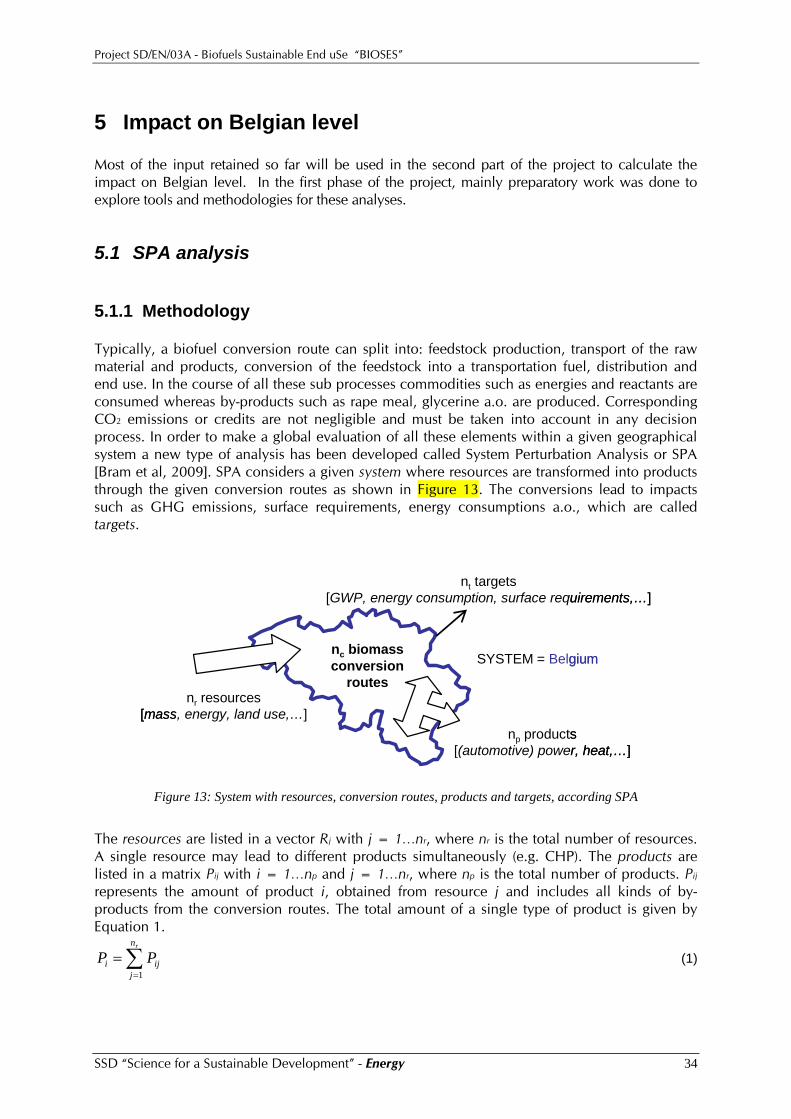
Project SD/EN/03A - Biofuels Sustainable End uSe “BIOSES”
5 Impact on Belgian level Most of the input retained so far will be used in the second part of the project to calculate the impact on Belgian level. In the first phase of the project, mainly preparatory work was done to explore tools and methodologies for these analyses.
5.1 SPA analysis
5.1.1 Methodology Typically, a biofuel conversion route can split into: feedstock production, transport of the raw material and products, conversion of the feedstock into a transportation fuel, distribution and end use. In the course of all these sub processes commodities such as energies and reactants are consumed whereas by-products such as rape meal, glycerine a.o. are produced. Corresponding CO2 emissions or credits are not negligible and must be taken into account in any decision process. In order to make a global evaluation of all these elements within a given geographical system a new type of analysis has been developed called System Perturbation Analysis or SPA [Bram et al, 2009]. SPA considers a given system where resources are transformed into products through the given conversion routes as shown in Figure 13. The conversions lead to impacts such as GHG emissions, surface requirements, energy consumptions a.o., which are called targets.
nc biomass conversion
routes
np products[(automotive) power, heat,…]
nt targets[GWP, energy consumption, surface requirements,…]
nr resources[mass, energy, land use,…]
SYSTEM = Belgiumnc biomass conversion
routes
np products[(automotive) power, heat,…]
nt targets[GWP, energy consumption, surface requirements,…]
nr resources[mass, energy, land use,…]
SYSTEM = Belgium
Figure 13: System with resources, conversion routes, products and targets, according SPA
The resources are listed in a vector Rj with j = 1…nr, where nr is the total number of resources. A single resource may lead to different products simultaneously (e.g. CHP). The products are listed in a matrix Pij with i = 1…np and j = 1…nr, where np is the total number of products. Pij represents the amount of product i, obtained from resource j and includes all kinds of by-products from the conversion routes. The total amount of a single type of product is given by Equation 1.
∑=
=rn
jiji PP
1 (1)
SSD “Science for a Sustainable Development” - Energy 34
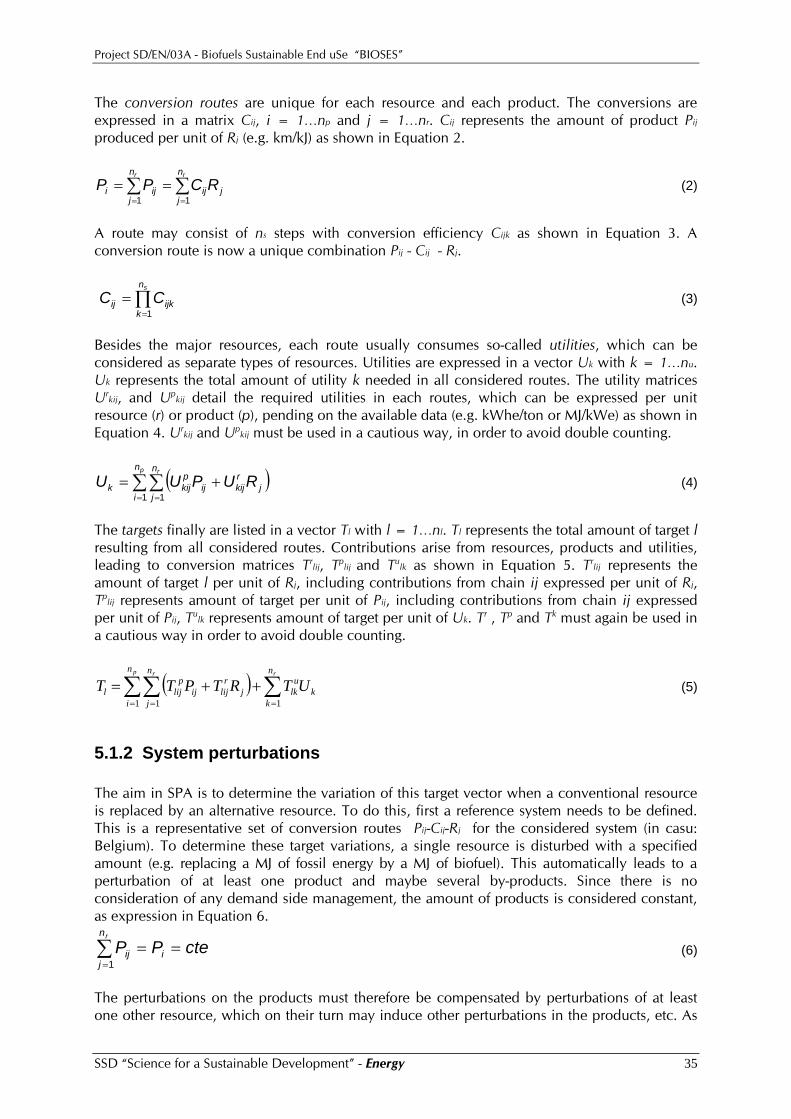
Project SD/EN/03A - Biofuels Sustainable End uSe “BIOSES”
The conversion routes are unique for each resource and each product. The conversions are expressed in a matrix Cij, i = 1…np and j = 1…nr. Cij represents the amount of product Pij produced per unit of Rj (e.g. km/kJ) as shown in Equation 2.
∑∑==
==rr n
jjij
n
jiji RCPP
11 (2)
A route may consist of ns steps with conversion efficiency Cijk as shown in Equation 3. A conversion route is now a unique combination Pij - Cij - Rj.
(3) ∏=
=sn
kijkij CC
1
Besides the major resources, each route usually consumes so-called utilities, which can be considered as separate types of resources. Utilities are expressed in a vector Uk with k = 1…nu. Uk represents the total amount of utility k needed in all considered routes. The utility matrices Ur
kij, and Upkij detail the required utilities in each routes, which can be expressed per unit
resource (r) or product (p), pending on the available data (e.g. kWhe/ton or MJ/kWe) as shown in Equation 4. Ur
kij and Upkij must be used in a cautious way, in order to avoid double counting.
(∑∑= =
+=p rn
i
n
jj
rkijij
pkijk RUPUU
1 1) (4)
The targets finally are listed in a vector Tl with l = 1…nl. Tl represents the total amount of target l resulting from all considered routes. Contributions arise from resources, products and utilities, leading to conversion matrices Tr
lij, Tplij and Tu
lk as shown in Equation 5. Trlij represents the
amount of target l per unit of Rj, including contributions from chain ij expressed per unit of Rj, Tp
lij represents amount of target per unit of Pij, including contributions from chain ij expressed per unit of Pij, Tu
lk represents amount of target per unit of Uk. Tr , Tp and Tk must again be used in a cautious way in order to avoid double counting.
( ) ∑∑∑== =
++=rp r n
kk
ulk
n
i
n
jj
rlijij
plijl UTRTPTT
11 1 (5)
5.1.2 System perturbations The aim in SPA is to determine the variation of this target vector when a conventional resource is replaced by an alternative resource. To do this, first a reference system needs to be defined. This is a representative set of conversion routes Pij-Cij-Rj for the considered system (in casu: Belgium). To determine these target variations, a single resource is disturbed with a specified amount (e.g. replacing a MJ of fossil energy by a MJ of biofuel). This automatically leads to a perturbation of at least one product and maybe several by-products. Since there is no consideration of any demand side management, the amount of products is considered constant, as expression in Equation 6.
ctePPrn
jiij ==∑
=1 (6)
The perturbations on the products must therefore be compensated by perturbations of at least one other resource, which on their turn may induce other perturbations in the products, etc. As
SSD “Science for a Sustainable Development” - Energy 35
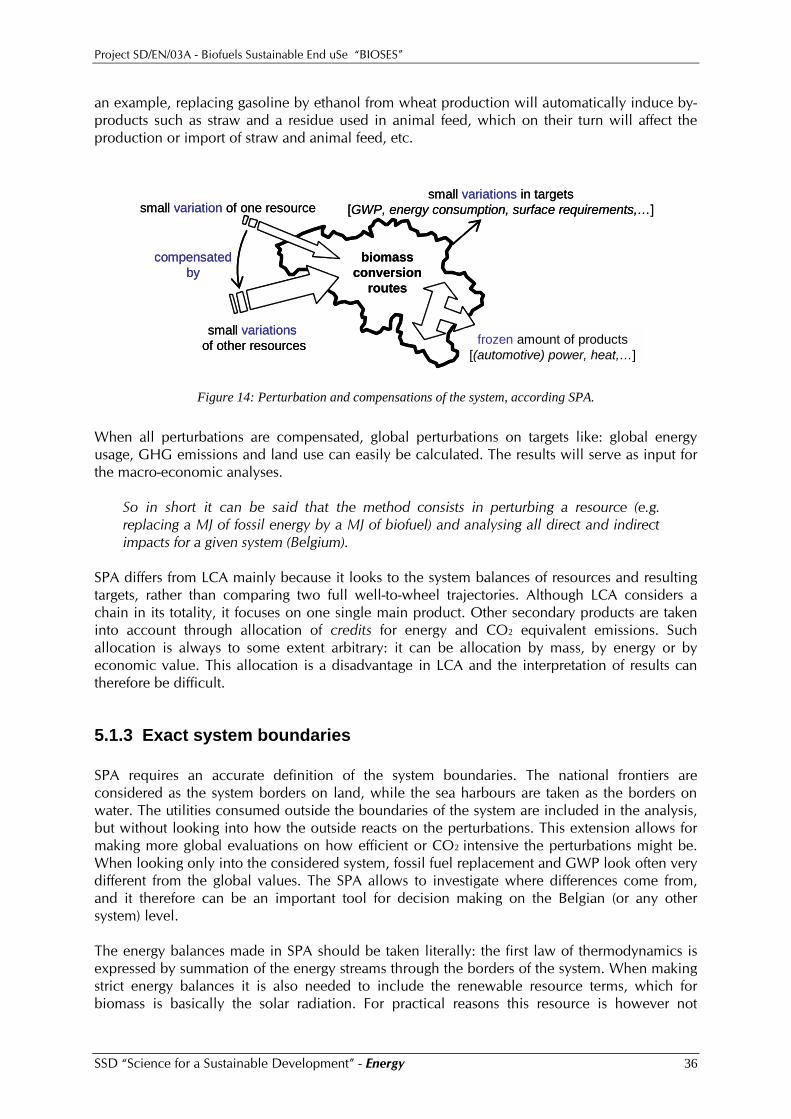
Project SD/EN/03A - Biofuels Sustainable End uSe “BIOSES”
an example, replacing gasoline by ethanol from wheat production will automatically induce by-products such as straw and a residue used in animal feed, which on their turn will affect the production or import of straw and animal feed, etc.
biomass conversion
routes
small variation of one resource
frozen amount of products[(automotive) power, heat,…]
small variations in targets[GWP, energy consumption, surface requirements,…]
small variationsof other resources
compensated by
biomass conversion
routes
small variation of one resource
frozen amount of products[(automotive) power, heat,…]
small variations in targets[GWP, energy consumption, surface requirements,…]
small variationsof other resources
compensated by
Figure 14: Perturbation and compensations of the system, according SPA.
When all perturbations are compensated, global perturbations on targets like: global energy usage, GHG emissions and land use can easily be calculated. The results will serve as input for the macro-economic analyses.
So in short it can be said that the method consists in perturbing a resource (e.g. replacing a MJ of fossil energy by a MJ of biofuel) and analysing all direct and indirect impacts for a given system (Belgium).
SPA differs from LCA mainly because it looks to the system balances of resources and resulting targets, rather than comparing two full well-to-wheel trajectories. Although LCA considers a chain in its totality, it focuses on one single main product. Other secondary products are taken into account through allocation of credits for energy and CO2 equivalent emissions. Such allocation is always to some extent arbitrary: it can be allocation by mass, by energy or by economic value. This allocation is a disadvantage in LCA and the interpretation of results can therefore be difficult.
5.1.3 Exact system boundaries SPA requires an accurate definition of the system boundaries. The national frontiers are considered as the system borders on land, while the sea harbours are taken as the borders on water. The utilities consumed outside the boundaries of the system are included in the analysis, but without looking into how the outside reacts on the perturbations. This extension allows for making more global evaluations on how efficient or CO2 intensive the perturbations might be. When looking only into the considered system, fossil fuel replacement and GWP look often very different from the global values. The SPA allows to investigate where differences come from, and it therefore can be an important tool for decision making on the Belgian (or any other system) level. The energy balances made in SPA should be taken literally: the first law of thermodynamics is expressed by summation of the energy streams through the borders of the system. When making strict energy balances it is also needed to include the renewable resource terms, which for biomass is basically the solar radiation. For practical reasons this resource is however not
SSD “Science for a Sustainable Development” - Energy 36
Project SD/EN/03A - Biofuels Sustainable End uSe “BIOSES”
considered, and it is replaced by a source term inside the system. This source term is calculated as the biomass yield per year, times its lower heating value.
5.1.4 New version of the SPA software Currently, the SPA software is in the process of completely being rewritten to make it suitable for application within the BIOSES and TEXBIAG projects. This new version of the software is called SPA2 and it contains some important and necessary improvements over the first version SPA1. On overview of the internal functionally of SPA2 is shown in Figure 15.
Database withflowsheet descriptions
MATLAB:
all calculations NG conversion (14)
NG distribution (15)
NG PE (17)
natural gas (11)
28.672 MJ
0.64 kg
0 ha
0 km
natural gas (12)
28.672 MJ
0.64 kg
0 ha
0 km
heat (13)
25.8048 MJ
NaN kg
0 ha
0 km
heat (14)
24.5146 MJ
NaN kg
0 ha
0 km
primairy energy (15)
1.3361 MJ
NaN kg
0 ha
0 km
NG conversion (14)
NG distribution (15)
NG PE (17)
natural gas (11)
28.672 MJ
0.64 kg
0 ha
0 km
natural gas (12)
28.672 MJ
0.64 kg
0 ha
0 km
heat (13)
25.8048 MJ
NaN kg
0 ha
0 km
heat (14)
24.5146 MJ
NaN kg
0 ha
0 km
primairy energy (15)
1.3361 MJ
NaN kg
0 ha
0 km
NG conversion (14)
NG distribution (15)
NG PE (17)
natural gas (11)
28.672 MJ
0.64 kg
0 ha
0 km
natural gas (12)
28.672 MJ
0.64 kg
0 ha
0 km
heat (13)
25.8048 MJ
NaN kg
0 ha
0 km
heat (14)
24.5146 MJ
NaN kg
0 ha
0 km
primairy energy (15)
1.3361 MJ
NaN kg
0 ha
0 km
NG conversion (14)
NG distribution (15)
NG PE (17)
natural gas (11)
28.672 MJ0.64 kg
0 ha0 km
natural gas (12)
28.672 MJ0.64 kg
0 ha0 km
heat (13)
25.8048 MJNaN kg
0 ha0 km
heat (14)
24.5146 MJNaN kg
0 ha0 km
primairy energy (15)
1.3361 MJNaN kg
0 ha0 km
automatic drawing
for validation and reporting
GUI
automatic
user will be allowed to make drawing!
automatic
documentation
+ drawing interpreter!
Database withflowsheet descriptions
MATLAB:
all calculations NG conversion (14)
NG distribution (15)
NG PE (17)
natural gas (11)
28.672 MJ
0.64 kg
0 ha
0 km
natural gas (12)
28.672 MJ
0.64 kg
0 ha
0 km
heat (13)
25.8048 MJ
NaN kg
0 ha
0 km
heat (14)
24.5146 MJ
NaN kg
0 ha
0 km
primairy energy (15)
1.3361 MJ
NaN kg
0 ha
0 km
NG conversion (14)
NG distribution (15)
NG PE (17)
natural gas (11)
28.672 MJ
0.64 kg
0 ha
0 km
natural gas (12)
28.672 MJ
0.64 kg
0 ha
0 km
heat (13)
25.8048 MJ
NaN kg
0 ha
0 km
heat (14)
24.5146 MJ
NaN kg
0 ha
0 km
primairy energy (15)
1.3361 MJ
NaN kg
0 ha
0 km
NG conversion (14)
NG distribution (15)
NG PE (17)
natural gas (11)
28.672 MJ
0.64 kg
0 ha
0 km
natural gas (12)
28.672 MJ
0.64 kg
0 ha
0 km
heat (13)
25.8048 MJ
NaN kg
0 ha
0 km
heat (14)
24.5146 MJ
NaN kg
0 ha
0 km
primairy energy (15)
1.3361 MJ
NaN kg
0 ha
0 km
NG conversion (14)
NG distribution (15)
NG PE (17)
natural gas (11)
28.672 MJ0.64 kg
0 ha0 km
natural gas (12)
28.672 MJ0.64 kg
0 ha0 km
heat (13)
25.8048 MJNaN kg
0 ha0 km
heat (14)
24.5146 MJNaN kg
0 ha0 km
primairy energy (15)
1.3361 MJNaN kg
0 ha0 km
automatic drawing
for validation and reporting
GUIGUI
automatic
user will be allowed to make drawing!
automatic
documentation
automatic
documentation
+ drawing interpreter!
Figure 15: overview of the internal functionally of SPA2
The most important improvement is the newly developed graphical user interface (GUI). There was no such interface in SPA1 which made SPA1 very difficult to use. This new GUI facilitates the data input and thus reduced the risk for mistakes during documentation. A second improvement is the internal data structure. In SPA1 all data was contained in excel files. These files were difficult to adapt/extend and also elaborate pre-processing was necessary before the SPA calculations could be performed. This made SPA1 unsuited for application within BIOSES. It was therefore necessary to redesign the internal data structure in SPA2. It was decided to collect all input data in a newly developed object oriented database. This DB was designed in such a way that it is suited to contain flowsheet-like descriptions of the biofuel conversion routes under examination. A snapshot of the graphical user interface of SPA2 - showing the flowsheet drawing canvas - can be seen in Figure 16.
SSD “Science for a Sustainable Development” - Energy 37
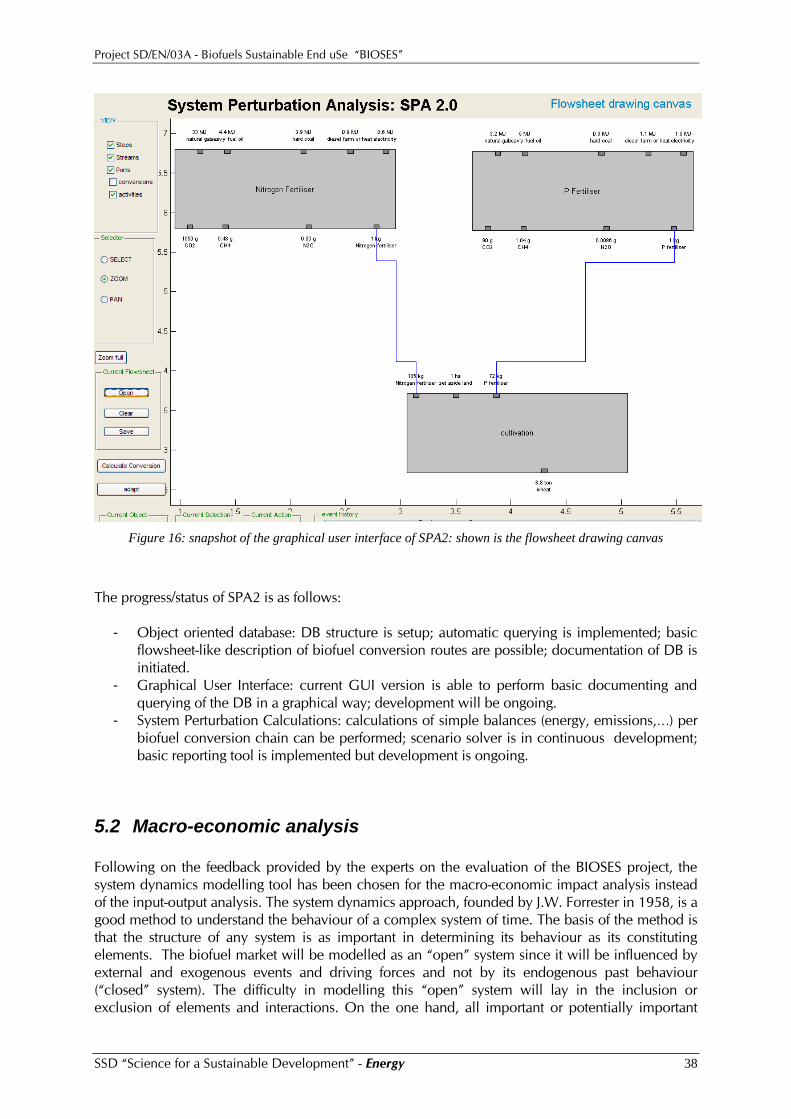
Project SD/EN/03A - Biofuels Sustainable End uSe “BIOSES”
Figure 16: snapshot of the graphical user interface of SPA2: shown is the flowsheet drawing canvas
The progress/status of SPA2 is as follows:
- Object oriented database: DB structure is setup; automatic querying is implemented; basic flowsheet-like description of biofuel conversion routes are possible; documentation of DB is initiated.
- Graphical User Interface: current GUI version is able to perform basic documenting and querying of the DB in a graphical way; development will be ongoing.
- System Perturbation Calculations: calculations of simple balances (energy, emissions,…) per biofuel conversion chain can be performed; scenario solver is in continuous development; basic reporting tool is implemented but development is ongoing.
5.2 Macro-economic analysis Following on the feedback provided by the experts on the evaluation of the BIOSES project, the system dynamics modelling tool has been chosen for the macro-economic impact analysis instead of the input-output analysis. The system dynamics approach, founded by J.W. Forrester in 1958, is a good method to understand the behaviour of a complex system of time. The basis of the method is that the structure of any system is as important in determining its behaviour as its constituting elements. The biofuel market will be modelled as an “open” system since it will be influenced by external and exogenous events and driving forces and not by its endogenous past behaviour (“closed” system). The difficulty in modelling this “open” system will lay in the inclusion or exclusion of elements and interactions. On the one hand, all important or potentially important
SSD “Science for a Sustainable Development” - Energy 38
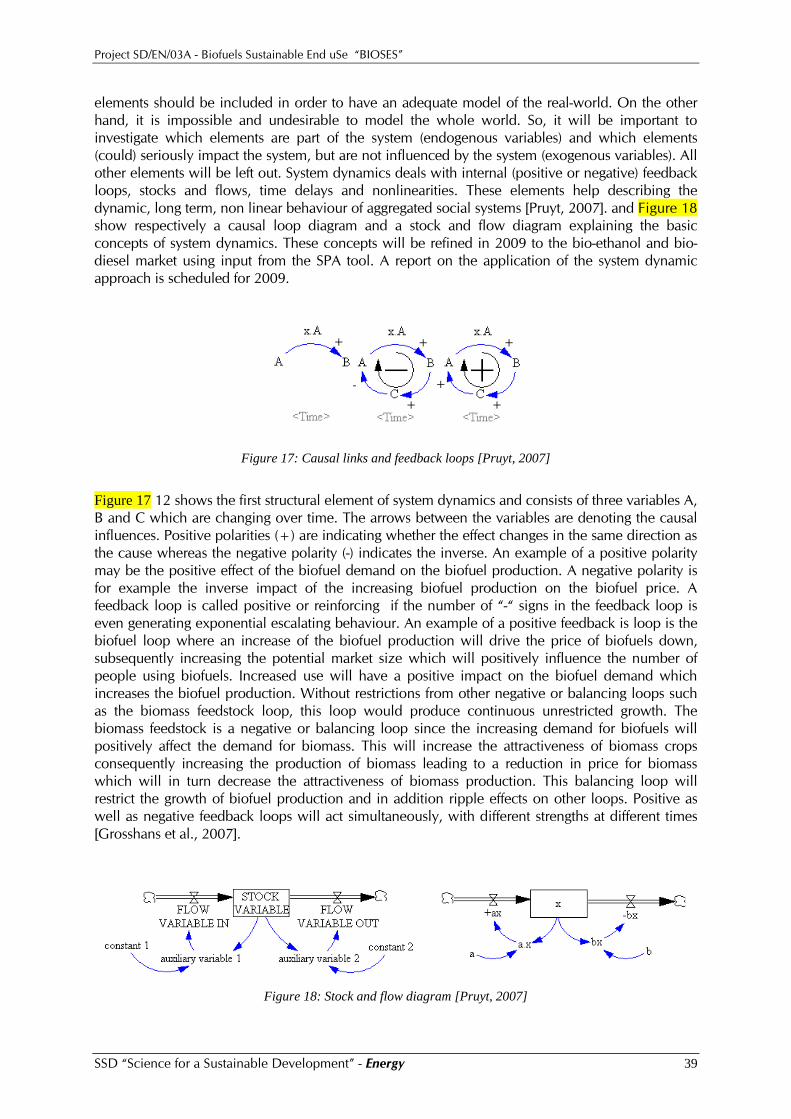
Project SD/EN/03A - Biofuels Sustainable End uSe “BIOSES”
elements should be included in order to have an adequate model of the real-world. On the other hand, it is impossible and undesirable to model the whole world. So, it will be important to investigate which elements are part of the system (endogenous variables) and which elements (could) seriously impact the system, but are not influenced by the system (exogenous variables). All other elements will be left out. System dynamics deals with internal (positive or negative) feedback loops, stocks and flows, time delays and nonlinearities. These elements help describing the dynamic, long term, non linear behaviour of aggregated social systems [Pruyt, 2007]. and Figure 18 show respectively a causal loop diagram and a stock and flow diagram explaining the basic concepts of system dynamics. These concepts will be refined in 2009 to the bio-ethanol and bio-diesel market using input from the SPA tool. A report on the application of the system dynamic approach is scheduled for 2009.
Figure 17: Causal links and feedback loops [Pruyt, 2007]
Figure 17 12 shows the first structural element of system dynamics and consists of three variables A, B and C which are changing over time. The arrows between the variables are denoting the causal influences. Positive polarities (+) are indicating whether the effect changes in the same direction as the cause whereas the negative polarity (-) indicates the inverse. An example of a positive polarity may be the positive effect of the biofuel demand on the biofuel production. A negative polarity is for example the inverse impact of the increasing biofuel production on the biofuel price. A feedback loop is called positive or reinforcing if the number of “-“ signs in the feedback loop is even generating exponential escalating behaviour. An example of a positive feedback is loop is the biofuel loop where an increase of the biofuel production will drive the price of biofuels down, subsequently increasing the potential market size which will positively influence the number of people using biofuels. Increased use will have a positive impact on the biofuel demand which increases the biofuel production. Without restrictions from other negative or balancing loops such as the biomass feedstock loop, this loop would produce continuous unrestricted growth. The biomass feedstock is a negative or balancing loop since the increasing demand for biofuels will positively affect the demand for biomass. This will increase the attractiveness of biomass crops consequently increasing the production of biomass leading to a reduction in price for biomass which will in turn decrease the attractiveness of biomass production. This balancing loop will restrict the growth of biofuel production and in addition ripple effects on other loops. Positive as well as negative feedback loops will act simultaneously, with different strengths at different times [Grosshans et al., 2007].
Figure 18: Stock and flow diagram [Pruyt, 2007]
SSD “Science for a Sustainable Development” - Energy 39
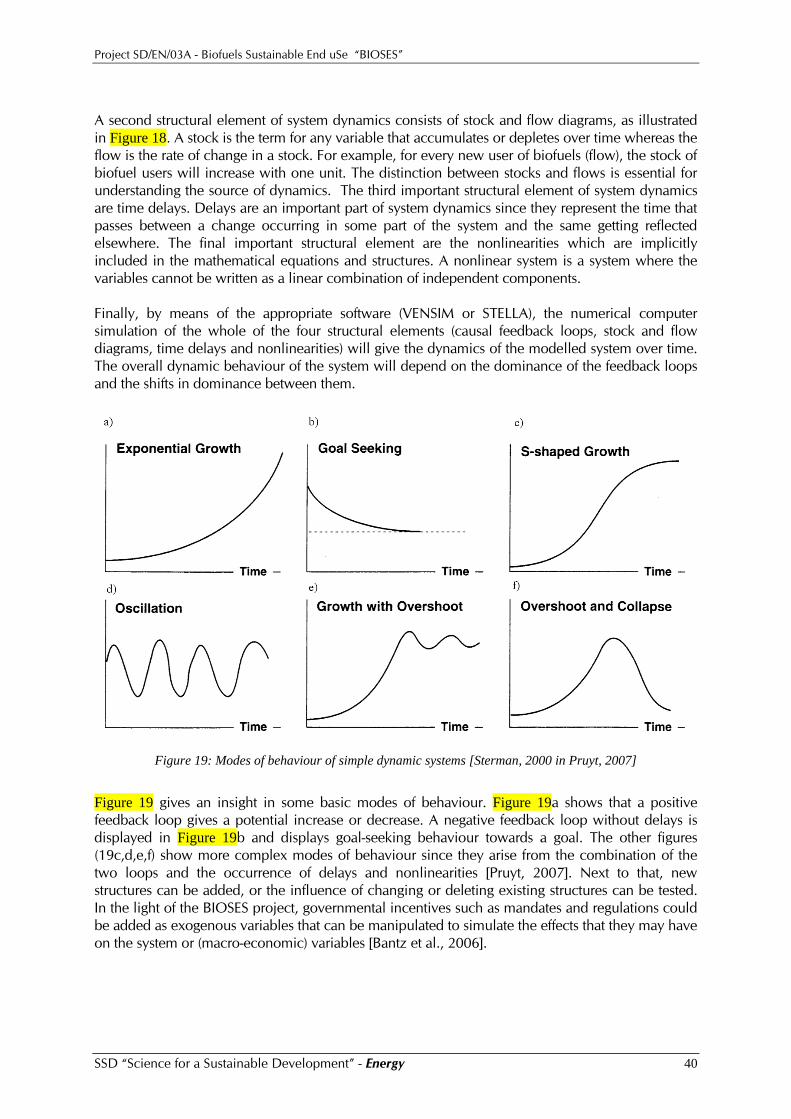
Project SD/EN/03A - Biofuels Sustainable End uSe “BIOSES”
A second structural element of system dynamics consists of stock and flow diagrams, as illustrated in Figure 18. A stock is the term for any variable that accumulates or depletes over time whereas the flow is the rate of change in a stock. For example, for every new user of biofuels (flow), the stock of biofuel users will increase with one unit. The distinction between stocks and flows is essential for understanding the source of dynamics. The third important structural element of system dynamics are time delays. Delays are an important part of system dynamics since they represent the time that passes between a change occurring in some part of the system and the same getting reflected elsewhere. The final important structural element are the nonlinearities which are implicitly included in the mathematical equations and structures. A nonlinear system is a system where the variables cannot be written as a linear combination of independent components. Finally, by means of the appropriate software (VENSIM or STELLA), the numerical computer simulation of the whole of the four structural elements (causal feedback loops, stock and flow diagrams, time delays and nonlinearities) will give the dynamics of the modelled system over time. The overall dynamic behaviour of the system will depend on the dominance of the feedback loops and the shifts in dominance between them.
Figure 19: Modes of behaviour of simple dynamic systems [Sterman, 2000 in Pruyt, 2007]
Figure 19 gives an insight in some basic modes of behaviour. Figure 19a shows that a positive feedback loop gives a potential increase or decrease. A negative feedback loop without delays is displayed in Figure 19b and displays goal-seeking behaviour towards a goal. The other figures (19c,d,e,f) show more complex modes of behaviour since they arise from the combination of the two loops and the occurrence of delays and nonlinearities [Pruyt, 2007]. Next to that, new structures can be added, or the influence of changing or deleting existing structures can be tested. In the light of the BIOSES project, governmental incentives such as mandates and regulations could be added as exogenous variables that can be manipulated to simulate the effects that they may have on the system or (macro-economic) variables [Bantz et al., 2006].
SSD “Science for a Sustainable Development” - Energy 40
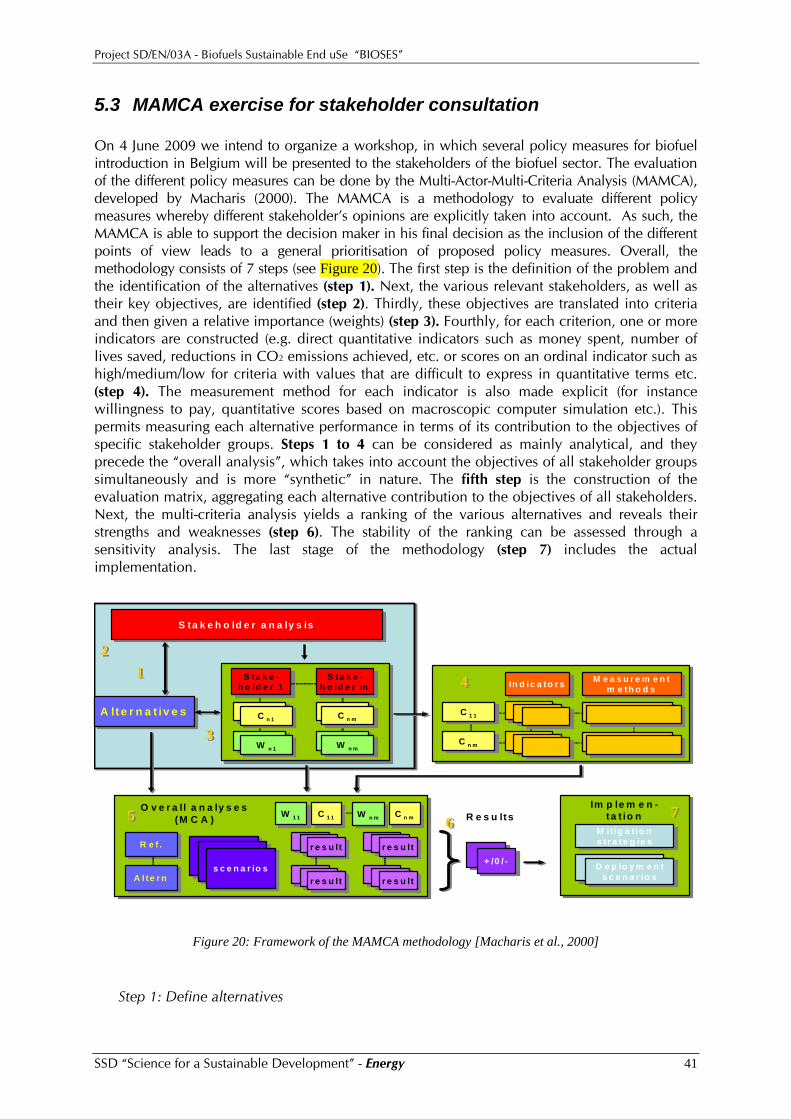
Project SD/EN/03A - Biofuels Sustainable End uSe “BIOSES”
5.3 MAMCA exercise for stakeholder consultation On 4 June 2009 we intend to organize a workshop, in which several policy measures for biofuel introduction in Belgium will be presented to the stakeholders of the biofuel sector. The evaluation of the different policy measures can be done by the Multi-Actor-Multi-Criteria Analysis (MAMCA), developed by Macharis (2000). The MAMCA is a methodology to evaluate different policy measures whereby different stakeholder’s opinions are explicitly taken into account. As such, the MAMCA is able to support the decision maker in his final decision as the inclusion of the different points of view leads to a general prioritisation of proposed policy measures. Overall, the methodology consists of 7 steps (see Figure 20). The first step is the definition of the problem and the identification of the alternatives (step 1). Next, the various relevant stakeholders, as well as their key objectives, are identified (step 2). Thirdly, these objectives are translated into criteria and then given a relative importance (weights) (step 3). Fourthly, for each criterion, one or more indicators are constructed (e.g. direct quantitative indicators such as money spent, number of lives saved, reductions in CO2 emissions achieved, etc. or scores on an ordinal indicator such as high/medium/low for criteria with values that are difficult to express in quantitative terms etc. (step 4). The measurement method for each indicator is also made explicit (for instance willingness to pay, quantitative scores based on macroscopic computer simulation etc.). This permits measuring each alternative performance in terms of its contribution to the objectives of specific stakeholder groups. Steps 1 to 4 can be considered as mainly analytical, and they precede the “overall analysis”, which takes into account the objectives of all stakeholder groups simultaneously and is more “synthetic” in nature. The fifth step is the construction of the evaluation matrix, aggregating each alternative contribution to the objectives of all stakeholders. Next, the multi-criteria analysis yields a ranking of the various alternatives and reveals their strengths and weaknesses (step 6). The stability of the ranking can be assessed through a sensitivity analysis. The last stage of the methodology (step 7) includes the actual implementation.
S ta k e h o ld e r a n a ly s isS ta k e h o ld e r a n a ly s is
S ta k e -h o ld e r 1S ta k e -
h o ld e r 1
C 1 1C 1 1 CCA lte r n a t iv e sA lte r n a t iv e s C n 1
C n 1 C n mC n m
S ta k e -h o ld e r mS ta k e -
h o ld e r m
R e f .R e f .
A l te r nA l te r n
C 1 1C 1 1 R e s u lts
Im p le m e n -ta t io n
Im p le m e n -ta t io n
s c e n a r io ss c e n a r io s
r e s u ltr e s u lt
r e s u ltr e s u lt
C n mC n m
r e s u ltr e s u lt
r e s u l tr e s u lt
In d ic a to r sIn d ic a to r s M e a s u r e m e n tm e th o d s
M e a s u r e m e n tm e th o d s
C 1 1C 1 1
C n mC n m
M it ig a t io ns tr a te g ie s
M it ig a t io ns tr a te g ie s
C 1 1C 1 1 CCW n 1
W n 1 W n mW n m
W 1 1W 1 1 W n m
W n mO v e r a ll a n a ly s e s
(M C A )
+ /0 /-+ /0 / -D e p lo y m e n t
s c e n a r io sD e p lo y m e n t
s c e n a r io s
1122
6655
44
33
77
Figure 20: Framework of the MAMCA methodology [Macharis et al., 2000]
Step 1: Define alternatives
SSD “Science for a Sustainable Development” - Energy 41
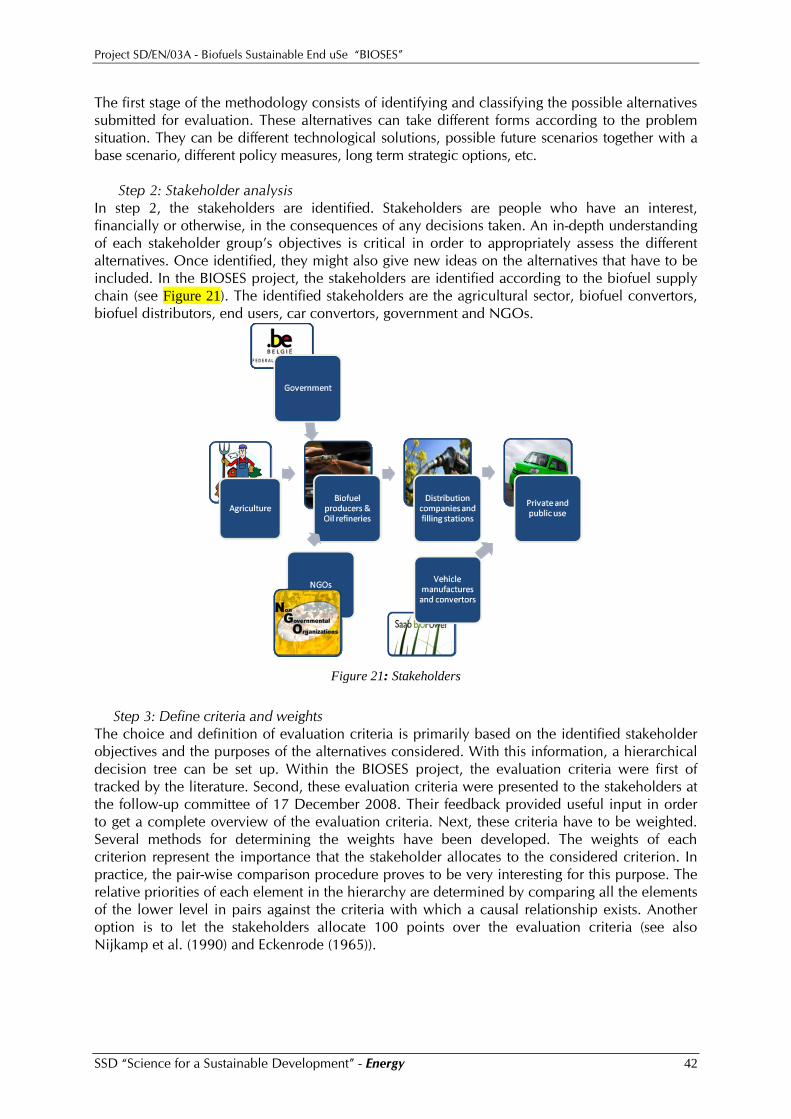
Project SD/EN/03A - Biofuels Sustainable End uSe “BIOSES”
The first stage of the methodology consists of identifying and classifying the possible alternatives submitted for evaluation. These alternatives can take different forms according to the problem situation. They can be different technological solutions, possible future scenarios together with a base scenario, different policy measures, long term strategic options, etc.
Step 2: Stakeholder analysis In step 2, the stakeholders are identified. Stakeholders are people who have an interest, financially or otherwise, in the consequences of any decisions taken. An in-depth understanding of each stakeholder group’s objectives is critical in order to appropriately assess the different alternatives. Once identified, they might also give new ideas on the alternatives that have to be included. In the BIOSES project, the stakeholders are identified according to the biofuel supply chain (see Figure 21). The identified stakeholders are the agricultural sector, biofuel convertors, biofuel distributors, end users, car convertors, government and NGOs.
Figure 21: Stakeholders
Step 3: Define criteria and weights
The choice and definition of evaluation criteria is primarily based on the identified stakeholder objectives and the purposes of the alternatives considered. With this information, a hierarchical decision tree can be set up. Within the BIOSES project, the evaluation criteria were first of tracked by the literature. Second, these evaluation criteria were presented to the stakeholders at the follow-up committee of 17 December 2008. Their feedback provided useful input in order to get a complete overview of the evaluation criteria. Next, these criteria have to be weighted. Several methods for determining the weights have been developed. The weights of each criterion represent the importance that the stakeholder allocates to the considered criterion. In practice, the pair-wise comparison procedure proves to be very interesting for this purpose. The relative priorities of each element in the hierarchy are determined by comparing all the elements of the lower level in pairs against the criteria with which a causal relationship exists. Another option is to let the stakeholders allocate 100 points over the evaluation criteria (see also Nijkamp et al. (1990) and Eckenrode (1965)).
SSD “Science for a Sustainable Development” - Energy 42
Project SD/EN/03A - Biofuels Sustainable End uSe “BIOSES”
Step 4: Criteria, indicators and measurement methods In this stage, the previously identified stakeholder criteria are “operationalized” by constructing indicators (also called metrics or variables) that can be used to measure whether, or to what extent, an alternative contributes to each individual criterion. Indicators provide a “scale” against which a project’s contribution to the criteria can be judged. Indicators are usually, but not always, quantitative in nature. More than one indicator may be required to measure a project’s contribution to a criterion and indicators themselves may measure contributions to multiple criteria.
Step 5: Overall analysis and ranking In order to assess the different strategic alternatives, any Multi-Criteria Decision Analysis (MCDA) can be used. In fact, the second generation multi-criteria analysis methods, the Group Decision Support Methods (GDSM), are well suited for application in the MAMCA methodology as they are able to cope with the stakeholder concept. Methods that will be taken into consideration here are the PROMETHEE method, which has been extended in Macharis et al. (1998), or the Analytical Hierarchical Process (AHP), developed by Saaty (1988) or ELECTRE as in Leyva-Lopez and Fernandez-Gonzalez (2003). The advantage of these GDSM methods is that it provides each stakeholder group with the liberty of having their own criteria, weights and preference structure. Only at the end of the analysis their points of view are being confronted. In this step, the evaluation of the different alternatives will be inserted in the evaluation table.
Step 6: Results The multi-criteria analysis developed in the previous step eventually leads to a classification of the proposed alternatives. In this stage, a sensitivity analysis is performed in order to verify if the result changes when the weights are modified. More important than the ranking, the multi criteria analysis allows revealing the critical stakeholders and their criteria. The MAMCA provides a comparison of different strategic alternatives and supports the decision maker in making his final decision by pointing out for each stakeholder which elements have a clearly positive or a clearly negative impact on the sustainability of the considered alternatives.
Step 7: Implementation When the decision is made, steps have to be taken to implement the chosen alternative by creating deployment schemes. The information on the points of view of each stakeholder, gathered from the previous steps, helps tremendously to define the implementation paths. Possibly new alternatives or modified ones are being proposed for further analysis as more insight into the advantages and disadvantages of a certain alternative for each stakeholder is generated. This would then create a feedback-loop towards the beginning of the procedure. The MAMCA has already been applied successfully in several studies such as for the evaluation of the location of intermodal terminals [Macharis, 2000; Macharis, 2004], the evaluation of mobility rights [Crals et al., 2004], the evaluation of advanced driving systems [Macharis et al., 2004], transport of garbage by water [Macharis and Boel, 2004], the Masterplan for the port of Brussels [Dooms et al., 2002 and 2004], new HST terminal in Brussel [Meeus et al., 2004], the extension of hub activities of DHL [Verbeke et al., 2004] and recently in the process “Flanders In Action (VIA)” [Macharis et al., 2008]. For BIOSES, the MAMCA will be adapted to the specific decision-making problem.
SSD “Science for a Sustainable Development” - Energy 43
Project SD/EN/03A - Biofuels Sustainable End uSe “BIOSES”
6 Preliminary conclusions and policy recommendations As mentioned before the first phase of the project focused mainly on: - defining possible biofuel introduction scenarios, in consultation with stakeholders; - gathering up-to-date data on energy use and emissions on well-to-wheel basis for different
biofuels; this also includes own emission measurements on vehicles; - gathering cost figures and estimations for future costs of different biofuels, from user
perspective; - feasibility and practical barriers for the introduction of biofuels, including first policy
suggestions; preparing the necessary tools and methods for analysis on macro-level (system perturbation analysis, macro-economic analysis).
Most of the input retained so far will be used in the second part of the project to calculate the impact on Belgian level. In the first phase of the project, mainly preparatory work was done to explore tools and methodologies for these analyses. Some of the conclusions so far on the policy level: Current Belgian legislation is focused on the general introduction of low blends of biodiesel to diesel and bioethanol to gasoline through a tax reduction system for a specific producer quota. The market share of PPO is expected to remain very limited. Even if the quota of biodiesel and bio-ethanol will be put on the market, Belgium will only replace 4.2% (by energy) of its fuel use in transport by biofuels in 2010, which is still below the set target of 5.75%. The main advantage of the quota system is that government knows that costs (loss of taxes) will not exceed a certain level, and certain criteria (including sustainability related) can be imposed for companies willing to put biofuels on the Belgian market. However there are some disadvantages of the quota system, some of which already show on the current market. The fuels market currently does not absorb the biofuel amounts suggested in the quota system. There is no obligation for fuel distributors and these seem reluctant to introduce biofuels in their fuel mix, even with the tax reduction system. So the biofuel production capacity is underused. Other means should be investigated if the government wants to reach its targets. The fixation of quota amounts with tax reductions depends on political willingness. There is no incentive to go beyond the quota. New private initiatives (investments, capacity building) are discouraged because of the control of the government of the market. It is also difficult for smaller players to get access to the market (administration). For 2020 the targets will be seriously higher, with 10% renewable fuels (mostly biofuels) for all European countries [EC Renewable Energy Directive, 2008]. It is anticipated that by 2020 E10 and B10 (partly consisting of HVO) will be on the market as standardized fuels, but this is not enough to reach the 10% target. The following additional actions will be necessary: - promote the introduction of advanced biofuels, based on cellulose, - promote the application of higher blends (B30, E85) or dedicated biofuels (bio-methane, B100,
PPO, E95) in certain (niche) markets. There are various barriers to overcome, in which policy can play a role: • first is the economic barrier, as biofuels are still more expensive than fossil fuels. Tax reduction
is a possible instrument to overcome the higher production cost, but also to take the lower energy content into account. Nevertheless a tax reduction system is very sensitive for price fluctuations on the market (fossil fuels and biofuel feedstocks). An alternative or even
SSD “Science for a Sustainable Development” - Energy 44
Project SD/EN/03A - Biofuels Sustainable End uSe “BIOSES”
additional measure is an obligation system in which fuel distributors have an obligation to reach a certain amount of biofuels in their fuel sales. An obligation system is less appropriate for the application of high blends in certain (niche) markets.
• an important technical barrier is the (in)compatibility of existing car fleets to certain biofuel blends. Car manufacturers should anticipate future biofuel blends (e.g. E10, E85, B10, B30) in their current models and search for solutions to convert existing models to higher biofuel compatibility. The introduction of flexi-fuel models can be very important in this sense. Of course vehicle design lies more at corporate and European (sometimes worldwide) level. However member states have the possibility to favour certain environment friendly vehicle models (like FFVs, natural gas models, hybrids, …) in their vehicle tax system. This may also overcome higher production costs of these models – however in case of FFVs the extra cost is marginal.
• distribution may also have compatibility problems with certain biofuel blends, so sometimes dedicated infrastructure is needed. The extra costs (e.g. for E85 pumps) are only worth making if there are clear market prospects of vehicles able to run on these fuels (chicken and egg problem).
• Related to the previous aspects is that biofuel blends are clearly standardized and checked for their quality. This creates confidence for vehicle manufacturers and end users.
Currently the aspect of sustainability and ethics plays a crucial role in the acceptance of the market. In the past year, there has been large media attention and public debate about the potential risks of (large scale) biofuel production. Opinions vary greatly and the debate is often based not only on facts, but also on emotions. The public opinion has been overwhelmed with negative reports on biofuels in a variety of international sensitive issues, including: suspicion about real carbon emissions savings level, competition with food production (e.g. "food or fuel" debate), deforestation and soil erosion, impact on water resources and negative social impacts in developing countries. Different lobby groups and institutions with different interests (oil companies, agrofood industry, environmental groups, automobile industry …) have feeded this discussion to influence the public opinion, mostly based on uncertainties, risks and missed opportunities. The increased demand for biofuel feedstock demand can, directly or indirectly, lead to some pressure on the available arable land involving the conversion of forests and other natural ecosystems into plantations or cropland. These changes in land-use may cause so much carbon release from vegetation and soil that the savings from the use of biofuels are negated. Moreover, a degradation of soils and water bodies may be due to the biomass production. Also, land-use change can involve the loss of important habitats for plants and animals and the endangerment of rare species. Therefore, there is a clear need for sustainability requirements for biofuels (and also other biomass use) to avoid these side effects. The proposed Renewable Energy Directive gives a first start to the implementation of sustainability requirements for biofuels. The lack of knowledge on biofuels for politicians, decision makers and the general public, particularly for higher blends or pure biofuels is an undeniable barrier. The shortage of readily available (independent) information and the absence of customer awareness, market acceptance and the consumer passivity are inevitable barriers. Also, the change of habits and the fear of the unknown may constitute a huge psychological barrier for the end users when having to choose a fuel at the pump. The complexity of biofuels is an important aspect to take into account. Indeed, biofuels refer to environment, energy, agricultural, political, legal and fiscal aspects at the same time. It is very complicated to deal with these main sectors in order to satisfy all stakeholders on the implementation of biofuels.
SSD “Science for a Sustainable Development” - Energy 45
Project SD/EN/03A - Biofuels Sustainable End uSe “BIOSES”
7 Future perspectives and planning for phase 2 of the project
From the elaboration of scenarios, the collection of accurate data on emission performance, energy demand and cost aspects, and the listing of barriers and first policy ideas, the BIOSES project will continue more on macro-level. Some work on micro-level still needs completion, like completing the data sets for WTW emissions and energy use, some remaining vehicle tests to derive emission factors, and also cost estimations of future biofuels. The results will then feed into the macro impact of biofuels introduction scenarios. This includes a system analysis, macro-economic analysis via system dynamics modelling and quantifying the effect of scenarios on total emissions related to transport in Belgium. There is also a specific task to assess the performance of different technologies: the objective is to analyse the energy and environmental impact of the different biofuel vehicles (biodiesel, bio-ethanol, biogas, etc.) and compare them with conventional and other alternative vehicle technologies on a well-to-wheel basis. Three indicators will be developed: Ecoscore, global warming and energy consumption. This approach allows comparing vehicles with different fuels (petrol, diesel, liquefied petroleum gas, compressed natural gas, biofuels etc.) and/or different drive train technologies (internal combustion engines, hybrid electric drive trains, battery electric drive trains, fuel cell electric drive trains, etc.). Consequently the impact of every single vehicle can be calculated. Phase 2 of the project will have a clear focus on policy recommendations and stakeholder feedback. A first step in this process will be the workshop of 4 June 2009, in which we will apply the MAMCA method to include stakeholder’s positions in biofuel scenarios and policy choices. Step by step we will evolve to a biofuel roadmap for the Belgian situation, with all policy options, linked to scenarios and impact analysis. This roadmap will be disseminated to the policy level, various stakeholders with a focus on end-user, as well as the scientific community in Europe. This way we intend to have the largest possible impact of the outcomes of the project and have a clear impact on Belgian policy decisions on the matter. This is a detailed listing of the remaing tasks in phase 2: Task 2 Technology assessment (continue) 2.1 Emission-impact Well-toTank (continue) The overview of WTT emission data is practically finished, some doublechecking needs to be done in the first half of 2009. 2.2 Emission-impact Tank-to-Wheel (VITO – year 1-3) (continue) Emission tests will be continued in 2009, leading to an overview report on the vehicle tests. 2.3 Technology assessment (continue) This task has been initiated in phase 1, but most of the work will be in phase 2. Concrete tasks/outputs are : - Extension of EcoScore database with biofuel options, based on the data from task 2.1 and 2.2.
SSD “Science for a Sustainable Development” - Energy 46
Project SD/EN/03A - Biofuels Sustainable End uSe “BIOSES”
- Impact assessment on the WTW / EcoScore, global warming and energy efficiency comparison of vehicles with different fuels and different drive train technologies.
Task 3 Implementation (continue) 3.1 Socio-economic feasibility (continue) In phase 2, this task will finalize its work on the socio-economic feasibility of the various scenarios, including a micro-economic cost overview of the biofuels concerned, possible barriers and possible implementation pathways. The task will give input to the first stakeholder workshops (begin 2009), and will integrate feedback of workshops in its reporting on framework & conditions for the introduction of biofuels. 3.2 Policy instruments To overcome the barriers identified in subtask 3.1, policy makers can implement different instruments. This subtask will investigate the different policy instruments to overcome the barriers, based on international experiences and possible integration in the Belgian political and social context. These policy instruments concerning economic competitiveness of biofuels will include measures based on the current trend (fiscal advantages) but also innovative measures like for example obligations, or tradable fuel permits (comparison with similar green permits in the electricity sectors). For short term measures a consultation will be carried out with targeted persons in Belgian administrations (SPF Energy, SPF Customs, etc.), taking their recommendations into account (cost of the measures, etc.). Legal instruments will be considered as well, like the need for appropriate standards for high blends and vehicles. The project will produce a roadmap for these measures that will be disseminated to targeted persons and during the workshops (see task on Dissemination). Task 4 Impact on Belgian level (continue) 4.1 System analysis tool (continue) The objective of this subtask is to provide the tool required for overall system analysis and produce data which can be used as input for the macro-economic analysis (task 4.2) and emissions prognoses (task 4.3). 4.2 Macro economic analysis (continue) The objective of this subtask is to analyse the overall economic impact of the implementation pathways and dynamics of the system, and how the additional costs can be carried by the different stakeholders in the biofuel chain (agriculture, fuel industry, end users, government). The economic prognosis is obviously strongly dependent on both fossil and non-fossil fuels market prices which will be investigated through sensitivity analysis. 4.3 Emission prognoses This task will make emission prognoses of the different developed biofuel scenarios for the different considered time horizons (2010, 2020, 2030) and compare them to a baseline fossil scenario. Therefore, VITO’s road emission model has to be extended: - with first and second generation biofuels (new market, including impact of blends);
SSD “Science for a Sustainable Development” - Energy 47
Project SD/EN/03A - Biofuels Sustainable End uSe “BIOSES”
- with a detailed indirect emission module. Task 5 Recommendations and dissemination (continue) 5.1 Recommendations (continue) This task summarises all conclusions of the research from tasks 1 to task 4 targeted at different audiences. Two focus audiences are targeted for the recommendations and dissemination: Belgian policy makers and different biofuel stakeholders (focus on end user groups). The recommendations will be drawn specifically towards these two audiences. The documents will be delivered in two phases: the first set by the first half of 2009, the second set by the end of the project, linked to the workshops that will be organised on the subject. 5.2 Dissemination The dissemination will also focus on the two targets groups. The focal point of the dissemination activities will be a dedicated website. This website will be used as a medium for stakeholder consultations in tasks 1 and 3 and as a medium for dissemination of results. Different workshops will be organised to disseminate BIOSES results. Dissemination of project results will also be envisaged through newsletters, scientific journals and international conferences in the field. Task 6 Coordination (continue) The objective of the coordination task is the management of project activities to guarantee a timely and qualitative delivery of project results as described in the contract.
SSD “Science for a Sustainable Development” - Energy 48
Project SD/EN/03A - Biofuels Sustainable End uSe “BIOSES”
References Bantz S.G. and M.L. Deaton, 2006, Understanding U.S. Biodiesel Industry Growth using System Dynamics Modeling, Systems and Information Engineering Design Symposium, Vol. 28, Issue 28, 156-161. Bram S., De Ruyck J., Lavric D. ‘Using Biomass: a System Perturbation Analysis’, Applied Energy, Vol.86, Issue 4, pp. 194-201, 2009
Bram S., De Ruyck J. ‘Biomassa als energiebron in België’, NIEUWSBRIEF COGEN VLAANDEREN, jaargang 6, nr. 3, pp. 12-15, 2007 Crals E. et al., 2004, Onderzoek naar verhandelbare mobiliteitsrechten: nog te veel vragen en te weinig mogelijkheden, Verkeersspecialist: tijdschrift voor verkeersveiligheid, mobiliteit, leefbaarheid en milieuzorg, Vol. 110, 15-18. De Ruyck J., Jossart J.M., Palmers G., Hamelinck C., Lavric D., Bram S., Novak A., Remacle M.S., Dooms G., van den Broek R. (2006). Liquid biofuels in Belgium in a global bio-energy context. Final report. SPSD II. 137p. Dooms M., Macharis C., Verbeke, A. ism Ecorys, BGDA en COOPARCH-RU., 2004, Masterplan van de Haven van Brussel: Interimrapport 5, Brussel, Haven van Brussel. EC (2003): Directive 2003/30/EC of the European Parliament and of the Council of 8 May 2003 on the promotion of the use of biofuels or other renewable fuels for transport, May 2003. EC (2006): M/394, Mandate to CEN on the revision of EN590 to increase the concentration of FAME and FAEE to 10% v/v. European Commission, November 2006. EC (2008). Proposal for a Directive of the European Parliament and of the Council on the promotion of the use of energy from renewable sources, European Commission COM(2008) 19, 23 January 2008. Eckenrode, R., 1965, Weighting multiple criteria, Management Science, 12(3), 180-192. EEA (2006). How much bioenergy can Europe produce without harming the environment? Report 7/2006. 67p. EurObserv’Er (2007): Biofuels Barometer 2006 - 5.38 MTOE consumed in 2006 in the EU. May 2007. Federal Public Service Finance, 2008, Wegwijs in de fiscaliteit van uw auto. FPS Health (2007). Progress report on the promotion of biofuels in Belgium, June 2007. Belgian Federal Public Service Health, Food Chain Safety and Environment. Govaerts L., Pelkmans L., et al. (2006): Potentieelstudie biobrandstoffen in Vlaanderen, Study performed for the Flemish Administrations of Energy (VEA) and Agriculture (ALT), February 2006.
SSD “Science for a Sustainable Development” - Energy 49
Project SD/EN/03A - Biofuels Sustainable End uSe “BIOSES”
Grosshans R., Kostelnik K.M. and J. Jacobson, 2007, Sustainable Harvest for Food and Fuel, Idaho National Laboratory prepared for the US Department of Energy. JEC (2006): Well-to-wheels analysis of future automotive fuels and powertrains in the European context, version 2b, JRC, Eucar, Concawe, May 2006 Jungbluth, N., Chudacoff, M., Dauriat, A., Dinkel, F., Doka, G., Faist Emmenegger, M., Gnansounou, E., Kljun, N., Spielmann, M., Stettler, C., Sutter, J. 2007: Life Cycle Inventories of Bioenergy. Final report, ESU-services, Uster, CH. Leyva-López, J. and Fernández-González, E., 2003, A new method for Group decision support based on ELECTRE III methodology, European Journal of Operational Research, 148, 14-27. Macharis C., Brans J.P. en Marechal B., 1998, The GDSS Promethee procedure, Journal of Decision Systems, 7, 283-307. Macharis C., 2000, Strategische modellering voor intermodale terminals. Socio-economische evaluatie van de locatie van binnenvaart/weg terminals in Vlaanderen, Ph.D. thesis, Vrije Universiteit Brussel, Brussels. Macharis, C. en B. Boel, 2004, BRUGARWAT: Brussels Garbage by water, Vervoerslogistieke werkdagen, 4 en 5 november, Hoeven, Nederland. Gepubliceerd in Ruijgrok, C.J. en R.H.J. Rodenburg, Bijdragen vervoerslogistieke werkdagen, 229-242. Macharis C., A. Verbeke and K. De Brucker, 2004, The strategic evaluation of new technologies through multi-criteria analysis: the advisors case, in: E. Bekiaris and Y.J. Nakanishi (Eds.), Economic Impacts of Intelligent Transportation Systems. Innovation and case studies, Elsevier, Amsterdam, 439-460. Macharis C., De Witte A., Turcksin L., 2008, The Multi-actor, Multi-criteria analysis (MAMCA) used in the Flemish long term decision making process on mobility and logistics, submitted for Journal of Transport Policy. Meeus T., C. Macharis en M. Dooms, 2004, Inplanting van tweede HST-terminal te Brussel: scenario Brussel-Nationaal moet verder worden onderzocht, De Lloyd. Universiteit en Transport, Editie 05/10/2004. p.5. National Institute for Statistics (NIS), 2007, http://www.statbel.fgov.be. Nijkamp, P., Rietveld, P. & Voogd, H., 1990, Multicriteria Evaluation in Physical Planning, Elsevier Science Publishers, Amsterdam. Pelkmans L., Schoeling O., De Vlieger I., Schrooten L., Jossart J.M., 2008. Introduction of biofuels in Belgium - Scenarios for 2010 - 2020 - 2030. Report for BIOSES task 1, March 2008. Pelkmans L., Wiesenthal T., Govaerts L. (2007): Measures for the promotion of biofuels, booklet in the frame of the European PREMIA project, May 2007. Pruyt E., 2007, Decision-making and dynamically complex multi-dimensional societal issues: combining system dynamics and multiple criteria decision analysis to explore the energy-climate change issue, PhD Thesis, Vrije Universiteit Brussel, Solvay Business School, Brussels.
SSD “Science for a Sustainable Development” - Energy 50

Project SD/EN/03A - Biofuels Sustainable End uSe “BIOSES”
Saaty T., 1989, Group Decision Making and AHP, In: Golden B., Wasil E. and Harker P. (Eds.) The Analytic Hierarchy Process: Applications and Studies, Springer-Verlag, New York, 1989. State of Alaska – Department of Education and Early Development, 1999, Life cycle cost analysis handbook, 28p. Verbeke, A., C. Macharis, M. Dooms en R. S’Jegers, 2004, Economische impactstudie van de uitbreiding van de hubactiviteiten van het koeriersbedrijf DHL op de luchthaven van Zaventem (Brussel Nationaal ; Brussels Airport). EINDRAPPORT, studie in opdracht van de provincie Vlaams Brabant. Victoria Transport Policy Institute, 2007, Transportation Cost and Benefit Analysis – Vehicle Costs, http://www.vtpi.org
SSD “Science for a Sustainable Development” - Energy 51